Improvements in Spoken Query System to Access the Agricultural Commodity Prices and Weather Information in Kannada Language/Dialects
-
Thimmaraja G. Yadava
 und
H.S. Jayanna
und
H.S. Jayanna

Abstract
In this paper, the improvements in the recently developed end to end spoken query system to access the agricultural commodity prices and weather information in Kannada language/dialects is demonstrated. The spoken query system consists of interactive voice response system (IVRS) call flow, automatic speech recognition (ASR) models and agricultural commodity prices, and weather information databases. The task specific speech data used in the earlier spoken query system had a high level of background and other types of noises as it is collected from the farmers of Karnataka state (a state in India that speaks the Kannada language) under uncontrolled environment. The different types of noises present in collected speech data had an adverse effect on the on-line and off-line recognition performances. To improve the recognition accuracy in spoken query system, a noise elimination algorithm is proposed in this work, which is a combination of spectral subtraction with voice activity detection (SS-VAD) and minimum mean square error spectrum power estimator based on zero crossing (MMSE-SPZC). The noise elimination algorithm is added in the system before the feature extraction part. In addition to this, alternate acoustic models are developed using subspace Gaussian mixture models (SGMM) and deep neural network (DNN). The experimental results show that these modeling techniques are more powerful than the conventional Gaussian mixture model (GMM) – hidden Markov model (HMM), which was used as a modeling technique for the development of ASR models to design earlier spoken query systems. The fusion of noise elimination technique and SGMM/DNN-based modeling gives a better relative improvement of 7% accuracy compared to the earlier GMM-HMM-based ASR system. The least word error rate (WER) acoustic models could be used in spoken query system. The on-line speech recognition accuracy testing of developed spoken query system (with the help of Karnataka farmers) is also presented in this work.
1 Introduction
Automatic speech recognition (ASR) system using an interactive voice response system (IVRS) is one of the important applications of speech processing [27]. The amalgamation of IVRS and ASR systems are called spoken query systems, which are used to decode the user input [10, 33], and the needed information is spread by the system. The recent advancement in the speech recognition domain is that the touch tones used in the earlier ASR systems have been completely removed. A spoken query system has been developed recently to access the agricultural commodity prices and weather information in Kannada language/dialects [32]. This work is an ongoing sponsored project by the Department of Electronics and Information Technology (DeitY), Government of India, targeted to develop user-friendly spoken query system to access the commodity prices and weather information by addressing the needs of Karnataka farmers. The developed spoken query system gives an option to the user/farmer to make his own query about any agricultural commodity prices and weather information over mobile/landline telephone network. The query, which is uttered by the user/farmer, is recorded, the price/weather information in the database is checked through ASR models, and the on-time price/weather information of a particular commodity in a desired district is communicated through pre-recorded messages (voice prompts). The earlier spoken query system [32] is developed using the Gaussian mixture model (GMM)-based hidden Markov model (HMM). In this work, we demonstrate the improvements to the earlier spoken query system. A noise elimination algorithm is proposed, which is used to reduce the noise in the speech data collected under an uncontrolled environment. We have also investigated the two different acoustic modeling approaches reported latterly subjected to the spoken query system. The training and testing speech data used in Ref. [32] for the development of ASR models was collected from the farmers across the different dialect regions of Karnataka (a state in India speaks Kannada language) under real-time environment. Therefore, the collected speech data was adulterated by different types of background noises, which includes babble noise, background noise, car noise, vocal noise, and horn noise, etc., while the user/farmer making a query to the system also happens to have a high level of background noise. This totally decreases the entire spoken query system performance. To overcome this problem, we have introduced the noise elimination algorithm before the feature extraction part. This algorithm eliminates the different types of noises in both training and testing speech data. The removal of background noises leads to a good modeling of phonetic contexts. Therefore, an improvement in the on-line and off-line speech recognition accuracy is achieved compared to the earlier spoken query system.
The noise reduction in degraded speech data is a challenging task [20, 28]. The spectral subtraction (SS) method is commonly used for speech enhancement and is mainly associated with voice activity detection (VAD). To find the active regions of degraded speech signal, VAD is used [29]. The corrupted speech signal is the sum of clean (original) speech signal and additive noise model. The degraded speech signal is processed by considering both low signal to noise ratio (SNR) and high SNR regions. The degraded speech segments are processed frame by frame with a duration of 20 ms. The SS-VAD method was proposed for speech enhancement in Refs. [1, 2, 4, 11, 17]. The effect of noise can be eliminated in degraded speech signal by subtracting the average magnitude spectrum of a noise model from the average magnitude spectrum of a degraded speech signal. The process of enhancing the degraded speech data using various noise elimination techniques is called speech processing [20]. The modified spectral subtraction algorithm was proposed for speech enhancement in Ref. [36]. This algorithm was implemented using VAD and minima-controlled recursive averaging (MCRA) [3]. The experimental results are evaluated under ITU Telecommunication Standardization Sector (ITU-T) G.160 standard and compared with existing methods. In Ref. [18], an improved spectral subtraction algorithm was proposed for musical noise suppression in degraded speech signal. The VAD was used for the detection of voiced regions in degraded speech signal. The experimental results show that there was more suppression of musical noise in degraded speech signal.
Various speech signal magnitude squared spectrum (MSS) estimators were proposed for noise reduction in degraded speech signal [8, 9, 22]. The MSS estimators, namely, minimum mean square error-short time power spectrum (MMSE-SP), minimum mean square error-spectrum power based on zero crossing (MMSE-SPZC), and maximum a posteriori (MAP) are implemented individually. These MSS estimators significantly performed well under many degraded conditions [22]. Ephraim and Malah have proposed a minimum mean square error short time spectral amplitude (MMSE-STSA) estimator for speech enhancement [8]. This method was compared with most widely used algorithms such as spectral subtraction and Wiener filtering. It was observed that the proposed MMSE-STSA method gives better performance than the existing methods. An alternative to the Ephraim and Malah speech enhancement method was proposed under the assumption that the Fourier series expansion of clean (original) speech signal and noise may be modeled independently with zero mean and Gaussian random variables [35]. Rainer Martin proposed an algorithm for speech enhancement using MMSE estimators and super-Gaussian priors [24]. The main advantage of this algorithm was to improve the short time spectral coefficients of corrupted speech signal. This method was compared with Wiener filtering and MMSE-STSA methods [8]. Philipos C. Loizou proposed an algorithm for noise reduction in corrupted speech signal using Bayesian estimators [19]. Three different types of Bayesian estimators are implemented for speech enhancement.
A few years back, two advanced acoustic modeling approaches, namely, subspace Gaussian mixture model (SGMM) and deep neural network (DNN) were described in Refs. [5, 12, 13, 26]. These two techniques provide better speech recognition performance than the GMM-HMM-based approach. The more compact representation of GMM in acoustic space is SGMM. Therefore, the SGMM is best suitable for the moderate training speech data. Furthermore, the DNN consists of multiple hidden layers in multilayer perception to capture the nonlinearities of training set. This gives a good improvement in the modeling of the variations of acoustics leading to a better performance of speech recognition. The main contributions are made in this work are as follows:
Deriving and studying the effectiveness of existing and newly proposed noise elimination techniques for practically deployable ASR system.
The size of the speech database is increased by collecting 50 h of farmers’ speech data (2000 farmers’ speech data were collected in earlier work [32]) from different dialect regions of Karnataka and creating an entire dictionary (including all districts, mandis, and commodities of Karnataka state as per AGMARKNET list) and phoneme set for the Kannada language.
Exploring the efficacy of the SGMM and DNN for moderate ASR vocabulary.
Improving the on-line and off-line (word error rates (WERs) of ASR models) speech recognition accuracy in Kannada spoken query system.
Testing the newly developed spoken query system from farmers of Karnataka under uncontrolled environment.
The remainder of the paper is organized as follows: Section II describes the speech data collection and preparation. The background noise elimination by combining SS-VAD and MMSE-SPZC estimator is described in Section III. The development of ASR models using Kaldi is described in Section IV. The effectiveness of SGMM and DNN is described in detail in Section V. The experimental results and analysis are discussed in Section VI. Section VII gives the conclusions.
2 Farmers’ Speech Data Collection
The basic building block diagram of the different steps involved in the development of the improved Kannada spoken query system is shown in Figure 1.
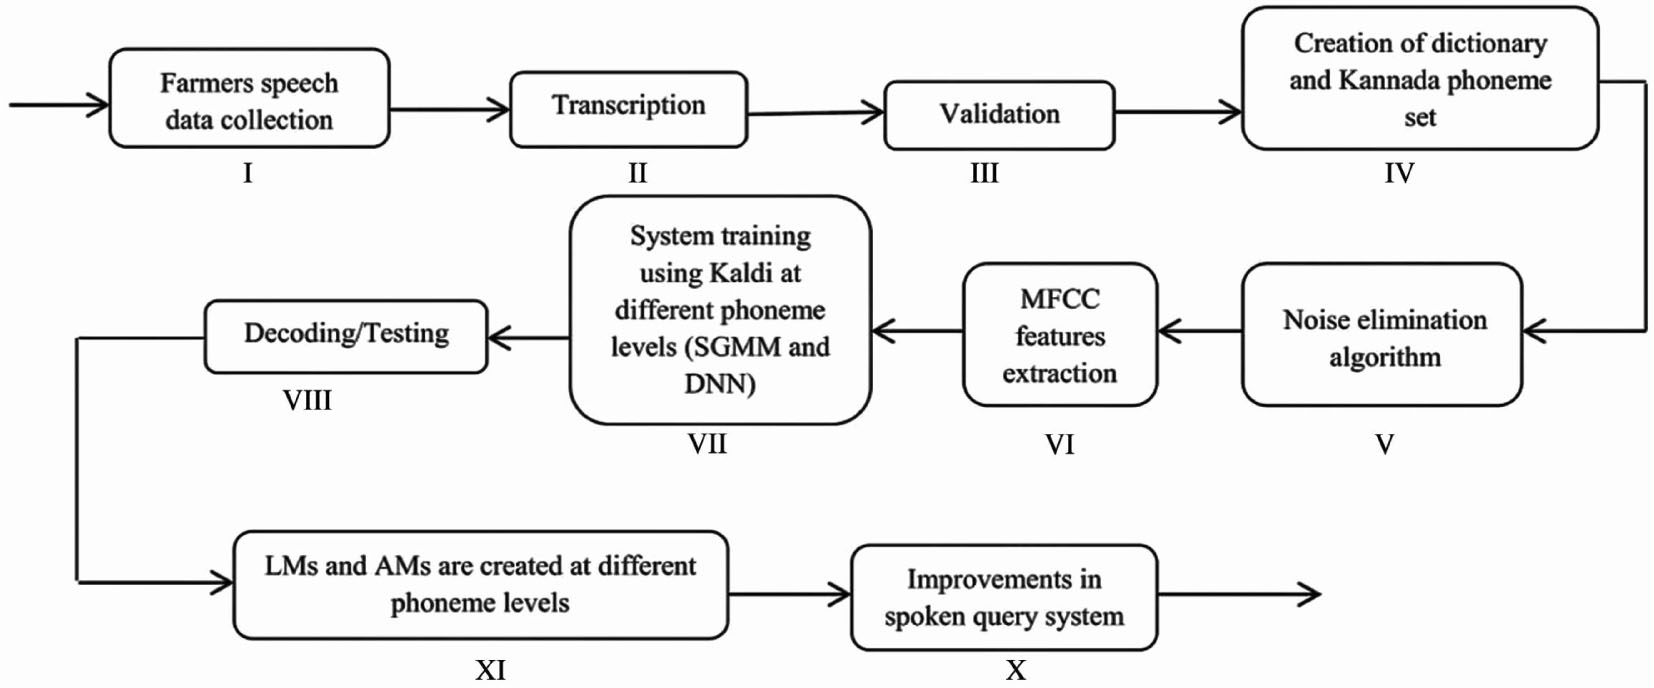
Block Diagram of Different Steps Involved in the Development of Kannada Spoken Query System.
An Asterisk server (Digium, Huntsville, AL, USA) is used in this work, which acts as an interface between the user/farmer, and the IVRS call flow is shown in Figure 2. Along with Asterisk, the asterisk gateway interface (AGI) is an important module for system integration.
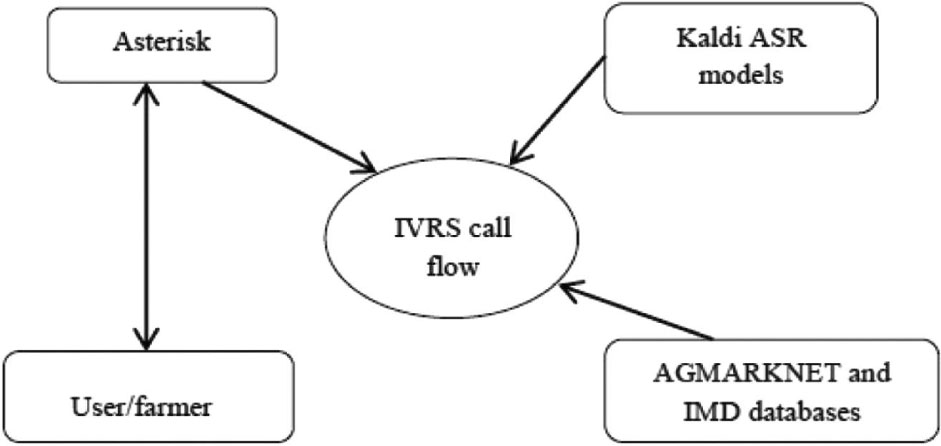
An Integration of ASR System and Asterisk.
For the development of ASR models, the task-specific speech data were collected from 2000 farmers across the different dialect regions of Karnataka under degraded conditions [32]. In addition to this, another 500 farmers’ speech data are collected to increase the training data set. The training and testing speech data set consists of 70,757 and 2180 isolated word utterances, respectively. The training and testing data set includes the names of districts, mandis, and different types of commodities as per the AGMARKNET list under the Karnataka section. The performance estimation of the entire ASR system is done by overall speech data, which includes districts, mandis, and commodities.
3 Combined SS-VAD and MMSE-SPZC Estimator for Speech Enhancement
A noise elimination technique is proposed for speech enhancement, which is a combination of SS-VAD and MMSE-SPZC estimator. Consider a clean (original) speech signal s(n), which is corrupted by background noise d(n) that leads to the corrupted speech signal c(n). It can be written as follows:
the corrupted speech signal is now in time domain, which can be converted into frequency domain by sampling at time t = nTs. The resultant corrupted speech signal in frequency domain can be written as follows:
where Ts is the sampling duration, which can also be written as
The short time Fourier transform of c(n) can be written as
The polar form of the above equation can be shown below.
where {Ck, Sk, Dk} represents the magnitudes, and {θc(k), θs(k), θd(k)} represents the phase of the noisy speech signal, clean (original) speech signal, and noise model, respectively. Assuming that the clean (original) speech signal s(n) and noise model d(n) are uncorrelated not moving random processes, the power spectrum of the corrupted speech signal is the sum of the power spectra of clean speech signal and noise model. It can be written as follows:
Another two assumptions are used in the derivation of the magnitude squared spectrum estimators. The first assumption is that the power spectrums of clean speech signal, corrupted speech signal, and noise model are approximately equal to the magnitude spectrums of clean speech signal, corrupted speech signal, and noise model. Therefore, equation (6) can be written as follows:
The above assumption is usually used in traditional spectral subtraction algorithms. In the remainder of the paper, we will be calling
The probability density functions of
where
The posterior probability density function of clean (original) speech signal magnitude squared spectrum can be computed using the natural Bayes theorem as shown below.
where
and
Note: If
3.1 Spectral Subtraction with VAD
The spectral subtraction method is commonly used for noise cancellation in degraded speech signal. The VAD plays an important role in the detection of only voiced area in the speech signal. In this method, we have considered the clean speech signal with 6-s duration, and it is corrupted by different noises, including additive white Gaussian noise (AWGN), car, factory, and f16 noises. The corrupted speech signal c(n) is converted into segments, and each segment consists of 256 samples with the sampling frequency of 8 kHz. The frame overlapping rate of 50% is considered, and the Hanning window is used in this work.
The basic building block diagram of SS-VAD is given in Figure 3. It consist of several main steps, namely, windowing, fast Fourier transform (FFT) calculation, noise estimation, half wave rectification, residual noise reduction, and calculation of inverse fast Fourier transform (IFFT). The corrupted speech signal c(n) is the combination of clean (original) speech signal s(n) and additive background noise d(n). The corrupted speech signal c(n) is given as an input to the spectral subtractor. The corrupted speech signal is Hanning windowed, and the FFT is calculated. The FFT is one of the most important methods to analyze the speech spectrum. The active regions of speech signal are identified by VAD; hence, the noise is estimated. The linear prediction error (LPE) is mainly associated with energy E of the signal and zero crossing rate (ZCR). The parameter Y can be written as follows:
where Z and L are ZCR and LPE, respectively. The fraction term
where w = 0, 1, 2, … , L − 1 and i = 0, 1, 2, … , M − 1. The term L indicates the length of FFT, and M indicates the number of frames. The half wave rectifier is used in this work to set the spectrums’ negative values to zero if they have negative values. Reduction of residual noise in enhanced speech signal is the final step of spectral subtraction. During the non-speech activities, it is needed to further attenuate the signal. This improves the quality of the enhanced speech signal. Finally, the enhanced speech signal is obtained by calculating its IFFT. The enhanced speech data could be used in speech processing applications, such as speech recognition, speaker identification, speaker verification, and speaker recognition, etc.
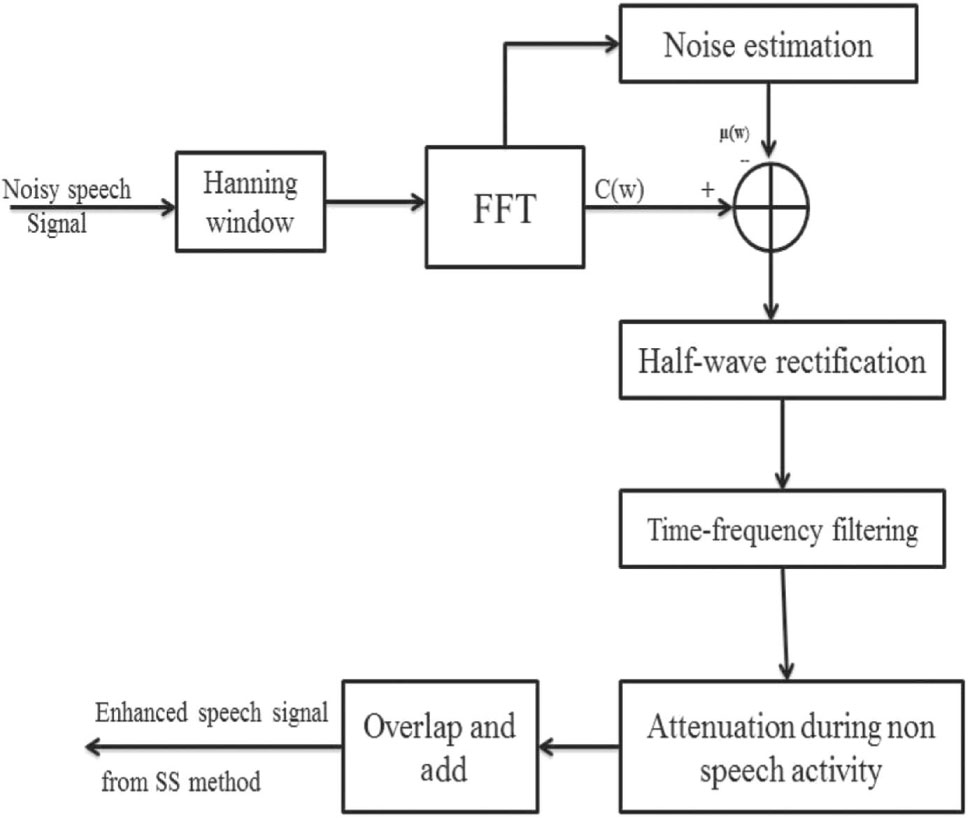
Block Diagram of SS-VAD Method.
3.2 Magnitude Squared Spectrum Estimators
In this work, the following three types of MSS estimators are implemented, and their performance is compared.
Minimum mean square error-short-time power spectrum (MMSE-SP) estimator.
Minimum mean square error-spectrum power estimator based on zero crossing (MMSE-SPZC).
Maximum a posteriori (MAP) estimator.
3.2.1 Minimum Mean Square Error-Short Time Power spectrum (MMSE-SP) Estimator
In Ref. [35], the authors proposed an algorithm for the MMSE-SP estimator. The clean (original) speech signal can be obtained by taking the expected value of the clean speech signal and Fourier transform of the corrupted speech signal C(w). It can be written as follows:
where the terms ξk and γk represents a priori and a posteriori SNRs, respectively.
The implementation steps of this estimator are based on the Rician posterior density function
where
where I0(⋅) is the 0th-order modified Bessel function. The approximate values of the Bessel function are calculated in order to derive magnitude spectrums of the MAP estimator [21].
3.2.2 Minimum Mean Square Error-Spectrum Power Estimator Based on Zero Crossing (MMSE-SPZC)
Another important magnitude squared spectrum estimator is the MMSE-SPZC. Using the work, which was presented in Refs. [1] and [4], the MMSE-SPZC estimator is derived [22]. The initial MMSE estimator is obtained by calculating the mean of the a posteriori density function as shown in equation (7).
where vk can be written as
The estimator gain function can be represented mathematically as follows:
The gain function of the MMSE-SPZC estimator mainly depends on the parameters ξk and γk.
3.2.3 Maximum A Posteriori (MAP) Estimator
The MAP estimator can be represented as follows:
Maximization with respect to
Note that the term
The gain function of the MAP estimator can be written as follows:
Using equation (22), the above MAPs gain function can also be represented as:
It can be observed in the above equation that the gain function of the MAP estimator is binary in nature. In fact, it is almost the same as the binary mask, which is widely used in computational auditory scene analysis (CASA) [34]. The gain function of the MAP estimator is based on an a priori SNR, and the gain function of the binary mask is based on instantaneous SNR, and this makes a difference between them. The MAP estimator uses the hard thresholding algorithm, which can be most widely used in wavelet shrinkage algorithm [6, 7, 16, 23].
3.3 Performance Measures and Analysis
The performance of existing methods and proposed methods is evaluated from the standard measures. They are perceptual evaluation of speech quality (PESQ) and composite measure described below.
3.3.1 PESQ
The PESQ measure is an objective measure and it is strongly recommended by ITU-T for quality of speech assessment [15, 30]. The term PESQ is calculated as the linear sum of the average distortion value Dind and average asymmetrical distortion value Aind. It can be written as follows [25]:
where b0 = 4.5, b1 = −0.1 and b2 = −0.0309.
3.3.2 Composite Measures
Composite measures are the objective measures, which can be used for the performance evaluation. The ratings and description of the different scales are shown in Table 1. The composite measures are derived by multiple linear regression analysis [14]. The multiple linear regression analysis is used to estimate the three important composite measures [15]. They are:
The composite measure for speech signal distortion (s).
The composite measure for background noise distortion (b).
The composite measure for overall speech signal quality (o).
The Description of the Speech Signal Distortion (s), Background Noise Distortion (b), and Overall Speech Quality (o) Scales Rating.
| Ratings | Speech signal scale (s) | Background noise scale (b) | Overall scale (o) |
|---|---|---|---|
| 1 | Much degraded | Very intrusive and conspicuous | Very poor |
| 2 | Fairly degraded and unnatural | Fairly intrusive and conspicuous | Poor |
| 3 | Somewhat natural and degraded | Not intrusive and can be noticeable | Somewhat fair |
| 4 | Fairly natural with some degradation | A little noticeable | Good |
| 5 | Pure natural with no degradation | Not noticeable | Best and excellent |
3.4 Performance Analysis of Existing Methods
The speech was recorded at Texas instruments (TI), transcribed at Massachusetts Institute of Technology (MIT), and verified and prepared for publishing by the National Institute of Standards and Technology (NIST). The TIMIT speech database is used for the conduction of experiments, which was degraded by musical, car, babble, and street noises. For local language speech enhancement, the Kannada speech database is used, and it is also degraded by the same noises, respectively. The performances of the individual and proposed methods are evaluated as follows.
3.4.1 Spectral subtraction With VAD Results and Analysis
The experiments are conducted using the TIMIT and Kannada speech databases. The performance measurement of the SS-VAD method in terms of PESQ for TIMIT and Kannada databases are shown in Tables 2 and 3, respectively. It was observed that there is a less suppression of noise in the degraded speech data, which is degraded by musical noise. The SS-VAD is robust in eliminating the noises such as street, babble, car, and background noises etc., in corrupted speech data and is shown in the tables. The performance evaluation of the SS-VAD method in terms of composite measures is shown in Tables 4 and 5 for the TIMIT and Kannada databases, respectively. It gives poor speech quality of 3.1639 and 2.9039 for a musical noise compared to other types of noises for both databases, respectively. Therefore, it is necessary to eliminate the musical noise in a degraded speech signal to get good speech quality like for the speech signals, which were degraded by car, babble, and street noises.
Performance Measurement of SS-VAD Method in Terms of PESQ for TIMIT Database.
| Method | PESQ measure | Musical | Car | Babble | Street |
|---|---|---|---|---|---|
| Input PESQ | 1.8569 | 2.6816 | 2.3131 | 1.7497 | |
| SS-VAD | Output PESQ | 2.1402 | 3.0823 | 2.8525 | 2.2935 |
| PESQ improvement | 0.2933 | 0.4007 | 0.5394 | 0.5438 |
Performance Measurement of SS-VAD Method in Terms of PESQ for Kannada Database.
| Method | PESQ measure | Musical | Car | Babble | Street |
|---|---|---|---|---|---|
| Input PESQ | 1.8569 | 2.6816 | 2.3131 | 1.7497 | |
| SS-VAD | Output PESQ | 2.1102 | 2.9082 | 2.8625 | 2.2935 |
| PESQ improvement | 0.2633 | 0.4007 | 0.5494 | 0.5438 |
Performance Evaluation of SS-VAD Method Using Composite Measure for TIMIT Database.
| Method | Composite measure | Musical | Car | Babble | Street |
|---|---|---|---|---|---|
| Speech signal (s) | 1.8017 | 3.6399 | 3.5213 | 2.7860 | |
| SS-VAD | Background noise (b) | 2.6670 | 2.2760 | 2.1245 | 1.9125 |
| Overall speech quality (0) | 3.1639 | 3.7759 | 3.4245 | 3.3182 |
Performance Evaluation of SS-VAD Method Using Composite Measure for Kannada Database.
| Method | Composite measure | Musical | Car | Babble | Street |
|---|---|---|---|---|---|
| Speech signal (s) | 1.9017 | 3.1199 | 3.4313 | 2.2460 | |
| SS-VAD | Background noise (b) | 2.2370 | 2.2178 | 2.1245 | 1.9355 |
| Overall speech quality (0) | 2.9039 | 3.6659 | 3.1244 | 3.2112 |
3.4.2 Magnitude Squared Spectrum Estimator Results and Analysis
In this work, three different types of estimators are implemented. The performance measurement of the MMSE-SPZC estimator in terms of PESQ for the TIMIT and Kannada speech databases are shown in Tables 6 and 7, respectively. The tables show that there is much improvement in the PESQ for musical, car, and street noises compared to babble noise. The poor speech quality obtained for babble noise after the performance evaluation of the same method using composite measures for both the databases is shown in Tables 8 and 9. The results show that the performance obtained for the speech data, which was degraded by babble noise, is poor, and it needs to be enhanced.
Performance Measurement of MSS Estimators in Terms of PESQ for TIMIT Database.
| Method | Estimators | PESQ measure | Musical | Car | Babble | Street |
|---|---|---|---|---|---|---|
| Input PESQ | 1.8569 | 2.6816 | 2.3131 | 1.7497 | ||
| MMSE-SP | Output PESQ | 2.4797 | 3.3128 | 2.7043 | 2.3609 | |
| PESQ improvement | 0.6228 | 0.6312 | 0.3912 | 0.6112 | ||
| Input PESQ | 1.8569 | 2.6816 | 2.3131 | 1.7497 | ||
| MSS estimators | MMSE-SPZC | Output PESQ | 2.4997 | 3.3337 | 2.7143 | 2.3809 |
| PESQ improvement | 0.6428 | 0.6521 | 0.4012 | 0.6312 | ||
| Input PESQ | 1.8569 | 2.6816 | 2.3131 | 1.7497 | ||
| MAP | Output PESQ | 2.4683 | 3.2744 | 2.7129 | 2.3618 | |
| PESQ improvement | 0.6114 | 0.5928 | 0.3998 | 0.6121 |
Performance Measurement of MSS Estimators in Terms of PESQ for Kannada Database.
| Method | Estimators | PESQ measure | Musical | Car | Babble | Street |
|---|---|---|---|---|---|---|
| Input PESQ | 1.8569 | 2.6816 | 2.3131 | 1.7497 | ||
| MMSE-SP | Output PESQ | 2.4797 | 3.3128 | 2.7043 | 2.3609 | |
| PESQ improvement | 0.6338 | 0.6113 | 0.4102 | 0.6122 | ||
| Input PESQ | 1.8569 | 2.6816 | 2.3131 | 1.7497 | ||
| MSS estimators | MMSE-SPZC | Output PESQ | 2.4997 | 3.3337 | 2.7143 | 2.3809 |
| PESQ improvement | 0.6431 | 0.6532 | 0.4101 | 0.6112 | ||
| Input PESQ | 1.8569 | 2.6816 | 2.3131 | 1.7497 | ||
| MAP | Output PESQ | 2.4683 | 3.2744 | 2.7129 | 2.3618 | |
| PESQ improvement | 0.6224 | 0.5911 | 0.3998 | 0.6001 |
Performance Evaluation of MSS Estimators Using Composite Measure for TIMIT Database.
| Method | Estimators | Composite measure | Musical | Car | Babble | Street |
|---|---|---|---|---|---|---|
| Speech signal (s) | 3.2536 | 3.8276 | 5.0913 | 3.1147 | ||
| MMSE-SP | Background noise (b) | 2.3256 | 2.4908 | 3.7548 | 2.0818 | |
| Overall speech quality (o) | 3.1002 | 2.9056 | 2.0132 | 2.8925 | ||
| Speech signal (s) | 4.5796 | 3.8336 | 3.9336 | 3.1252 | ||
| MSS estimators | MMSE-SPZC | Background noise (b) | 3.4031 | 2.5671 | 2.1289 | 2.1211 |
| Overall speech quality (o) | 4.4565 | 4.2678 | 3.1025 | 4.1815 | ||
| Speech signal (s) | 3.7859 | 3.6922 | 3.1563 | 2.9798 | ||
| MAP | Background noise (b) | 2.8552 | 2.5627 | 2.5598 | 2.1461 | |
| Overall speech quality (o) | 3.6478 | 3.4123 | 2.8891 | 3.0814 |
Performance Evaluation of MSS Estimators Using Composite Measure for Kannada Database.
| Method | Estimators | Composite measure | Musical | Car | Babble | Street |
|---|---|---|---|---|---|---|
| Speech signal (s) | 3.2536 | 3.8276 | 5.0913 | 3.1147 | ||
| MMSE-SP | Background noise (b) | 2.3256 | 2.4908 | 3.7548 | 2.0818 | |
| Overall speech quality (o) | 3.2000 | 3.1066 | 2.0132 | 2.8925 | ||
| Speech signal (s) | 4.5796 | 3.8336 | 3.9336 | 3.1252 | ||
| MSS estimators | MMSE-SPZC | Background noise (b) | 3.4031 | 2.5671 | 2.1289 | 2.1211 |
| Overall speech quality (o) | 4.5565 | 4.3679 | 3.2021 | 4.2812 | ||
| Speech signal (s) | 3.7859 | 3.6922 | 3.1563 | 2.9798 | ||
| MAP | Background noise (b) | 2.8552 | 2.5627 | 2.5598 | 2.1461 | |
| Overall speech quality (o) | 3.7478 | 3.5123 | 2.9099 | 3.1012 |
3.5 Proposed Combined SS-VAD and MMSE-SPZC Method
The SS-VAD method suppresses the various types of noises reasonably such as babble noise, street noise, car noise, vocal noise, and background noise, etc. The main drawback of the SS-VAD is that the suppression of musical noise in degraded speech signal is much less [2, 4, 20]. The MMSE-SPZC is a robust method to suppress the musical noise given the better results for car, street, and white noises compared to babble noise [22]. Therefore, to overcome the problem of suppression of musical and babble noises, a method is proposed. The proposed method is a combination of the above two methods, which suppresses the different types of noises including musical and babble noise reasonably under uncontrolled environment. The flowchart of the proposed method is shown in Figure 4. The output of the SS-VAD is a little noisier, and musical noise is not suppressed as well. Therefore, the output of the SS-VAD is passed through the MMSE-SPZC estimator.
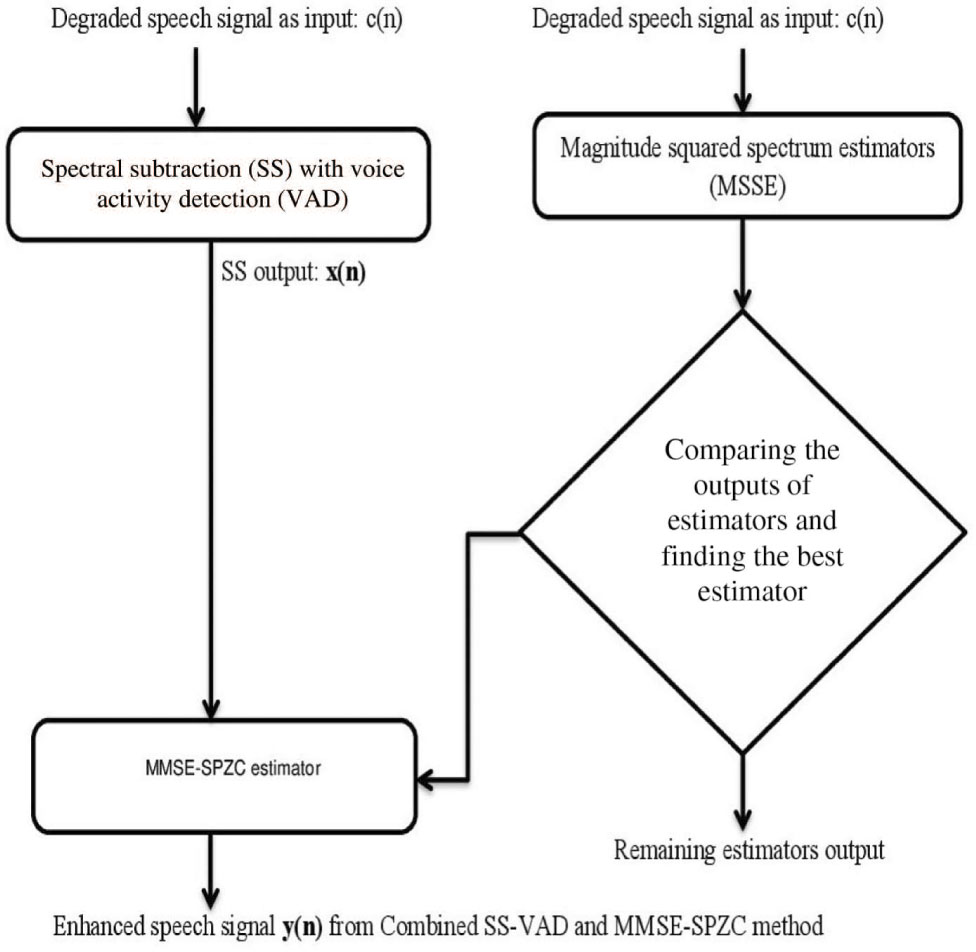
Flow Chart of Combined SS-VAD and MMSE-SPZC Method.
The MMSE-SPZC estimator reduces the noise in the SS-VAD output by considering the low SNR as well as the high SNR regions with high intelligibility. The enhanced speech signal from the SS-VAD is obtained by subtracting the average magnitude spectrum of noise estimated from the average magnitude spectrum of the speech signal. It can be written as follows:
where w = 0, 1, 2, … , L − 1 and i = 0, 1, 2, … , M − 1. The MMSE-SPZC estimator is derived once again for the SS-VAD output. The output x(n) is passed through the MMSE-SPZC estimator. Hence, the MMSE-SPZC estimator is derived by considering the mean of the a posteriori density function of the SS-VAD output.
where Xk and Yk are the a posteriori density functions of the SS-VAD output and the combined proposed SS-VAD and MMSE-SPZC estimator output, respectively. The term vk is shown in equation (30).
The gain function of the combined SS-VAD and MMSE-SPZC estimator can be written as follows:
The gain function mainly depends on two parameters such as ξk and γk.
The description of the performance measurement of the proposed method in terms of the PESQ for both the databases is shown in Tables 10 and 11. From the tables, it was observed that there is much suppression in the babble and musical noises with PESQ improvements of 0.6933, 0.7781 and 0.7112, 0.7314 for the TIMIT and Kannada databases, respectively, by the proposed method compared to the individual methods. The speech quality is much improved after the performance evaluation of the proposed method using composite measures for both the databases and is shown in Tables 12 and 13. From the experimental results and analysis, it can be inferred that the combined SS-VAD and MMSE-SPZC method reduces the noise in the degraded speech data significantly compared to the individual methods. The enhanced speech data obtained from the proposed method is more audible and has a higher quality than the individual methods. Therefore, the proposed method can be used for the Kannada speech database enhancement as the majority of the collected speech data is degraded by babble, musical, and street noises as it is collected under an uncontrolled environment. When the proposed noise elimination technique is applied to both training and testing speech data sets, it is found to significantly improve the performance (off-line and on-line) of the spoken query system.
Performance Measurement of Combined SS-VAD and MMSE-SPZC Estimator in Terms of PESQ for TIMIT Database.
| Method | Estimators | PESQ measure | Musical | Car | Babble | Street |
|---|---|---|---|---|---|---|
| Input PESQ | 1.8569 | 2.6816 | 2.3131 | 1.7497 | ||
| Proposed method | SS-VAD and MMSE-SPZC | Output PESQ | 2.5502 | 3.3440 | 3.0912 | 2.4601 |
| PESQ improvement | 0.6933 | 0.6624 | 0.7781 | 0.7204 |
Performance Measurement of Combined SS-VAD and MMSE-SPZC Estimator in Terms of PESQ for Kannada Database.
| Method | Estimators | PESQ measure | Musical | Car | Babble | Street |
|---|---|---|---|---|---|---|
| Input PESQ | 1.8569 | 2.6816 | 2.3131 | 1.7497 | ||
| Proposed method | SS-VAD and MMSE-SPZC | Output PESQ | 2.5502 | 3.3440 | 3.0912 | 2.4601 |
| PESQ improvement | 0.7112 | 0.6677 | 0.7912 | 0.7314 |
Performance Evaluation of Combined SS-VAD and MMSE-SPZC Method Using Composite Measure for TIMIT Database.
| Method | Composite measure | Musical | Car | Babble | Street |
|---|---|---|---|---|---|
| Speech signal (s) | 3.1204 | 3.6319 | 3.5689 | 2.6052 | |
| Proposed method | Background noise (b) | 2.6920 | 2.4780 | 2.8569 | 1.9098 |
| Overall speech quality (0) | 4.4409 | 4.3002 | 4.2956 | 4.3141 |
Performance Evaluation of Combined SS-VAD and MMSE-SPZC Method Using Composite Measure for Kannada Database.
| Method | Composite measure | Musical | Car | Babble | Street |
|---|---|---|---|---|---|
| Speech signal (s) | 3.1204 | 3.6319 | 3.5689 | 2.6052 | |
| Proposed method | Background noise (b) | 2.6920 | 2.4780 | 2.8569 | 1.9098 |
| Overall speech quality (0) | 4.5111 | 4.2911 | 4.3123 | 4.4112 |
4 Creation of ASR Models Using Kaldi for Noisy and Enhanced Speech Data
The ASR models (language and acoustic models) play an important role in the development of robust speech recognition systems. The language models (LMs) and acoustic models (AMs) were developed in Ref. [32] for the noisy speech data collected in the field. Therefore, the ASR models are developed in this work for the noisy and enhanced speech data. The development of the ASR models includes several steps. They are as follows:
Transcription and validation of enhanced speech data.
Development of lexicon (dictionary) and Kannada phoneme set.
MFCC feature extraction.
4.1 Transcription and Validation
Transcription is a process of converting speech file content into its word format and its equivalent, which is also called as a word-level transcription. The schematic representation of various speech wave files and those equivalent transcriptions are shown in Figure 5.
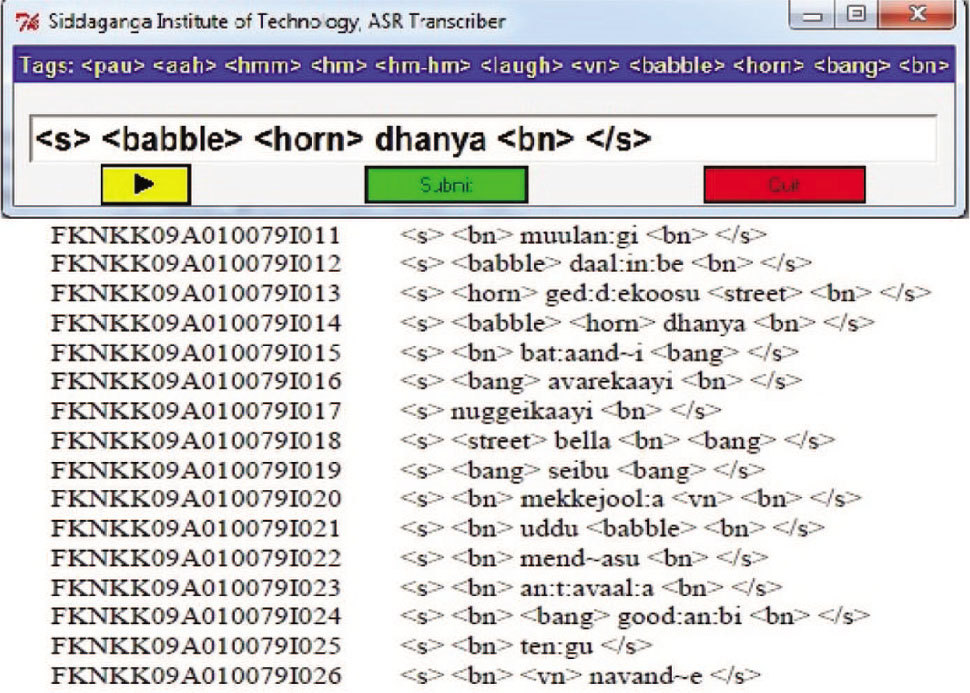
Transcription of Speech Data.
It was observed in the figure that the tags <s> and </s> indicate the starting and ending of speech sentence/utterance. The different types of tags are used in the transcription. They are as follows:
<music>: Used only when the speech file is degraded by music noise.
<babble>: Used only when the speech file is degraded by babble noise.
<bn>: Used only when the speech file is degraded by background noise.
<street>: Used only when the speech file is degraded by street noise.
If the transcription of a particular speech datum is done wrongly, then, it will be validated using the validation tool shown in Figure 6. The speech file dhanya is degraded by background noise, babble noise, horn noise, and musical noise, but unknowingly, the transcriber transcribed the same speech file into <s> <babble> <horn> dhanya <bn> </s> only. While cross checking the transcribed speech datum, the validator listened to that speech sound again and found that it is degraded by musical noise also. Therefore, it could be validated as <s> <babble> <horn> dhanya <bn> <music> </s> and is shown in Figure 6.
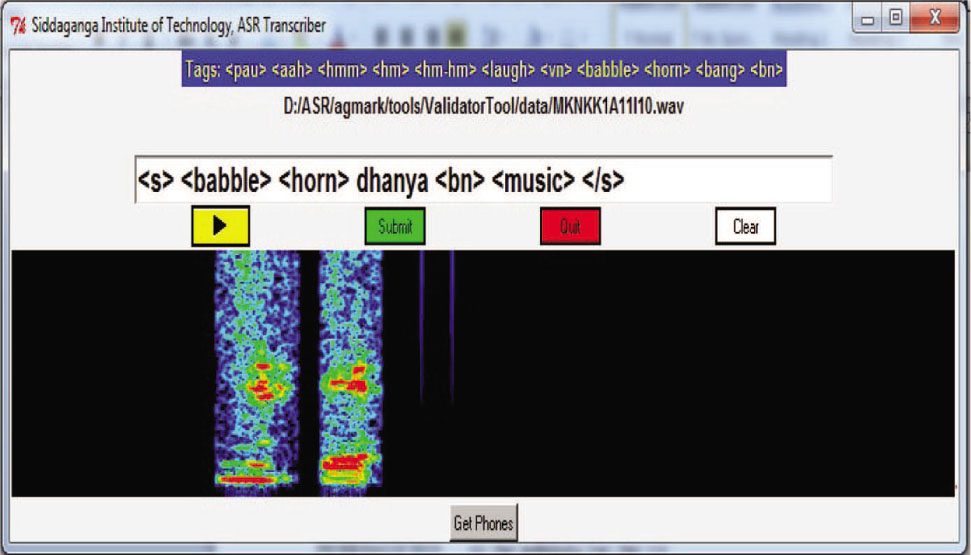
Validation Tool to Validate the Transcribed Speech Data.
4.2 Kannada Phoneme Set and Corresponding Dictionary Creation
The Karnataka is one of the states in India. There are 60 million people living in Karnataka who fluently speak the Kannada language. The Kannada language has 49 phonetic symbols, and it is one of the most usable Dravidian languages. The description of the Kannada phoneme set, Indian language speech sound label 12 (ILSL12) set used for Kannada phonemes, and its corresponding dictionary are shown in Tables 14–16, respectively.
The Labels Used from the Indic Language Transliteration Tool (IT3 to UTF-8) for Kannada Phonemes.
| Label set using IT3: UTF-8 | Corresponding Kannada phonemes | ||||||
|---|---|---|---|---|---|---|---|
| a | oo | t:h | ph | ಅ | ಓ | ಠ | ಫ |
| aa | au | d | b | ಆ | ಔ | ಡ | ಬ |
| i | k | d:h | bh | ಇ | ಕ | ಢ | ಭ |
| ii | kh | nd | m | ಈ | ಖ | ಣ | ಮ |
| u | g | t | y | ಉ | ಗ | ತ | ಯ |
| uu | gh | th | r | ಊ | ಘ | ಥ | ರ |
| e | c | d | l | ಎ | ಚ | ದ | ಲ |
| ee | ch | dh | v | ಏ | ಛ | ಧ | ವ |
| ai | j | n | sh | ಐ | ಜ | ನ | ಶ |
| o | t: | p | s | ಒ | ಟ | ಪ | ಸ |
The Labels Used from ILSL12 for Kannada Phonemes.
| Label set using ILSL12 | Corresponding Kannada phonemes | ||||||
|---|---|---|---|---|---|---|---|
| a | oo | txh | ph | ಅ | ಓ | ಠ | ಫ |
| aa | au | dx | b | ಆ | ಔ | ಡ | ಬ |
| i | k | dxh | bh | ಇ | ಕ | ಢ | ಭ |
| ii | kh | nx | m | ಈ | ಖ | ಣ | ಮ |
| u | g | t | y | ಉ | ಗ | ತ | ಯ |
| uu | gh | th | r | ಊ | ಘ | ಥ | ರ |
| e | c | d | l | ಎ | ಚ | ದ | ಲ |
| ee | ch | dh | w | ಏ | ಛ | ಧ | ವ |
| ai | j | n | sh | ಐ | ಜ | ನ | ಶ |
| o | tx | p | s | ಒ | ಟ | ಪ | ಸ |
Dictionary/Lexicon for Some of Districts, Mandis, and Commodities Enlisted in AGMARKNET.
| Label set using IT3-UTF:8 | Label set using from ILSL12 |
|---|---|
| daavand agere | d aa v a nx a g e r e |
| tumakuuru | t u m a k uu r u |
| chitradurga | c i t r a d u r g a |
| ben:gal:uuru | b e ng g a lx uu r u |
| chaamaraajanagara | c aa m a r aa j a n a g a r a |
| shivamogga | sh i v a m o gg a |
| haaveiri | h aa v ei r i |
| gadaga | g a d a g a |
| gulbarga | g u l b a r g a |
| hubbal:l:i | h u bb a llx i |
| dhaarawaad:a | d aa r a v aa dx a |
| bel:agaavi | b e lx a g aa v i |
| raamanagara | r aa m a n a g a r a |
| koolaara | k oo l aa r a |
| koppal:a | k o pp a lx a |
| raayacuuru | r aa y a c uu r u |
| chin:taamand i | c i n t aa m a nx i |
| tiirthahal:l:i | t ii r th a h llx i |
| harihara | h a r i h a r a |
| channagiri | c a nn a g i r i |
| honnaal:i | h o nn aa lx i |
| bhadraavati | bh a d r aa v a t i |
| theerthahal:l:i | t ii r th a h a llx i |
| kund igal | k u nx i g a l |
| tipat:uuru | t i p a tx uu r u |
| gubbi | g u bb i |
| korat:agere | k o r a tx a g e r e |
| akki | a kk i |
| raagi | r aa g i |
| jool:a | j oo lx a |
| mekkejool:a | m e kk e j oo lx a |
| bhatta | bh a tt a |
| goodhi | g oo dh i |
| iirul:l:i | ii r u llx i |
| ond amend asinakaayi | o nx a m e nx a s i n a k aa y i |
4.3 MFCC Feature Extraction
Once the noise elimination algorithm is applied on the train and test data set, the next step is to extract the MFCC features for noisy and enhanced speech data. The basic building block diagram of the MFCC feature extraction is shown in Figure 7.
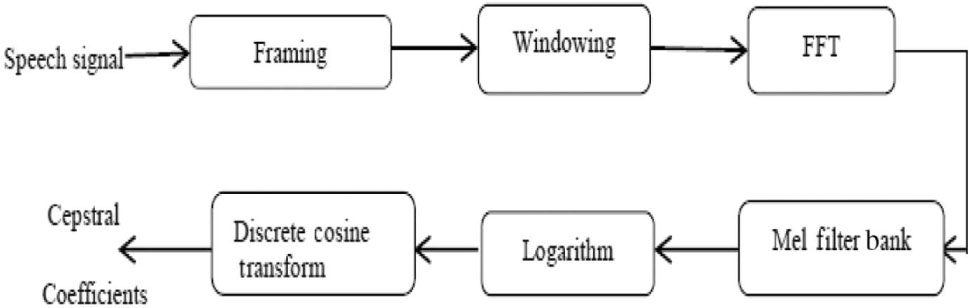
Block Diagram of MFCC Feature Extraction.
The parameters used for the MFCC feature extraction are as follows:
Window used: Hamming window.
Window length: 20 ms.
Pre-emphasis factor: 0.97.
MFCC coefficients: 13 dimensional.
Filter bank used: 21-channel filter bank.
5 SGMM and DNN
The SGMM and DNN ASR modeling techniques are described in this section.
5.1 SGMM
The ASR systems based on the GMM-HMM structure usually involves completely training the individual GMM in every HMM state. A new modeling technique that is introduced to the speech recognition domain is called the SGMM [26]. The dedicated multivariate Gaussian mixtures are used for the state level modeling in conventional GMM-HMM acoustic modeling technique. Therefore, no parameters are distributed between the states. The states are represented by Gaussian mixtures, and these parameters distribute a usual structure between the states in the SGMM modeling technique. The SGMM consists of the GMM inside every context-dependent state; the vector Ii ∈ Vr in every state is specified instead of defining the parameters directly.
An elementary form of the SGMM can be described by the equations below:
where y ∈ RD is a feature vector and i ∈ {1 … I} is the context-dependent state of speech signal. The speech state j’s model is a GMM with L Gaussians (L is between 200 and 2000), with matrix of covariances Σk, which are distributed amidst states, mixture weights wik, and means μik. The derivation of the μikwik parameters are done using Ii together with Mk, wk and Σk. The detailed description of parameterization of the SGMM and its impact is given in Ref. [31]. The ASR models are developed using this modeling technique for the Kannada speech database, and the least word error rate (WER) models could be used in the spoken query system.
5.2 DNN
The GMM-HMM-based acoustic modeling approach is inefficient to model the speech data that lie on or near the data space. The major drawbacks of the GMM-HMM-based acoustic modeling approach are discussed in Ref. [13]. The artificial neural networks (ANN) are capable of modeling the speech data that lie on or near the data space. It is found to be infeasible to train an ANN using the maximum number of hidden layers with back propagation algorithm for a large amount of speech data. An ANN with a single hidden layer failed to give good improvements over the GMM-HMM-based acoustic modeling technique. Both the aforementioned limitations were overcome with the developments in the past few years. Various approaches are available now to train the different neural nets with a maximum number of hidden layers.
The DNN consists of the maximum number of input hidden layers and output layers to model the speech data to build the ASR systems. The posterior probabilities of the tied states are modeled by training the DNN. This yielded a better performance in recognition compared to the conventional GMM-HMM acoustic modeling approach. The stacking layers of the restricted Boltzmann machine are used to create the DNN. The restricted Boltzmann machine is a undirected model and is shown in Figure 8.
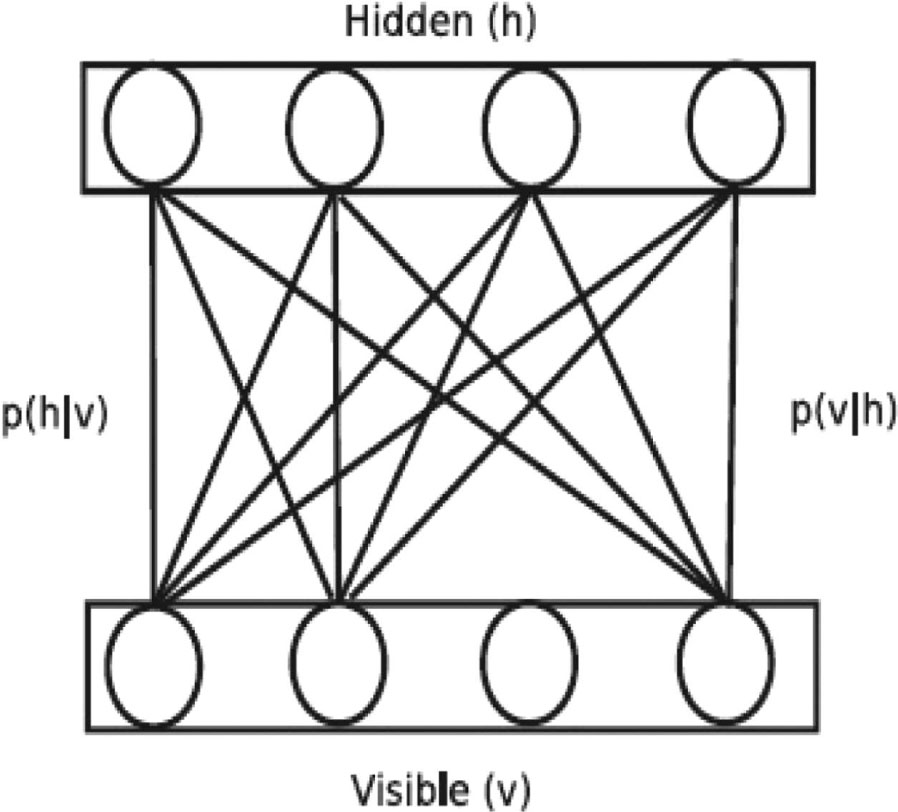
Block Diagram of Restricted Boltzmann Machine.
The model uses the single parameter set (W) to state the joint probability variables vector (v) and hidden variables (h) through an energy E and can be written as follows:
where Z is a function of partition, which can be written as
where v′ and h′ are the extra variables used for the summation over the ranges of v and h. The unsupervised technique is described in detail in Ref. [12] for modeling the connection weights in deep belief networks that is approximately equal to training the next pair of restricted Boltzmann machine layers. The schematic representation of the context-dependent DNN-HMM hybrid architecture is shown in Figure 9. The modeling of tied states (senones) is done by context-dependent DNN-HMM. The MFCC features are given as input to the DNN input layer, and the output of the DNN is used with the HMM, which models the sequential property of the speech.
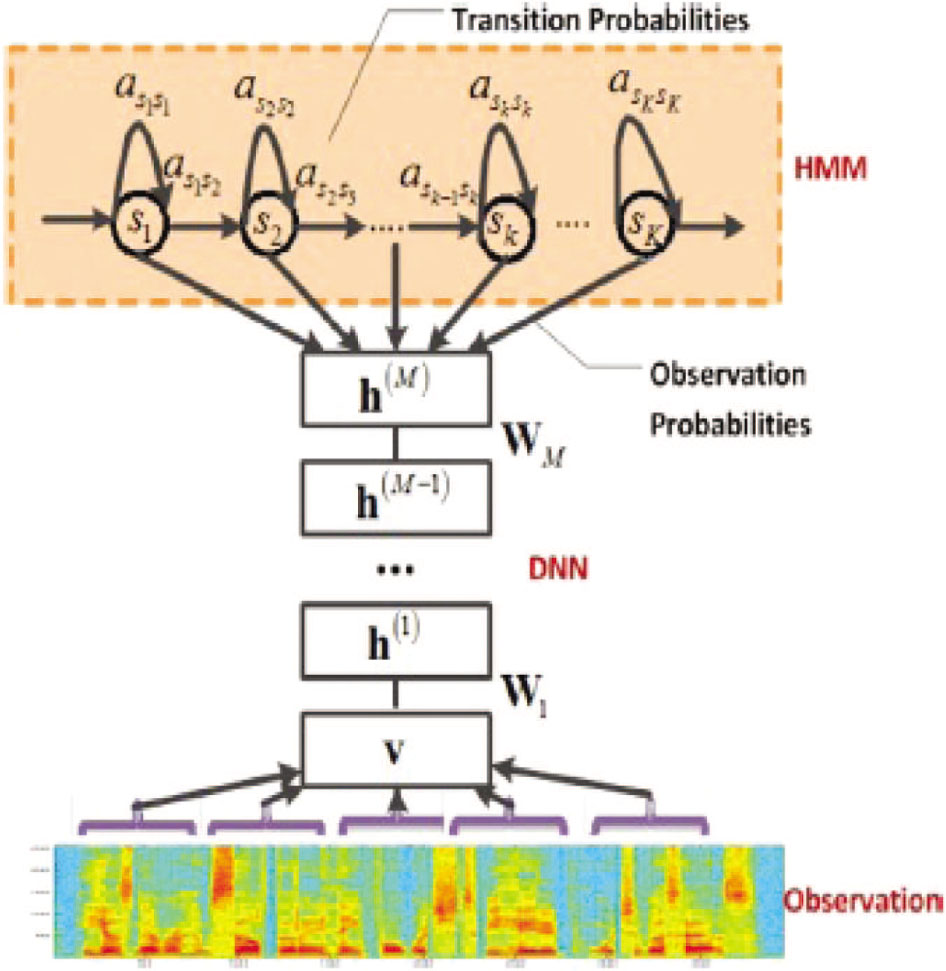
Block Diagram of Hybrid DNN and HMM.
6 Experimental Results and Analysis
The system training and testing using Kaldi is done in two phases, one for noisy speech data and another for enhanced speech data. The 90% and 10% of the validated speech data is used for training and testing, respectively. The number of speech files used for system training and testing is shown in Table 17.
The Speech Files Used for System Training and Testing.
| Kannada speech data | Number of train files | Number of test files |
|---|---|---|
| Overall noisy speech data | 68523 | 2180 |
| Overall enhanced speech data | 67234 | 2180 |
The LMs and AMs are developed for 50 h of speech data. A total of 70,757 isolated speech utterances are used for overall noisy speech data training and testing. In these, 68,523 utterances are used for system training, and 2180 utterances are used for testing to build ASR models for overall noisy speech data. Likewise, 69,268 utterances are used for overall enhanced speech data training and testing using Kaldi. In those, 67,234 utterances used for system training and 2180 utterances are used for testing to build the ASR models for the overall enhanced speech data shown in Table 17. In this work, 62 non-silence phones, nine silence phones are used, and “sil” is used as the optional silence phone. The LMs and AMs are created at different phoneme levels and are as follows:
Monophone training and decoding.
Triphone1: Deltas + Delta-Deltas training and decoding.
Triphone2: linguistic data analysis (LDA) + maximum likelihood linear transform (MLLT) training and decoding.
Triphone3: LDA + MLLT + speaker adaptive training (SAT) and decoding.
SGMM training and decoding.
DNN hybrid training and decoding.
The 2000 senons and 4, 8, and 16 Gaussians mixtures are used in this work to build the ASR models at monophone, triphone1, triphone2, and triphone3 levels. The recently introduced two modeling techniques, such as the SGMM DNN, are used to build the ASR models. The off-line speech recognition performance is measured by word error rate (WER). Table 18 shows the description of WERs at different phoneme levels for overall noisy speech data (combined districts, mandis, and commodities). The WERs of 12.78% and 11.82% are achieved for the SGMM and hybrid DNN training and decoding, respectively, for overall noisy speech data.
The Description of WERs at Different Phoneme Levels for Overall Noisy Speech Data, Which Includes Districts, Mandis, and Commodities.
| Phoneme level | WER 1 | WER 2 | WER 3 | WER 4 | WER 5 | WER 6 |
|---|---|---|---|---|---|---|
| mono | 31.61 | 31.63 | 31.88 | 31.73 | 31.62 | 31.63 |
| tri1_2000_8000 | 16.15 | 16.16 | 16.18 | 16.21 | 16.23 | 16.19 |
| tri1_2000_16000 | 14.95 | 14.99 | 14.98 | 14.98 | 15.01 | 15.11 |
| tri1_2000_32000 | 14.63 | 14.71 | 14.78 | 14.69 | 14.71 | 14.77 |
| tri2 | 13.35 | 13.36 | 13.39 | 13.39 | 13.37 | 13.41 |
| tri2_2000_8000 | 15.14 | 15.18 | 15.20 | 15.19 | 15.21 | 15.13 |
| tri2_2000_16000 | 13.85 | 13.89 | 13.88 | 13.90 | 13.87 | 13.86 |
| tri2_2000_32000 | 13.12 | 13.19 | 13.20 | 13.11 | 13.09 | 13.21 |
| tri3_2000_8000 | 14.91 | 14.90 | 14.92 | 14.97 | 14.96 | 14.95 |
| tri3_2000_16000 | 13.78 | 13.76 | 13.76 | 13.71 | 13.79 | 13.78 |
| tri3_2000_32000 | 13.17 | 13.20 | 13.21 | 13.23 | 13.29 | 13.30 |
| Sgmm | 12.98 | 12.99 | 12.86 | 12.78 | 12.87 | 12.79 |
| tri4_nnet_t2a | 11.88 | 11.89 | 11.89 | 11.86 | 11.88 | 11.82 |
The WERs of 11.77% and 10.67% are obtained for the overall enhanced speech data using the SGMM training and decoding and hybrid DNN training and decoding, respectively, as shown in Table 19.
The Description of WERs at Different Phoneme Levels for Overall Enhanced Speech Data, Which Includes Districts, Mandis, and Commodities.
| Phoneme level | WER 1 | WER 2 | WER 3 | WER 4 | WER 5 | WER 6 |
|---|---|---|---|---|---|---|
| mono | 30.55 | 30.57 | 30.58 | 30.55 | 30.56 | 30.59 |
| tri1_2000_8000 | 15.52 | 15.50 | 15.58 | 115.60 | 15.61 | 15.50 |
| tri1_2000_16000 | 13.90 | 13.89 | 13.92 | 13.94 | 13.99 | 13.91 |
| tri1_2000_32000 | 13.48 | 13.50 | 13.48 | 13.49 | 13.51 | 13.52 |
| tri2 | 12.55 | 12.52 | 12.53 | 12.55 | 12.58 | 12.54 |
| tri2_2000_8000 | 14.79 | 14.77 | 14.78 | 14.80 | 14.81 | 14.79 |
| tri2_2000_16000 | 12.93 | 12.91 | 12.94 | 12.99 | 13.00 | 13.01 |
| tri2_2000_32000 | 12.29 | 12.30 | 12.31 | 12.30 | 12.34 | 12.37 |
| tri3_2000_8000 | 13.99 | 13.98 | 14.00 | 14.01 | 14.04 | 13.97 |
| tri3_2000_16000 | 12.61 | 12.60 | 12.63 | 12.65 | 12.68 | 12.62 |
| tri3_2000_32000 | 12.01 | 12.00 | 12.09 | 12.05 | 12.03 | 12.04 |
| Sgmm | 11.78 | 11.79 | 11.77 | 11.80 | 11.81 | 11.80 |
| tri4_nnet_t2a | 10.67 | 19.69 | 10.70 | 10.70 | 10.71 | 10.73 |
6.1 Call Flow Structure of Spoken Query System
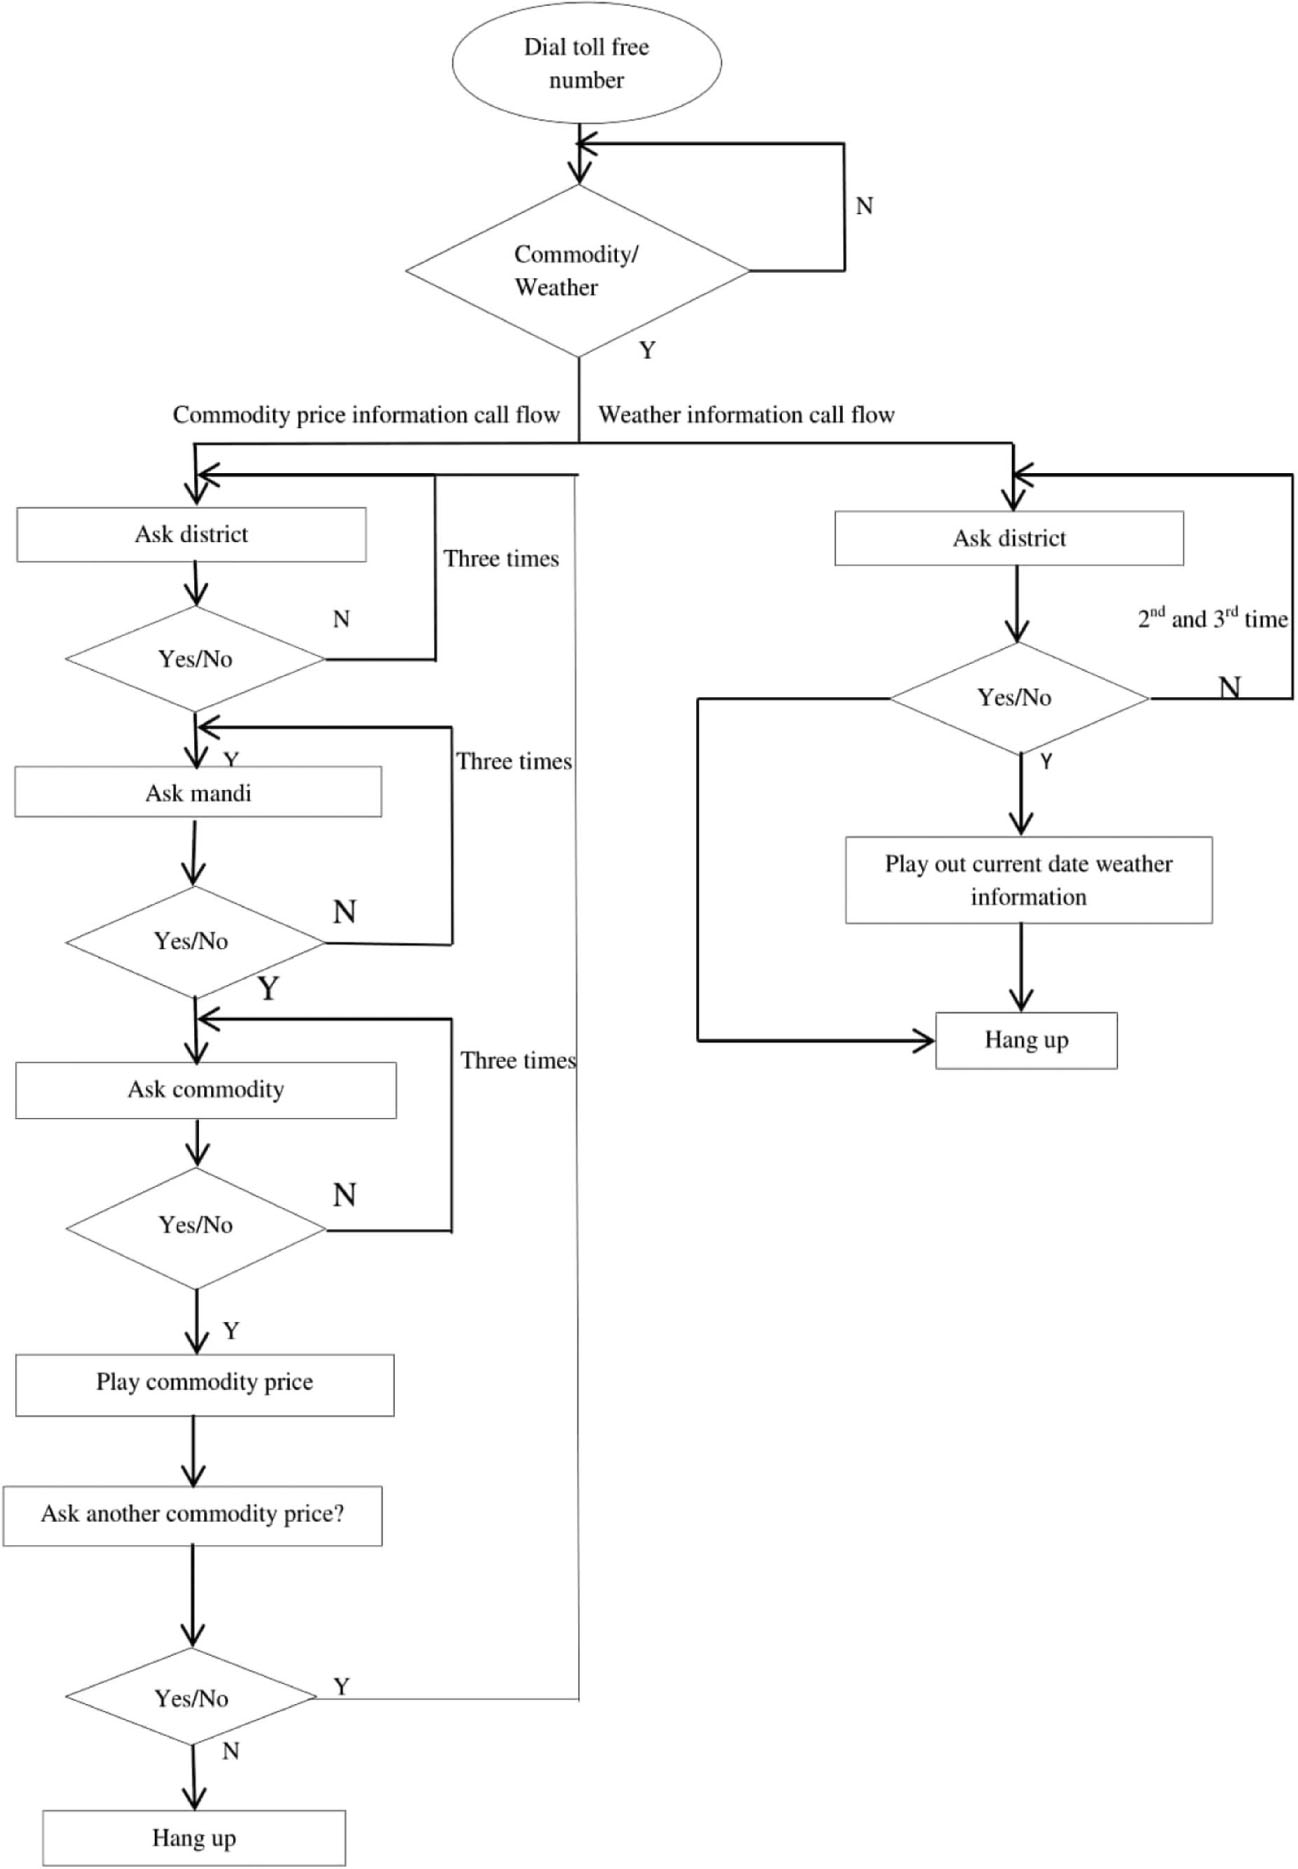
The ASR models were developed in the earlier work [32] at monophone, triphone1, and triphone2 levels with 600 senons and 4, 8, and 16 Gaussian mixtures. The achieved least WERs are 10.05%, 11.90%, 18.40%, and 17.28% for districts, mandis, commodities, and overall speech data, respectively. This leads to the less recognition of commodities and mandis due to the high WERs. To overcome this problem, another 500 farmers’ speech data are collected, the training data set is increased, and the noise elimination algorithm on both training and testing data set to improve the accuracy of the ASR models in this work is applied. In the earlier work, separate spoken query systems were developed to access the real-time agricultural commodity prices and weather information in the Kannada language [32]. In this work, the two call flow structures have been integrated together and made as a single call flow to overcome the complexity of the dialing multiple call flows. Therefore, the user/farmer can access both information in a single call flow by dialing a toll-free number. The earlier call flow structure of spoken query systems for agricultural commodity prices and weather information access are shown in Figures 10 and 11, respectively.
![Figure 10: Call Flow Structure of Commodity Price Information Spoken Query System (Reproduced from Ref. [32] for Correct Flow of this Work).](/document/doi/10.1515/jisys-2018-0120/asset/graphic/j_jisys-2018-0120_fig_010.jpg)
Call Flow Structure of Commodity Price Information Spoken Query System (Reproduced from Ref. [32] for Correct Flow of this Work).
![Figure 11: Call Flow Structure of Weather Information Spoken Query System (Reproduced from Ref. [32] for Completeness.](/document/doi/10.1515/jisys-2018-0120/asset/graphic/j_jisys-2018-0120_fig_011.jpg)
Call Flow Structure of Weather Information Spoken Query System (Reproduced from Ref. [32] for Completeness.
The schematic representation of the new integrated call flow structure is shown in Figure 12. Comparing the WERs of earlier work, a significant improvement in accuracy of 4% for mono, tri1, and triphone2 levels (for overall noisy speech data) is achieved. The ASR models are developed using tri3 (LDA+MLLT_SAT), SGMM, and DNN for overall noisy and enhanced speech data in this work. From the above tables, it can be observed that there is significant improvement in accuracy with less WER for enhanced speech data. Approximately, 1.2% of accuracy is improved for the speech data after speech enhancement. The ASR models are developed for overall speech data to reduce the complexity in the call flow of the spoken query system. The overall speech data include all districts, mandis, and commodities enlisted in the AGMARKNET website under the Karnataka section. The developed least WER models (overall enhanced speech data models) could be used in the spoken query system to improve its on-line recognition performance. The Kannada spoken query system needs to recognize 250 commodities including all its varieties. The three districts, 45 mandis, and 98 commodities are included in this work. The developed spoken query system enables the user/farmer to call the system. In the first step, the farmer needs to prompt the district name. If the district is recognized, then, the system asks for the mandi name. If the mandi name is also recognized, then, it will ask the farmer to prompt the commodity name. If the commodity name is recognized, then, it will play out the current price information of the asked commodity from the price information database. Similarly, to get weather information, the farmer needs a prompt, the district name, at the first step. If the district is recognized, then the system gives the current weather information through prerecorded prompts from the weather information database. If the district, mandi, and commodities are not recognized, then, the system gives two more chances to prompt those again. Nevertheless, these are not recognized properly, then, the system says, “Sorry. Try again later.”
Call Flow Structure of Spoken Query System to Access Both Agricultural Commodity Prices and Weather Information.
6.2 Testing of Developed Spoken Query System from Farmers in the Field
The spoken query system is again developed for the new ASR models. To check the on-line speech recognition accuracy of the newly developed spoken query system, the 300 farmers are asked to test the system under uncontrolled environment. Table 20 shows the performance evaluation of the newly developed spoken query system by the farmers. It was observed in the table that there is a much improvement in on-line speech recognition accuracy with less failure of recognizing the speech utterances compared to the earlier spoken query system. Therefore, it can be inferred that the on-line and off-line (WERs of models) recognition rates are almost the same as shown in Tables 19 and 20.
Performance Evaluation of On-Line Speech Recognition Accuracy Testing by Farmers in Field Conditions.
| Language: Kannada | Total no. | 1st | 2nd | 3rd | Total no. | Recognition |
|---|---|---|---|---|---|---|
| of farmers | attempt | attempt | attempt | of recognitions | in % | |
| Districts | 300 | 241 | 15 | 10 | 266 | 88.66 |
| Mandis | 300 | 238 | 18 | 10 | 262 | 87.33 |
| Commodities | 300 | 240 | 14 | 9 | 263 | 87.66 |
7 Conclusions
The development and testing of the new Kannada spoken query system is demonstrated in this work. A method is proposed for the background noise mitigation, which is a combination of the SS-VAD and MMSE-SPZC estimator. The collected task-specific speech data was much degraded by musical, background, street, and babble noises. The proposed method gave better results compared to the individual methods for the TIMIT and Kannada speech databases. Therefore, it was applied on collected speech data for speech enhancement (before MFCC feature extraction). The 90% and 10% of validated speech data were used for system training and testing, respectively, using the Kaldi speech recognition toolkit. We also demonstrated the effectiveness of the recently introduced speech recognition modeling techniques SGMM and DNN. The ASR models were created for both noisy and enhanced speech data. The GMM-HMM-based acoustic modeling technique was used in the earlier spoken query system. The SGMM and DNN modeling approaches replaced the GMM-HMM-based acoustic modeling technique in this work. The SGMM-DNN ASR models are found to be outperformed compared to the conventional GMM-HMM-based acoustic models. There is a significant improvement in accuracy of 4% in the DNN-SGMM-based acoustic models compared to the earlier GMM-HMM-based models. Using the Kaldi recipe and Kannada language resources, the achieved WERs are 12.78% and 11.82% for the noisy speech data using the SGMM and hybrid DNN-based modeling techniques. The WERs of 11.77% and 10.67% are achieved for enhanced speech data using the same modeling techniques. Therefore, it can be inferred that there is a significant improvement in accuracy of 1.2% for the enhanced speech data compared to the noisy speech data. Interestingly, both the SGMM and DNN-based modeling approaches result in very similar WERs. The least WER models (SGMM and DNN-based models) could be used in the newly designed spoken query system. The earlier two spoken query systems are integrated together to form a single spoken query system. Therefore, the user/farmer can access the agricultural commodity price/weather information in a single call flow. The on-line speech recognition testing of the newly developed spoken query system done by farmers under real-time environments is also presented in this work. The future challenging work is to increase the Kannada speech database, further improving the performance of the ASR models, and testing the newly developed spoken query system by the farmers from the different dialect regions of the Karnataka state.
Acknowledgement
This work is a part of the ongoing consortium project on Speech Based Access of Agricultural Commodity Prices and Weather Information in 11 Indian Languages/Dialects funded by the Department of Electronics and Information Technology (DeitY), Ministry of Communication and Information Technology (MC&IT), Government of India. The authors would like to thank the consortium leader Prof. S. Umesh and other consortium members for their valuable inputs and suggestions.
Bibliography
[1] J. Beh and H. Ko, A novel spectral subtraction scheme for robust speech recognition: spectral subtraction using spectral harmonics of speech, in: IEEE Int. Conf. on Multimedia and Expo, vol. 3, I-648, I-651, April 2003.10.1007/3-540-44864-0_115Suche in Google Scholar
[2] S. Boll, Suppression of acoustic noise in speech using spectral subtraction, IEEE Trans. Acoust. Speech Signal Process 2 ASSP-27 (1979), 113–120.10.1109/TASSP.1979.1163209Suche in Google Scholar
[3] I. Cohen and B. Berdugo, Noise estimation by minima controlled recursive averaging for robust speech enhancement, IEEE Signal Process. Lett. 9 (2002), 12–15.10.1109/97.988717Suche in Google Scholar
[4] C. Cole, M. Karam and H. Aglan, Spectral subtraction of noise in speech processing applications, in: 40th Southeastern Symposium System Theory, SSST-2008, pp. 50–53, 16–18, New Orelans, LO, USA, March 2008.10.1109/SSST.2008.4480188Suche in Google Scholar
[5] G. Dahl, D. Yu, L. Deng and A. Acero, Context-dependent pre-trained deep neural networks for large vocabulary speech recognition, in: IEEE Trans. on Audio Speech, and Language Processing (receiving 2013 IEEE SPS Best Paper Award), pp. 30–42, Piscataway, NJ, USA, 2012.10.1109/TASL.2011.2134090Suche in Google Scholar
[6] D. L. Donoho and I. M. Johnstone, Ideal spatial adaptation by wavelet shrinkage, Biometrika 81 (1994), 425–455.10.1093/biomet/81.3.425Suche in Google Scholar
[7] D. L. Donoho and I. M. Johnstone, Adapting to unknown smoothness via wavelet shrinkage, J. Am. Stat. Assoc. 90 (1995), 1200–1224.10.1080/01621459.1995.10476626Suche in Google Scholar
[8] Y. Ephraim and D. Malah, Speech enhancement using a minimum mean square error short-time spectral amplitude estimator, IEEE Trans. Acoust. Speech Signal Process. ASSP-32 (1984), 1109–1121.10.1109/TASSP.1984.1164453Suche in Google Scholar
[9] Y. Ephraim and D. Malah, Speech enhancement using a minimum mean square error log-spectral amplitude estimator, IEEE Trans. Acoust. Speech Signal Process. ASSP-33 (1985), 443–445.10.1109/TASSP.1985.1164550Suche in Google Scholar
[10] J. R. Glass, Challanges for spoken dialogue systems, in: Proc. IEEE ASRU Workshop, Piscataway, NJ, USA, 1999.Suche in Google Scholar
[11] H. M. Goodarzi and S. Seyedtabaii, Speech enhancement using spectral subtraction based on a modified noise minimum statistics estimation, in: Fifth Joint Int. Conf, pp. 1339, 1343, 25–27 Aug. 2009.10.1109/NCM.2009.272Suche in Google Scholar
[12] G. E. Hinton, S. Osindero and Y. W. Teh, A fast learning algorithm for deep belief nets, Neural Comput. 18 (2006), 1527–1554.10.1162/neco.2006.18.7.1527Suche in Google Scholar PubMed
[13] G. E. Hinton, L. Deng, D. Yu, G. Dahl, A. R. Mohamed, N. Jaitly, A. Senior, V. Vanhoucke, P. Nguyen, T. Sainath and B. Kings-bury, Deep neural networks for acoustic modeling in speech recognition, Signal Process. Mag. 29 (2012), 82–97.10.1109/MSP.2012.2205597Suche in Google Scholar
[14] Y. Hu and P. Loizou, Subjective comparison and evaluation of speech enhancement algorithms, Speech Commun. 49 (2007), 588–601.10.1016/j.specom.2006.12.006Suche in Google Scholar PubMed PubMed Central
[15] Y. Hu and P. C. Loizou, Evaluation of objective quality measures for speech enhancement, IEEE Trans. Audio Speech Lang. Process. 16 (2008), 229–238.10.1109/TASL.2007.911054Suche in Google Scholar
[16] M. Jansen, Noise reduction by wavelet thresholding, in: Ser. Lecture Notes in Statistics, vol. 161, Springer-Verlag, Berlin, Germany, 2001.10.1007/978-1-4613-0145-5Suche in Google Scholar
[17] S. Kamath and P. Loizou, A multi-band spectral subtraction method for enhancing speech corrupted by colored noise, in: Proc. IEEE Int. Conf. Acoust., Speech, Signal Process., Orlando, USA, May 2002.10.1109/ICASSP.2002.5745591Suche in Google Scholar
[18] H. Liu, X. Yu, W. Wan and R. Swaminathan, An improved spectral subtraction method, in: Int. Conf. on Audio, Language and Image Processing (ICALIP), Shanghai, pp. 790–793, July 2012.10.1109/ICALIP.2012.6376721Suche in Google Scholar
[19] P. C. Loizou, Speech enhancement based on perceptually motivated Bayesian estimators of the magnitude spectrum, IEEE Trans. Speech Audio Process. 13 (2005), 857–869.10.1109/TSA.2005.851929Suche in Google Scholar
[20] P. Loizou, Speech enhancement: theory and practice, 1st ed., CRC Taylor & Francis, Boca Raton, FL, 2007.10.1201/9781420015836Suche in Google Scholar
[21] T. Lotter and P. Vary, Speech enhancement by map spectral amplitude estimation using a super-Gaussian speech model, EURASIP J. Appl. Signal Process. 5 (2005), 1110–1126.10.1155/ASP.2005.1110Suche in Google Scholar
[22] Y. Lu and P. C. Loizou, Estimators of the magnitude-squared spectrum and methods for incorporating SNR uncertainty, IEEE Trans. Audio Speech Lang. Process. 19 (2011), 1123–1137.10.1109/TASL.2010.2082531Suche in Google Scholar PubMed PubMed Central
[23] S. Mallat, A wavelet tour of signal processing, Academic Press, San Diego, CA, 1999.10.1016/B978-012466606-1/50008-8Suche in Google Scholar
[24] R. Martin, Speech enhancement based on minimum mean-square error estimation and supergaussian priors, IEEE Trans. Speech Audio Process. 13 (2005), 845–856.10.1109/TSA.2005.851927Suche in Google Scholar
[25] iITU-T, Perceptual evaluation of speech quality (PESQ), and objective method for end-to-end speech quality assessment of narrowband telephone net-works and speech codecs, ITU, ITU-T Rec. P. 862, ITU-T, Geneva, Switzerland, 2000.Suche in Google Scholar
[26] D. Povey, L. Burget, M. Agarwal, P. Akyazi, F. Kai, A. Ghoshal, O. Glembek, N. Goel, M. KarafiÌat, A. Rastrow, R. C. Rose, P. Schwarz and S. Thomas, The subspace gaussian mixture model-a structured model for speech recognition, in: Computer Speech and Language, pp. 404–439, Elsevier, Amsterdam, The Netherlands, 2011.10.1016/j.csl.2010.06.003Suche in Google Scholar
[27] L. R. Rabiner, Applications of voice processing to telecommunications, Proc. IEEE 82 (1994), 199–228.10.1109/5.265347Suche in Google Scholar
[28] L. Rabiner and B. H. Juang, Fundamentals of speech recognition, Prentice Hall, Inc, Upper Saddle River, NJ, USA, 1993.Suche in Google Scholar
[29] J. Ramirez, J. M. Gorriz and J. C. Segura, Voice activity detection. Fundamentals and speech recognition system robustness, in: Robust Speech Recognition and Understanding, M. Grimm, K. Kroschel, eds., ISBN 987-3-90213-08-0, pp. 460, I-Tech, Vienna, Austria, 2007.10.5772/4740Suche in Google Scholar
[30] A. Rix, J. Beerends, M. Hollier and A. Hekstra, Perceptual evaluation of speech quality (PESQ)–a new method for speech quality assessment of telephone networks and codecs, in: Proc. IEEE Int. Conf. Acoust., Speech, Signal Process. vol. 2, pp. 749–752, 2001.10.1109/ICASSP.2001.941023Suche in Google Scholar
[31] R. C. Rose, S. C. Yin and Y. Tang, An investigation of subspace modeling for phonetic and speaker variability in automatic speech recognition, in: Proc. ICASSP, pp. 4508–4511, Prague, Czech Republic, 2011.10.1109/ICASSP.2011.5947356Suche in Google Scholar
[32] G. Y. Thimmaraja and H. S. Jayanna, A spoken query system for the agricultural commodity prices and weather information access in Kannada language, Int. J. Speech Technol. Springer 20 (2017), 635–644.10.1007/s10772-017-9428-ySuche in Google Scholar
[33] A. Trihandoyo, A. Belloum and K. M. Hou, A real-time speech recognition architecture for a multi-channel interactive voice response system, Proc. ICASSP 4 (1995), 2687–2690.10.1109/ICASSP.1995.480115Suche in Google Scholar
[34] D. Wang and G. Brown, Eds., Computational auditory scene analysis (CASA): principles, algorithms, and applications, Wiley/IEEE Press, Piscataway, NJ, 2006.Suche in Google Scholar
[35] P. J. Wolfe and S. J. Godsill, Simple alternatives to the Ephraim and Malah suppression rule for speech enhancement, in: Proc. 11th IEEE Signal Process. Workshop Statist. Signal Process., pp. 496–499, Singapore, Aug. 2001.10.1109/SSP.2001.955331Suche in Google Scholar
[36] B.-Y. Xia, Y. Liang and C.-C. Bao, A modified spectral subtraction method for speech enhancement based on masking property of human auditory system, in: Int. Conf. on Wireless Communications Signal Processing, WCSP, pp. 1–5, Nanjing, China, Nov. 2009.10.1109/WCSP.2009.5371466Suche in Google Scholar
©2020 Walter de Gruyter GmbH, Berlin/Boston
This work is licensed under the Creative Commons Attribution 4.0 Public License.
Artikel in diesem Heft
- An Optimized K-Harmonic Means Algorithm Combined with Modified Particle Swarm Optimization and Cuckoo Search Algorithm
- Texture Feature Extraction Using Intuitionistic Fuzzy Local Binary Pattern
- Leaf Disease Segmentation From Agricultural Images via Hybridization of Active Contour Model and OFA
- Deadline Constrained Task Scheduling Method Using a Combination of Center-Based Genetic Algorithm and Group Search Optimization
- Efficient Classification of DDoS Attacks Using an Ensemble Feature Selection Algorithm
- Distributed Multi-agent Bidding-Based Approach for the Collaborative Mapping of Unknown Indoor Environments by a Homogeneous Mobile Robot Team
- An Efficient Technique for Three-Dimensional Image Visualization Through Two-Dimensional Images for Medical Data
- Combined Multi-Agent Method to Control Inter-Department Common Events Collision for University Courses Timetabling
- An Improved Particle Swarm Optimization Algorithm for Global Multidimensional Optimization
- A Kernel Probabilistic Model for Semi-supervised Co-clustering Ensemble
- Pythagorean Hesitant Fuzzy Information Aggregation and Their Application to Multi-Attribute Group Decision-Making Problems
- Using an Efficient Optimal Classifier for Soil Classification in Spatial Data Mining Over Big Data
- A Bayesian Multiresolution Approach for Noise Removal in Medical Magnetic Resonance Images
- Gbest-Guided Artificial Bee Colony Optimization Algorithm-Based Optimal Incorporation of Shunt Capacitors in Distribution Networks under Load Growth
- Graded Soft Expert Set as a Generalization of Hesitant Fuzzy Set
- Universal Liver Extraction Algorithm: An Improved Chan–Vese Model
- Software Effort Estimation Using Modified Fuzzy C Means Clustering and Hybrid ABC-MCS Optimization in Neural Network
- Handwritten Indic Script Recognition Based on the Dempster–Shafer Theory of Evidence
- An Integrated Intuitionistic Fuzzy AHP and TOPSIS Approach to Evaluation of Outsource Manufacturers
- Automatically Assess Day Similarity Using Visual Lifelogs
- A Novel Bio-Inspired Algorithm Based on Social Spiders for Improving Performance and Efficiency of Data Clustering
- Discriminative Training Using Noise Robust Integrated Features and Refined HMM Modeling
- Self-Adaptive Mussels Wandering Optimization Algorithm with Application for Artificial Neural Network Training
- A Framework for Image Alignment of TerraSAR-X Images Using Fractional Derivatives and View Synthesis Approach
- Intelligent Systems for Structural Damage Assessment
- Some Interval-Valued Pythagorean Fuzzy Einstein Weighted Averaging Aggregation Operators and Their Application to Group Decision Making
- Fuzzy Adaptive Genetic Algorithm for Improving the Solution of Industrial Optimization Problems
- Approach to Multiple Attribute Group Decision Making Based on Hesitant Fuzzy Linguistic Aggregation Operators
- Cubic Ordered Weighted Distance Operator and Application in Group Decision-Making
- Fault Signal Recognition in Power Distribution System using Deep Belief Network
- Selector: PSO as Model Selector for Dual-Stage Diabetes Network
- Oppositional Gravitational Search Algorithm and Artificial Neural Network-based Classification of Kidney Images
- Improving Image Search through MKFCM Clustering Strategy-Based Re-ranking Measure
- Sparse Decomposition Technique for Segmentation and Compression of Compound Images
- Automatic Genetic Fuzzy c-Means
- Harmony Search Algorithm for Patient Admission Scheduling Problem
- Speech Signal Compression Algorithm Based on the JPEG Technique
- i-Vector-Based Speaker Verification on Limited Data Using Fusion Techniques
- Prediction of User Future Request Utilizing the Combination of Both ANN and FCM in Web Page Recommendation
- Presentation of ACT/R-RBF Hybrid Architecture to Develop Decision Making in Continuous and Non-continuous Data
- An Overview of Segmentation Algorithms for the Analysis of Anomalies on Medical Images
- Blind Restoration Algorithm Using Residual Measures for Motion-Blurred Noisy Images
- Extreme Learning Machine for Credit Risk Analysis
- A Genetic Algorithm Approach for Group Recommender System Based on Partial Rankings
- Improvements in Spoken Query System to Access the Agricultural Commodity Prices and Weather Information in Kannada Language/Dialects
- A One-Pass Approach for Slope and Slant Estimation of Tri-Script Handwritten Words
- Secure Communication through MultiAgent System-Based Diabetes Diagnosing and Classification
- Development of a Two-Stage Segmentation-Based Word Searching Method for Handwritten Document Images
- Pythagorean Fuzzy Einstein Hybrid Averaging Aggregation Operator and its Application to Multiple-Attribute Group Decision Making
- Ensembles of Text and Time-Series Models for Automatic Generation of Financial Trading Signals from Social Media Content
- A Flame Detection Method Based on Novel Gradient Features
- Modeling and Optimization of a Liquid Flow Process using an Artificial Neural Network-Based Flower Pollination Algorithm
- Spectral Graph-based Features for Recognition of Handwritten Characters: A Case Study on Handwritten Devanagari Numerals
- A Grey Wolf Optimizer for Text Document Clustering
- Classification of Masses in Digital Mammograms Using the Genetic Ensemble Method
- A Hybrid Grey Wolf Optimiser Algorithm for Solving Time Series Classification Problems
- Gray Method for Multiple Attribute Decision Making with Incomplete Weight Information under the Pythagorean Fuzzy Setting
- Multi-Agent System Based on the Extreme Learning Machine and Fuzzy Control for Intelligent Energy Management in Microgrid
- Deep CNN Combined With Relevance Feedback for Trademark Image Retrieval
- Cognitively Motivated Query Abstraction Model Based on Associative Root-Pattern Networks
- Improved Adaptive Neuro-Fuzzy Inference System Using Gray Wolf Optimization: A Case Study in Predicting Biochar Yield
- Predict Forex Trend via Convolutional Neural Networks
- Optimizing Integrated Features for Hindi Automatic Speech Recognition System
- A Novel Weakest t-norm based Fuzzy Fault Tree Analysis Through Qualitative Data Processing and Its Application in System Reliability Evaluation
- FCNB: Fuzzy Correlative Naive Bayes Classifier with MapReduce Framework for Big Data Classification
- A Modified Jaya Algorithm for Mixed-Variable Optimization Problems
- An Improved Robust Fuzzy Algorithm for Unsupervised Learning
- Hybridizing the Cuckoo Search Algorithm with Different Mutation Operators for Numerical Optimization Problems
- An Efficient Lossless ROI Image Compression Using Wavelet-Based Modified Region Growing Algorithm
- Predicting Automatic Trigger Speed for Vehicle-Activated Signs
- Group Recommender Systems – An Evolutionary Approach Based on Multi-expert System for Consensus
- Enriching Documents by Linking Salient Entities and Lexical-Semantic Expansion
- A New Feature Selection Method for Sentiment Analysis in Short Text
- Optimizing Software Modularity with Minimum Possible Variations
- Optimizing the Self-Organizing Team Size Using a Genetic Algorithm in Agile Practices
- Aspect-Oriented Sentiment Analysis: A Topic Modeling-Powered Approach
- Feature Pair Index Graph for Clustering
- Tangramob: An Agent-Based Simulation Framework for Validating Urban Smart Mobility Solutions
- A New Algorithm Based on Magic Square and a Novel Chaotic System for Image Encryption
- Video Steganography Using Knight Tour Algorithm and LSB Method for Encrypted Data
- Clay-Based Brick Porosity Estimation Using Image Processing Techniques
- AGCS Technique to Improve the Performance of Neural Networks
- A Color Image Encryption Technique Based on Bit-Level Permutation and Alternate Logistic Maps
- A Hybrid of Deep CNN and Bidirectional LSTM for Automatic Speech Recognition
- Database Creation and Dialect-Wise Comparative Analysis of Prosodic Features for Punjabi Language
- Trapezoidal Linguistic Cubic Fuzzy TOPSIS Method and Application in a Group Decision Making Program
- Histopathological Image Segmentation Using Modified Kernel-Based Fuzzy C-Means and Edge Bridge and Fill Technique
- Proximal Support Vector Machine-Based Hybrid Approach for Edge Detection in Noisy Images
- Early Detection of Parkinson’s Disease by Using SPECT Imaging and Biomarkers
- Image Compression Based on Block SVD Power Method
- Noise Reduction Using Modified Wiener Filter in Digital Hearing Aid for Speech Signal Enhancement
- Secure Fingerprint Authentication Using Deep Learning and Minutiae Verification
- The Use of Natural Language Processing Approach for Converting Pseudo Code to C# Code
- Non-word Attributes’ Efficiency in Text Mining Authorship Prediction
- Design and Evaluation of Outlier Detection Based on Semantic Condensed Nearest Neighbor
- An Efficient Quality Inspection of Food Products Using Neural Network Classification
- Opposition Intensity-Based Cuckoo Search Algorithm for Data Privacy Preservation
- M-HMOGA: A New Multi-Objective Feature Selection Algorithm for Handwritten Numeral Classification
- Analogy-Based Approaches to Improve Software Project Effort Estimation Accuracy
- Linear Regression Supporting Vector Machine and Hybrid LOG Filter-Based Image Restoration
- Fractional Fuzzy Clustering and Particle Whale Optimization-Based MapReduce Framework for Big Data Clustering
- Implementation of Improved Ship-Iceberg Classifier Using Deep Learning
- Hybrid Approach for Face Recognition from a Single Sample per Person by Combining VLC and GOM
- Polarity Analysis of Customer Reviews Based on Part-of-Speech Subcategory
- A 4D Trajectory Prediction Model Based on the BP Neural Network
- A Blind Medical Image Watermarking for Secure E-Healthcare Application Using Crypto-Watermarking System
- Discriminating Healthy Wheat Grains from Grains Infected with Fusarium graminearum Using Texture Characteristics of Image-Processing Technique, Discriminant Analysis, and Support Vector Machine Methods
- License Plate Recognition in Urban Road Based on Vehicle Tracking and Result Integration
- Binary Genetic Swarm Optimization: A Combination of GA and PSO for Feature Selection
- Enhanced Twitter Sentiment Analysis Using Hybrid Approach and by Accounting Local Contextual Semantic
- Cloud Security: LKM and Optimal Fuzzy System for Intrusion Detection in Cloud Environment
- Power Average Operators of Trapezoidal Cubic Fuzzy Numbers and Application to Multi-attribute Group Decision Making