An Improved Robust Fuzzy Algorithm for Unsupervised Learning
-
Amina Dik

 ,
Khalid Jebari
,
Khalid Jebari

Abstract
This paper presents a robust, dynamic, and unsupervised fuzzy learning algorithm (RDUFL) that aims to cluster a set of data samples with the ability to detect outliers and assign the numbers of clusters automatically. It consists of three main stages. The first (1) stage is a pre-processing method in which possible outliers are determined and quarantined using a concept of proximity degree. The second (2) stage is a learning method, which consists in auto-detecting the number of classes with their prototypes for a dynamic threshold. This threshold is automatically determined based on the similarity among the detected prototypes that are updated at the exploration of a new data. The last (3) stage treats quarantined samples detected from the first stage to determine whether they belong to some class defined in the second phase. The effectiveness of this method is assessed on eight real medical benchmark datasets in comparison to known unsupervised learning methods, namely, the fuzzy c-means (FCM), possibilistic c-means (PCM), and noise clustering (NC). The obtained accuracy of our scheme is very promising for unsupervised learning problems.
1 Introduction
Clustering is one of the most relevant data-mining tasks [42]. It is the process of organizing objects into a set of classes. The classes provided by the classical methods are considered hard, and each object is assigned to a single and unique class. This assumes that the boundaries between classes are well defined, whereas, in fact, class boundaries are often fuzzy and uncertain. This uncertainty is shown by the fact that an object possesses features that make it more likely to belong to more than a single class. Thus, in the fuzzy classification, an object does not belong exclusively to a single class but possesses a degree of membership to all existing classes [36]. The degree of membership is in the interval [0, 1], and the obtained classes are not necessarily disjoint. Clustering becomes very difficult in unsupervised contexts where no prior information on the experimental objects is provided. This difficulty increases when these objects contain outliers [39]. An outlier refers to a value that appears to be suspicious because it is significantly inconsistent with the rest of that set of data. According to Han and Kamber [27], outliers are the set of objects that are considerably dissimilar from the remainder of the data.
In clustering, giving an outlier the same importance that is given to other objects destabilizes the analysis and distorts the results [3]. Hence, outlier detection is important [44], [47]. However, these outliers are not necessarily erroneous and may contain a meaningful indication [45], such as the case during fraud detection [9] or computer network intrusion [35]. Therefore, outliers ought not to be systematically rejected [5].
Handling clustering and outlier detection at the same time is a highly desirable task [33], [38], [40]. Many strong methods that have emerged in this direction take all the data into account, but minimize the influence of outliers [20], [21]. The best-known algorithm is the noise clustering (NC), also called the robust-fuzzy c-means (FCM) [19]. In this algorithm, the notion of noise class is introduced. The class of these outliers is characterized by a fictitious prototype that has a constant distance δ to other objects. Hence, it is important to determine the distance δ, which is a critical parameter of the algorithm [17].
In this paper, we propose a robust approach, which allows clustering data by auto-detecting the classes they form and providing the existing outliers without giving any parameter. The proposed approach consists of three stages:
A pre-processing stage using similarity to detect objects likely to be outliers and which will be considered as possible outliers. These objects are quarantined and excluded from the second stage.
A second stage in which classes are determined based on a dynamic threshold. This threshold is based on the minimum similarity among the detected prototypes, which are updated at the exploration of any new object. This minimum similarity is considered as the condition of adding a new cluster.
A final stage, which is a processing of possible outliers in order to determine whether they belong to one of these classes detected in the second phase. To this end, each possible outlier is compared to its neighbors to confirm that it is really an outlier.
A more formal description of this method is presented in Section 3 following a brief related work in Section 2. The results obtained from experiments on real and artificial data are presented in Section 4. Section 5 presents the main conclusions of this paper.
2 Related Work
Clustering is commonly used in real-world problems encountered in a variety of applications [13], [14], [15], [51], [54], [58]. It is an exploratory data analysis tool, which aims to find structure in a dataset according to the measured characteristics or similarities [12], [48], [52]. It consists in grouping a set of n data points into homogeneous groups, called clusters, without any prior information on the structure or the nature of the clusters.
Clustering can be classified as hard or fuzzy. Hard clustering assigns each data point to a unique cluster with a degree of membership equal to one. Conversely, fuzzy clustering assigns each data point to every cluster with different membership degrees.
In mathematical terms, partitioning a learning base X = {x1, x2, … , xn} ⊂ ℜp into c clusters can be represented by a (c × n) partition matrix U = [uik], which satisfies the following conditions:
The space of hard partitions is, thus, defined by Bezdek [6]:
Hard clustering assumes that clusters are disjointed, and their boundaries are well defined. However, the boundaries between clusters are not always definite in real-world datasets. Fuzzy clustering was proposed to deal with overlapping clusters.
Partitioning X into c fuzzy clusters can be defined by c fuzzy sets E1, …, Ec and a membership function [57] assuming values in the interval [0, 1] such as:
where uik is interpreted as the membership degree to which the object i belongs to the kth cluster (1 ≤ k ≤ c and 1 ≤ i ≤ n) [6], [19]. Therefore, a (c × n) fuzzy membership matrix U = [uik] can be used to represent the fuzzy partition of X. The kth row of this matrix contains values of the kth membership function μk of the subset Ek. Elements uik satisfy the following conditions:
Thereby, fuzzy clustering is considered as a generalization of hard clustering that can be used to describe imprecise or fuzzy information [30], [50], [53]. The most widely used clustering algorithm is FCM [15], which is highlighted in what follows:
2.1 The FCM Algorithm
FCM generalizes the hard c-means algorithm [K-means] to allow a point to partially belong to all existing clusters [6], [7]. FCM is an iterative process, which optimizes an objective function Jm defined by:
where:
uik is the degree to which the element xk belongs to the ith class (1 ≤ i ≤ c, 1 ≤ k ≤ n).
m (1 < m < ∞) is an exponent of the weighting used to monitor the relative contribution of each object xi and the fuzziness degree of the final partition.
V = (v1, v2, …, vc) represents a c triplet of prototypes, in which each prototype characterizes a class.
d(xk, vi) is the distance between the ith prototype and the kth object.
Bezdek demonstrated that FCM converges to an approximate solution when two conditions are satisfied [10]:
The pseudo-code of the FCM algorithm is given in Figure 1.

FCM Algorithm.
The idea of clustering data is natural. Indeed, we tend to group a large number of data into a small number of groups in order to facilitate further analysis. The search for these groups is not a simple task when data is affected by outliers. Generally, outliers are far from all the other items without neighbors. Outliers may significantly affect the estimation of the centers of detected clusters, which is the case for the FCM algorithm. Two methods were proposed to handle this problem: the possibilistic C-means algorithm (PCM) [34] and robust-FCM [19]. These are summarized in what follows.
2.2 The PCM Algorithm
The PCM introduces a possibilistic type of membership function to describe the degree of belonging [56] and releases the objective function Jm [Eq. (8)] by dropping the sum to 1 [Eq. (2)]. Hence, membership degrees became independent [41].
The PCM optimizes the objective Jm defined as follows:
where:
ηi (1 < I < c) is a parameter defined by:
(12)
and uik is defined by:
The parameter ηi is a positive weight defined for modulating the opposing effects of the two terms in Jm. It is set by the user and chosen according to each class. Unfortunately, it is not always available.
2.3 The Robust-FCM Algorithm
Dave [19] proposed a new method known as the «robust-FCM». It consists in introducing an additional class of noise that contains all the outliers. The fictive prototype of the noise cluster is set such that it is always at the same distance from the considered data points. This distance is called the noise distance δ. Thus, an object is not an outlier if its distance from one of the prototypes is inferior to δ.
The presence of the noise cluster modifies the objective function defined by Eq. (8) as follows:
where u*k is the membership degree of the object xk to the noise cluster, and δ is the distance of noise defined, respectively, by:
By minimizing the objective function defined by Eq. (14), we obtain:
The variable λ is a multiplying factor for obtaining δ. Thus, the choice of δ depends on λ. Dave proposed a heuristic to select this parameter. However, this choice does not always give satisfaction.
Recently, some approaches were proposed on outlier detection [33], [43], and the outliers, themselves, become the “focus” in outlier-mining tasks [16].
3 Proposed Approach (RDUFL)
Handling simultaneously clustering data and detecting outliers, as mentioned earlier, is a highly desirable task. The intuitive approach consists in applying a clustering algorithm and considering objects that are distant from their nearest prototype as outliers. However, this algorithm may, itself, be extremely sensitive to the outliers that may have a disproportionate impact on prototypes [26]. Hence, detecting outliers is important in clustering tasks.
RDUFL allows to cluster the considered data and to detect eventual outliers. RDUFL consists of the following three phases:
3.1 Detection of Possible Outliers
The first phase of our approach consists in detecting objects that are likely to be outliers and which we will refer to as «possible» outliers. It originates from the fact that a normal object has more neighbors with which it shares similar characteristics [11], [27]. It is based on the proximity degree of an object in relation to other objects. This concept consists in calculating the sum of similarities of an object to all other objects [22] and not just to its neighbors [1]:
with:
where:
Sim (xi, xk) is the similarity between the two objects xi and xk [25].
p is the dimension of the objects space: xi = (xi1, xi2, …, xip) ∈ ℜp.
A is the p × p matrix defined by Bouroumi [10]:
(20)
The factor rj stands for the difference between the maximum and minimal values of an attribute. It is defined by:
The choice of this measure of similarity is motivated by the following properties [10], [25], [26]:
Sim (xi, xk) ∈ [0, 1]; ∀ xi, xk ∈ ℜp since
Sim (xi, xk) = 1 for xi = xk
Sim (xi, xk) ⟶ 0 for (xij − xkj) ⟶ rj ∀ 1 ≤ j ≤ p, which means that objects present a maximum of difference of each of their p components.
Therefore, an object has a high degree of proximity when its neighbors are several, and the object with a low value «D» is more likely to be an outlier. It is considered as «possible» outlier.
This phase does not require any notion of clusters or expected number of outliers [29]. It allows determining the top objects within the small proximity degree. We note M as their number. Once these objects are detected, they are quarantined, and we proceed to the learning of the set X without taking into account these M possible outliers.
3.2 Learning Phase
Assuming that object vectors, which form the training database X, belong at least to two distinct classes and given an inter-point similarity measure, the learning algorithm of this phase starts by the creation of two classes around two first objects x1 and x2 [4].
RDUFL sequentially explores all the «n-2-M» objects of the training base X and analyzes their resemblances by utilizing the measure of similarity given by Eq. (19). A dynamic threshold ξ is utilized to detect when a new object is dissimilar to all existing prototypes. This threshold represents the minimum similarity that each object must have with its nearest prototype [4], [10], [23]. When this threshold is not attained, a new class is created, and its prototype is initialized with the current object.
In this paper, ξ is dynamic and depends on the current object. It is automatically calculated at each iteration as follows:
If xi is the current object and vk its nearest prototype, ξ is defined by:
The algorithm utilizes the similarity measure and its associated threshold in order to build classes. At each iteration, the similarity of the current object to the existing prototypes is calculated. Following the maximum of this similarity, two decisions will be conceivable [10]:
A new class is created when:
(23)
This means that the current item xi is not sufficiently similar to the prototypes of the previously detected classes. It is supposed to come from a class that has not been detected yet and must, therefore, represent a new class [10]. Thus, we put:
The prototypes are updated when:
(24)
In this case, xi is considered to have the minimal similarity required with the prototypes of the previously detected classes. Therefore, we must not create any new classes.
The prototypes of the previously created classes are then updated according to the following learning rule:
where:
vk(i), vk(i − 1) are, respectively, the prototypes of the class k before and after the addition of xi.
ni(k) designates the fuzzy cardinal of the class k after the addition of xi, defined by:
Failure to consider the possible outliers during this phase allows the stabilization of prototype calculation and the no distortion of the automatic detection of the number of classes.
3.3 Treatment of Possible Outliers
In this phase, we deal with the M possible outliers Oi(1 ≤ i ≤ M) that have been detected and quarantined during the first phase. For each possible outlier Oi, we look for its nearest prototype vk and its corresponding class marked Ck. For this class Ck, the farthest element xl is determined:
If the point xl is closer to the outlier Oi than to its nearest prototype vk, the point Oi has neighbors that are neighbors of xl. This point Oi is not, therefore, an outlier. Hence, two cases are possible:
If
If
The pseudo-code of RDUFL is presented in Figure 2.

Pseudo-Code of RDUFL.
4 Results and Discussion
To assess the performance of our approach, some experiments were conducted on an artificial dataset X1, and on eight real-world databases that are available in UCI [8]: Lymphography, Diabetes, Indian, Haberman’s Survival, BCW, Post-operative Patient, Parkinsons, and EEG Eyes State.
A first comparison is based on the recognition rate defined by:
A second comparison is based on:
where:
TP (true positive) is the number of objects correctly identified
FP (false positive) is the number of objects incorrectly identified
TN (true negative) is the number of objects correctly rejected
FN (false negative) is the number of objects incorrectly rejected.
4.1 Artificial Dataset
To illustrate the usefulness of the proposed algorithm, we consider the dataset X1, which is a two-dimensional artificial example derived from Ref. [10]. It is divided into three classes with 58 points in the plan and seven outliers (Figure 3). This two-dimensional dataset is important due to the possibility it presents in terms of visualization.
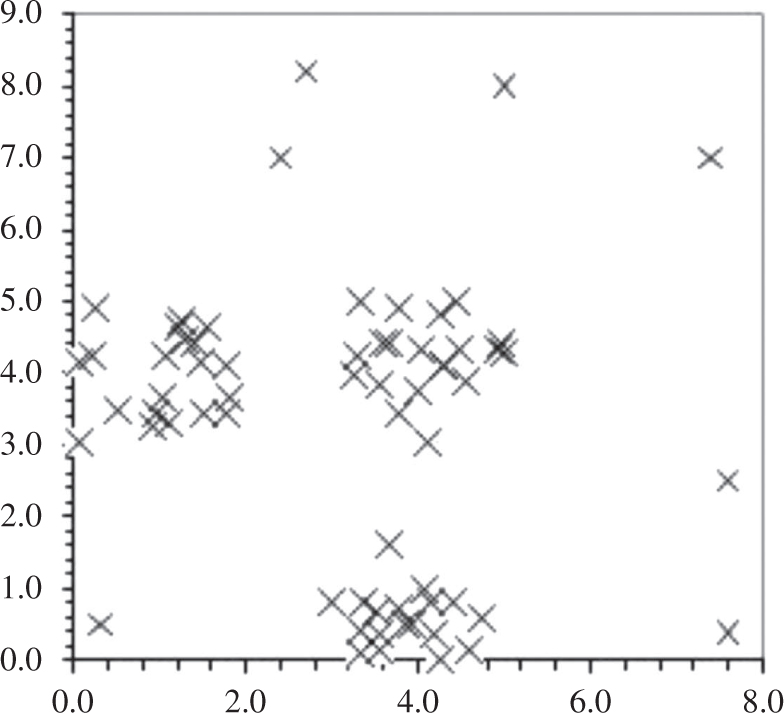
Representation of X1 (65 Points).
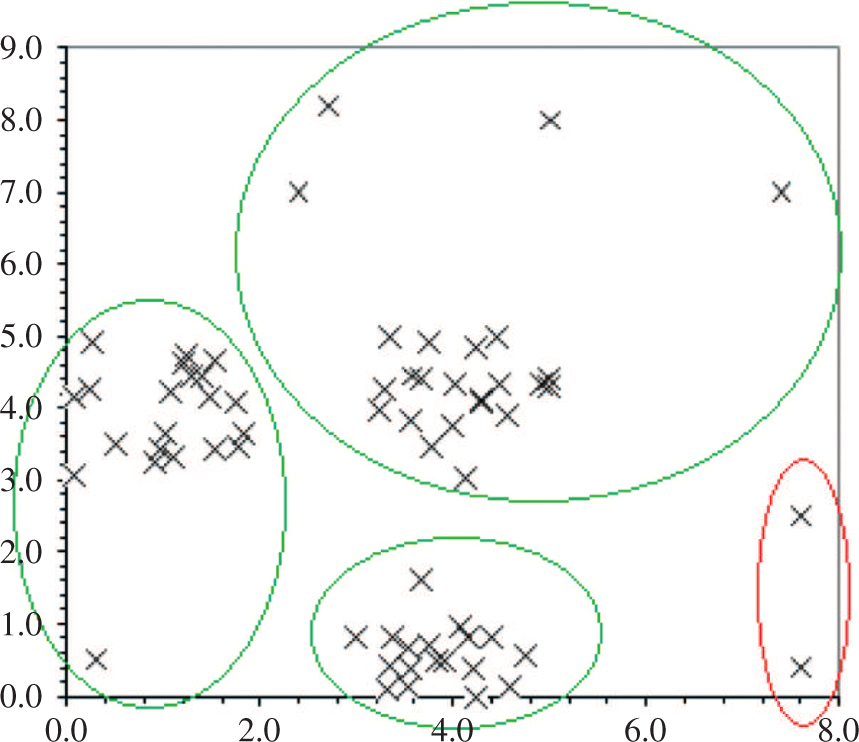
For the dataset X1, RDUFL detected seven possible outliers. The learning and treatment phases of the outliers demonstrated that these are true outliers. The number of detected classes is three, and the recognition rate is 100% (Figure 4).

Results of RDUFL on the Dataset X1.
The number of detected classes is c =3; the outliers are indicated in yellow.
On the other hand, we applied on X1 the following algorithms: FCM, PCM, and robust-FCM.
First, the FCM algorithm failed to detect the existing outliers for c = 3 (Figure 5A). This algorithm detected two outliers for c = 4 (Figure 5B) and three outliers for c = 5 (Figure 5C). It is only for c = 6 (Figure 5D) that the FCM detected all the seven outliers by considering them as points that belong to two clusters with a weak cardinal.

Clustering of X1 by FCM and Different Values of c.
(A) c = 3, Outliers are not detected and belong to existing classes. (B) c = 4, FCM detects only two outliers, represented by a star. (C) c = 5, FCM detects three outliers, two represented by stars and one by the sign +. (D) c = 6, all outliers are detected, they are represented as follows: One by the sign +, two by stars and four by lozenge.
As for the robust-FCM algorithm intended to detect the outliers, it only detects two outliers (Figure 6). In addition, the obtained recognition rate for the robust-FCM equals 92.31%, whereas our approach was able to recognize all the objects.
Results of Robust-FCM on the Dataset X1.
The number of detected classes is 3; the class of outliers is in red.
For the tests we carried out, the value of λ ranged between 0.01 and 0.9, and the best result is obtained for λ = 0.7.
Table 1 presents the recognition rate of learning through the considered algorithms compared to RDUFL.
Recognition Rate Obtained by the Four Considered Algorithms on Synthetic Dataset X1.
| FCM | PCM | Robust-FCM | RDUFL |
|---|---|---|---|
| 89.23% | 40% | 92.31% | 100% |
RDUFL has the highest rate whereas PCM has the lowest.
These results show the sensitivity of these algorithms toward the outliers and their difficulties in correctly extracting the classes [31], [32].
4.2 Real-World Dataset
The first considered real dataset is «Lymphography», which has 148 objects with 18 attributes. These are observations, which were made on patients with cancer in the lymphatic of the immune system. It comprises four classes: normal (two objects), metastases (81 objects), malignant lymphs (61 objects), and fibrosis (four objects).
The second dataset is «Diabetes», and it is composed of 768 objects with four attributes. The data fall into two classes: the class 0 with 500 instances and the class 1 interpreted as “tested positive for diabetes” with 268 instances.
The third dataset is the «Indian» dataset, which comprises 583 objects with 10 attributes. There are two classes: the first with 416 objects and the second with 167 objects.
The fourth dataset is Haberman’s Survival dataset that is the result of a measure of 306 cases on the survival of patients who had undergone surgery for breast cancer. It is a three-dimensional pattern classification problem from two classes.
The Breast Cancer dataset is a nine-dimensional pattern classification problem with 699 samples from malignant (cancerous) class and benign (non-cancerous) class. The two classes contain, respectively, 458 and 241 points.
The Parkinsons Disease dataset is composed of a range of biomedical voice measurements. There are 22 attributes and 195 samples from the two classes corresponding to healthy people and those with Parkinson’s disease. The two classes contain, respectively, 48 and 147 points.
The Postoperative Patient dataset aims to determine where to send patients in a postoperative recovery area. The number of instances is 90 distributed over three classes: class I (patient sent to Intensive Care Unit) with two items, class S (patient prepared to go home) with 24 items, and class A (patient sent to general hospital floor) with 64 items.
The EEG Eyes dataset consists of EEG values and a value indicating the eye state. This eye state was detected via a camera during the EEG measurement and added later manually to the file. It is a 14-dimensional pattern classification problem with 14,980 samples. The two classes contain, respectively, 8257 and 6723 points.
Table 2 describes the data and provides information on the attributes, size, and number of classes.
Description of Real Datasets.
| Data | No. of samples | No. of attributes | No. of classes |
|---|---|---|---|
| Lymphography | 148 | 18 | 4 |
| Diabetes | 768 | 8 | 2 |
| Indian | 583 | 10 | 2 |
| Haberman’s Survival | 306 | 3 | 2 |
| BCW | 699 | 9 | 2 |
| Post-operative Patient | 90 | 8 | 3 |
| Parkinsons | 197 | 23 | 2 |
| EEG Eyes State | 14,980 | 14 | 2 |
We initially checked if there are possible outliers in the considered datasets. To this end, we calculated the proximity degree for the objects and looked for their small values.
Once possible outliers were determined and isolated, we applied RDUFL to the other objects by assessing an object at each iteration. At the end of the learning phase, we obtained the detected classes with their prototypes.
The treatment phase of the possible outliers Oi allowed to obtain the results described in Table 3.
Number of Detected Classes by RDUFL, Possible and True Outliers.
| Dataset | Number of detected classes | Number of possible outliers | Number of true outliers |
|---|---|---|---|
| Lymphography | 2 | 15 | 11 |
| Diabetes | 2 | 6 | 3 |
| Indian | 2 | 32 | 14 |
| Haberman’s Survival | 2 | 12 | 6 |
| BCW | 2 | 18 | 0 |
| Post-operative Patient | 2 | 2 | 2 |
| Parkinsons | 2 | 9 | 3 |
| EEG Eyes State | 2 | 4 | 2 |
Sensitivity and Specificity Percentages for Modified BCW Data Using RDUFL.
| Possible outliers | Number of malignant | % of malignant | Sensitivity | Specificity |
|---|---|---|---|---|
| 5 | 39 | 100 | 100% | 80% |
| 10 | 39 | 100 | 100% | 79% |
| 15 | 39 | 100 | 100% | 78% |
| 20 | 39 | 100 | 100% | 77% |
| 25 | 39 | 100 | 100% | 76% |
| 30 | 39 | 100 | 100% | 72% |
| 35 | 39 | 100 | 100% | 70% |
| 39 | 39 | 100 | 100% | 67% |
FCM and RDUFL have the same accuracy Percentage.
The first finding is that RDUFL allows detecting the exact number of classes for all the examples of the considered data based on the defined dynamic threshold and the learning rule.
Recognition Rates Obtained for the Considered Data.
| Data set | FCM | PCM | Robust-FCM | RDUFL |
|---|---|---|---|---|
| Lymphography | 50.05% | 64.87% | 58.11% | 72.30% |
| Diabetes | 66.02% | 37.11% | 58.47% | 67. 89% |
| Indian | 30.37% | 66.03% | 46.14% | 70.65% |
| Haberman’s Survival | 49.02% | 50.33% | 42.81% | 60.13% |
| BCW | 65.96% | 61.52% | 41.35% | 96.57% |
| Post-operative Patient | 61.11% | * | 72.22% | 73.33% |
| Parkinsons | 74.36% | 54.87% | 69.04% | 75.90% |
| EEG Eyes State | 55.28% | 49.71% | 50.82% | 57.61% |
RDUL has the highest recognition rate of 96.5M% on BCW, while if we consider the other algorithms, FCM achieves 74.36% on Parkinsons data, and Robust-FCM achieves 72.22% on Post-operative Patient dataset. *Indicates that it is not possible to learn Post-Operative Patient dataset by using the PCM algorithm.
For the Lymphography dataset, there really exist four clusters in which two classes are considered rare (classes 1 and 4) given their small size [28], [29]. Class 1 contains two items, and class 4 contains four. The RDUFL detects these six outliers, whereas the robust-FCM detects five outliers in which only two items belong to the rare classes. The PCM does not recognize any rare classes of this set.
For the BCW dataset, the concept of proximity degree allows detecting 18 possible outliers, which were isolated and not considered in the learning phase. The algorithm clusters the dataset into two clusters. The comparison of the 18 possible outliers with the prototypes of detected clusters demonstrates that these items had enough characteristics in common with these detected prototypes. Therefore, they are not true outliers.
We recreate a very unbalanced distribution of the breast cancer data by choosing one in every six malignant records [29]. The result dataset has 39 malignant records (8%) and 444 benign records (92%). For testing the RDUFL, different values of possible outliers are considered instead of excluding all possible outliers. To evaluate cluster solutions, we measured the sensitivity and the specificity defined by:
where:
Sensitivity is the ability to correctly identify ill patients.
Specificity is the ability to correctly identify patients without the disease.
The RDUFL detects anomalies for this dataset and identifies outliers (small class) for each considered value of possible outliers. We report the results in Table 4.
Moreover, the RDUFL can improve considerably the performance of clustering and allows an increase of 30.61% on the BCW dataset. Those results show that the adopted approach can lead to an increase in accuracy for class discovering even in the absence of outliers. Indeed, the RDFUFL improves learning and yields a good recognition rate as depicted in Table 5. The recognition rates of each of the studied learning algorithms are also reported, for each dataset, in Table 5.
The accuracy percentage is also determined for each algorithm, based on the values of the equation [Eq. (29)]. The results of the considered algorithms are shown in Table 6. According to this table, we say that RDUFL has the highest accuracy percentage.
Accuracy Percentage Obtained for the Considered Data.
| Data set | FCM | PCM | Robust-FCM | RDUFL |
|---|---|---|---|---|
| Lymphography | * | * | * | 70% |
| Diabetes | 66% | 44% | 61% | 66% |
| Indian | 69% | 66% | 45% | 76% |
| Haberman’s Survival | 48% | 49% | 42% | 59% |
| BCW | 95% | 65% | 76% | 95% |
| Post-operative Patient | * | * | * | 70% |
| Parkinsons | 74% | 55% | 73% | 75% |
| EEG Eyes State | 55% | 50% | 51% | 58% |
*Indicates that it is not possible to learn Post-Operative Patient dataset by using the PCM algorithm.
5 Conclusion
In this paper, we introduced an adapted approach in order to partition a dataset and detect outliers. This approach consists of three stages. The first stage is a method of pre-treatment, which identifies objects that are likely to be considered possible outliers by utilizing the concept of proximity degree. The second stage is an unsupervised fuzzy learning algorithm, which detects existing classes formed by the data without possible outliers. In this stage, the algorithm equally provides the prototypes of these detected classes and the membership degrees of each object to these classes. The creation of classes is carried out according to a dynamic threshold, which is recalculated at each iteration of the algorithm. This threshold is based on the similarity among the prototypes updated at the exploration of a new object. As for the last stage, it consists in comparing the similarity of each possible outlier to the farthest object belonging to the class that corresponds to its nearest prototype. The experimental results demonstrated the effectiveness of the proposed approach especially that it does not require any user-specified parameter.
Future work will introduce the notion of granular computing [18], [24], [46], [55] to quantify the imprecision and the tolerance of uncertainty in the given large attribute dataset [2], [37], [49]. Indeed, granularity allows simplification, clarity, low cost, and tolerance of uncertainty [36]. It “underlies the remarkable human ability to make rational decisions in an environment of imprecision” [36]. Thereby, a new robust fuzzy algorithm for unsupervised learning using granular computing techniques will be developed.
Bibliography
[1] F. Angiulli, S. Basta and C. Pizzuti, Distance-based detection and prediction of outliers, IEEE Trans. Knowl. Data Eng. 18 (2006), 145–160.10.1145/1066677.1066797Search in Google Scholar
[2] M. Antonelli, P. Ducange, B. Lazzerini, and F. Marcelloni, Multi-objective evolutionary multiplicative aggregation in group decision making design of granular rule-based classifiers, Granul. Comput. 1 (2016), 37–58.10.1007/s41066-015-0004-zSearch in Google Scholar
[3] S. Ben-David and N. Haghtalab, Clustering in the presence of background noise, in: Proceedings of the 31st International Conference on Machine Learning, vol. 32, pp. 280–288, Bejing, China, 2014.Search in Google Scholar
[4] M. Benrabh, A. Bouroumi and A. Hamdoun, A fuzzy validity-guided procedure for cluster detection, Malays. J. Comput. Sci. 18 (2005), 31–39.Search in Google Scholar
[5] M. Berthold, Fuzzy models and potential outliers, in: Proceedings 18th International Conference of the North American Fuzzy Information Processing Society, NAFIPS, pp. 532–535, IEEE Press, New York, USA, 1999.Search in Google Scholar
[6] J. C. Bezdek, Pattern recognition with fuzzy objective function algorithms, Plenum Press, New York, 1981.10.1007/978-1-4757-0450-1Search in Google Scholar
[7] J. C. Bezdek, FCM: the fuzzy c-means clustering algorithm, Comput. Geosci. 10 (1984), 191–203.10.1016/0098-3004(84)90020-7Search in Google Scholar
[8] C. L. Blake and C. J. Merz, UCI repository of machine learning databases, University of California, Irvine, Department of Information and Computer Sciences (1998). http://www.ics.uci.edu/mlearn/MLRepository.html.Search in Google Scholar
[9] R. J. Bolton and D. J. Hand, Statistical fraud detection: a review, Stat. Sci. 17 (2002), 235–255.10.1214/ss/1042727940Search in Google Scholar
[10] A. Bouroumi, M. Limouri and A. Essaïd, Unsupervised fuzzy learning and cluster seeking, Intell. Data Anal. 4 (2000), 241–253.10.3233/IDA-2000-43-406Search in Google Scholar
[11] M. M. Breunig, H. P. Kriegel, R. T. Ng and J. Sander, LOF: identifying density-based local outliers, in: Proceedings of the International Conference on Management of Data, pp. 93–104, Dallas, TX, USA, May 15–18, 2000.10.1145/335191.335388Search in Google Scholar
[12] S. M. Chen and J. H. Chen, Fuzzy risk analysis based on similarity measures between interval-valued fuzzy numbers and interval-valued fuzzy number arithmetic operators, Exp. Syst. Appl. 36 (2009), 6309–6317.10.1016/j.eswa.2008.08.017Search in Google Scholar
[13] S. M. Chen and C. Y. Chien, Parallelized genetic ant colony systems for solving the traveling salesman problem, Exp. Sys. Appl. 38 (2011), 3873–3883.10.1016/j.eswa.2010.09.048Search in Google Scholar
[14] S. M. Chen and P. Y. Kao, TAIEX forecasting based on fuzzy time series, particle swarm optimization techniques and support vector machines. Inf. Sci. 247 (2013), 62–71.10.1016/j.ins.2013.06.005Search in Google Scholar
[15] S. M. Chen, N. Y. Wang and J. S. Pan, Forecasting enrollments using automatic clustering techniques and fuzzy logical relationships, Exp. Syst. Appl. 36 (2009), 11070–11076.10.1016/j.eswa.2009.02.085Search in Google Scholar
[16] T. Chenglong, Clustering of steel strip sectional profiles based on robust adaptive fuzzy clustering algorithm, Comput. Inf. 30 (2011), 357–380.Search in Google Scholar
[17] M. G. C. A. Cimino, G. Frosini, B. Lazzerini and F. Marcelloni, On the noise distance in robust fuzzy c-means, Int. J. Comput. Inf. Syst. Control Eng. 1 (2007), 217–220.Search in Google Scholar
[18] D. Ciucci, Orthopairs and granular computing, Granul. Comput. 1 (2016), 159–170.10.1007/s41066-015-0013-ySearch in Google Scholar
[19] R. N. Dave, Characterization and detection of noise in clustering. Pattern Recognit. Lett. 12 (1991), 657–664.10.1016/0167-8655(91)90002-4Search in Google Scholar
[20] R. N. Dave and R. Krishnapuram, Robust clustering methods: a unified view, IEEE Trans. Fuzzy Syst. 5 (1997), 270–293.10.1109/91.580801Search in Google Scholar
[21] R. N. Dave and S. Sen, Noise clustering algorithm revisited, in: Proceedings of the Annual Meeting of the North American Fuzzy Information Processing Society, pp. 199–204, Syracuse, NY, USA, September 21–24, 1997.Search in Google Scholar
[22] A. Dik, K. Jebari, A. Bouroumi and A. Ettouhami, A new fuzzy clustering by outliers, J. Eng. Appl. Sci. 9 (2014), 372–377.Search in Google Scholar
[23] A. Dik, A. El Moujahid, K. Jebari and A. Ettouhami, A new dynamic algorithm for unsupervised learning, Int. J. Innov. Comput. Inf. Control 11 (2015), 1325–1339.Search in Google Scholar
[24] D. Dubois and H. Prade, Bridging gaps between several forms of granular computing, Granul. Comput. 1 (2016), 115–126.10.1007/s41066-015-0008-8Search in Google Scholar
[25] A. El Imrani, A. Bouroumi, M. Limouri and A. Essaid, A coevolutionary genetic algorithm using fuzzy clustering, Int. J. Intell. Data Anal. 4 (2000), 183–193.10.3233/IDA-2000-43-402Search in Google Scholar
[26] A. Gosaina and S. Dahiya, Performance analysis of various fuzzy clustering algorithms: a review, Procedia Comput. Sci. 79 (2016), 100–111.10.1016/j.procs.2016.03.014Search in Google Scholar
[27] J. Han and M. Kamber, Data mining: concepts and techniques, 2nd ed., Morgan Kaufmann Publishers, San Francisco, 2006.Search in Google Scholar
[28] Z. He, X. Xu and S. Deng, Discovering cluster-based local outliers, Pattern Recognit. Lett. 24 (2003), 1641–1650.10.1016/S0167-8655(03)00003-5Search in Google Scholar
[29] Z. He, S. Deng and X. Xu, An optimization model for outlier detection in categorical data, in: Advances in Intelligent Computing., ICIC 2005, Lecture Notes in Computer Science, vol. 3644, D. S. Huang, X. P. Zhang and G. B. Huang (Eds.), Springer, Berlin, Heidelberg, 2005.10.1007/11538059_42Search in Google Scholar
[30] Y. J. Horng, S. M. Chen, Y. C. Chang and C. H. Lee, A new method for fuzzy information retrieval based on fuzzy hierarchical clustering and fuzzy inference techniques, IEEE Trans. Fuzzy Syst. 13 (2005) 216–228.10.1109/TFUZZ.2004.840134Search in Google Scholar
[31] A. K. Jain, Data clustering: 50 years beyond k-means, Pattern Recognit. Lett. 31 (2010), 651–666.10.1007/978-3-540-87479-9_3Search in Google Scholar
[32] J.-M. Jolion and A. Rosenfeld, Cluster detection in background noise, Pattern Recognit. 22 (1989), 603–607.10.1016/0031-3203(89)90028-9Search in Google Scholar
[33] E. M. Knorr and R. T. Ng, Algorithms for mining distance-based outliers in large dataset, in: Proceedings of the 24rd International Conference on Very Large Data Bases, pp. 392–403, San Francisco, CA, USA, August 24–27, 1998.Search in Google Scholar
[34] R. Krishnapuram and J. Keller, A possibilistic approach to clustering, IEEE Trans. Fuzzy Syst. 1 (1993), 98–110.10.1109/91.227387Search in Google Scholar
[35] T. Lane and C. E. Brodley, Temporal sequence learning and data reduction for anomaly detection, ACM Trans. Inform. Syst. Secur. 2 (1999), 295–331.10.1145/288090.288122Search in Google Scholar
[36] P. Lingras, F. Haider and M. Triff, Granular meta-clustering based on hierarchical, network, and temporal connections, Granul. Comput. 1 (2016), 71–92.10.1007/s41066-015-0007-9Search in Google Scholar
[37] L. Livi and A. Sadeghian, Granular computing, computational intelligence, and the analysis of non-geometric input spaces, Granul. Comput. 1 (2016), 13–20.10.1007/s41066-015-0003-0Search in Google Scholar
[38] A. Loureiro, L. Torgo and C. Soares, Outlier detection using clustering methods: a data cleaning application, in: Proceedings of KDNet Symposium on Knowledge-Based Systems for the Public Sector, Bonn, Germany, June 3–4, 2004.Search in Google Scholar
[39] F. Morsier, D. Tuia, M. Borgeaud, V. Gass and J. P. Thiran, Cluster validity measure and merging system for hierarchical clustering considering outliers, Pattern Recognit. 48 (2015), 1478–1489.10.1016/j.patcog.2014.10.003Search in Google Scholar
[40] L. Ott, L. Pang, F. Ramos and S. Chawla, On integrated clustering and outlier detection, Adv. Neural Inf. Process. Syst. 27 (2014), 1359–1367.Search in Google Scholar
[41] N. R. Pal, K. Pal, J. M. Keller and J. C. Bezdek, A possibilistic fuzzy c-means clustering algorithm, IEEE Trans. Fuzzy Syst. 13 (2005), 517–530.10.1109/TFUZZ.2004.840099Search in Google Scholar
[42] G. Peters and R. Weber, DCC: a framework for dynamic granular clustering, Granul. Comput. 1 (2016), 1–11.10.1007/s41066-015-0012-zSearch in Google Scholar
[43] S. Ramaswamy, R. Rastogi and K. Shim, Efficient algorithms for mining outliers from large data sets, in: Proceedings of SIGMOD’00, pp. 93–104, Dallas, Texas, 2000.10.1145/342009.335437Search in Google Scholar
[44] S. Ramaswamy, R. Rastogi and K. Shim, Efficient algorithms for mining outliers from large data sets, in: Proceedings of the International Conference on Management of Data, pp. 427–438, Dallas, TX, USA, May 15–18, 2000.10.1145/335191.335437Search in Google Scholar
[45] F. Rehm, F. Klawonn and R. Kruse, A novel approach to noise clustering for outlier detection, Soft Comput. 11 (2007), 489–494.10.1007/s00500-006-0112-4Search in Google Scholar
[46] A. Skowron, A. Jankowski and S. Dutta, Interactive granular computing, Granul. Comput. 1 (2016), 95–113.10.1007/978-3-319-25754-9_5Search in Google Scholar
[47] C. Tang, S. Wang and Y. Chen, Clustering of steel strip sectional profiles based on robust adaptive fuzzy clustering algorithm, Comput. Inform. 30 (2012), 357–380.Search in Google Scholar
[48] P. W. Tsai, J. S. Pan, S. M. Chen, B. Y. Liao and S. P. Hao, Parallel cat swarm optimization, in: Proceedings of the seventh International Conference on Machine Learning and Cybernetics, vol. 6, pp. 3328–3333, Kunming, China, 2008.Search in Google Scholar
[49] G. Wang, J. Yang and J. Xu, Granular computing: from granularity optimization to multi-granularity joint problem solving, Granul. Comput. 2 (2017), 105–120.10.1007/s41066-016-0032-3Search in Google Scholar
[50] Y. J. Xu, L. Chen, R. M. Rodríguez, F. Herrera and H. M. Wang, Deriving the priority weights from incomplete hesitant fuzzy preference relations in group decision making, Knowl. Based Syst. 99 (2016), 71–78.10.1016/j.knosys.2016.01.047Search in Google Scholar
[51] Y. J. Xu, J. F. Cabrerizo and E. Herrera-Viedma, A consensus model for hesitant fuzzy preference relations and its application in water allocation management, Appl. Soft Comput. 58 (2017), 265–284.10.1016/j.asoc.2017.04.068Search in Google Scholar
[52] Y. J. Xu, X. Liu and H. M. Wang, The additive consistency measure of fuzzy reciprocal preference relations, Int. J. Mach. Learn. Cybern. 9 (2017), 1141–1152.10.1007/s13042-017-0637-0Search in Google Scholar
[53] Y. J. Xu, C. Y. Li and X. W. Wen, Missing values estimation and consensus building for incomplete hesitant fuzzy preference relations with multiplicative consistency, Int. J. Comput. Intell. Syst. 11 (2018), 101–119.10.2991/ijcis.11.1.9Search in Google Scholar
[54] Y. J. Xu, X. W. Wen and W. C. Zhang, A two-stage consensus method for large-scale multi-attribute group decision making with an application to earthquake shelter selection, Comput. Ind. Eng. 116 (2018), 113–129.10.1016/j.cie.2017.11.025Search in Google Scholar
[55] Y. Yao, A triarchic theory of granular computing, Granul. Comput. 1 (2016), 145–157.10.1007/s41066-015-0011-0Search in Google Scholar
[56] J. Yu, S. H. Lee and M. Jeon, An adaptive ACO-based fuzzy clustering algorithm for noisy image segmentation, Int. J. Innov. Comput. Inf. Control 8 (2012), 3907–3918.Search in Google Scholar
[57] L. A. Zadeh, Fuzzy sets, Inf. Control 8 (1965), 338–353.10.21236/AD0608981Search in Google Scholar
[58] W. C. Zhang, Y. J. Xu and H. M. Wang, A consensus reaching model for 2-tuple linguistic multiple attribute group decision making with incomplete weight information, Int. J. Syst. Sci. 47 (2016), 389–405.10.1080/00207721.2015.1074761Search in Google Scholar
©2020 Walter de Gruyter GmbH, Berlin/Boston
This work is licensed under the Creative Commons Attribution 4.0 Public License.
Articles in the same Issue
- An Optimized K-Harmonic Means Algorithm Combined with Modified Particle Swarm Optimization and Cuckoo Search Algorithm
- Texture Feature Extraction Using Intuitionistic Fuzzy Local Binary Pattern
- Leaf Disease Segmentation From Agricultural Images via Hybridization of Active Contour Model and OFA
- Deadline Constrained Task Scheduling Method Using a Combination of Center-Based Genetic Algorithm and Group Search Optimization
- Efficient Classification of DDoS Attacks Using an Ensemble Feature Selection Algorithm
- Distributed Multi-agent Bidding-Based Approach for the Collaborative Mapping of Unknown Indoor Environments by a Homogeneous Mobile Robot Team
- An Efficient Technique for Three-Dimensional Image Visualization Through Two-Dimensional Images for Medical Data
- Combined Multi-Agent Method to Control Inter-Department Common Events Collision for University Courses Timetabling
- An Improved Particle Swarm Optimization Algorithm for Global Multidimensional Optimization
- A Kernel Probabilistic Model for Semi-supervised Co-clustering Ensemble
- Pythagorean Hesitant Fuzzy Information Aggregation and Their Application to Multi-Attribute Group Decision-Making Problems
- Using an Efficient Optimal Classifier for Soil Classification in Spatial Data Mining Over Big Data
- A Bayesian Multiresolution Approach for Noise Removal in Medical Magnetic Resonance Images
- Gbest-Guided Artificial Bee Colony Optimization Algorithm-Based Optimal Incorporation of Shunt Capacitors in Distribution Networks under Load Growth
- Graded Soft Expert Set as a Generalization of Hesitant Fuzzy Set
- Universal Liver Extraction Algorithm: An Improved Chan–Vese Model
- Software Effort Estimation Using Modified Fuzzy C Means Clustering and Hybrid ABC-MCS Optimization in Neural Network
- Handwritten Indic Script Recognition Based on the Dempster–Shafer Theory of Evidence
- An Integrated Intuitionistic Fuzzy AHP and TOPSIS Approach to Evaluation of Outsource Manufacturers
- Automatically Assess Day Similarity Using Visual Lifelogs
- A Novel Bio-Inspired Algorithm Based on Social Spiders for Improving Performance and Efficiency of Data Clustering
- Discriminative Training Using Noise Robust Integrated Features and Refined HMM Modeling
- Self-Adaptive Mussels Wandering Optimization Algorithm with Application for Artificial Neural Network Training
- A Framework for Image Alignment of TerraSAR-X Images Using Fractional Derivatives and View Synthesis Approach
- Intelligent Systems for Structural Damage Assessment
- Some Interval-Valued Pythagorean Fuzzy Einstein Weighted Averaging Aggregation Operators and Their Application to Group Decision Making
- Fuzzy Adaptive Genetic Algorithm for Improving the Solution of Industrial Optimization Problems
- Approach to Multiple Attribute Group Decision Making Based on Hesitant Fuzzy Linguistic Aggregation Operators
- Cubic Ordered Weighted Distance Operator and Application in Group Decision-Making
- Fault Signal Recognition in Power Distribution System using Deep Belief Network
- Selector: PSO as Model Selector for Dual-Stage Diabetes Network
- Oppositional Gravitational Search Algorithm and Artificial Neural Network-based Classification of Kidney Images
- Improving Image Search through MKFCM Clustering Strategy-Based Re-ranking Measure
- Sparse Decomposition Technique for Segmentation and Compression of Compound Images
- Automatic Genetic Fuzzy c-Means
- Harmony Search Algorithm for Patient Admission Scheduling Problem
- Speech Signal Compression Algorithm Based on the JPEG Technique
- i-Vector-Based Speaker Verification on Limited Data Using Fusion Techniques
- Prediction of User Future Request Utilizing the Combination of Both ANN and FCM in Web Page Recommendation
- Presentation of ACT/R-RBF Hybrid Architecture to Develop Decision Making in Continuous and Non-continuous Data
- An Overview of Segmentation Algorithms for the Analysis of Anomalies on Medical Images
- Blind Restoration Algorithm Using Residual Measures for Motion-Blurred Noisy Images
- Extreme Learning Machine for Credit Risk Analysis
- A Genetic Algorithm Approach for Group Recommender System Based on Partial Rankings
- Improvements in Spoken Query System to Access the Agricultural Commodity Prices and Weather Information in Kannada Language/Dialects
- A One-Pass Approach for Slope and Slant Estimation of Tri-Script Handwritten Words
- Secure Communication through MultiAgent System-Based Diabetes Diagnosing and Classification
- Development of a Two-Stage Segmentation-Based Word Searching Method for Handwritten Document Images
- Pythagorean Fuzzy Einstein Hybrid Averaging Aggregation Operator and its Application to Multiple-Attribute Group Decision Making
- Ensembles of Text and Time-Series Models for Automatic Generation of Financial Trading Signals from Social Media Content
- A Flame Detection Method Based on Novel Gradient Features
- Modeling and Optimization of a Liquid Flow Process using an Artificial Neural Network-Based Flower Pollination Algorithm
- Spectral Graph-based Features for Recognition of Handwritten Characters: A Case Study on Handwritten Devanagari Numerals
- A Grey Wolf Optimizer for Text Document Clustering
- Classification of Masses in Digital Mammograms Using the Genetic Ensemble Method
- A Hybrid Grey Wolf Optimiser Algorithm for Solving Time Series Classification Problems
- Gray Method for Multiple Attribute Decision Making with Incomplete Weight Information under the Pythagorean Fuzzy Setting
- Multi-Agent System Based on the Extreme Learning Machine and Fuzzy Control for Intelligent Energy Management in Microgrid
- Deep CNN Combined With Relevance Feedback for Trademark Image Retrieval
- Cognitively Motivated Query Abstraction Model Based on Associative Root-Pattern Networks
- Improved Adaptive Neuro-Fuzzy Inference System Using Gray Wolf Optimization: A Case Study in Predicting Biochar Yield
- Predict Forex Trend via Convolutional Neural Networks
- Optimizing Integrated Features for Hindi Automatic Speech Recognition System
- A Novel Weakest t-norm based Fuzzy Fault Tree Analysis Through Qualitative Data Processing and Its Application in System Reliability Evaluation
- FCNB: Fuzzy Correlative Naive Bayes Classifier with MapReduce Framework for Big Data Classification
- A Modified Jaya Algorithm for Mixed-Variable Optimization Problems
- An Improved Robust Fuzzy Algorithm for Unsupervised Learning
- Hybridizing the Cuckoo Search Algorithm with Different Mutation Operators for Numerical Optimization Problems
- An Efficient Lossless ROI Image Compression Using Wavelet-Based Modified Region Growing Algorithm
- Predicting Automatic Trigger Speed for Vehicle-Activated Signs
- Group Recommender Systems – An Evolutionary Approach Based on Multi-expert System for Consensus
- Enriching Documents by Linking Salient Entities and Lexical-Semantic Expansion
- A New Feature Selection Method for Sentiment Analysis in Short Text
- Optimizing Software Modularity with Minimum Possible Variations
- Optimizing the Self-Organizing Team Size Using a Genetic Algorithm in Agile Practices
- Aspect-Oriented Sentiment Analysis: A Topic Modeling-Powered Approach
- Feature Pair Index Graph for Clustering
- Tangramob: An Agent-Based Simulation Framework for Validating Urban Smart Mobility Solutions
- A New Algorithm Based on Magic Square and a Novel Chaotic System for Image Encryption
- Video Steganography Using Knight Tour Algorithm and LSB Method for Encrypted Data
- Clay-Based Brick Porosity Estimation Using Image Processing Techniques
- AGCS Technique to Improve the Performance of Neural Networks
- A Color Image Encryption Technique Based on Bit-Level Permutation and Alternate Logistic Maps
- A Hybrid of Deep CNN and Bidirectional LSTM for Automatic Speech Recognition
- Database Creation and Dialect-Wise Comparative Analysis of Prosodic Features for Punjabi Language
- Trapezoidal Linguistic Cubic Fuzzy TOPSIS Method and Application in a Group Decision Making Program
- Histopathological Image Segmentation Using Modified Kernel-Based Fuzzy C-Means and Edge Bridge and Fill Technique
- Proximal Support Vector Machine-Based Hybrid Approach for Edge Detection in Noisy Images
- Early Detection of Parkinson’s Disease by Using SPECT Imaging and Biomarkers
- Image Compression Based on Block SVD Power Method
- Noise Reduction Using Modified Wiener Filter in Digital Hearing Aid for Speech Signal Enhancement
- Secure Fingerprint Authentication Using Deep Learning and Minutiae Verification
- The Use of Natural Language Processing Approach for Converting Pseudo Code to C# Code
- Non-word Attributes’ Efficiency in Text Mining Authorship Prediction
- Design and Evaluation of Outlier Detection Based on Semantic Condensed Nearest Neighbor
- An Efficient Quality Inspection of Food Products Using Neural Network Classification
- Opposition Intensity-Based Cuckoo Search Algorithm for Data Privacy Preservation
- M-HMOGA: A New Multi-Objective Feature Selection Algorithm for Handwritten Numeral Classification
- Analogy-Based Approaches to Improve Software Project Effort Estimation Accuracy
- Linear Regression Supporting Vector Machine and Hybrid LOG Filter-Based Image Restoration
- Fractional Fuzzy Clustering and Particle Whale Optimization-Based MapReduce Framework for Big Data Clustering
- Implementation of Improved Ship-Iceberg Classifier Using Deep Learning
- Hybrid Approach for Face Recognition from a Single Sample per Person by Combining VLC and GOM
- Polarity Analysis of Customer Reviews Based on Part-of-Speech Subcategory
- A 4D Trajectory Prediction Model Based on the BP Neural Network
- A Blind Medical Image Watermarking for Secure E-Healthcare Application Using Crypto-Watermarking System
- Discriminating Healthy Wheat Grains from Grains Infected with Fusarium graminearum Using Texture Characteristics of Image-Processing Technique, Discriminant Analysis, and Support Vector Machine Methods
- License Plate Recognition in Urban Road Based on Vehicle Tracking and Result Integration
- Binary Genetic Swarm Optimization: A Combination of GA and PSO for Feature Selection
- Enhanced Twitter Sentiment Analysis Using Hybrid Approach and by Accounting Local Contextual Semantic
- Cloud Security: LKM and Optimal Fuzzy System for Intrusion Detection in Cloud Environment
- Power Average Operators of Trapezoidal Cubic Fuzzy Numbers and Application to Multi-attribute Group Decision Making