FCNB: Fuzzy Correlative Naive Bayes Classifier with MapReduce Framework for Big Data Classification
-
 and
and

Abstract
The term “big data” means a large amount of data, and big data management refers to the efficient handling, organization, or use of large volumes of structured and unstructured data belonging to an organization. Due to the gradual availability of plenty of raw data, the knowledge extraction process from big data is a very difficult task for most of the classical data mining and machine learning tools. In a previous paper, the correlative naive Bayes (CNB) classifier was developed for big data classification. This work incorporates the fuzzy theory along with the CNB classifier to develop the fuzzy CNB (FCNB) classifier. The proposed FCNB classifier solves the big data classification problem by using the MapReduce framework and thus achieves improved classification results. Initially, the database is converted to the probabilistic index table, in which data and attributes are presented in rows and columns, respectively. Then, the membership degree of the unique symbols present in each attribute of data is found. Finally, the proposed FCNB classifier finds the class of data based on training information. The simulation of the proposed FCNB classifier uses the localization and skin segmentation datasets for the purpose of experimentation. The results of the proposed FCNB classifier are analyzed based on the metrics, such as sensitivity, specificity, and accuracy, and compared with the various existing works.
1 Introduction
Data mining [6] has become a prevailing technique for the discovery of valuable information available on network platforms. Big data [6] significantly promotes the traditional industries to achieve better progressiveness, and hence data retrieval from the big data environment is necessary. The term “big data” is derived from the phrase “a large amount of data,” usually in zettabytes processed in a year. Hence, data management options should be openly available to each organization for better handling of big data [15], [22]. The data can be concluded as big data based on the factors of volume, velocity, variety, and veracity. Also, big data from Internet sources arrives in a continuous pattern, and thus the processing of data is more difficult [5].
Data mining schemes come under two major categories: clustering and classification. Various classifiers, such as support vector machine [13], naive Bayes (NB) [24], and extreme learning machine (ELM) [12] primarily contribute toward big data classification [9], [11]. The ELM [5] algorithm provides multiclassification of data rather than binary classification [6]. While processing data with high volume, the computational complexity of algorithms is increased [1]. The supervised classification approaches classify big data through a learning algorithm, and thus finds the suitable classes for the database [7]. The prevailing problem by the large size of data can be solved by introducing MapReduce schemes. Google introduces the MapReduce [1], [3], [14], [25], [29] framework for mining data of size larger than petabytes. MapReduce contains the mapper and reducer for the parallel processing of the datasets [4].
Big data include the collection of data from different fields, and the employment of the classification algorithm solves the data mining issues in big data. The main idea behind the classification task is to build a model (classifier) that classifies the data with the goal to accurately predict the target class for each item in the data [14]. There are many techniques, such as decision trees, Bayes networks, genetic algorithms, genetic programming, and so on, to comply with the classification of big data [1]. The properties, such as continuity and distributed blocks, present in the big data pose additional challenges to the ELM algorithms [5]. The big data also has imbalanced datasets and the fuzzy rule-based classification systems (FRBCS) [17], [18], denoted as Chi-FRBCS-Big Data CS, have achieved significant results during the classification of the imbalanced big data [18]. Literature work has also discussed the MapReduce-based fuzzy c-means clustering [19], k-nearest neighbor algorithm [20], fuzzy associative classifier [23], machine learning tools [28], and Chi-FRBCS-BigData algorithm [8] for big data classification.
The primary contribution of this research is the development of the fuzzy correlative NB classifier (FCNB) for big data classification. The proposed model permits the MapReduce framework to deal with the big data.
The paper organization is done in the following manner: Section 1 presents the introduction to the big data classification model. Section 2 presents the proposed FCNB algorithm along with the MapReduce framework for the big data classification. Section 3 presents various simulation results obtained for the proposed FCNB classifier based on the evaluation metrics. Section 4 concludes the research work.
2 Proposed Method: Proposed FCNB Classifier with the MapReduce Framework for Big Data Classification
This research work deals with big data classification with the proposed FCNB classifier. The proposed FCNB classifier is the extensive work of the correlative NB (CNB) classifier defined in Ref. [2]. The FCNB classifier is developed by integrating the CNB classifier and the fuzzy theory [9]. Also, this work includes the MapReduce framework for dealing with the big data. In data mining and the cloud environment, there is a continuous flow of data. The existing fuzzy NB (FNB) classifier has various merits, such as dealing with the missing attributes of the data sample, incremental learning, and performing the training with low data samples. In the proposed work, the FNB classifier is modified by adding the correlation between the data samples. This makes the proposed FCNB algorithm a dependent hypothesis. As the research allows the classification of big data, the inclusion of the MapReduce framework is necessary. The MapReduce framework eliminates the problem of the classification of a large dataset and the storage problems.
2.1 Algorithmic Description of the Proposed FCNB Classifier
The proposed FCNB classifier gets the training data from various sources as the input. The training data needs to be represented as the probability index table. The probability index table represents the data samples as the data matrix. The rows and columns of the probability index table represent the data and their respective attributes. The training sample for the proposed FCNB classifier is represented as follows:
where the term Tp,q represents the pth data sample in the qth attribute of the probability index table. The terms d and a represent the total data samples and the attributes present in the training dataset, respectively. The proposed model aims at classifying the data samples into various classes. Equation (2) expresses the classes indicated in the vector form:
where the term gp represents the class of the pth data sample. The attributes present in the data sample contribute more toward the data classification. Consider the training data sample having a number of attributes; hence, the attributes of the data sample are represented as follows:
where the term hq represents the qth attribute of the data sample. The data samples categorized under each attribute have unique symbols. The proposed FCNB classifier calculates the fuzzy membership degree depending on the unique data symbols within the attribute. Consider that there is S number of unique data symbols within the attribute. For the calculation of the membership degree of the proposed FCNB classifier, consider the qth attribute in the training sample that contains s number of unique symbols. The symbols in the qth attribute are indicated by
where the term
where the term
2.1.1 Adapting the FNB Classifier with the Correlation Function
The existing FNB classifier utilizes the NB and the fuzzy-based approaches for the data classification. In this work, the proposed FCNB classifier adapts the FNB classifier with the virtual correlation function to make the proposed algorithm dependent on the hypothesis. Also, the correlation function makes the proposed algorithm an incremental learner. The proposed FCNB classifier finds the virtual correlation factor for each attribute present in the training database. Equation (6) expresses the virtual correlation between each attribute of the training data:
where the term Ck represents the virtual correlation of the attributes in the kth class. The term f(.) represents the correlation function. The correlation function between the attributes of the data samples is constructed by representing the attributes and the symbols of the training sample as the diagonal matrix. Equation (7) represents the correlation function between the attributes of the training data:
where the term
In this research work, the proposed FCNB classifier considers the correlation factor for finding the relation between the data samples present in the training data. The proposed FCNB classifier finds the correlation of the independent data sample present in the training set. The correlation factor for finding the relation between the unique symbols present in the attributes is represented as follows:
where the function
where the term
The membership degree for the attributes has the size of
2.2 Testing of the Proposed FCNB Classifier
This section presents the testing phase of the proposed FCNB classifier. The proposed FCNB algorithm utilizes the posterior probability of the NB classifier, the fuzzy membership degree, and the correlation function to classify the test data. For the training phase, the proposed FCNB classifier is provided with the test data represented as X. The proposed FCNB algorithm tries to classify the test data into K number of classes. The output of the proposed FCNB classifier is represented as follows:
where the term
where
where the term dom(G) represents the total number of classes and the term dom(hq) represents the total number of data symbols present in the qth attribute.
2.3 Pseudo Code of the Proposed FCNB Classifier
This section presents the pseudo code of the proposed FCNB classifier. As shown in Algorithm 1, the proposed FCNB classifier classifies the data into K number of classes. In the training phase, the proposed FCNB classifier gets the training data T as the input. For the training data, the membership degree and the correlative function are calculated. In the testing phase, the probability index of the test data is calculated and based on the classification output in Eq. (13), the class of the test data is found by the proposed FCNB classifier.
Pseudo Code of the Proposed FCNB Classifier.
| Algorithm: FCNB classifier | |
|---|---|
| Serial no. | Steps |
| 1 | Input: Data sample: T |
| 2 | Output: class: |
| 3 | Begin |
| 4 | // Training phase |
| 5 | Read the training data T |
| 6 | For (p = 1 to d) |
| 7 | Read the data samples |
| 8 | For (q = 1 to a) |
| 9 | Read the attributes |
| 10 | Calculate the membership degree of the qth attribute |
| 11 | Calculate the membership degree of the ground value |
| 12 | Calculate the correlation factor Ck |
| 13 | End for |
| 14 | End for |
| 15 | //Testing phase |
| 16 | Read the test input X |
| 17 | Calculate the probability index of the class |
| 18 | Find the class G for the test data using Eq. (13) |
| 19 | Return the class G |
| 20 | End |
2.4 Adapting the FCNB Classifier in the MapReduce Framework
The application of the proposed FCNB classifier to the concept of the big data classification can be achieved by introducing the MapReduce framework in the proposed FCNB classifier. The MapReduce framework has the mapper and the reducer that allow the simultaneous functioning of the large dataset. This research performs big data classification through the training and testing phases of the proposed FCNB classifier. In the training phase, the training data T is fed to the MapReduce function. Figure 1 presents the architecture of the proposed FCNB classifier enabled with the MapReduce for the training phase.
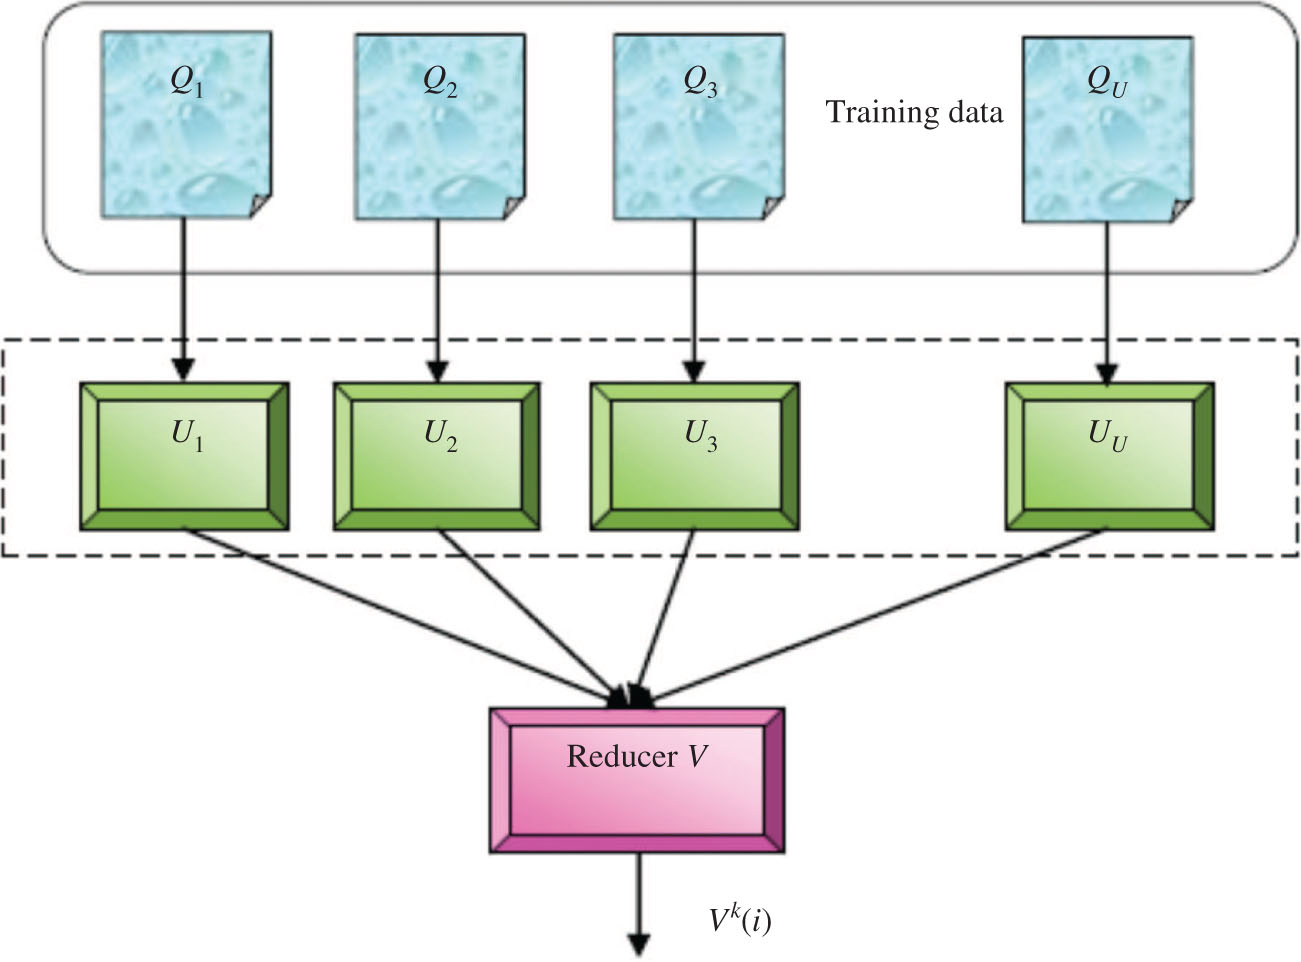
Training of the FCNB-Based MapReduce Framework.
Testing of the FCNB-Based MapReduce Framework.
2.4.1 Training Phase
Training of the mapper: The mapper present in Figure 2 gets the training data as the input. The training data is represented in the matrix, with the rows indicating the data and the columns indicating the attributes. The training data to the mapper of the proposed FCNB classifier is represented as given in Eq. (17). As the data that arrives at the proposed classifier is a continuous data, the size of the data is very large. Hence, the data requires partitioning. In this work, the training data sample T is partitioned into U parts. Each part of the training sample is represented by the following expression:
where the term Qi represents the ith part of the data matrix. Each partitioned data is provided to the mapper of the proposed model. Hence, the number of mappers in the model equals the number of data sample parts. Consider that the proposed model has U mappers and V reducers. The data present in the mapper is represented by the following expression:
where the term nb,q represents the part of the data provided to the ith mapper. The value of b varies based on the data present in the mapper Ai. The mappers present in the proposed classification model find the classes from the training data. Each mapper provides the data to the reducer of size
where μq(i) represents the membership degree of the qth attribute for the data sample i, μc(i) shows the membership degree for the ground value, C(i) represents the correlation factor, and the term Ai indicates the number of data present in the mapper i.
Training of the reducer: For the training of the reducer, the outputs of each mapper are provided to the V reducers in the proposed model. The probability index table obtained from the mapper is of size
where the terms
where the term Vk(i) represents the classified output of the data part i.
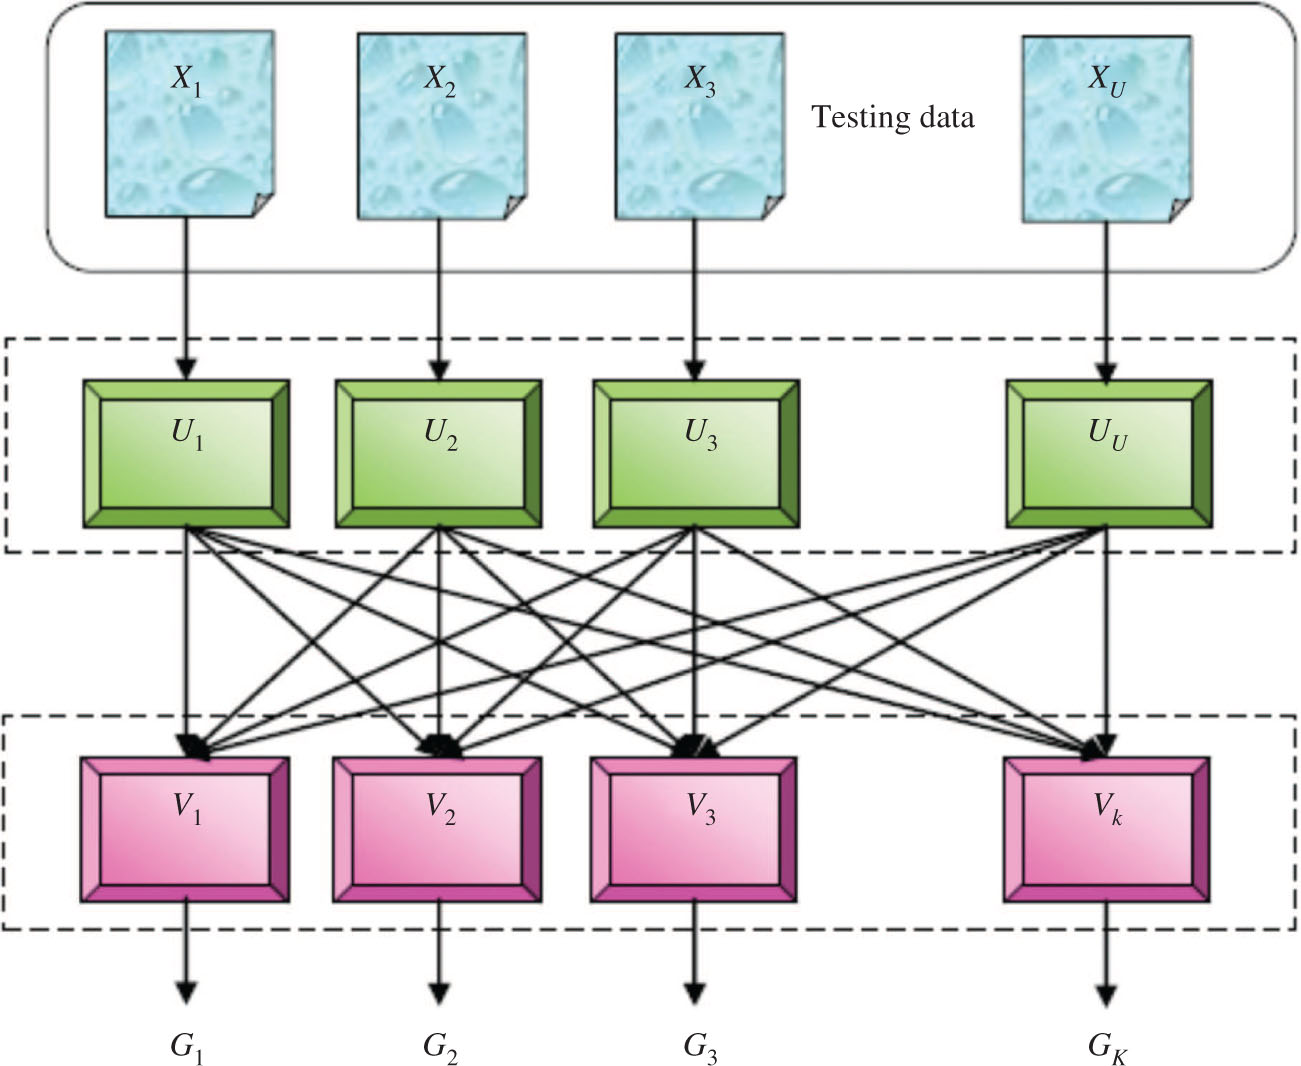
2.4.2 Testing Phase
The testing phase of the proposed FCNB classifier with the MapReduce is explained in this section. Figure 2 presents the MapReduce framework with the proposed FCNB classifier during the testing phase. For the testing, the test data X is provided to the MapReduce framework.
Testing of the mapper: The test data provided to the mapper is represented as X. Initially, the test data X is subjected for the partitioning and is expressed as follows:
where the term Xx represents the xth part of the test data X. The test data contains d number of data samples and a number of attributes. For the test data, the membership degree, the correlative function, and the number of data for each mapper are calculated. Finally, the mapper provides the information to the reducer.
Testing of the reducer: In the testing phase, the output of the mapper is fed to the reducer. The reducer merges the information and provides the information about the class variable of each part of the test data sample. The reducer provides K number of classes and is represented as follows:
3 Results and Discussion
The simulation results achieved by the proposed FCNB classifier are presented in this section, which also contains the results of the comparative discussion achieved by analyzing the results of various comparative models.
3.1 Experimental Setups
Experimental setup 1: The experimentation setup 1 contains a set of four mappers for analyzing the performance of different algorithms.
Experimental setup 2: The experimentation setup 2 contains a set of five mappers for the simulation purpose.
The entire experimentation is done on the Java platform installed in a personal computer with the following configurations: Windows 10 OS, 4 GB Ram, and Intel I3 processor.
3.2 Dataset Description
The experimentation of the proposed FCNB classifier is done with the standard dataset localization dataset [16] and the skin segmentation dataset [26] utilized from the University of California, Irvine (UCI) machine repository, and their descriptions are provided as follows:
Localization dataset [16]: The localization dataset from the UCI machine repository contains information about the activities of the person, and is obtained through the observation of various persons wearing the data tag on their ankle, leg, etc. The localization dataset contains a large set of instances (total of 164,860) under eight attributes. Table 1 shows the description of the localization database.
Description of Localization Dataset.
| Dataset characteristics | Univariate, sequential, time series |
|---|---|
| Number of instances | 164,860 |
| Area | Life |
| Attribute characteristics | Real |
| Number of attributes | 8 |
| Associated tasks | Classification |
| Missing values | N/A |
Skin segmentation dataset [26]: This dataset is collected from people of various age groups with different skin colors. The learning sample taken for the experimentation varies as 245,057, and they are grouped under four attributes. This dataset is more suitable for big data classification as the simulation results can be categorized under the skin set and the non-skin set. Table 2 shows the description of the skin segmentation dataset.
Description of Skin Segmentation Dataset.
| Dataset characteristics | Univariate |
|---|---|
| Number of instances | 245,057 |
| Area | Computer |
| Attribute characteristics | Real |
| Number of attributes | 4 |
| Associated tasks | Classification |
| Missing values | N/A |
3.3 Comparative Models
The performance of the proposed FCNB classifier for big data classification is compared with various methods, such as NB [27], CNB [2], gray wolf optimization-based CNB (GWO-CNB), cuckoo gray wolf-based CNB (CGCNB), and FNB classifier [27]. The NB classifier performs data classification by defining the probabilistic definition, and the CNB classifier uses the correlative function along with the NB for making the suitable decision. Incorporating the GWO [21] with the CNB leads to the formation of the GWO-CNB classifier, and the optimization scheme is used for defining the class. The CGCNB classifier is designed with the integration of the cuckoo search (CS) algorithm and the GWO algorithm with the CNB. The FNB classifier uses the fuzzy theory along with the NB for the classification purpose.
3.4 Comparative Analysis
Comparative analysis is done by varying the training percentage of the localization and the skin datasets for the various numbers of mappers, and the performance of each model is measured by the sensitivity, specificity, and accuracy.
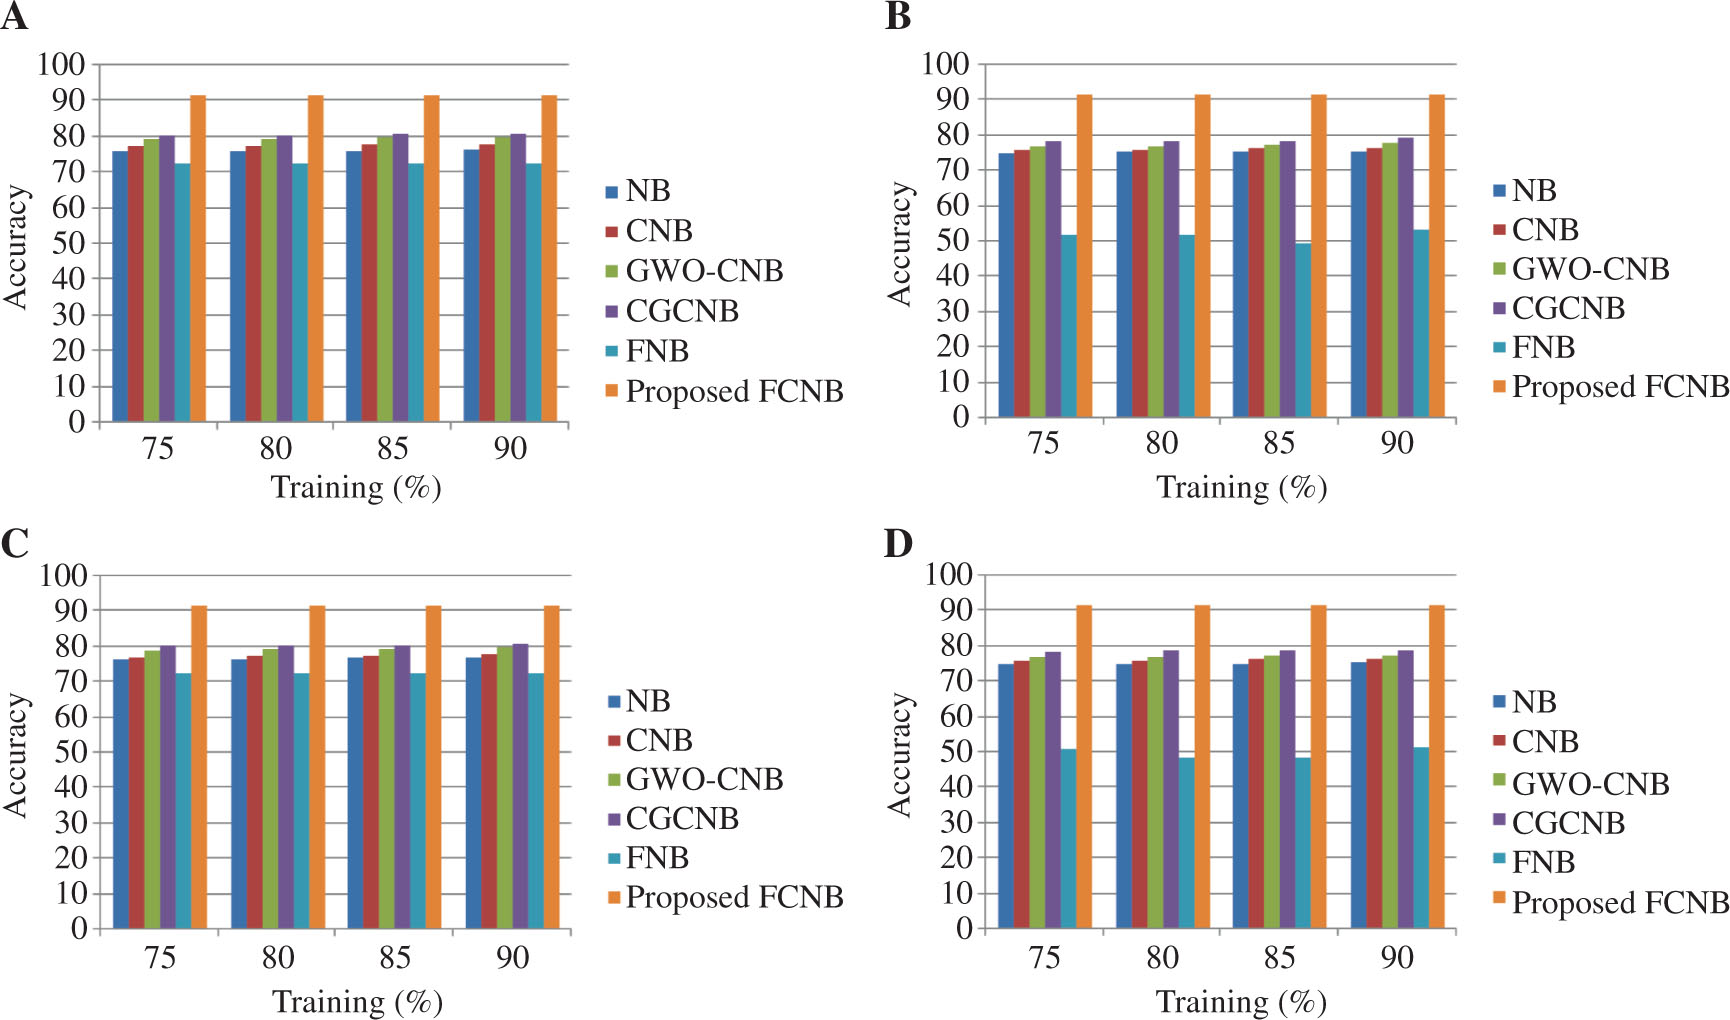
Comparative Analysis of the FCNB Classifier Based on Accuracy.
For mapper = 4 in (A) localization dataset and (B) skin dataset. For mapper = 5 in (C) localization dataset and (D) skin dataset.
3.4.1 Analysis Based on Accuracy
Figure 3 presents the comparative analysis of the proposed FCNB classifier based on the accuracy metric for the varying training percentages of the dataset and the mapper. Figure 3A presents the performance of the classifiers with the mapper size of 4 and varying training percentages of the localization dataset. For 90% training of the localization dataset, the existing NB, CNB, GWO-CNB, CGCNB, and FNB classifiers achieved accuracy values of 76.504%, 77.9505%, 79.862%, 80.8977%, and 72.33%, respectively, while the proposed FCNB classifier had an improved accuracy value of 91.7816%. Figure 3B presents the performance analysis of the classifiers in the skin dataset with mapper = 4. Here, the comparative models NB, CNB, GWO-CNB, CGCNB, and FNB classifiers achieved the accuracy values of 75.723%, 76.636%, 77.770%, 79.327%, and 53.45%, respectively; however, the proposed FCNB classifier achieved the accuracy value of 91.7817%. Figure 3C and D present the performance analysis of the classifiers in the localization and skin datasets for mapper = 5. For 90% training of the localization dataset, the existing NB, CNB, GWO-CNB, CGCNB, and FNB classifiers with five mappers achieved the accuracy values of 76.996%, 77.808%, 79.7638%, 80.6568%, and 72.3310%, respectively, while the proposed FCNB achieved the high accuracy value of 91.78164%. For the skin dataset, the proposed FCNB with mapper = 5 achieved an accuracy value of 91.78165%.
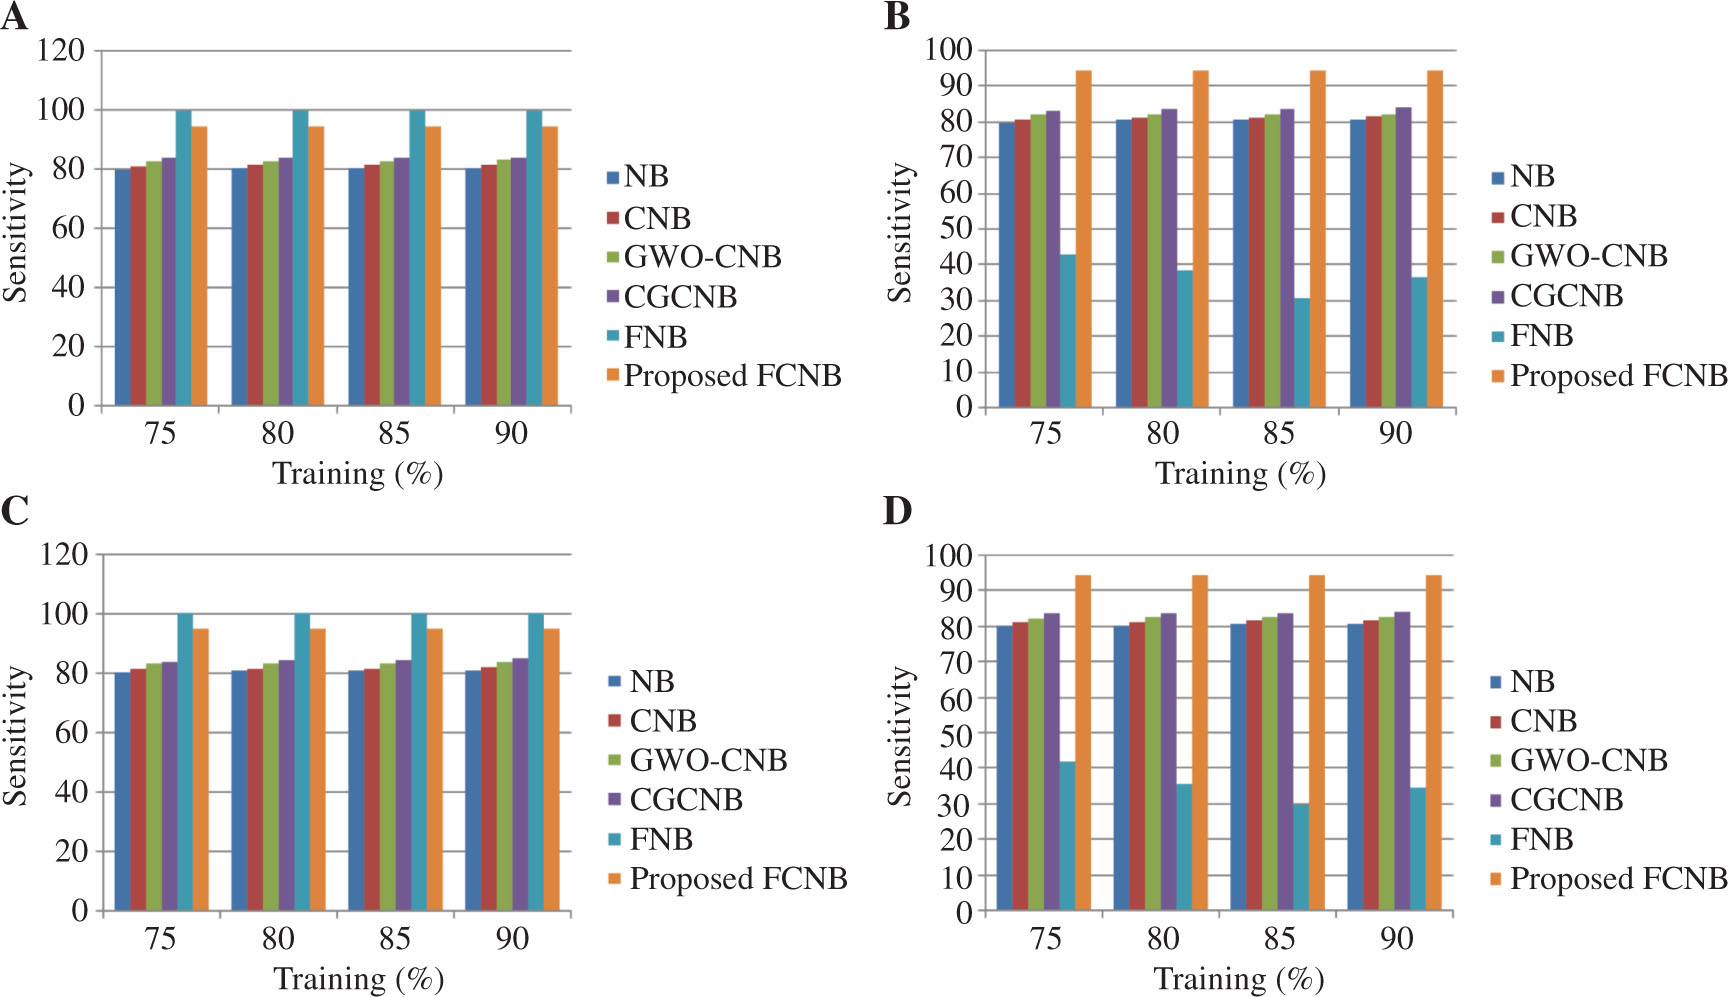
Comparative Analysis of the FCNB Classifier Based on Sensitivity.
For mapper = 4 in (A) localization dataset and (B) skin dataset. For mapper = 5 in (C) localization dataset and (D) skin dataset.
3.4.2 Analysis Based on Sensitivity
Figure 4 presents the comparative analysis of the proposed FCNB classifier based on the sensitivity metric for the varying training percentages of the dataset and the mapper. Figure 4A presents the analysis of the classifiers based on sensitivity with the mapper size of 4 and varying training percentages of the localization dataset. For 90% training of the localization dataset, the existing NB, CNB, GWO-CNB, CGCNB, and FNB classifiers achieved a sensitivity of 80.699%, 81.899%, 83.2474%, 84.399%, and 99.986%, respectively, while the proposed FCNB classifier achieved a sensitivity value of 94.79%, which was less than that of the FNB classifier. This is due to the factor that the training data taken for the classification is classified toward the same class. Figure 4B presents the performance of the classifiers in the skin dataset along with mapper = 4 based on sensitivity. Here, the comparative models NB, CNB, GWO-CNB, CGCNB, and FNB classifiers achieved the sensitivity value of 80.845%, 81.845%, 82.466%, 84.2254%, and 36.811%, respectively; however, the proposed FCNB classifier achieved the sensitivity value of 94.79%. Figure 4C and D present the performance of the classifiers in the localization and skin datasets for mapper = 5 based on the sensitivity metric. For 90% training of the localization dataset, the existing NB, CNB, GWO-CNB, CGCNB, and FNB classifiers with five mappers achieved the sensitivity value of 80.879%, 81.4741%, 83.447%, 84.478%, and 99.98%, respectively, while the proposed FCNB achieved the sensitivity value of 94.79%. Similarly, for the 90% training of the skin dataset, the existing NB, CNB, GWO-CNB, CGCNB, and FNB classifiers achieved the sensitivity values of 80.960%, 81.986%, 82.918%, 84.316%, and 34.76%, respectively. For the same dataset, the proposed FCNB with mapper = 5 achieved an accuracy value of 94.79%. From the analysis, the proposed FCNB seems to have the sensitivity value of 94.79% for both the localization and skin datasets.
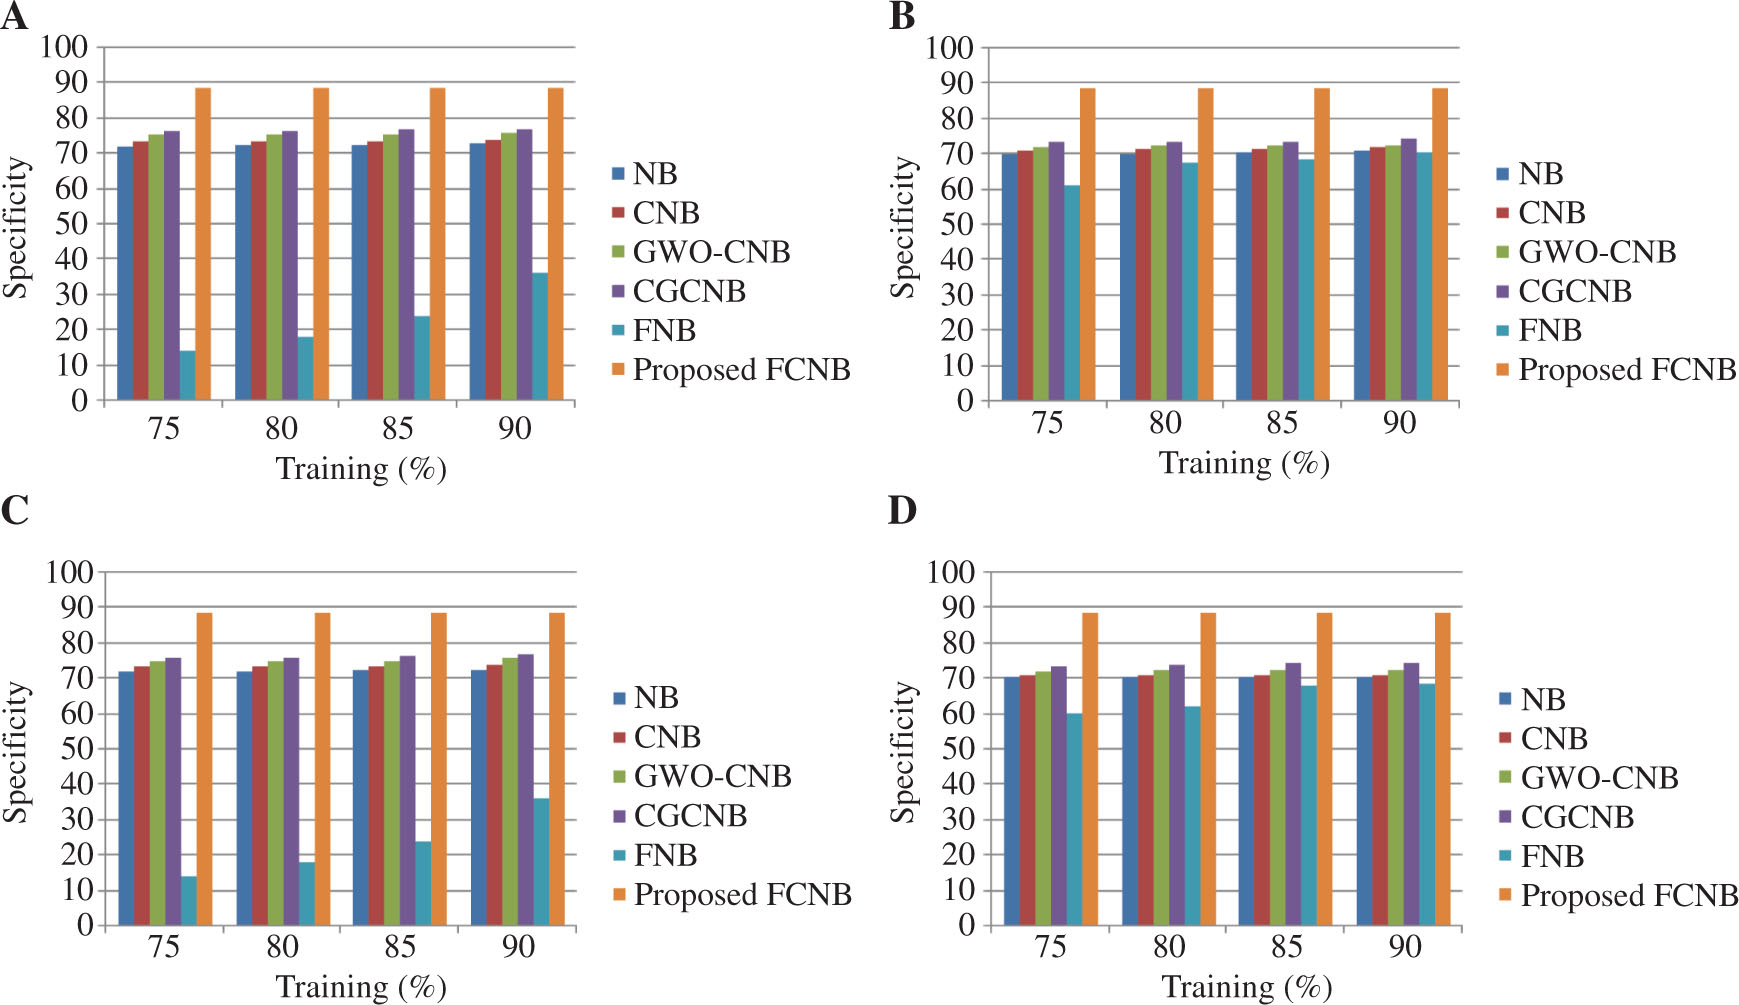
Comparative Analysis of the FCNB Classifier Based on Specificity.
For mapper = 4 in (A) localization dataset and (B) skin dataset. For mapper = 5 in (C) localization dataset and (D) skin dataset.
3.4.3 Analysis Based on Specificity
Figure 5 presents the comparative analysis of the proposed FCNB classifier based on the specificity metric for the varying training percentages of the dataset and the mapper. Figure 5A presents the performance of the classifiers with the mapper size of 4 and varying training percentages of the localization dataset based on the specificity metric. For 90% training of the localization dataset, the existing NB, CNB, GWO-CNB, CGCNB, and FNB classifiers achieved specificity values of 72.884%, 73.953%, 75.9060%, 76.9617%, and 36.12%, respectively, while the proposed FCNB classifier had improved specificity value of 88.891%. Figure 5B presents the performance of the classifiers in the skin dataset along with mapper = 4 based on specificity. Here, the comparative models NB, CNB, GWO-CNB, CGCNB, and FNB classifiers achieved the specificity value of 70.8791%, 71.8203%, 72.7240%, 74.2836%, and 70.67%, respectively; however, the proposed FCNB classifier had the specificity value of 88.891%. Figure 5C presents the performance of the classifiers in the localization for mapper = 5 based on the specificity metric. For 90% training of the localization dataset, the NB, CNB, GWO-CNB, CGCNB, and FNB classifiers with five mappers achieved the specificity value of 72.7007%, 73.8631%, 75.8758%, 76.991%, and 36.127%, respectively, while the proposed FCNB had a high specificity value of 88.89%. Figure 5D presents the performance of the classifiers in the skin dataset for mapper = 5 based on the specificity metric. For the skin dataset, the proposed FCNB with mapper = 5 achieved a specificity value of 88.8912%.
Time Complexity of the Comparative Methods.
| Methods | Time complexity (s) |
|---|---|
| NB | 7.4 |
| CNB | 8.2 |
| GWO-CNB | 7 |
| CGCNB | 6.8 |
| FNB | 6.3 |
| Proposed FCNB | 5 |
3.4.4 Analysis Based on Time Complexity
Table 3 shows the time complexity of the comparative methods. The time complexity of the proposed FCNB is 5 s; on the other hand, the time complexity of the existing methods, such as NB, CNB, GWO-CNB, CGCNB, and FNB, is 7.4, 8.2, 7, 6.8, and 6.3 s, respectively. The time complexity of the proposed method is less when compared to the existing methods, which shows the effectiveness of the proposed method.
4 Conclusion
This work introduces the classification algorithm based on the fuzzy network, called FCNB, for data classification in the big data framework. The proposed FCNB classifier is designed through the integration of the correlation and the fuzzy theory, along with the MapReduce framework. As the proposed FCNB combines the fuzzy theory and the NB, it has improved classification performance in the large data framework. The proposed FCNB classifier is used along with the MapReduce framework for dealing with the large data environment. The simulation of the proposed FCNB classifier is done by considering the localization and skin segmentation datasets from the UCI repository. Also, the performance of the proposed FCNB classifier is compared against the existing NB, CNB, GWO-CNB, CGCNB, and FNB classifiers. From the simulation results, the proposed FCNB classifier shows improved performance in both the localization and skin segmentation datasets under the conditions of mapper = 4 and mapper = 5. For the skin segmentation, the FCNB classifier has high values of 91.78166%, 94.79%, and 88.8912% for accuracy, sensitivity, and specificity, respectively.
Bibliography
[1] Á. Arnaiz-González, A. González-Rogel, J. F. Díez-Pastor and C. López-Nozal, MR-DIS: democratic instance selection for big data by MapReduce, Progr. Artif. Intell. 6 (2017), 211–219.10.1007/s13748-017-0117-5Search in Google Scholar
[2] C. Banchhor and N. Srinivasu, CNB-MRF: adapting correlative naive Bayes classifier and MapReduce framework for big data classification, Int. Rev. Comput. Softw. (IRECOS) 11 (2016).10.15866/irecos.v11i11.10116Search in Google Scholar
[3] A. Bechini, F. Marcelloni and A. Segatori, A MapReduce solution for associative classification of big data, Inform. Sci. 332 (2016), 33–55.10.1016/j.ins.2015.10.041Search in Google Scholar
[4] R. Bhukya and J. Gyani, Fuzzy associative classification algorithm based on MapReduce framework, in: Proceedings of the International Conference on Applied and Theoretical Computing and Communication Technology (iCATccT), pp. 357–360, Davangere, 2015.10.1109/ICATCCT.2015.7456909Search in Google Scholar
[5] J. Chen, H. Chen, X. Wan and G. Zheng, MR-ELM: a MapReduce-based framework for large-scale ELM training in big data era, Neural Comput. Appl. 27 (2016), 101–110.10.1007/s00521-014-1559-3Search in Google Scholar
[6] M. Duan, K. Li, X. Liao and K. Li, A parallel multiclassification algorithm for big data using an extreme learning machine, IEEE Trans. Neural Netw. Learn. Syst. 29 (2017), 2337–2351.10.1109/TNNLS.2017.2654357Search in Google Scholar PubMed
[7] M. Elkano, M. Galar, J. Sanz and H. Bustince, CHI-BD: a fuzzy rule-based classification system for big data classification problems, Fuzzy Sets Syst. 348 (2018), 75–101.10.1016/j.fss.2017.07.003Search in Google Scholar
[8] A. Fernández, S. del Río, A. Bawakid and F. Herrera, Fuzzy rule based classification systems for big data with MapReduce: granularity analysis, Adv. Data Anal. Classif. 11 (2017), 711–730.10.1007/s11634-016-0260-zSearch in Google Scholar
[9] A. Haque, B. Parker, L. Khan and B. Thuraisingham, Evolving big data stream classification with MapReduce, in: Proceedings of IEEE 7th International Conference on Cloud Computing, pp. 570–577, Anchorage, AK, 2014.10.1109/CLOUD.2014.82Search in Google Scholar
[10] M. Hazewinkel, Arithmetic series, in: Encyclopedia of Mathematics, Springer, Netherlands, 2001.Search in Google Scholar
[11] O. Hegazy, S. Safwat and M. E. Bakry, A MapReduce fuzzy techniques of big data classification, in: Proceedings of the SAI Computing Conference (SAI), pp. 118–128, London, 2016.10.1109/SAI.2016.7555971Search in Google Scholar
[12] G. B. Huang, Q. Y. Zhu and C. K. Siew, Extreme learning machine: theory and applications, Neurocomputing 70 (2006), 489–501.10.1016/j.neucom.2005.12.126Search in Google Scholar
[13] X. Huang, L. Shi and J. A. K. Suykens, Support vector machine classifier with pinball loss, IEEE Trans. Pattern Anal. Mach. Intell. 36 (2014), 984–997.10.1109/TPAMI.2013.178Search in Google Scholar PubMed
[14] M. S. Kamal, S. Parvin, A. S. Ashour, F. Shi and N. Dey, De-Bruijn graph with MapReduce framework towards metagenomic data classification, Int. J. Inform. Technol. 9 (2017), 59–75.10.1007/s41870-017-0005-zSearch in Google Scholar
[15] W. Lin, Z. Wu, L. Lin, A. Wen and J. Li, An ensemble random forest algorithm for insurance big data analysis, IEEE Access 5 (2017), 16568–16575.10.1109/ACCESS.2017.2738069Search in Google Scholar
[16] Localization dataset from https://archive.ics.uci.edu/ml/datasets/Localization+Data+for+Person+Activity, Accessed on October 2017.Search in Google Scholar
[17] V. Lopez, S. del Rio, J. M. Benitez and F. Herrera, On the use of MapReduce to build linguistic fuzzy rule based classification systems for big data, in: Proceedings of the IEEE International Conference on Fuzzy Systems (FUZZ-IEEE), pp. 1905–1912, Beijing, 2014.10.1109/FUZZ-IEEE.2014.6891753Search in Google Scholar
[18] V. López, S. del Río, J. M. Benítez and F. Herrera, Cost-sensitive linguistic fuzzy rule based classification systems under the MapReduce framework for imbalanced big data, Fuzzy Sets Syst. 258 (2015), 5–38.10.1016/j.fss.2014.01.015Search in Google Scholar
[19] S. A. Ludwig, MapReduce-based fuzzy c-means clustering algorithm: implementation and scalability, Int. J. Mach. Learn. Cybernet. 6 (2015), 923–934.10.1007/s13042-015-0367-0Search in Google Scholar
[20] J. Maillo, I. Triguero and F. Herrera, A MapReduce-based k-nearest neighbor approach for big data classification, in: IEEE Trustcom/BigDataSE/ISPA, pp. 167–172, Helsinki, 2015.10.1109/Trustcom.2015.577Search in Google Scholar
[21] S. Mirjalili, S. M. Mirjalili and A. Lewis, Grey wolf optimizer, Adv. Eng. Softw. 69 (2014), 46–61.10.1016/j.advengsoft.2013.12.007Search in Google Scholar
[22] S. S. Patil and S. P. Sonavane, Enriched over_sampling techniques for improving classification of imbalanced big data, in: Proceedings of IEEE Third International Conference on Big Data Computing Service and Applications (BigDataService), pp. 1–10, San Francisco, CA, 2017.10.1109/BigDataService.2017.19Search in Google Scholar
[23] B. Pei, F. Wang and X. Wang, Research on MapReduce-based fuzzy associative classifier for big probabilistic numerical data, in: Proceedings of the IEEE International Conference on Internet of Things (iThings) and IEEE Green Computing and Communications (GreenCom) and IEEE Cyber, Physical and Social Computing (CPSCom) and IEEE Smart Data (SmartData), pp. 903–906, Chengdu, 2016.10.1109/iThings-GreenCom-CPSCom-SmartData.2016.186Search in Google Scholar
[24] G. Santafe, J. A. Lozano and P. Larranaga, Bayesian model averaging of naive Bayes for clustering, IEEE Trans. Syst. Man Cybernet. Pt. B (Cybernetics) 36 (2006), 1149–1161.10.1109/TSMCB.2006.874132Search in Google Scholar
[25] A. Segatori, F. Marcelloni and W. Pedrycz, On distributed fuzzy decision trees for big data, IEEE Trans. Fuzzy Syst. 26 (2018), 174–192.10.1109/TFUZZ.2016.2646746Search in Google Scholar
[26] Skin segmentation dataset from https://archive.ics.uci.edu/ml/datasets/skin+segmentation, Accessed on October 2017.Search in Google Scholar
[27] H. Storr, A compact fuzzy extension of the naive Bayesian classification algorithm, in: Intelligent Systems in e-Commerce (ISeC), 2002.Search in Google Scholar
[28] I. Triguero, D. Peralta, J. Bacardit, S. García and F. Herrera, MRPR: a MapReduce solution for prototype reduction in big data classification, Neurocomputing 150 (2015), 331–345.10.1016/j.neucom.2014.04.078Search in Google Scholar
[29] J. Zhai, S. Zhang and C. Wang, The classification of imbalanced large data sets based on MapReduce and ensemble of ELM classifiers, Int. J. Mach. Learn. Cybernet. 8 (2017), 1009–1017.10.1007/s13042-015-0478-7Search in Google Scholar
©2020 Walter de Gruyter GmbH, Berlin/Boston
This work is licensed under the Creative Commons Attribution 4.0 Public License.
Articles in the same Issue
- An Optimized K-Harmonic Means Algorithm Combined with Modified Particle Swarm Optimization and Cuckoo Search Algorithm
- Texture Feature Extraction Using Intuitionistic Fuzzy Local Binary Pattern
- Leaf Disease Segmentation From Agricultural Images via Hybridization of Active Contour Model and OFA
- Deadline Constrained Task Scheduling Method Using a Combination of Center-Based Genetic Algorithm and Group Search Optimization
- Efficient Classification of DDoS Attacks Using an Ensemble Feature Selection Algorithm
- Distributed Multi-agent Bidding-Based Approach for the Collaborative Mapping of Unknown Indoor Environments by a Homogeneous Mobile Robot Team
- An Efficient Technique for Three-Dimensional Image Visualization Through Two-Dimensional Images for Medical Data
- Combined Multi-Agent Method to Control Inter-Department Common Events Collision for University Courses Timetabling
- An Improved Particle Swarm Optimization Algorithm for Global Multidimensional Optimization
- A Kernel Probabilistic Model for Semi-supervised Co-clustering Ensemble
- Pythagorean Hesitant Fuzzy Information Aggregation and Their Application to Multi-Attribute Group Decision-Making Problems
- Using an Efficient Optimal Classifier for Soil Classification in Spatial Data Mining Over Big Data
- A Bayesian Multiresolution Approach for Noise Removal in Medical Magnetic Resonance Images
- Gbest-Guided Artificial Bee Colony Optimization Algorithm-Based Optimal Incorporation of Shunt Capacitors in Distribution Networks under Load Growth
- Graded Soft Expert Set as a Generalization of Hesitant Fuzzy Set
- Universal Liver Extraction Algorithm: An Improved Chan–Vese Model
- Software Effort Estimation Using Modified Fuzzy C Means Clustering and Hybrid ABC-MCS Optimization in Neural Network
- Handwritten Indic Script Recognition Based on the Dempster–Shafer Theory of Evidence
- An Integrated Intuitionistic Fuzzy AHP and TOPSIS Approach to Evaluation of Outsource Manufacturers
- Automatically Assess Day Similarity Using Visual Lifelogs
- A Novel Bio-Inspired Algorithm Based on Social Spiders for Improving Performance and Efficiency of Data Clustering
- Discriminative Training Using Noise Robust Integrated Features and Refined HMM Modeling
- Self-Adaptive Mussels Wandering Optimization Algorithm with Application for Artificial Neural Network Training
- A Framework for Image Alignment of TerraSAR-X Images Using Fractional Derivatives and View Synthesis Approach
- Intelligent Systems for Structural Damage Assessment
- Some Interval-Valued Pythagorean Fuzzy Einstein Weighted Averaging Aggregation Operators and Their Application to Group Decision Making
- Fuzzy Adaptive Genetic Algorithm for Improving the Solution of Industrial Optimization Problems
- Approach to Multiple Attribute Group Decision Making Based on Hesitant Fuzzy Linguistic Aggregation Operators
- Cubic Ordered Weighted Distance Operator and Application in Group Decision-Making
- Fault Signal Recognition in Power Distribution System using Deep Belief Network
- Selector: PSO as Model Selector for Dual-Stage Diabetes Network
- Oppositional Gravitational Search Algorithm and Artificial Neural Network-based Classification of Kidney Images
- Improving Image Search through MKFCM Clustering Strategy-Based Re-ranking Measure
- Sparse Decomposition Technique for Segmentation and Compression of Compound Images
- Automatic Genetic Fuzzy c-Means
- Harmony Search Algorithm for Patient Admission Scheduling Problem
- Speech Signal Compression Algorithm Based on the JPEG Technique
- i-Vector-Based Speaker Verification on Limited Data Using Fusion Techniques
- Prediction of User Future Request Utilizing the Combination of Both ANN and FCM in Web Page Recommendation
- Presentation of ACT/R-RBF Hybrid Architecture to Develop Decision Making in Continuous and Non-continuous Data
- An Overview of Segmentation Algorithms for the Analysis of Anomalies on Medical Images
- Blind Restoration Algorithm Using Residual Measures for Motion-Blurred Noisy Images
- Extreme Learning Machine for Credit Risk Analysis
- A Genetic Algorithm Approach for Group Recommender System Based on Partial Rankings
- Improvements in Spoken Query System to Access the Agricultural Commodity Prices and Weather Information in Kannada Language/Dialects
- A One-Pass Approach for Slope and Slant Estimation of Tri-Script Handwritten Words
- Secure Communication through MultiAgent System-Based Diabetes Diagnosing and Classification
- Development of a Two-Stage Segmentation-Based Word Searching Method for Handwritten Document Images
- Pythagorean Fuzzy Einstein Hybrid Averaging Aggregation Operator and its Application to Multiple-Attribute Group Decision Making
- Ensembles of Text and Time-Series Models for Automatic Generation of Financial Trading Signals from Social Media Content
- A Flame Detection Method Based on Novel Gradient Features
- Modeling and Optimization of a Liquid Flow Process using an Artificial Neural Network-Based Flower Pollination Algorithm
- Spectral Graph-based Features for Recognition of Handwritten Characters: A Case Study on Handwritten Devanagari Numerals
- A Grey Wolf Optimizer for Text Document Clustering
- Classification of Masses in Digital Mammograms Using the Genetic Ensemble Method
- A Hybrid Grey Wolf Optimiser Algorithm for Solving Time Series Classification Problems
- Gray Method for Multiple Attribute Decision Making with Incomplete Weight Information under the Pythagorean Fuzzy Setting
- Multi-Agent System Based on the Extreme Learning Machine and Fuzzy Control for Intelligent Energy Management in Microgrid
- Deep CNN Combined With Relevance Feedback for Trademark Image Retrieval
- Cognitively Motivated Query Abstraction Model Based on Associative Root-Pattern Networks
- Improved Adaptive Neuro-Fuzzy Inference System Using Gray Wolf Optimization: A Case Study in Predicting Biochar Yield
- Predict Forex Trend via Convolutional Neural Networks
- Optimizing Integrated Features for Hindi Automatic Speech Recognition System
- A Novel Weakest t-norm based Fuzzy Fault Tree Analysis Through Qualitative Data Processing and Its Application in System Reliability Evaluation
- FCNB: Fuzzy Correlative Naive Bayes Classifier with MapReduce Framework for Big Data Classification
- A Modified Jaya Algorithm for Mixed-Variable Optimization Problems
- An Improved Robust Fuzzy Algorithm for Unsupervised Learning
- Hybridizing the Cuckoo Search Algorithm with Different Mutation Operators for Numerical Optimization Problems
- An Efficient Lossless ROI Image Compression Using Wavelet-Based Modified Region Growing Algorithm
- Predicting Automatic Trigger Speed for Vehicle-Activated Signs
- Group Recommender Systems – An Evolutionary Approach Based on Multi-expert System for Consensus
- Enriching Documents by Linking Salient Entities and Lexical-Semantic Expansion
- A New Feature Selection Method for Sentiment Analysis in Short Text
- Optimizing Software Modularity with Minimum Possible Variations
- Optimizing the Self-Organizing Team Size Using a Genetic Algorithm in Agile Practices
- Aspect-Oriented Sentiment Analysis: A Topic Modeling-Powered Approach
- Feature Pair Index Graph for Clustering
- Tangramob: An Agent-Based Simulation Framework for Validating Urban Smart Mobility Solutions
- A New Algorithm Based on Magic Square and a Novel Chaotic System for Image Encryption
- Video Steganography Using Knight Tour Algorithm and LSB Method for Encrypted Data
- Clay-Based Brick Porosity Estimation Using Image Processing Techniques
- AGCS Technique to Improve the Performance of Neural Networks
- A Color Image Encryption Technique Based on Bit-Level Permutation and Alternate Logistic Maps
- A Hybrid of Deep CNN and Bidirectional LSTM for Automatic Speech Recognition
- Database Creation and Dialect-Wise Comparative Analysis of Prosodic Features for Punjabi Language
- Trapezoidal Linguistic Cubic Fuzzy TOPSIS Method and Application in a Group Decision Making Program
- Histopathological Image Segmentation Using Modified Kernel-Based Fuzzy C-Means and Edge Bridge and Fill Technique
- Proximal Support Vector Machine-Based Hybrid Approach for Edge Detection in Noisy Images
- Early Detection of Parkinson’s Disease by Using SPECT Imaging and Biomarkers
- Image Compression Based on Block SVD Power Method
- Noise Reduction Using Modified Wiener Filter in Digital Hearing Aid for Speech Signal Enhancement
- Secure Fingerprint Authentication Using Deep Learning and Minutiae Verification
- The Use of Natural Language Processing Approach for Converting Pseudo Code to C# Code
- Non-word Attributes’ Efficiency in Text Mining Authorship Prediction
- Design and Evaluation of Outlier Detection Based on Semantic Condensed Nearest Neighbor
- An Efficient Quality Inspection of Food Products Using Neural Network Classification
- Opposition Intensity-Based Cuckoo Search Algorithm for Data Privacy Preservation
- M-HMOGA: A New Multi-Objective Feature Selection Algorithm for Handwritten Numeral Classification
- Analogy-Based Approaches to Improve Software Project Effort Estimation Accuracy
- Linear Regression Supporting Vector Machine and Hybrid LOG Filter-Based Image Restoration
- Fractional Fuzzy Clustering and Particle Whale Optimization-Based MapReduce Framework for Big Data Clustering
- Implementation of Improved Ship-Iceberg Classifier Using Deep Learning
- Hybrid Approach for Face Recognition from a Single Sample per Person by Combining VLC and GOM
- Polarity Analysis of Customer Reviews Based on Part-of-Speech Subcategory
- A 4D Trajectory Prediction Model Based on the BP Neural Network
- A Blind Medical Image Watermarking for Secure E-Healthcare Application Using Crypto-Watermarking System
- Discriminating Healthy Wheat Grains from Grains Infected with Fusarium graminearum Using Texture Characteristics of Image-Processing Technique, Discriminant Analysis, and Support Vector Machine Methods
- License Plate Recognition in Urban Road Based on Vehicle Tracking and Result Integration
- Binary Genetic Swarm Optimization: A Combination of GA and PSO for Feature Selection
- Enhanced Twitter Sentiment Analysis Using Hybrid Approach and by Accounting Local Contextual Semantic
- Cloud Security: LKM and Optimal Fuzzy System for Intrusion Detection in Cloud Environment
- Power Average Operators of Trapezoidal Cubic Fuzzy Numbers and Application to Multi-attribute Group Decision Making