Implementation of Improved Ship-Iceberg Classifier Using Deep Learning
-
Ankita Rane
 and
Vadivel Sangili
and
Vadivel Sangili

Abstract
The application of synthetic aperture radar (SAR) for ship and iceberg monitoring is important to carry out marine activities safely. The task of differentiating the two target classes, i.e. ship and iceberg, presents a challenge for operational scenarios. The dataset comprising SAR images of ship and iceberg poses a major challenge, as we are provided with a small number of labeled samples in the training set compared to a large number of unlabeled test samples. This paper proposes a semisupervised learning approach known as pseudolabeling to deal with the insufficient amount of training data. By adopting this approach, we make use of both labeled data (supervised learning) and unlabeled data (unsupervised learning) to build a robust convolutional neural network model that results in a superior binary classification performance of the proposed method.
1 Introduction
Marine surveillance and circumstance awareness is very critical for monitoring and controlling piracy, smuggling, locating large-sized icebergs, and environmental hazards such as oil spills or pollution. In remote areas of the East Coast of Canada, drifting icebergs have possessed a great threat to mankind as well as marine activities by hampering navigation [6]. It has become increasingly difficult to monitor the movement of the icebergs even with the help of surveillance drones due to harsh climatic conditions in remote areas. This is where satellites come into use to monitor ships and icebergs despite the harsh weather conditions [8]. An international energy company, Statoil, has worked in collaboration with C-Core to come up with a computer vision-based surveillance system. To keep marine operations safe and effective, Statoil wants to get a crisp new point of view on how to use machine learning (ML) to build a more precise surveillance system to identify and detect large chunks of icebergs that are a potential threat; as a result, this dataset was made publicly available and is popularly known as the Ship-Iceberg Classifier Challenge [3].
One of the recent works on classifying ship-iceberg using predictive modeling was done by Jang et al., which uses several supervised learning algorithms such as random forest model to distinguish between ship and iceberg synthetic aperture radar (SAR) images. They further went on to train the convolutional neural network (CNN) on the available labeled train set and achieve a validation accuracy of 90% [3]. Another significant effort on ship-iceberg classification was by Bentes et al. They presented the use of CNN for ship-iceberg discrimination in high-resolution TerraSAR-X-images. Their dataset comprised 600 samples after data augmentation; the CNN was trained on 90% of the sample and tested on the remaining 10%. The CNN model was compared to the support vector machine (SVM) model and the final results showed that the CNN model outperformed the SVM model due to better generalization ability [1]. A similar work was done by Jun et al. They trained the CNN on an available training set of 1604 images and achieved a validation accuracy of 88.33% [4]. In contrast, our approach of semisupervised learning not only makes use of training samples for model learning but also incorporates the unlabeled test set data. Our CNN model being exposed to a large number of data samples is able to learn more features about the images, thus resulting in a superior learning performance.
Data scarcity is one of the main problems of ML and data mining tasks as insufficient data size is very often responsible for poor learning performances. Our work makes a significant contribution by proposing a solution to tackle the scarcity of labeled data for training purpose. This paper crafts a critical solution using unlabeled data to extract significant information for inferences. Our approach of pseudolabeling the unlabeled test set data to incorporate in the model training has improved the model robustness by creating a more precise decision boundary, ultimately resulting in the state-of-the-art performance by the prediction model. The experimental results revealed the effectiveness of our proposed approach when comparing the classification results to the CNN model without pseudolabeling.
2 Data Extraction
In this work, the dataset contains SAR images from the Sentinel-1 satellite housed 600 km over the Earth’s surface. A total of 10,028 (test + train) satellite images are present in the dataset. Each image has a dimension of 75 × 75 pixel with two bands. This means that every band has 5625 positive floating values associated with it. The training set contains 1604 images that are labeled with the target variable (is_iceberg) and the remaining 8424 images belong to the test set that are unlabeled. Of the 1604 training samples, 753 are labeled as iceberg and 851 images are labeled as ship. Every training sample has an attribute, namely incidence angle (inc_angle), which gives us information about the angle at which the radar signals were incident on the object. The huge difference in the train and test datasets as well as a larger portion of the data being unlabeled poses a challenge in the process of effective classification. This has led us to follow the approach of semisupervised learning. The implementation of the code was entirely done using Spyder, which is a powerful development environment for Python language with advanced editing, testing, and numerical computing environment. The following are hardware specifications of the system are as follows:
System: ThinkStation-P500
Processor: Intel Xenon® CPU E5-1620 v3 @ 3.5 GHz × 8
Graphics: Quadro K2200/PCle/SSE2
OS Type: 64-bit
Disk: 193.1 GB
3 Data Preprocessing
Sentinel-1 satellite is at about 680 km above Earth, sending pulses of signals at a specific incidence angle and then recording it back. Those reflected signals are known as backscatter. The data we have been given is the backscatter coefficient that is the conventional form of backscatter coefficient given by the following equation:
where ip is the angle of incidence for a particular pixel, ic is the incidence angle at the center of the image, and k is a constant. The Sentinel satellite is very similar to RISTSAT (an Indian remote sensing satellite) as it transmits pings in H-polarization and not in V-polarization. H pings when incident on an object get scattered and return as a blend of H- and V-polarizations. As Sentinel has only H-transmitter, the return signals are of the forms HH and HV only.
Before we use the data for analysis to bring meaningful insights, we first preprocess it to remove unnecessary information present in it. We replace the rows with inclination angle as “na” with a zero. Each training sample has two bands (HH and HV) associated with it. We merge the two bands by averaging the two and creating a third channel to get a three-channel RGB equivalent [3]. The 3D structure of ship and iceberg based on their respective band values is plotted using Plotly library is shown in Figures 1 and 2 respectively. As seen in the plots, the shape of the ship resembles an elongated point, whereas an iceberg has pinnacles and distortions. We exploit these structural differences to train the CNNs to learn the various features of ships and icebergs [1].

3D Plot of a Ship.

3D Plot of a Iceberg.
4 Data Augmentation
Data augmentation is a technique to add value to the base data that is information deprived by increasing the training data samples. It is common knowledge that the more data the CNN model has access to, the more will be its accuracy. By increasing the original dataset, data augmentation overcomes the overfitting of training samples. In this project, we make use of traditional transformations that manipulate the training data. Generally, the original images are either shifted, zoomed in/out, rotated, flipped, or distorted to get the augmented images. In this case, the images are augmented by flipping the image as this helps the CNN get a different orientation of the image. The flipped images, although a replica of their original images, help improve the training accuracy significantly. This is because the CNN being inherently invariant considers the flipped image almost as good as a new one and it may trigger the convolutional kernel matrix very differently compared to the original. Both image and its duplicate are fed into the neural network. For a dataset of size N, we generate a dataset of 3N size (horizontal + vertical flips) as a result of data augmentation. After augmenting the data, the training set size increases to 4812 images. Thus, data augmentation is not only useful in classification tasks lacking sufficient amount of data but also helps improve the state-of-the-art algorithms for classification [7]. Augmenting the dataset increased the CNN training accuracy by approximately 1.2%.
5 Building the CNN Model
CNN is a class of deep feed-forward artificial neural network that is extensively applied in the field of computer vision. CNN is a concept inspired by the structure and connectivity of the neurons in the human brain. With recent advancements in neural networks, CNNs have proven to be very effective in areas such as image recognition and classification. ConvNets have been successful in identifying faces, objects, and traffic signs apart from powering vision in robots and self-driving cars. In this project, we build a CNN comprising four main components: (1) Conv2D layer, (2) nonlinear activation function (ReLu), (3) pooling layer, and (4) dropout layer (to overcome overfitting). The model was built with a batch size of 32, which defines the number of samples propagated through the network per batch. The model comprises four Conv2D layers followed by three dense layers. The CNN also was implemented with a 3 × 3 convolutional filter. We use a 0.2 dropout layer and 2 × 2 maxpool layer after every convolutional layer [7]. The dropout layer is to reduce overfitting. Lastly, we had a fully connected layer consisting of 256 fully connected neurons. All convolutional layers used the “same” padding method and a “relu” activation function. The model consisted of a total of 560,193 parameters. A summary of the model can be seen in Figure 3.

CNN Model Summary.
6 Semisupervised Approach: Pseudolabeling
The most talked about and widely used ML techniques are supervised and unsupervised learning. However, there exists a third classification that incorporates the best of both supervised and unsupervised learning, which is known as semisupervised learning. Semisupervised learning is a class of supervised learning that makes use of both labeled and unlabeled data for training the model. This approach is typically adopted when there is a small amount of labeled data and large amount of unlabeled data. This technique has proven to be useful for a variety of reasons. First, manually labeling huge datasets for supervised learning can be very tedious and time consuming. Moreover, too much labeling can lead to human biases on the model. This can be overcome by including a lot of unlabeled data in training to increase the accuracy of the model. For this very reason, semisupervised learning is suitable for use cases such as webpage classification, speech recognition, or genetic sequencing. The lack of sufficient amount of training data is a challenging ML problem, but it is also a realistic one: in a lot of real-world use cases, even small-scale data collection can be extremely expensive or sometimes near impossible (e.g. in medical imaging). Being able to make the most out of very little data is a key skill of a competent data scientist [2].
Pseudolabeling is a simple and efficient method to do semisupervised learning. This technique is usually applied when a small chunk of data is labeled (training set) and a large set of test samples is unlabeled. This means that the model can only learn features from the small training set because it is labeled. The test data containing more valuable information cannot be used to our advantage as it is unlabeled. Therefore, this is where pseudolabeling plays a vital role using the test data in model training. The diagram (Figure 4) and pseudocode shows the steps to follow for pseudolabeling.

Pseudolabeled Model.
| Algorithm: Pseudo-labelling |
| 1. repeat |
| 2. m ← trainModel(L) |
| 3. for x ϵ U do |
| 4. if max m(x) ¿ τ then |
| 5. L ← L ∪ (x,p(x)) |
| 6. until no more predictions are confident |
In this approach, pseudolabeling (self-training) trains a model m on labeled training set L and an unlabeled dataset U. With every iteration, the model m predicts m(x) in the form of a probability distribution over the N classes for unlabeled example x in U. If the predicted probability is higher than a threshold value τ, then x is concatenated to the labeled samples with p(x) = argmax m(x). This process is repeated until all the confident predictions in the unlabeled set are exhausted.
7 Experiment and Evaluation
The CNN structure is optimized by tuning the hyperparameters to attain optimal performance during model training. A number of convolutional layer sizes were tested, and the model giving the most optimal train accuracy was selected. Various callback functions were applied to the model while training it on 50 epochs. The CNN model was trained and tested on an augmented set using a stratified shuffle split to ensure that the folds are made by preserving the percentage of samples for each class. Figure 5 shows the CNN model accuracy on training it with the augmented data containing 4812 data samples. Once the CNN model is trained on augmented training set, we use this CNN to predict the probabilities of the test set samples being a ship or an iceberg. We now follow the semisupervised learning approach called pseudolabeling to make use of samples in the test set, which in turn will help us build a stronger CNN for classification. To incorporate the test samples, we only consider the samples that have a high probability of correct classification predicted by the CNN trained on augmented set (CNN model 1). We choose test samples to be labeled as “iceberg” whose predicted probability of being an iceberg by the CNN model 1 is greater than 95% and similarly choose samples to be labeled as “ship” whose probability of being an iceberg is lesser than 5% [5]. On identifying these test samples, we concatenate them with the augmented data, thus increasing our training data that now contains 7372 samples.

CNN Training Accuracies.
The training set after concatenating test set pseudolabels is now to be trained on the CNN model using five-fold cross-validation. Various callbacks are applied while training the model on 30 epochs. Figure 6 shows the accuracy and scores of the enhanced CNN model containing the pseudolabeled data. The CNN model achieved validation accuracy of approximately 95% when tested and trained on five-fold cross-validation.
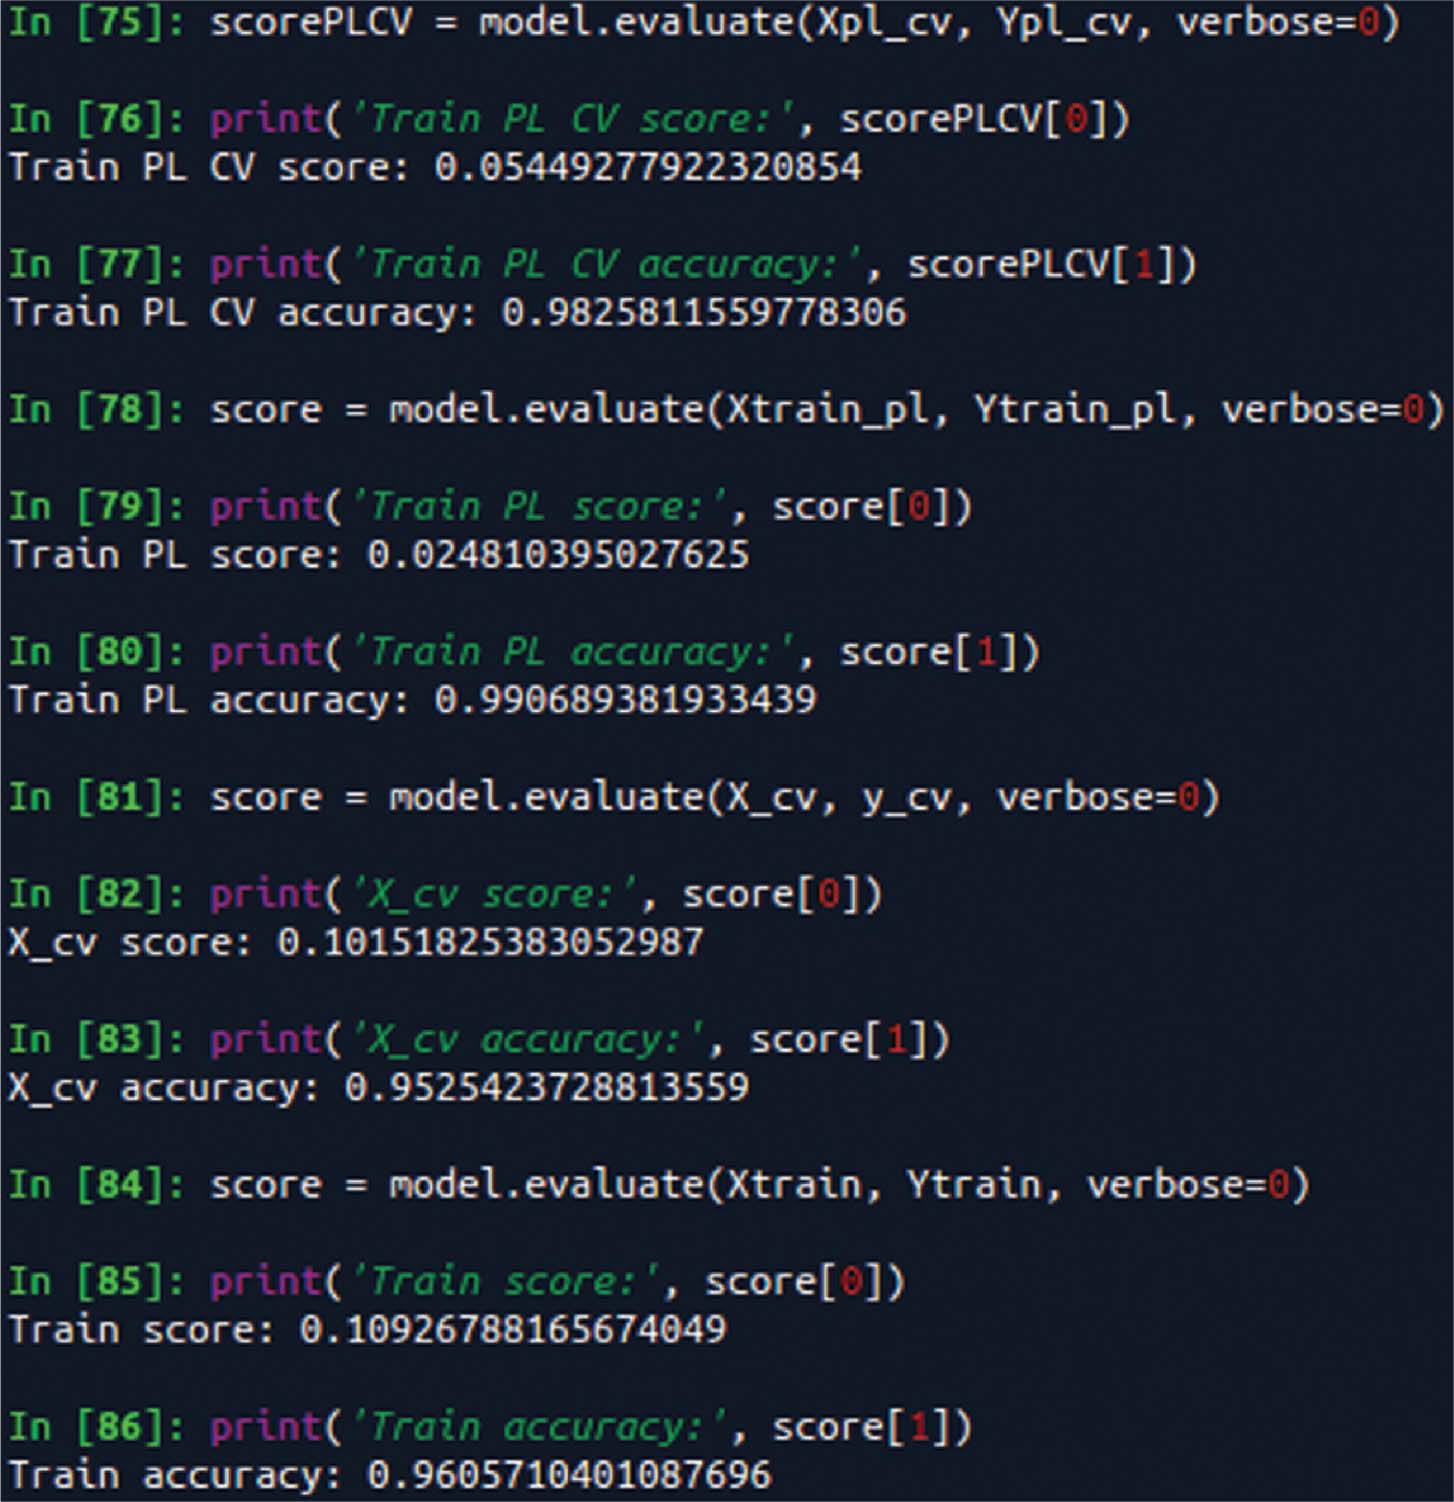
Pseudolabeled Training Accuracies.
The enhanced CNN model (trained on pseudolabels) is tested on the test set and the output is the predicted probabilities of a sample being a ship or an iceberg. The sample IDs and their respective probabilities are written into a .csv file and submitted to Kaggle for the calculation of the LB score. We achieved an LB score of 0.214 with pseudolabeling as shown in Table 1.
Semisupervised Learning Approaches Performance Measure.
| Semisupervised approaches | LB score |
|---|---|
| Pseudolabeling (self-learning) | 0.214 |
| Cotraining | 0.253 |
| Generative models | 0.317 |
Accuracy Measures on Validation set for Semisupervised Approaches.
| Semisupervised approaches | Precision | Recall | Sensitivity | Specificity |
|---|---|---|---|---|
| Pseudolabeling (self-learning) | 95.2% | 94.7% | 95.1% | 95.3% |
| Cotraining | 91.7% | 90.1% | 91.3% | 92.2% |
| Generative models | 85.4% | 85% | 85.7% | 86.1% |
In this project, we further explored the semisupervised techniques of cotraining and generative modeling. The results of these approaches were then compared to that achieved by pseudolabeling (self-training). The basic idea of cotraining involves training two classifiers on two different views (features) of the data. Then, classifier 1’s most confident predictions are added to classifier 2’s training set and vice versa. Then, both classifiers retrain themselves with their respective datasets and in the process teach each other. The classifiers built using cotraining achieved validation accuracy of approximately 91% using five-fold cross-validation. On evaluating the predictions by the cotrained model, we received an LB score of 0.253 (a lower score implies better classification accuracy as shown in Table 1). One of the setbacks of this model was that it was computationally time-consuming, and given that we were dealing with limited data features, it was difficult to split these features into two. Second, we tried generative modeling for the classification task. To score the predictions made by the generative model, we used five-fold cross-validation, which resulted in an accuracy of approximately 85% as shown in Table 2. The predictions resulted in an LB score of 0.317. The classification accuracy declined further because generative models find it difficult to balance the impact of labeled and unlabeled data when the unlabeled data outnumbers the labeled data. Finally comparing the scores of these models as shown below, pseudolabeling gave us the best results in terms of LB score and computation time.
8 Conclusion
This paper presents the use of CNNs for ship-iceberg discrimination in high-resolution SAR images. The main challenge in this project was that the size of test data (unlabeled) was much larger than the train data (labeled). To overcome this constraint, we resorted to pseudolabeling, which is a semisupervised ML approach. We also compared the LB score of the CNN model predictions with and without pseudolabeling. It was observed that the LB score improved from 0.4515 to 0.214 with pseudolabeling, beating more than half of the competing teams. Our work can be further improved by exploring the preprocessing of our data. In our analysis, we disregarded the incidence angle that may have vastly influenced our result. We are aware that incidence angle can affect the intensity of the satellite decibel readings and we believe that the integration of this parameter is necessary to push the classification accuracy further. Given the log-loss scoring method used in this competition, classification error can have an exponential impact on submission scores. Thus, in our future work, we hope to reduce our classification error through various alternative data preprocessing methods and the exploration of different CNN architecture and hyperparameters.
Bibliography
[1] C. Bentes, A. Frost, D. Velotto and B. Tings, Ship-iceberg discrimination with convolutional neural networks in high resolution SAR images, in: Processing of EUSAR 2016: 11th European Conference on Synthetic Aperture Radar.Search in Google Scholar
[2] F. Chollet, Building powerful image classification models using very little data.Search in Google Scholar
[3] H. Jang, S. Kim and T. Lam, Kaggle competitions: author identification and Statoil/C-CORE Iceberg Classifier Challenge, School of Informatics, Computing, and Engineering, Indiana University, Bloomington, IN, USA, Datamining B565 Fall 2017.Search in Google Scholar
[4] L. Jun, P. Atharva and S. Dhruv, Iceberg-ship classifier using SAR image maps, Final Project Report 2017, Stanford University.Search in Google Scholar
[5] D.-H. Lee, Pseudo-label: the simple and efficient semi-supervised learning method for deep neural networks, in: ICML 2013 Workshop: Challenges in Representation Learning (WREPL), Atlanta, GA, USA, 2013.Search in Google Scholar
[6] J. Tang, C. Deng, G.-B. Huang and B. Zhao, Compressed-domain ship detection on spaceborne optical image using deep neural network and extreme learning machine, IEEE Trans. Geosci. Remote Sens. 53 (2015), 1174–1185.10.1109/TGRS.2014.2335751Search in Google Scholar
[7] P. Velickovic, Deep learning for complete beginners: convolutional neural networks with keras.Search in Google Scholar
[8] G. Wu, J. de Leeuw, A. K. Skidmore, Y. Liu and H. H. T. Prins, Performance of Landsat TM in ship detection in turbid waters, Int. J. Appl. Earth Obs. Geoinf. 11 (2009), 54–61.10.1016/j.jag.2008.07.001Search in Google Scholar
©2020 Walter de Gruyter GmbH, Berlin/Boston
This work is licensed under the Creative Commons Attribution 4.0 Public License.
Articles in the same Issue
- An Optimized K-Harmonic Means Algorithm Combined with Modified Particle Swarm Optimization and Cuckoo Search Algorithm
- Texture Feature Extraction Using Intuitionistic Fuzzy Local Binary Pattern
- Leaf Disease Segmentation From Agricultural Images via Hybridization of Active Contour Model and OFA
- Deadline Constrained Task Scheduling Method Using a Combination of Center-Based Genetic Algorithm and Group Search Optimization
- Efficient Classification of DDoS Attacks Using an Ensemble Feature Selection Algorithm
- Distributed Multi-agent Bidding-Based Approach for the Collaborative Mapping of Unknown Indoor Environments by a Homogeneous Mobile Robot Team
- An Efficient Technique for Three-Dimensional Image Visualization Through Two-Dimensional Images for Medical Data
- Combined Multi-Agent Method to Control Inter-Department Common Events Collision for University Courses Timetabling
- An Improved Particle Swarm Optimization Algorithm for Global Multidimensional Optimization
- A Kernel Probabilistic Model for Semi-supervised Co-clustering Ensemble
- Pythagorean Hesitant Fuzzy Information Aggregation and Their Application to Multi-Attribute Group Decision-Making Problems
- Using an Efficient Optimal Classifier for Soil Classification in Spatial Data Mining Over Big Data
- A Bayesian Multiresolution Approach for Noise Removal in Medical Magnetic Resonance Images
- Gbest-Guided Artificial Bee Colony Optimization Algorithm-Based Optimal Incorporation of Shunt Capacitors in Distribution Networks under Load Growth
- Graded Soft Expert Set as a Generalization of Hesitant Fuzzy Set
- Universal Liver Extraction Algorithm: An Improved Chan–Vese Model
- Software Effort Estimation Using Modified Fuzzy C Means Clustering and Hybrid ABC-MCS Optimization in Neural Network
- Handwritten Indic Script Recognition Based on the Dempster–Shafer Theory of Evidence
- An Integrated Intuitionistic Fuzzy AHP and TOPSIS Approach to Evaluation of Outsource Manufacturers
- Automatically Assess Day Similarity Using Visual Lifelogs
- A Novel Bio-Inspired Algorithm Based on Social Spiders for Improving Performance and Efficiency of Data Clustering
- Discriminative Training Using Noise Robust Integrated Features and Refined HMM Modeling
- Self-Adaptive Mussels Wandering Optimization Algorithm with Application for Artificial Neural Network Training
- A Framework for Image Alignment of TerraSAR-X Images Using Fractional Derivatives and View Synthesis Approach
- Intelligent Systems for Structural Damage Assessment
- Some Interval-Valued Pythagorean Fuzzy Einstein Weighted Averaging Aggregation Operators and Their Application to Group Decision Making
- Fuzzy Adaptive Genetic Algorithm for Improving the Solution of Industrial Optimization Problems
- Approach to Multiple Attribute Group Decision Making Based on Hesitant Fuzzy Linguistic Aggregation Operators
- Cubic Ordered Weighted Distance Operator and Application in Group Decision-Making
- Fault Signal Recognition in Power Distribution System using Deep Belief Network
- Selector: PSO as Model Selector for Dual-Stage Diabetes Network
- Oppositional Gravitational Search Algorithm and Artificial Neural Network-based Classification of Kidney Images
- Improving Image Search through MKFCM Clustering Strategy-Based Re-ranking Measure
- Sparse Decomposition Technique for Segmentation and Compression of Compound Images
- Automatic Genetic Fuzzy c-Means
- Harmony Search Algorithm for Patient Admission Scheduling Problem
- Speech Signal Compression Algorithm Based on the JPEG Technique
- i-Vector-Based Speaker Verification on Limited Data Using Fusion Techniques
- Prediction of User Future Request Utilizing the Combination of Both ANN and FCM in Web Page Recommendation
- Presentation of ACT/R-RBF Hybrid Architecture to Develop Decision Making in Continuous and Non-continuous Data
- An Overview of Segmentation Algorithms for the Analysis of Anomalies on Medical Images
- Blind Restoration Algorithm Using Residual Measures for Motion-Blurred Noisy Images
- Extreme Learning Machine for Credit Risk Analysis
- A Genetic Algorithm Approach for Group Recommender System Based on Partial Rankings
- Improvements in Spoken Query System to Access the Agricultural Commodity Prices and Weather Information in Kannada Language/Dialects
- A One-Pass Approach for Slope and Slant Estimation of Tri-Script Handwritten Words
- Secure Communication through MultiAgent System-Based Diabetes Diagnosing and Classification
- Development of a Two-Stage Segmentation-Based Word Searching Method for Handwritten Document Images
- Pythagorean Fuzzy Einstein Hybrid Averaging Aggregation Operator and its Application to Multiple-Attribute Group Decision Making
- Ensembles of Text and Time-Series Models for Automatic Generation of Financial Trading Signals from Social Media Content
- A Flame Detection Method Based on Novel Gradient Features
- Modeling and Optimization of a Liquid Flow Process using an Artificial Neural Network-Based Flower Pollination Algorithm
- Spectral Graph-based Features for Recognition of Handwritten Characters: A Case Study on Handwritten Devanagari Numerals
- A Grey Wolf Optimizer for Text Document Clustering
- Classification of Masses in Digital Mammograms Using the Genetic Ensemble Method
- A Hybrid Grey Wolf Optimiser Algorithm for Solving Time Series Classification Problems
- Gray Method for Multiple Attribute Decision Making with Incomplete Weight Information under the Pythagorean Fuzzy Setting
- Multi-Agent System Based on the Extreme Learning Machine and Fuzzy Control for Intelligent Energy Management in Microgrid
- Deep CNN Combined With Relevance Feedback for Trademark Image Retrieval
- Cognitively Motivated Query Abstraction Model Based on Associative Root-Pattern Networks
- Improved Adaptive Neuro-Fuzzy Inference System Using Gray Wolf Optimization: A Case Study in Predicting Biochar Yield
- Predict Forex Trend via Convolutional Neural Networks
- Optimizing Integrated Features for Hindi Automatic Speech Recognition System
- A Novel Weakest t-norm based Fuzzy Fault Tree Analysis Through Qualitative Data Processing and Its Application in System Reliability Evaluation
- FCNB: Fuzzy Correlative Naive Bayes Classifier with MapReduce Framework for Big Data Classification
- A Modified Jaya Algorithm for Mixed-Variable Optimization Problems
- An Improved Robust Fuzzy Algorithm for Unsupervised Learning
- Hybridizing the Cuckoo Search Algorithm with Different Mutation Operators for Numerical Optimization Problems
- An Efficient Lossless ROI Image Compression Using Wavelet-Based Modified Region Growing Algorithm
- Predicting Automatic Trigger Speed for Vehicle-Activated Signs
- Group Recommender Systems – An Evolutionary Approach Based on Multi-expert System for Consensus
- Enriching Documents by Linking Salient Entities and Lexical-Semantic Expansion
- A New Feature Selection Method for Sentiment Analysis in Short Text
- Optimizing Software Modularity with Minimum Possible Variations
- Optimizing the Self-Organizing Team Size Using a Genetic Algorithm in Agile Practices
- Aspect-Oriented Sentiment Analysis: A Topic Modeling-Powered Approach
- Feature Pair Index Graph for Clustering
- Tangramob: An Agent-Based Simulation Framework for Validating Urban Smart Mobility Solutions
- A New Algorithm Based on Magic Square and a Novel Chaotic System for Image Encryption
- Video Steganography Using Knight Tour Algorithm and LSB Method for Encrypted Data
- Clay-Based Brick Porosity Estimation Using Image Processing Techniques
- AGCS Technique to Improve the Performance of Neural Networks
- A Color Image Encryption Technique Based on Bit-Level Permutation and Alternate Logistic Maps
- A Hybrid of Deep CNN and Bidirectional LSTM for Automatic Speech Recognition
- Database Creation and Dialect-Wise Comparative Analysis of Prosodic Features for Punjabi Language
- Trapezoidal Linguistic Cubic Fuzzy TOPSIS Method and Application in a Group Decision Making Program
- Histopathological Image Segmentation Using Modified Kernel-Based Fuzzy C-Means and Edge Bridge and Fill Technique
- Proximal Support Vector Machine-Based Hybrid Approach for Edge Detection in Noisy Images
- Early Detection of Parkinson’s Disease by Using SPECT Imaging and Biomarkers
- Image Compression Based on Block SVD Power Method
- Noise Reduction Using Modified Wiener Filter in Digital Hearing Aid for Speech Signal Enhancement
- Secure Fingerprint Authentication Using Deep Learning and Minutiae Verification
- The Use of Natural Language Processing Approach for Converting Pseudo Code to C# Code
- Non-word Attributes’ Efficiency in Text Mining Authorship Prediction
- Design and Evaluation of Outlier Detection Based on Semantic Condensed Nearest Neighbor
- An Efficient Quality Inspection of Food Products Using Neural Network Classification
- Opposition Intensity-Based Cuckoo Search Algorithm for Data Privacy Preservation
- M-HMOGA: A New Multi-Objective Feature Selection Algorithm for Handwritten Numeral Classification
- Analogy-Based Approaches to Improve Software Project Effort Estimation Accuracy
- Linear Regression Supporting Vector Machine and Hybrid LOG Filter-Based Image Restoration
- Fractional Fuzzy Clustering and Particle Whale Optimization-Based MapReduce Framework for Big Data Clustering
- Implementation of Improved Ship-Iceberg Classifier Using Deep Learning
- Hybrid Approach for Face Recognition from a Single Sample per Person by Combining VLC and GOM
- Polarity Analysis of Customer Reviews Based on Part-of-Speech Subcategory
- A 4D Trajectory Prediction Model Based on the BP Neural Network
- A Blind Medical Image Watermarking for Secure E-Healthcare Application Using Crypto-Watermarking System
- Discriminating Healthy Wheat Grains from Grains Infected with Fusarium graminearum Using Texture Characteristics of Image-Processing Technique, Discriminant Analysis, and Support Vector Machine Methods
- License Plate Recognition in Urban Road Based on Vehicle Tracking and Result Integration
- Binary Genetic Swarm Optimization: A Combination of GA and PSO for Feature Selection
- Enhanced Twitter Sentiment Analysis Using Hybrid Approach and by Accounting Local Contextual Semantic
- Cloud Security: LKM and Optimal Fuzzy System for Intrusion Detection in Cloud Environment
- Power Average Operators of Trapezoidal Cubic Fuzzy Numbers and Application to Multi-attribute Group Decision Making