An Efficient Quality Inspection of Food Products Using Neural Network Classification
-
Syed Sumera Ershad Ali
 and
Sayyad Ajij Dildar
and
Sayyad Ajij Dildar

Abstract
Currently, there is a necessity for the expansion of precise, rapid, and intentional quality assurance with respect to the character of food and horticultural food items, because it is difficult to maintain and organize food products in an elevated quality and secure manner for the increasing population. In this article, we propose a procedure to resolve difficulties and to categorize food as either a broken or quality product. Therefore, the proposed process encompasses four segments, such as preprocessing, segmentation of broken division, feature extraction, and classification. At the first stage, the preprocessing method is used to remove all unnecessary noises. After that, modified region expansion-related segmentation is undertaken to segment the broken division of the food product. Then, feature extraction is used to remove the distinctive attributes of each food product to categorize their evaluation. Finally, the neural network classification procedure is used to examine the food quality. The proposed method is executed in the operational platform of MATLAB, and the consequences are examined by using obtainable methods.
1 Introduction
Quality is important for the satisfaction of the customer, more than providing supplementary products of an identical kind. The customer is one of the significant parts of product quality decision [8]. Also, quality can be distinguished as the summation of the entire attributes in the manufacture of products that are satisfactory to the customer [14]. Recently, importing countries are gradually increasing the quality of some products. It involves not only securing the domestic seafood market but also protecting the quality of food from other countries [15]. Exterior quality mainly indicates the direct sensory quality of agricultural products. Generally, the exterior quality of fruits and vegetables are estimated based on their color, texture, size, shape, and visual faults [2]. In food manufacturing companies, the supervisors are not only concerned about the amount of production and profits but are also subjectively aware of the eminence of their product, the exterior social surroundings, and the difficulties that farmers face in their agricultural tasks [16].
Food industries possess computerized visual examination systems to diminish function expenditure and augment product eminence control [5]. The augmented knowledge and complexity of customers produce enhanced eminence in consumer food products [9]. The proposed method in this study consists of image acquisition, image preprocessing, and image interpretation for image investigation, which directs to quantification and categorization of images [7], [11]. To meet the requirement of an increasing populace, technical expansion is progressively needed in the areas of agriculture and food [14]. In food product manufacture, color machine vision systems are used to evaluate the actual color of palm oil, fresh fruits, or beef; to recognize melanin spots in Atlantic salmon fillets; to evaluate the red color of grapefruit juice; to recognize the precise color attributes in food processing; and others [10]. Some of the conventions in the assessment of imported foods and related products are established by the Bureau of Standards, Metrology, and Inspection and the Taiwan Food and Drug Administration [4].
Hyperspectral and multispectral computer vision systems are equipped with dominant tools to identify faults that are unfeasible or complicated to identify using the conventional computer vision systems by reason of the dominance of spectral images. Nevertheless, there are numerous challenges to overcome to perform the fault recognition more quickly and precisely in sequence. Some of the challenges are stem-calyx identification, the irregular allocation of precision on a curvature surface, entire surface assessment, the time-consuming process of attainment and processing of the spectral image, competent wavelength choice for dissimilar function, dissimilar fault discrimination, and others.
The requirements of precise, quick, and intentional quality control of food products are expanding by means of augmented potential in food products and protection principles. Generally, computer vision offers a computerized, non-destructive, and expenditure-effectual procedure to meet these necessities. A computer vision system is a systematic device developed for industrial and agricultural use for enhanced production, constant enhancement in expenditure, accessibility, and algorithmic sturdiness. The conventional computer vision system is a dominant tool for the examination of color, texture, size, shape, and comparatively noticeable faults; however, it has less effectiveness in identifying faults. Therefore, the requirement for explaining such disadvantages prompted the authors to accomplish this work.
The contributions of this paper are as follows:
A modified region growing (MRG) segmentation module is proposed to segment the broken division of food products.
A feature extraction module is used to remove the distinctive attributes of each food product.
The proposed artificial neural network (ANN) classifier is used for ranking the food products.
The proposed approach is implemented in the platform of MATLAB.
The performance of the proposed approach is improved in terms of sensitivity, specificity, and accuracy.
The remaining parts of this paper are organized as follows. Section 2 illustrates the related works where our proposed method was based. Section 3 offers the obtainable difficulty and the explanation about using our proposed method. Section 4 gives the simulation results with the performance metrics based on the proposed and existing methods. Finally, Section 5 summarizes the conclusion of our proposed method.
2 Related Works
Calvo et al. [3] have presented a framework that uses computer vision and inductive characterization with a reduced set of features, along with three cases where this framework has been successfully applied to improve the quality inspection process. Three different basic food products were studied, namely Hass avocado, Manila mango, and corn tortillas. These products were very important in economical terms for the sheer volume of their production and marketing. Each product has particular characteristics that involve different ways of handling the quality inspection process, but the presented framework allows addressing common key points that allow automating this process.
Wang et al. [13] have developed an improved food traceability system that could not only achieve forward tracking and diverse tracing like other systems do, but also evaluate food quality timely along the supply chain and provide consumers with the evaluation information, to mainly enhance the consumer experience and help firms gain the trust of consumers. For the food quality evaluation, the method of fuzzy classification was used to evaluate the food quality at each stage of the supply chain, while ANN was adopted for the final determination of the grade of food quality according to all stages of quality evaluation.
Narendra and Hareesh [12] have offered the current expansion and function of image investigation and computer vision system in the quality assessment of products in the areas of agriculture and food. It is necessary for the fundamental perception and equipment related to the computer vision system because this device is employed for image investigation and computerized categorization and ranking. The effectiveness and the appropriate evaluation progression are significant to augment the efficiency in the agricultural industry. The agriculture industry is enhanced greatly, mainly in expressions of fruit ranking. The evaluation of the fruit is used to develop the eminence of fruits, because high-quality fruits are exported to other countries and engender a large profit.
Dubey and Jalal [6] have introduced and validated an image processing-based apple fruit disease classification approach. The presented approach comprised four steps. The K-means clustering-based defect segmentation method was used in the first step for region of interest extraction. In the second step, state-of-the-art color-, texture-, and shape-based features were drawn from the segmented apple diseases. The different types of features were combined to form the more distinctive feature in the third step. In the last step, the training and classification were done using a multiclass support vector machine.
Al-Marakeby et al. [1] proposed a vision-related categorization system to augment the eminence of food products. The categorization progression relies on detaining the image of the fruit or product and examining this image to remove the faulty products. Signals send computer-interfacing cards to organize the categorization gates. Four dissimilar systems for dissimilar food products are enhanced, like apples, tomatoes, eggs, and lemons.
3 Proposed Food Quality Grading Method
The quality of food product is very significant to human health. The preferred quality is diminished because of the large populace and the augmented necessities of food products. In the manual method, organizing tons of fruits and vegetables is slow, expensive, and inaccurate; however, computer vision is fast, profitable, and constant where an intention analysis procedure is applied to numerous diverse industries. Due to the expansion of complete computerized progression, the speed and exactness meet the manufacture and quality requirements. Automation is an action that is used to manage a progression at the best effectiveness. Moreover, it handles the system with an instruction that is programmed into it. The automated grading system accelerates the time of progression and also diminishes the faults of the system. Therefore, this food quality examination process is derived from image analysis that carries out diverse functions in the food industry.
The overall architecture of the proposed food quality grading technique is given in Figure 1.
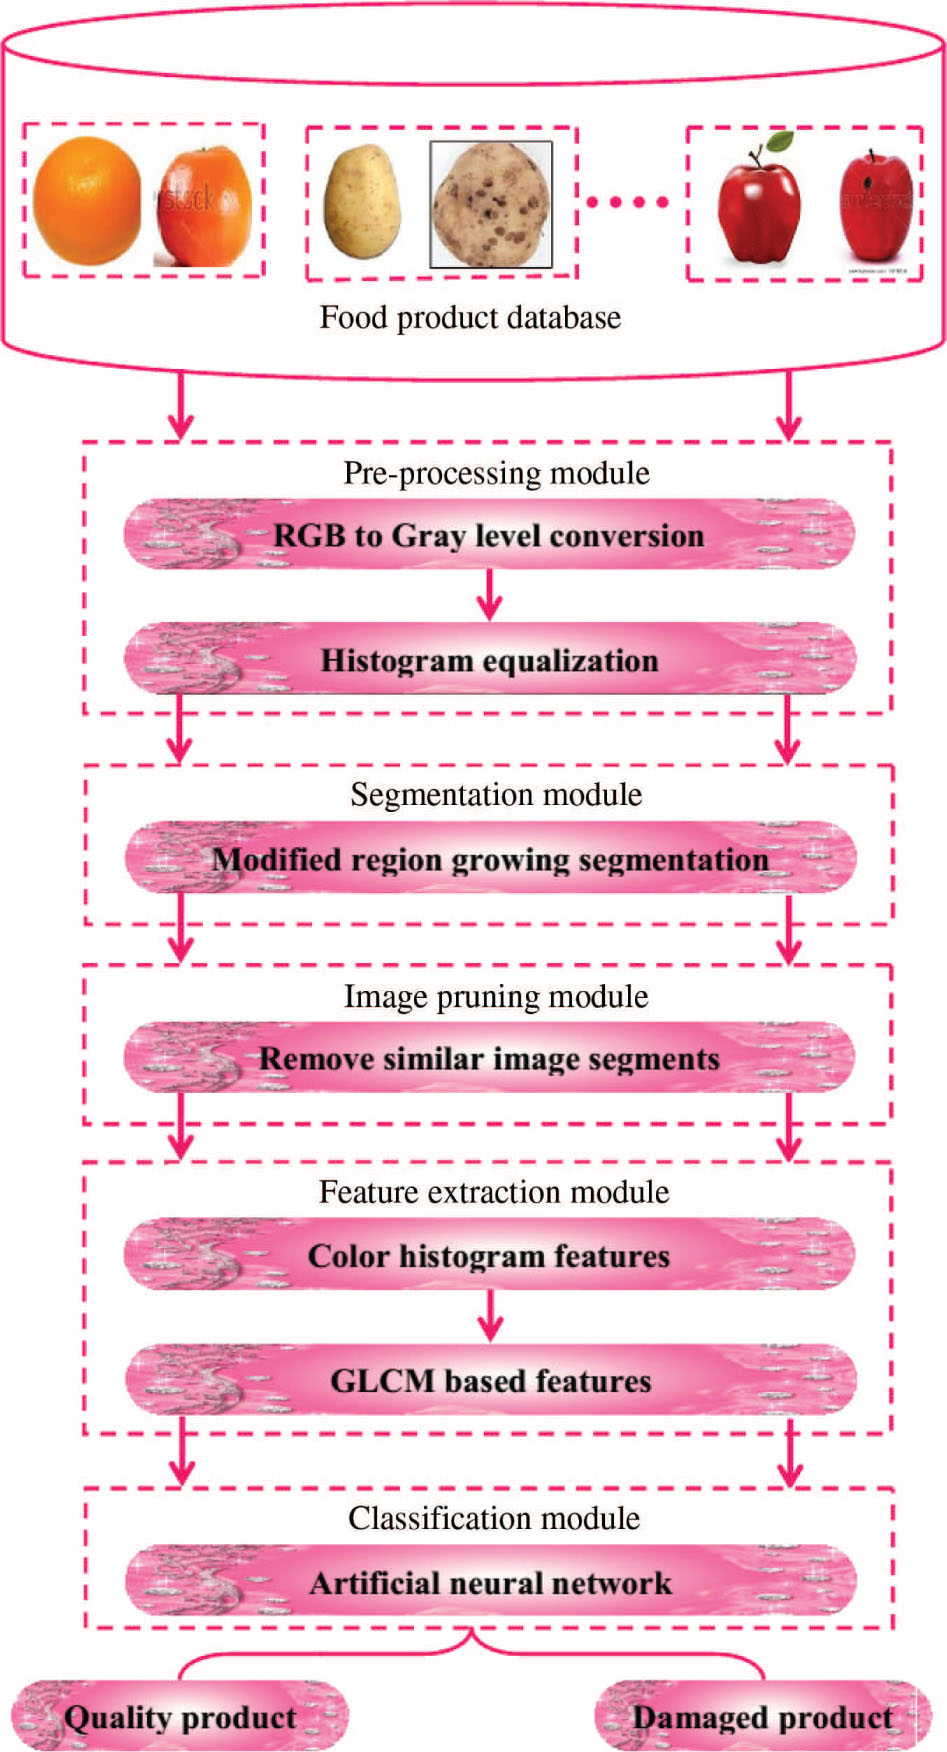
Overall Architecture of the Proposed Food Quality Grading Technique.
3.1 Outline of the Proposed Method
The steps involved in the proposed method are given as follows:
Preprocessing
Histogram equalization
MRG segmentation
Feature extraction
Color histogram features
Gray-level co-occurrence matrix (GLCM) features
ANN
Each stage in the proposed method is detailed in the following sections.
3.2 Preprocessing
In the beginning, the preprocessing method is used to reduce the unnecessary noise elements that complicate the computation. The preprocessing method is conducted by way of RGB (red, green, blue) to gray level image renovation method with the histogram equalization method, where the contrast of the image is augmented.
a. Histogram Equalization
In this segment, the histogram equalization procedure augments the image contrast. The histogram equalization process distributes the intensity values with the overall series of values to accomplish advanced contrast. An image is signified by means of closely contrasting values, like the background and foreground is bright or dark at the identical time, and this process is helpful.
Histogram equalization is the conversion of gray level s to gray level t, where the circulation of gray level t is identical. In this conversion, the method enlarges the series of gray levels for the histogram maxima. The conversion also enhances the detectability of numerous image attributes because the contrast is extended for several image pixels.
The probability density function of a pixel intensity level Qm can be given by
where
Now, the histogram can be derived by plotting
The consequence of contrast is altering the strength of each pixel based on its local region. The image encompasses a great dissimilarity of strength among the maximum and minimum strength levels, and then the image contains high contrast. Therefore, the region of local contrast obtains a superior contrast that does not disturb the universal contrast in the histogram equalization image. Then, images are provided for attribute removal progression to augment the image contrast.
3.3 MRG Segmentation
The region growing segmentation is generally placed at a starting position, which is developed in the order of the starting position from the adjacent pixels through the intensity limitations. A threshold value is predefined for this intention. Additionally, the development of the region fulfills the threshold. However, the standard region development method has some drawbacks.
a. Drawbacks of Region Growing
It is based on noise addition or alteration of intensity values, which may provide holes or oversegmentation.
Moreover, the dimness of actual images is complicated to discriminate.
The calculation overrides the time or power.
The flowchart of the MRG technique is given in Figure 2.
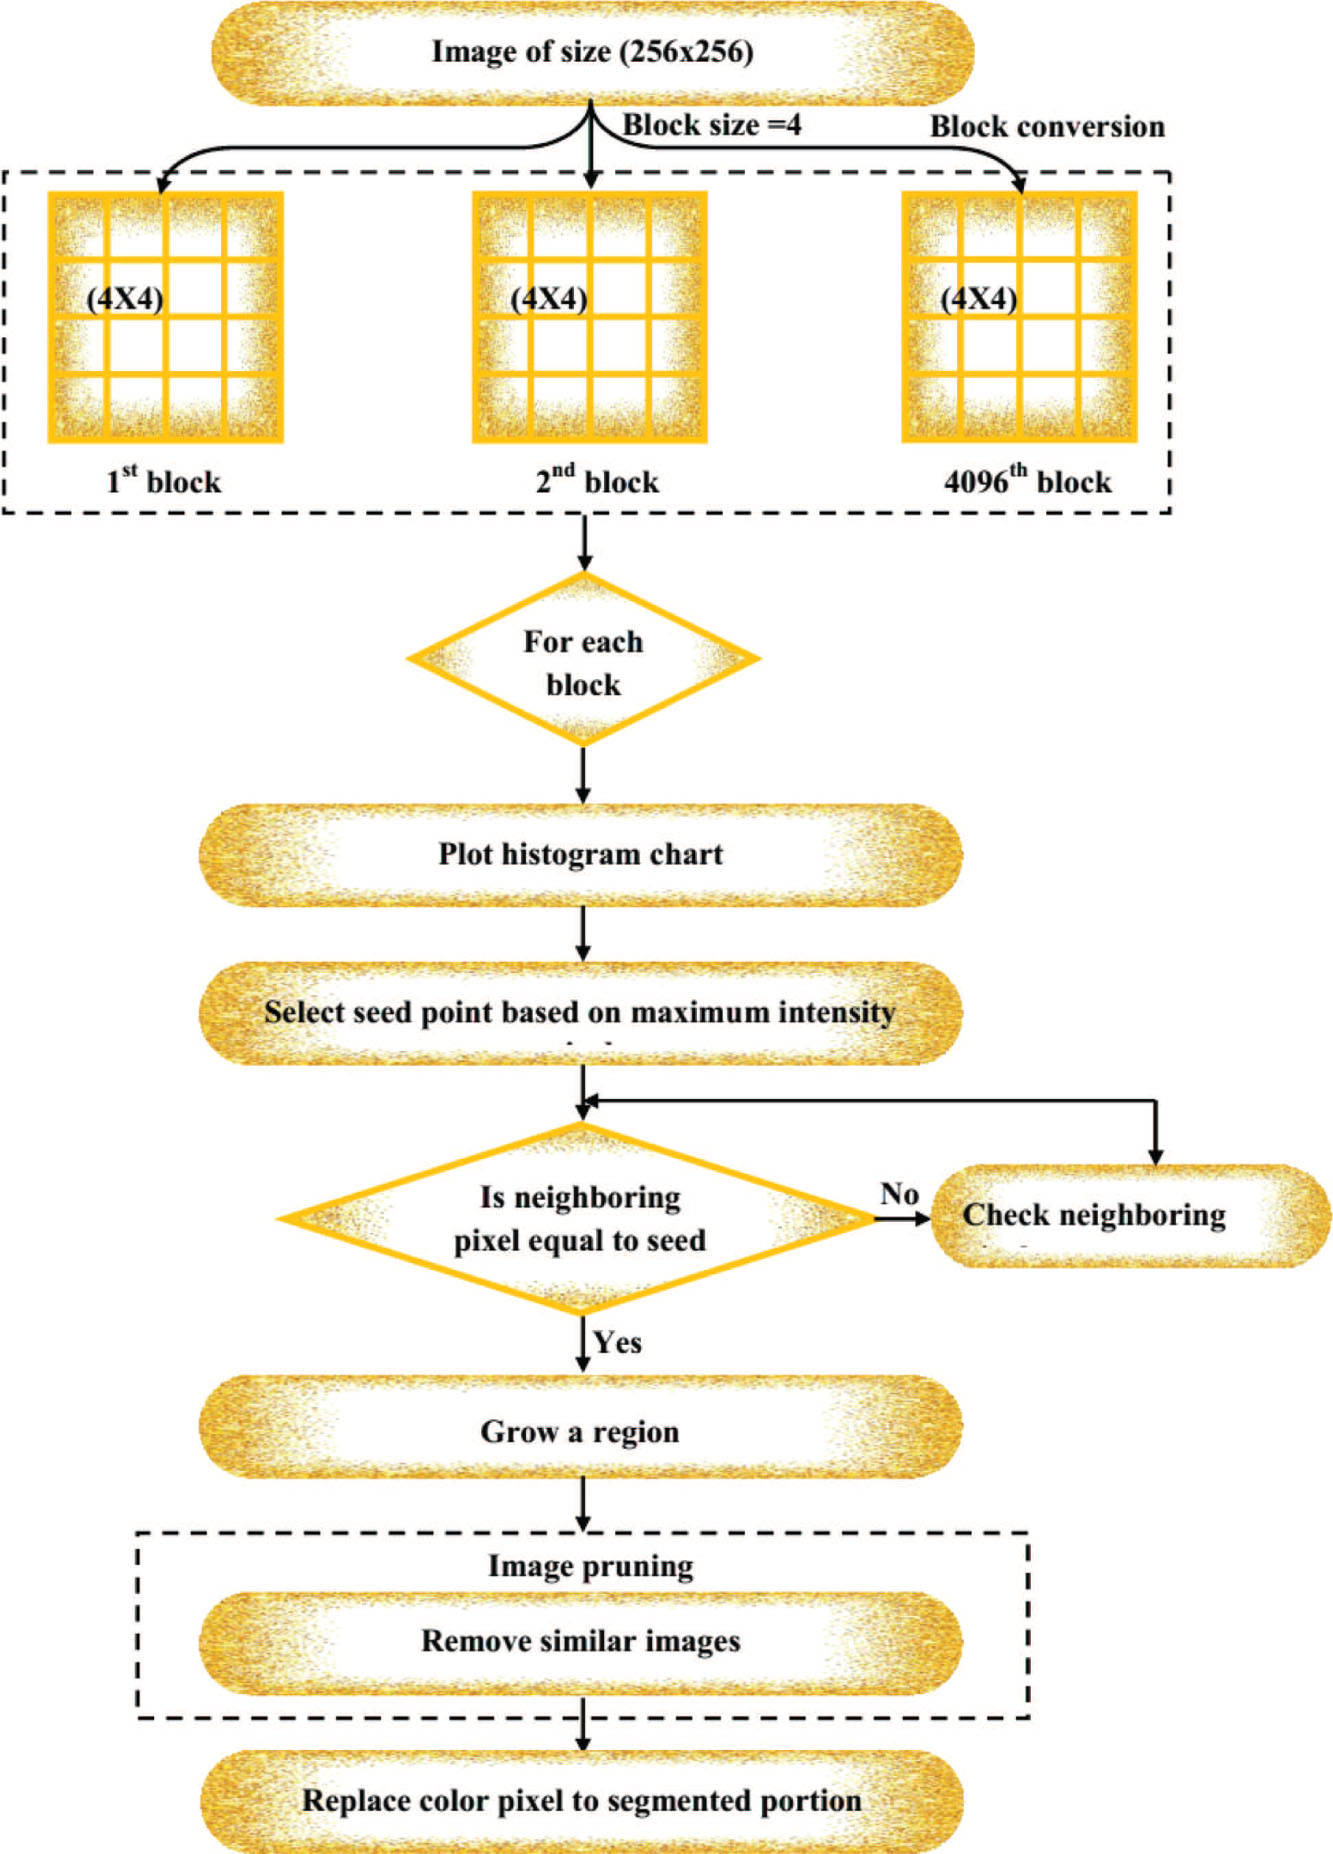
Flowchart of the MRG Technique.
In the region growing algorithm, the choice of a starting position is a fundamental process that concerns the segmentation consequences. In the fully mechanical method, the region growing algorithm chooses a starting position by using the information of a histogram. In our proposed process, customized region growing is established to conquer the disadvantage of the standard region growing process. Thus, the customized region growing process is identical to the standard region growing process. However, the block alteration and the choice of starting position discriminate the conventional region growing algorithm. At this point, the choice of starting position is determined by the greatest intensity value that is acquired from the histogram of images.
b. Steps Involved in the MRG Segmentation Method
The process of the proposed MRG segmentation technique is specified below.
i. Image Block Conversion
In the initial process, image blocking is used to separate the food images as identical blocks for progression. The blocks are produced to create precise dimensions. The quantity of blocks is derived from the necessity. The grids contain 4, 18, and 24 blocks. At this point, the 4 × 4 blocks are prepared for investigation and each block is generated in a discrete manner. Therefore, a 4096 quantity of 256 × 256 blocks is generated for the input image.
ii. Plot Histogram
The histogram H is obtained for each pixel position in each 4 × 4 block.
iii. Initialize Seed Points
The greatest intensity pixel is established from the histogram for each block. The greatest intensity pixel is the starting position S.
iv. Set Threshold (T)
The threshold value is predetermined and region growing is prepared by fulfilling the thresholds in adjacent pixels.
v. Euclidean Distance Calculation
Afterward, the progression of region growing is carried out by developing the cluster that obtains the adjacent pixels in the order of the preferred starting position. In the block, the detachment among pixels is calculated by using the starting position. The Euclidean detachment measure is exploited for the detachment assessment. In this computation, development of the region is made in the region of the starting position when the value of detachment gratifies the threshold. The Euclidean detachment among the starting position pixels and its adjacent pixel are estimated in the following equation:
where
vi. Region Growing Constraint
The limitation (
vii. Iterative Step
Reiterating the above step (ii) to step (vi) for the entire blocks, up to 4096 segments are created.
viii. Image Pruning
When the progression of segmentation is finished, we obtain a number of segmented output images of
ix. Termination
This is the final step, which concludes the progression.
The segmented images are provided for categorization for detecting the faulty product. Some typical attributes are removed for the exclusive class of images.
3.3.1 Feature Extraction
Subsequently, the definite texture-related and color-related attributes are removed from image segmentation, which is used for the image classification. The segment of a food product is established as faulty in classification, then the complete product is indicated as a faulty product. The texture attributes are removed through the exploitation of GLCM. Similarly, the color histogram attributes are acquired for the entire image segmentation regions.
By the GLCM matrices, 22 attributes are predetermined. Therefore, we take out 22 attributes for every color element of the RGB color images, which provide 66 attributes for each image. Moreover, the mean of color histogram attributes provides one attribute value. As a result, a total of 67 attributes are removed for each block.
a. GLCM Features
GLCM is established by means of Haralick. It illustrates the texture through arithmetical illustration of how definite gray levels take place in association with further gray levels. The GLCM is a computation of a combined probability density function of gray level couples in an image.
Thus, the GLCM can be expressed as
where Z is the number of pixels in the color image. The GLCM-related attributes contain autocorrelation, contrast, correlation, cluster prominence, cluster shade, dissimilarity, energy, entropy, homogeneity, maximum probability, sum of squares: variance, sum average, sum variance, sum entropy, difference variance, difference entropy, information measure of correlation, inverse difference, inverse difference normalized, inverse difference moment normalized, and others.
Some of the definitions and equations of the most commonly used features are given below.
(i) Correlation
Correlation is used to estimate the linear addition of gray levels of adjacent pixels. Digital image correlation is a visual procedure that exploits the image alteration. Generally, it is utilized to estimate the deformation, displacement, strain, and optical flow, and is a typical function for evaluating the movement of an optical mouse. It is described in the subsequent equation:
where
(ii) Contrast
Contrast is the conflict of gray level, which is the disparity among the greatest and the least values of a group of pixels. The GLCM contrast is consistently related by way of spatial frequencies. It is given by Eq. (6).
(iii) Energy or Angular Second Moment
The angular second moment is otherwise called homogeneity or energy. It represents the sum of squares of entries in the GLCM. It evaluates the image homogeneity and is found to be high when the image possesses excellent homogeneity or when the pixels are very identical.
(iv) Entropy
Entropy is the quantity of image information that is used to assist image compression (i.e. the failure of image information). Entropy also deals with arithmetical uncertainty. The image does not textually match numerous GLCM fundamentals; rather, it acquires irrelevant values, which specify that the entropy is remarkably great. Entropy is represented in Eq. (8):
(v) Homogeneity
Homogeneity is used to distinguish the circulation of the values on the transverse GLCM to the circulation of the values in the GLCM. Homogeneity is specified as
With the GLCM attributes removed for the entire three color elements of the RGB color image, the color histogram attributes are also estimated.
b. Color Histogram Features
Color histogram feature is usually employed in the image processing procedure. In a color histogram, it is computationally very insignificant to estimate, because slight alterations do not concern the histogram in camera. In computer vision and image processing, numerous researchers are illustrating that color histogram is invariant to convert, revolving the image on the observation axis, tiny off-axis alteration, scale alteration, and incomplete occlusion. A color histogram is also incapable of altering the image and histogram resolution.
c. Steps to Extract Color Histogram Features of an RGB Color Image
| Input: RGB color image |
| Output: Feature vector |
| Color plane separation: Decompose the RGB color image into its three color components, i.e. red (R), green (G), and blue (B). |
| Plot the histograms from the color components R, G, and B. |
| For each color component, compute the probability histogram as follows: |
(10) |
| where |
| Divide the probability histogram into |
(11) |
| Here, the size of bin is set as (j = 8). Bin 0 corresponds to intensities 0–31, bin 1 to 32–63, bin 2 to 64–95, bin 3 to 96–127, bin 4 to 128–159, bin 5 to 160–191, bin 6 to 192–223, and bin 7 to 224–255. |
| Now, a vector |
| Finally, the mean of the feature vector is computed. |
(12) |
| For all the food products, the color histogram features are extracted using the above steps. |
3.3.2 ANN
ANN is an information and computing process that is inspired by genetic neurons. ANN is broadly implemented in diverse areas of science and technology, and includes time sequence, model identification, and progression control. At this point, ANN categorization is used to examine the food eminence (as a damaged or quality food product), which is derived from the color histogram and GLCM attributes. Generally, ANN contains three layers, such as an input layer, hidden layer, and output layer. The input layer encompasses the current information of the network (i.e. the GLCM-related attributes and color histogram attributes of the broken and quality food product images). Moreover, the output layer provides the reaction of the specified input (i.e. the quality grades of the food products). The arrangement of an ANN is specified in Figure 3.
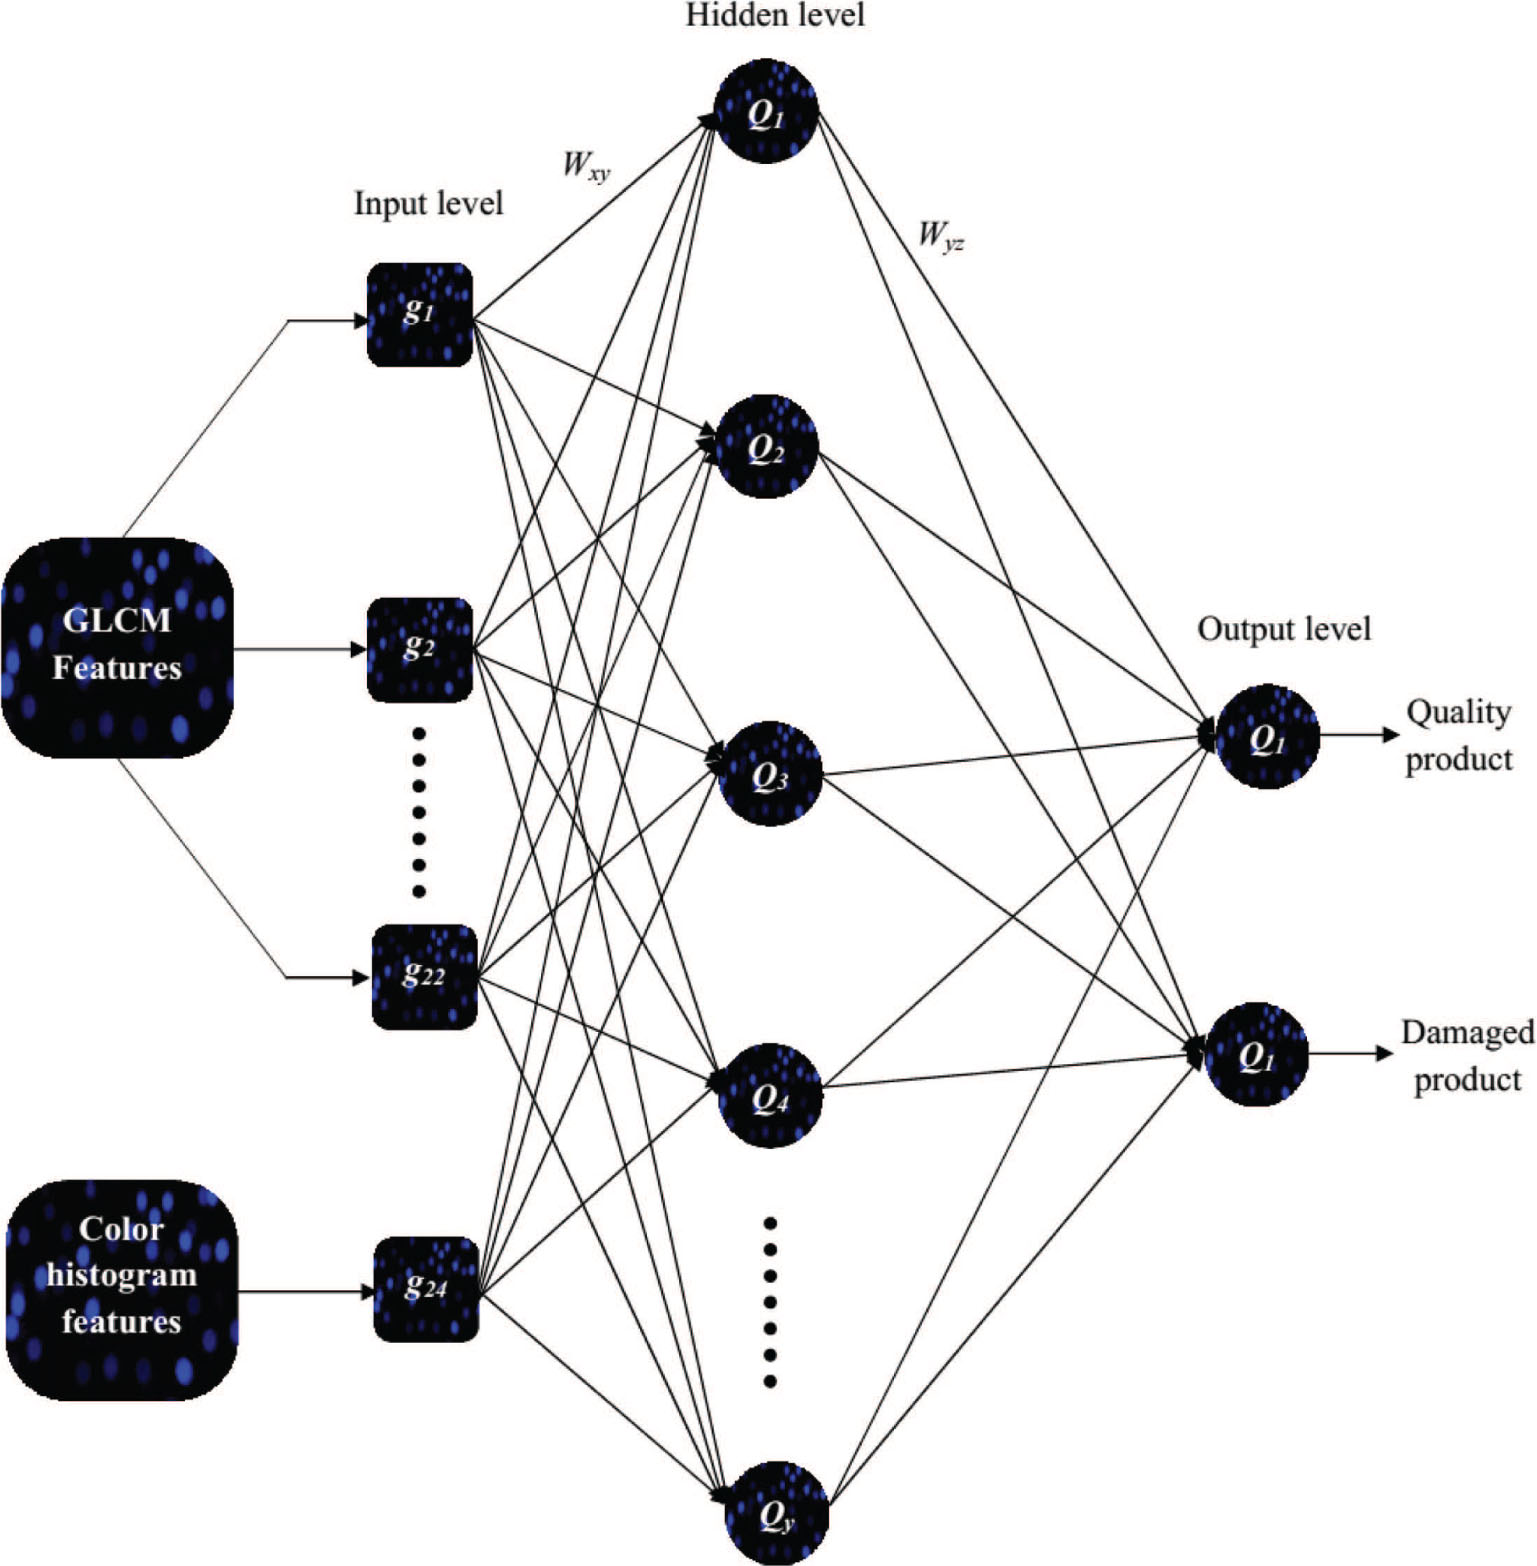
Structure of ANN.
The recent vast research activities in classification have established that the neural network is a promising alternative to various conventional classification methods. The objective of the neural network is to convert the inputs into significant outputs. The neural network was trained by using the back-propagation algorithm. The different combinations of functions and the effect of using ANN as a classifier is studied, and the correctness of these functions are analyzed for various kinds of datasets. The back-propagation neural network (BPNN) can be used as a highly successful tool for dataset classification with a suitable combination of training, learning, and transfer functions. When the maximum likelihood method was compared with the BPNN method, the BPNN was more accurate than the maximum likelihood method.
a. Back-propagation Algorithm
The back-propagation algorithm is established through the assessment of the output model to the intention model. The fault values are predetermined from the output components. The alteration of incoming weight is established by the input layer and crosses the hidden layer. The benefit of the algorithm is that it obtains accurate network weights and lessens the preparation faults of the categorization process.
Step 1
Consider that the primary value is a diminutive random value for each interconnection weight among the input to hidden and the hidden to output layers.
Step 2
Introduce the knowledge model combination (i.e. the input attributes of the preparation models and its result and intention through eminence and faulty label) and activate steps 3 to 5 by way of model combination. The preparation model is specified below:
where
Step 3
Compute the output (i.e. quality and defective food image segments) of each network layer in the image, which is derived from the equation below:
where
From Eq. (14), oz is the productivity of the network from zth output node.
Moreover, wru is the association weight among input and hidden nodes.
Step 4
Calculate training error (δ) using the following equation:
where
Step 5
The accurate weights of subsequent iteration [
From Eq. (17),
Step 6
Verify whether the productivity meets the exactness requirement of the preparation models and conclude the preparation progression.
The preparation progression is accomplished, and then the network is qualified to identify the faulty food images that are derived from its attributes. At this point, every dissimilar division of the food product is verified and ranked. The proposed food quality ranking process ranks the food product as an eminence product if all divisions of the image are not faulty.
4 Results and Discussion
This section provides the results and discussion about an efficient quality inspection of food products using MRG-based segmentation and ANN-based classification approaches. The proposed algorithm is executed using MATLAB software, and the experimentation is carried out using a system with 4 GB RAM and a 2.10-GHz Intel i-3 processor.
For analysis, the food images are collected from databases. These acquired data were preprocessed, analyzed, classified, and segmented for defect detection. In this experiment, the defective part of the image is identified with the help of MRG-based segmentation and ANN-based classification approaches.
Therefore, the structure obtained for the existing method is illustrated in Figure 4.
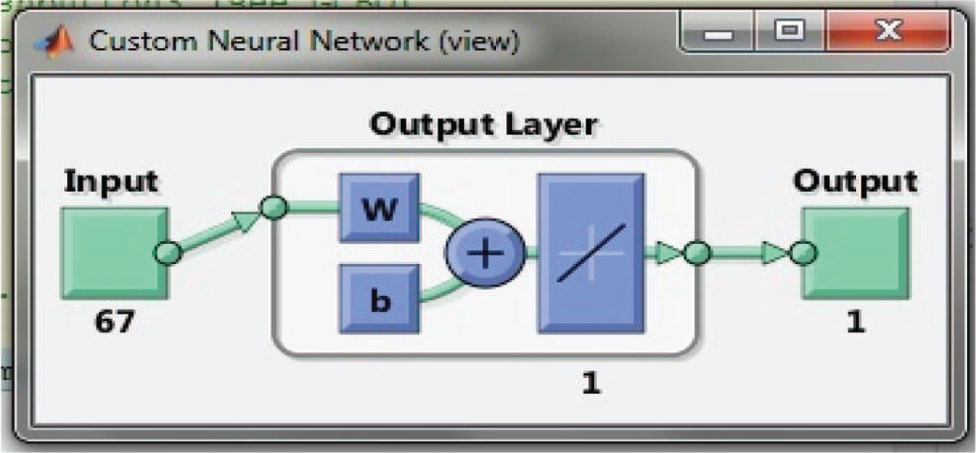
Neural Network Structure Obtained for the Proposed Method.
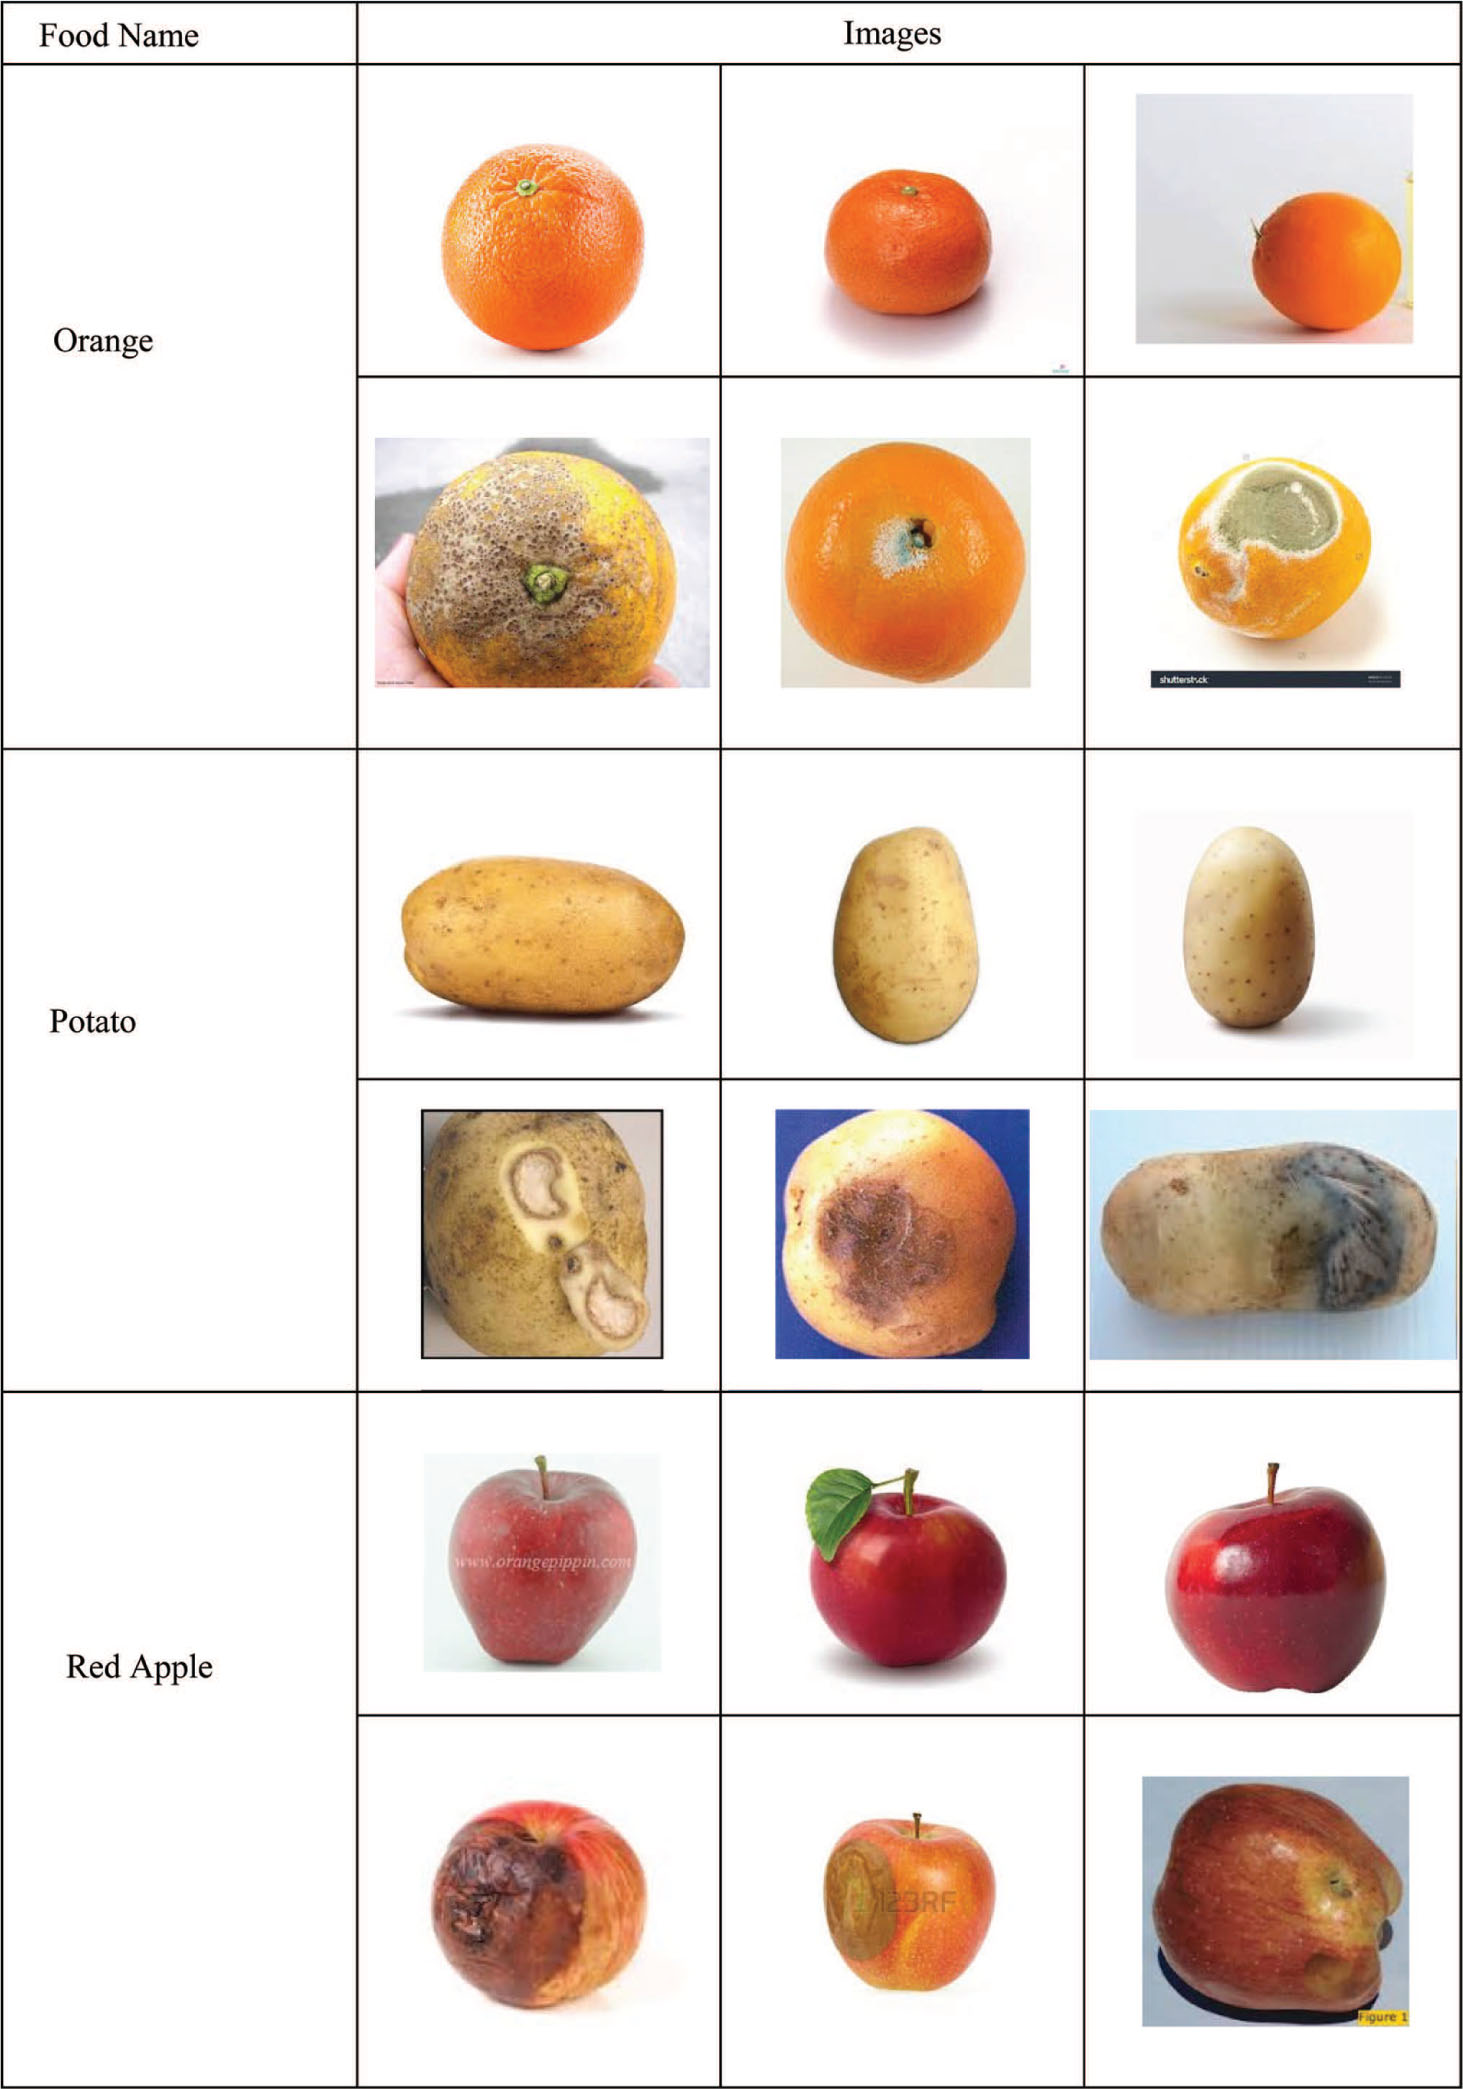
Input Database Images.
The input food images in the database are demonstrated in Figure 5.
In the database, the input images are preprocessed by means of RGB to gray level conversion and then the histogram equalization technique. The preprocessed output is shown in Figure 6.
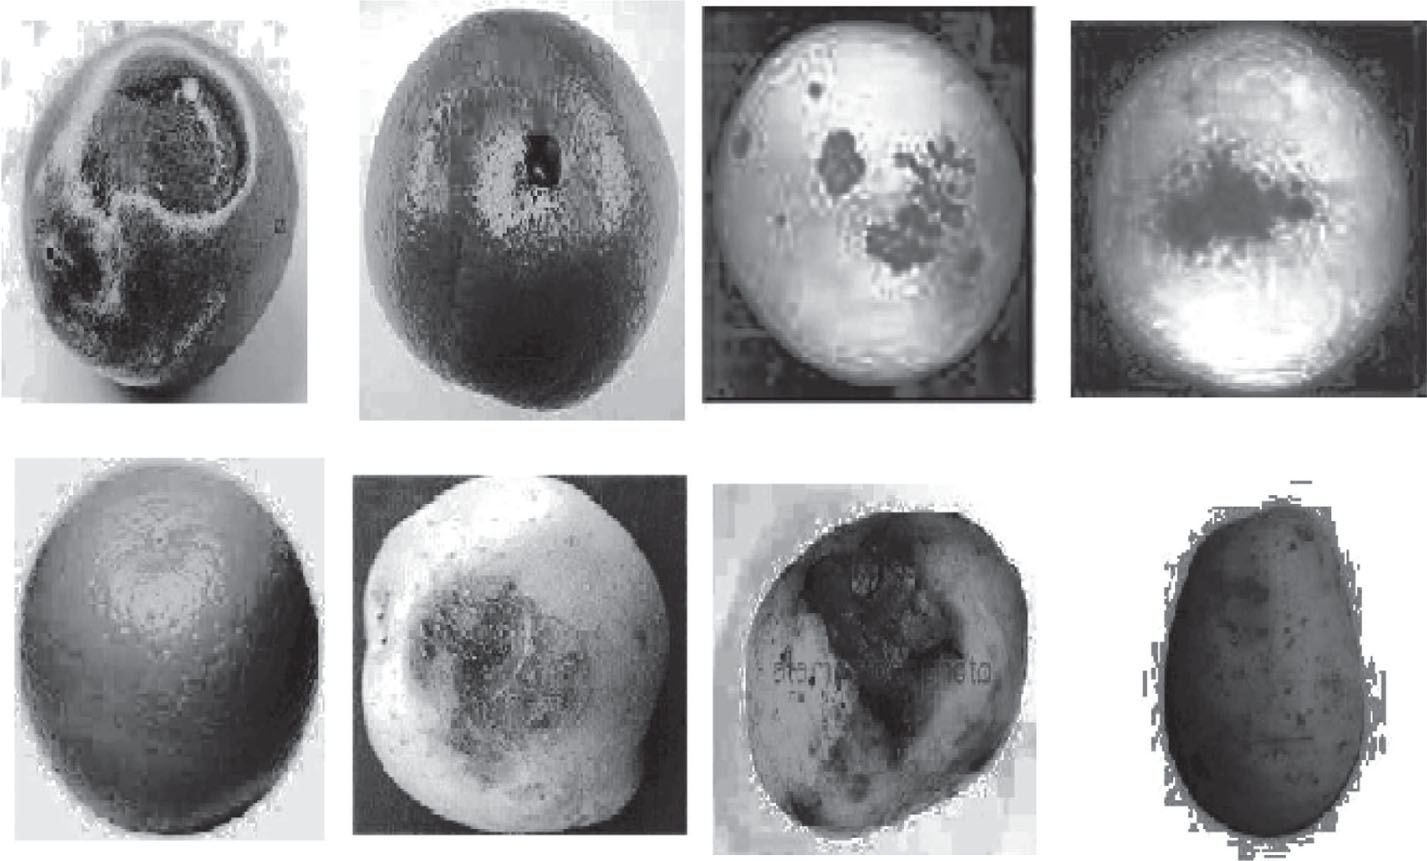
Preprocessed Images.
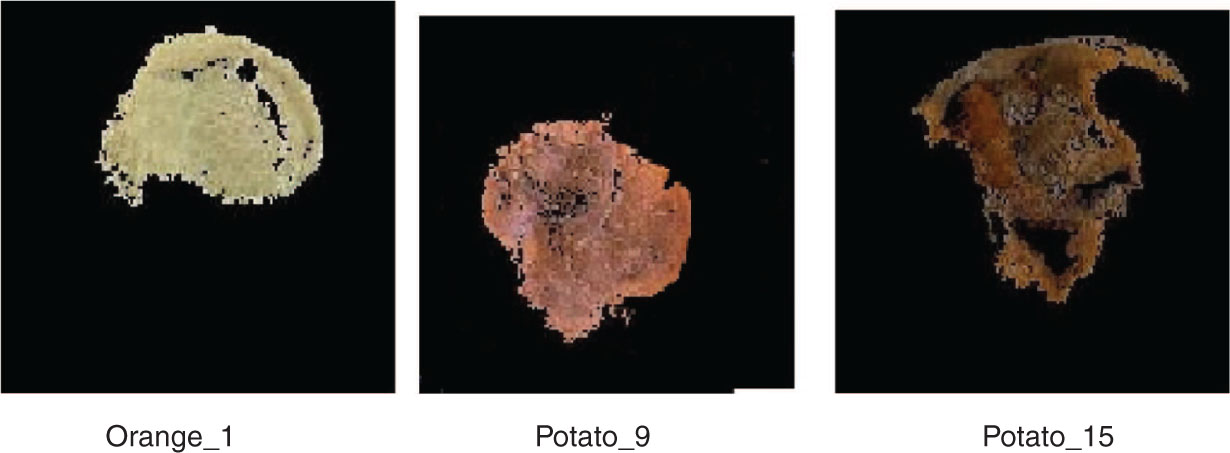
The preprocessed image is segmented by means of MRG segmentation. Then, the image is divided into uniform blocks for processing and the seed point is grown from that point. Afterward, the similar segments are removed. The segmented portion of the food image is given in Figure 7.

Segmented Images.
The regions have grown from the segmented image, which is illustrated in Figure 8.
Images of the Segmented Region.
4.1 Evaluation Metrics
The assessment metrics are sensitivity, specificity, accuracy, precision, false-positive rate (FPR), and false-negative rate (FNR). The standard count values are true positive (TP), true negative (TN), false positive (FP), and false negative (FN), which are depicted below.
Sensitivity
The ratio of a number of TP to the sum of TP and FN is called sensitivity:
Specificity
Specificity is the ratio of a number of TN to the sum of TN and FP:
Accuracy
Accuracy is calculated using the measures of sensitivity and specificity. It is denoted as follows:
FPR
The FPR is calculated as the number of incorrect positive predictions divided by the total number of negatives. It can also be calculated as 1 − specificity:
FNR
The FNR is calculated as the number of incorrect negative predictions divided by the total number of negatives:
4.2 Performance Analysis
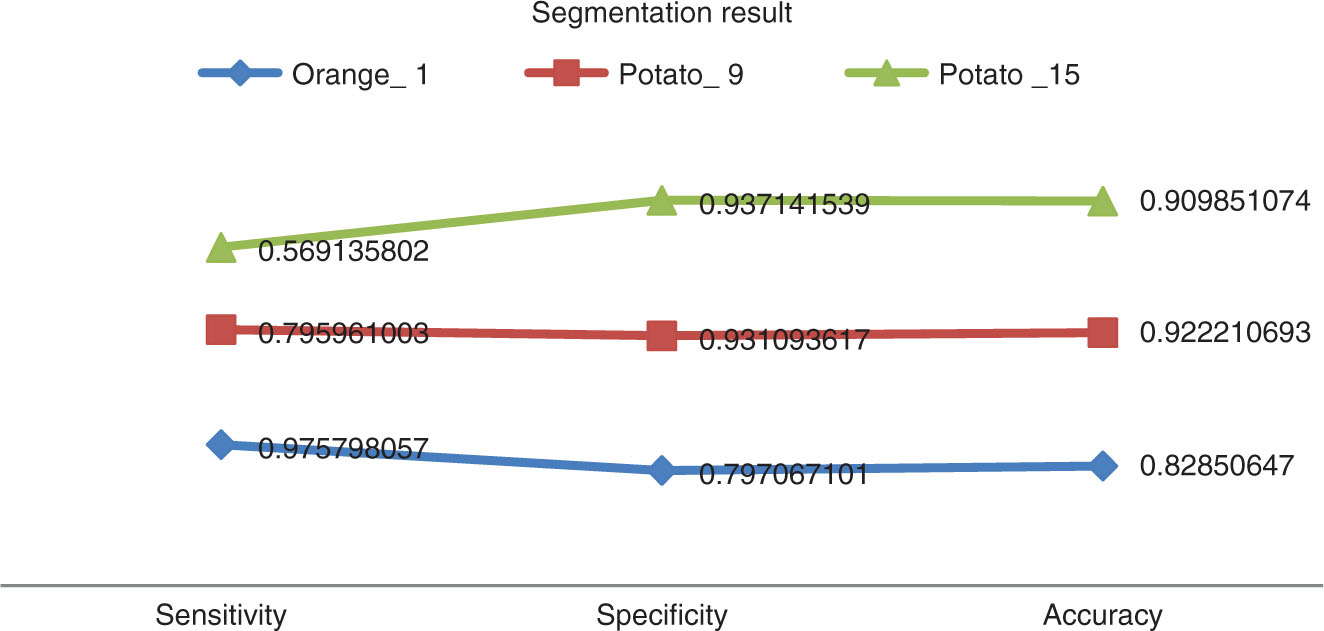
In this section, the performance assessment of the proposed MRG-based ANN image classification method is illustrated. The sensitivity, specificity, accuracy, FPR, and FNR values of the proposed and existing methods for database images for segmentation result are summarized in Table 1.
Sensitivity, Specificity, Accuracy, FPR, and FNR Values for the Segmentation Result for Different Food Images.
| Image name | Sensitivity | Specificity | Accuracy | FPR | FNR |
|---|---|---|---|---|---|
| Orange_1 | 0.975798 | 0.797067 | 0.828506 | 0.202933 | 0.024202 |
| Potato_9 | 0.795961 | 0.931094 | 0.922211 | 0.068906 | 0.204039 |
| Potato_15 | 0.569136 | 0.937142 | 0.909851 | 0.062858 | 0.430864 |
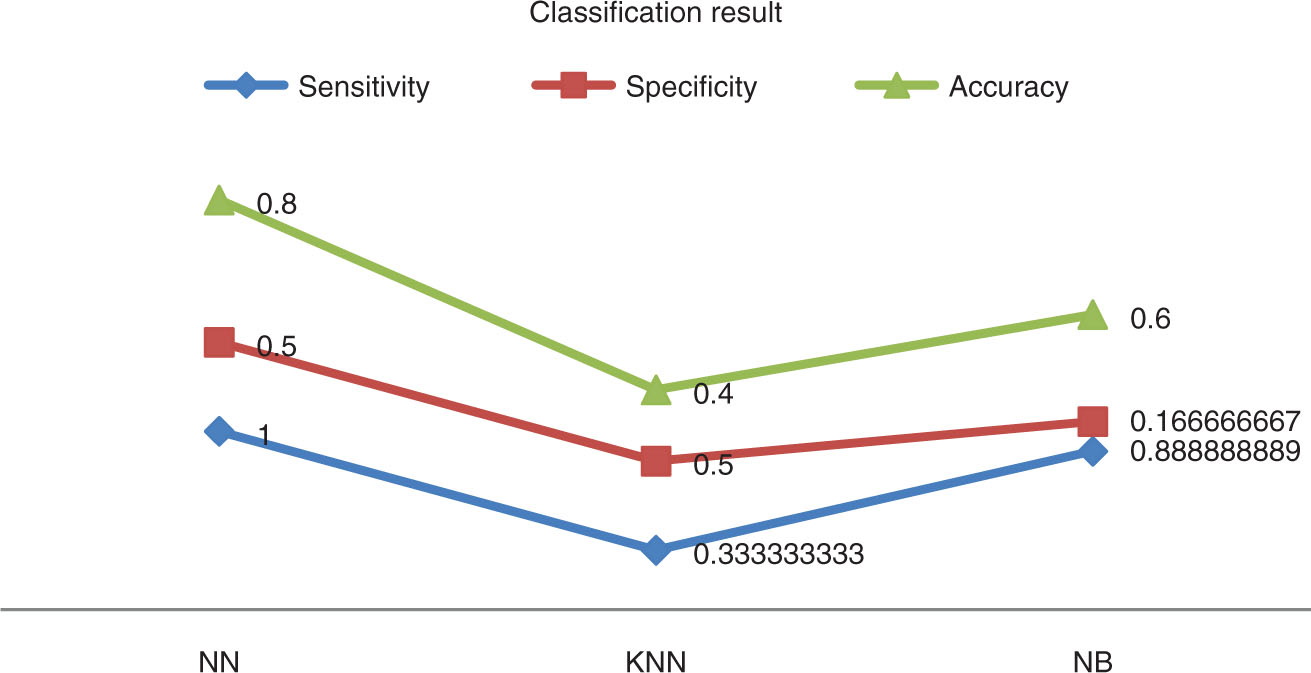
The sensitivity, specificity, accuracy, FPR, and FNR values of proposed and existing methods for classification result are summarized in Table 2.
Sensitivity, Specificity, Accuracy, FPR, and FNR Values for the Classification Result for Different Food Images.
| Metrics | NN | KNN | NB |
|---|---|---|---|
| Sensitivity | 1 | 0.333333 | 0.888889 |
| Specificity | 0.5 | 0.5 | 0.166667 |
| Accuracy | 0.8 | 0.4 | 0.6 |
| FPR | 0.5 | 0.5 | 0.833333 |
| FNR | 0 | 0.666667 | 0.111111 |
NN, neural network; KNN, K-nearest neighbor; NB, naive Bayes.
By analyzing the tables, it is clear that the proposed method is more accurate than any other existing technique. From Table 1, the sensitivity, specificity, and accuracy values for the food type orange_1 is 97%, 79%, and 82%, respectively. Likewise, the sensitivity, specificity, and accuracy values for other food types like potato_9 and potato_15 are tabulated.
While analyzing classification accuracy values, the proposed MRG-ANN technique obtained 80% accuracy when compared with other existing approaches like the K-nearest neighbor and naive Bayes algorithms. Moreover, the sensitivity and specificity values are more reliable for the proposed MRG-ANN technique when compared with an existing technique. Likewise, both FPR and FNR values attain good results for the proposed and existing methods for different food products.
Finally, the segmentation and classification comparison plots for the proposed and existing techniques for food images are provided in Figures 9 and 10.
Comparison Plot for Different Food Images.
Comparison Plot for Proposed vs. Existing Technique for Different Food Images.
The comparison results show that the segmentation and classification results of the proposed MRG-based segmentation and ANN-based classification are more reliable.
5 Conclusion
In this article, we established a competent food eminence ranking process, which is derived from MRG-related segmentation and ANN-related categorization methods. Initially, the input images are preprocessed by means of the histogram equalization procedure. Afterward, MRG-related segmentation is used to separate the definite appropriate attributes like GLCM-related and color histogram attributes. After that, the ANN classifier ranks the food products. The presentation of the proposed procedure is estimated and contrasted by means of an obtainable process. The results of the proposed method illustrate an effectual method of food eminence ranking in comparison with other methods.
Bibliography
[1] A. Al-Marakeby, A. A. Aly and F. A. Salem, Fast quality inspection of food products using computer vision, Int. J. Adv. Res. Comput. Commun. Eng. 2 (2013), 4168–4171.Search in Google Scholar
[2] T. Brosnan and D.-W. Sun, Improving quality inspection of food products by computer vision – a review, J. Food Eng. 61 (2004), 3–16.10.1016/S0260-8774(03)00183-3Search in Google Scholar
[3] H. Calvo, M. A. Moreno-Armendáriz and S. Godoy-Calderón, A practical framework for automatic food products classification using computer vision and inductive characterization, Neurocomputing 175 (2016), 911–923.10.1016/j.neucom.2015.06.095Search in Google Scholar
[4] H.-C. Chen, H.-L. Huang, S.-C. Chen, W.-L. Lu, C.-H. Tung, H. W. Shiau, J. Y. Wang, H. W. Huang, J. F. Shyu, R. L. Feng and Y. M. Chiang, Border inspections of imported food and related products in Taiwan from 2011 to 2013, J. Food Drug Anal. 23 (2015), 161–163.10.1016/j.jfda.2014.08.001Search in Google Scholar PubMed
[5] M. M. Chetima and P. Payeur, Automated tuning of a vision-based inspection system for industrial food manufacturing, in: 2012 IEEE International Instrumentation and Measurement Technology Conference Proceedings, 2012.10.1109/I2MTC.2012.6229334Search in Google Scholar
[6] S. R. Dubey and A. S. Jalal, Apple disease classification using color, texture and shape features from images, Signal Image Video Process. 10 (2016), 819–826.10.1007/s11760-015-0821-1Search in Google Scholar
[7] C. Galimberti, I. Corti, M. Cressoni, V. M. Moretti, S. Menotta, U. Galli and D. Cambiaghi, Evaluation of mercury, cadmium and lead levels in fish and fishery products imported by air in North Italy from extra-European Union Countries, Food Control 60 (2016), 329–337.10.1016/j.foodcont.2015.08.009Search in Google Scholar
[8] S. Janardhana, J. Jaya, K. J. Sabareesaan and J. George, Computer aided inspection system for food products using machine vision – a review, in: Proceedings of International Conference on Current Trends in Engineering and Technology, ICCTET’13, 2013.10.1109/ICCTET.2013.6675906Search in Google Scholar
[9] T. Laikko-Roto, S. Makela, J. Lunden, J. Heikkil and M. Nevas, Consistency in inspection processes of food control officials and efficacy of official controls in restaurants in Finland, Food Control 57 (2015), 341–350.10.1016/j.foodcont.2015.03.053Search in Google Scholar
[10] D.-J. Lee, J. K. Archibald and G. Xiong, Rapid color grading for fruit quality evaluation using direct color mapping, IEEE Trans. Autom. Sci. Eng. 8 (2011), 292–302.10.1109/TASE.2010.2087325Search in Google Scholar
[11] V. G. Narendra and K. S. Hareesh, Prospects of computer vision automated grading and sorting systems in agricultural and food products for quality evaluation, Int. J. Comput. Appl. 1 (2010), 0975–8887.10.5120/111-226Search in Google Scholar
[12] V. G. Narendra and K. S. Hareesh, Quality inspection and grading of agricultural and food products by computer vision – a review, Int. J. Comput. Appl. 2 (2010), 0975–8887.10.5120/612-863Search in Google Scholar
[13] J. Wang, H. Yue and Z. Zhou, An improved traceability system for food quality assurance and evaluation based on fuzzy classification and neural network, Food Control 79 (2017), 363–370.10.1016/j.foodcont.2017.04.013Search in Google Scholar
[14] B. Zhang, W. Huang, J. Li, C. Zhao, S. Fan, J. Wu and C. Liu, Principles, developments and applications of computer vision for external quality inspection of fruits and vegetables: a review, Food Res. Int. 62 (2014), 326–343.10.1016/j.foodres.2014.03.012Search in Google Scholar
[15] J. Zhou, Z. Yan and Y. Wang, Improving quality and safety of aquatic products: a case study of self-inspection behavior from export-oriented aquatic enterprises in Zhejiang Province, China, Food Control 33 (2013), 528–535.10.1016/j.foodcont.2013.03.019Search in Google Scholar
[16] J. Zhou, Z. Yan and K. Li, Understanding farmer cooperatives’ self-inspection behavior to guarantee agri-product safety in China, Food Control 59 (2016), 320–327.10.1016/j.foodcont.2015.05.035Search in Google Scholar
©2020 Walter de Gruyter GmbH, Berlin/Boston
This work is licensed under the Creative Commons Attribution 4.0 Public License.
Articles in the same Issue
- An Optimized K-Harmonic Means Algorithm Combined with Modified Particle Swarm Optimization and Cuckoo Search Algorithm
- Texture Feature Extraction Using Intuitionistic Fuzzy Local Binary Pattern
- Leaf Disease Segmentation From Agricultural Images via Hybridization of Active Contour Model and OFA
- Deadline Constrained Task Scheduling Method Using a Combination of Center-Based Genetic Algorithm and Group Search Optimization
- Efficient Classification of DDoS Attacks Using an Ensemble Feature Selection Algorithm
- Distributed Multi-agent Bidding-Based Approach for the Collaborative Mapping of Unknown Indoor Environments by a Homogeneous Mobile Robot Team
- An Efficient Technique for Three-Dimensional Image Visualization Through Two-Dimensional Images for Medical Data
- Combined Multi-Agent Method to Control Inter-Department Common Events Collision for University Courses Timetabling
- An Improved Particle Swarm Optimization Algorithm for Global Multidimensional Optimization
- A Kernel Probabilistic Model for Semi-supervised Co-clustering Ensemble
- Pythagorean Hesitant Fuzzy Information Aggregation and Their Application to Multi-Attribute Group Decision-Making Problems
- Using an Efficient Optimal Classifier for Soil Classification in Spatial Data Mining Over Big Data
- A Bayesian Multiresolution Approach for Noise Removal in Medical Magnetic Resonance Images
- Gbest-Guided Artificial Bee Colony Optimization Algorithm-Based Optimal Incorporation of Shunt Capacitors in Distribution Networks under Load Growth
- Graded Soft Expert Set as a Generalization of Hesitant Fuzzy Set
- Universal Liver Extraction Algorithm: An Improved Chan–Vese Model
- Software Effort Estimation Using Modified Fuzzy C Means Clustering and Hybrid ABC-MCS Optimization in Neural Network
- Handwritten Indic Script Recognition Based on the Dempster–Shafer Theory of Evidence
- An Integrated Intuitionistic Fuzzy AHP and TOPSIS Approach to Evaluation of Outsource Manufacturers
- Automatically Assess Day Similarity Using Visual Lifelogs
- A Novel Bio-Inspired Algorithm Based on Social Spiders for Improving Performance and Efficiency of Data Clustering
- Discriminative Training Using Noise Robust Integrated Features and Refined HMM Modeling
- Self-Adaptive Mussels Wandering Optimization Algorithm with Application for Artificial Neural Network Training
- A Framework for Image Alignment of TerraSAR-X Images Using Fractional Derivatives and View Synthesis Approach
- Intelligent Systems for Structural Damage Assessment
- Some Interval-Valued Pythagorean Fuzzy Einstein Weighted Averaging Aggregation Operators and Their Application to Group Decision Making
- Fuzzy Adaptive Genetic Algorithm for Improving the Solution of Industrial Optimization Problems
- Approach to Multiple Attribute Group Decision Making Based on Hesitant Fuzzy Linguistic Aggregation Operators
- Cubic Ordered Weighted Distance Operator and Application in Group Decision-Making
- Fault Signal Recognition in Power Distribution System using Deep Belief Network
- Selector: PSO as Model Selector for Dual-Stage Diabetes Network
- Oppositional Gravitational Search Algorithm and Artificial Neural Network-based Classification of Kidney Images
- Improving Image Search through MKFCM Clustering Strategy-Based Re-ranking Measure
- Sparse Decomposition Technique for Segmentation and Compression of Compound Images
- Automatic Genetic Fuzzy c-Means
- Harmony Search Algorithm for Patient Admission Scheduling Problem
- Speech Signal Compression Algorithm Based on the JPEG Technique
- i-Vector-Based Speaker Verification on Limited Data Using Fusion Techniques
- Prediction of User Future Request Utilizing the Combination of Both ANN and FCM in Web Page Recommendation
- Presentation of ACT/R-RBF Hybrid Architecture to Develop Decision Making in Continuous and Non-continuous Data
- An Overview of Segmentation Algorithms for the Analysis of Anomalies on Medical Images
- Blind Restoration Algorithm Using Residual Measures for Motion-Blurred Noisy Images
- Extreme Learning Machine for Credit Risk Analysis
- A Genetic Algorithm Approach for Group Recommender System Based on Partial Rankings
- Improvements in Spoken Query System to Access the Agricultural Commodity Prices and Weather Information in Kannada Language/Dialects
- A One-Pass Approach for Slope and Slant Estimation of Tri-Script Handwritten Words
- Secure Communication through MultiAgent System-Based Diabetes Diagnosing and Classification
- Development of a Two-Stage Segmentation-Based Word Searching Method for Handwritten Document Images
- Pythagorean Fuzzy Einstein Hybrid Averaging Aggregation Operator and its Application to Multiple-Attribute Group Decision Making
- Ensembles of Text and Time-Series Models for Automatic Generation of Financial Trading Signals from Social Media Content
- A Flame Detection Method Based on Novel Gradient Features
- Modeling and Optimization of a Liquid Flow Process using an Artificial Neural Network-Based Flower Pollination Algorithm
- Spectral Graph-based Features for Recognition of Handwritten Characters: A Case Study on Handwritten Devanagari Numerals
- A Grey Wolf Optimizer for Text Document Clustering
- Classification of Masses in Digital Mammograms Using the Genetic Ensemble Method
- A Hybrid Grey Wolf Optimiser Algorithm for Solving Time Series Classification Problems
- Gray Method for Multiple Attribute Decision Making with Incomplete Weight Information under the Pythagorean Fuzzy Setting
- Multi-Agent System Based on the Extreme Learning Machine and Fuzzy Control for Intelligent Energy Management in Microgrid
- Deep CNN Combined With Relevance Feedback for Trademark Image Retrieval
- Cognitively Motivated Query Abstraction Model Based on Associative Root-Pattern Networks
- Improved Adaptive Neuro-Fuzzy Inference System Using Gray Wolf Optimization: A Case Study in Predicting Biochar Yield
- Predict Forex Trend via Convolutional Neural Networks
- Optimizing Integrated Features for Hindi Automatic Speech Recognition System
- A Novel Weakest t-norm based Fuzzy Fault Tree Analysis Through Qualitative Data Processing and Its Application in System Reliability Evaluation
- FCNB: Fuzzy Correlative Naive Bayes Classifier with MapReduce Framework for Big Data Classification
- A Modified Jaya Algorithm for Mixed-Variable Optimization Problems
- An Improved Robust Fuzzy Algorithm for Unsupervised Learning
- Hybridizing the Cuckoo Search Algorithm with Different Mutation Operators for Numerical Optimization Problems
- An Efficient Lossless ROI Image Compression Using Wavelet-Based Modified Region Growing Algorithm
- Predicting Automatic Trigger Speed for Vehicle-Activated Signs
- Group Recommender Systems – An Evolutionary Approach Based on Multi-expert System for Consensus
- Enriching Documents by Linking Salient Entities and Lexical-Semantic Expansion
- A New Feature Selection Method for Sentiment Analysis in Short Text
- Optimizing Software Modularity with Minimum Possible Variations
- Optimizing the Self-Organizing Team Size Using a Genetic Algorithm in Agile Practices
- Aspect-Oriented Sentiment Analysis: A Topic Modeling-Powered Approach
- Feature Pair Index Graph for Clustering
- Tangramob: An Agent-Based Simulation Framework for Validating Urban Smart Mobility Solutions
- A New Algorithm Based on Magic Square and a Novel Chaotic System for Image Encryption
- Video Steganography Using Knight Tour Algorithm and LSB Method for Encrypted Data
- Clay-Based Brick Porosity Estimation Using Image Processing Techniques
- AGCS Technique to Improve the Performance of Neural Networks
- A Color Image Encryption Technique Based on Bit-Level Permutation and Alternate Logistic Maps
- A Hybrid of Deep CNN and Bidirectional LSTM for Automatic Speech Recognition
- Database Creation and Dialect-Wise Comparative Analysis of Prosodic Features for Punjabi Language
- Trapezoidal Linguistic Cubic Fuzzy TOPSIS Method and Application in a Group Decision Making Program
- Histopathological Image Segmentation Using Modified Kernel-Based Fuzzy C-Means and Edge Bridge and Fill Technique
- Proximal Support Vector Machine-Based Hybrid Approach for Edge Detection in Noisy Images
- Early Detection of Parkinson’s Disease by Using SPECT Imaging and Biomarkers
- Image Compression Based on Block SVD Power Method
- Noise Reduction Using Modified Wiener Filter in Digital Hearing Aid for Speech Signal Enhancement
- Secure Fingerprint Authentication Using Deep Learning and Minutiae Verification
- The Use of Natural Language Processing Approach for Converting Pseudo Code to C# Code
- Non-word Attributes’ Efficiency in Text Mining Authorship Prediction
- Design and Evaluation of Outlier Detection Based on Semantic Condensed Nearest Neighbor
- An Efficient Quality Inspection of Food Products Using Neural Network Classification
- Opposition Intensity-Based Cuckoo Search Algorithm for Data Privacy Preservation
- M-HMOGA: A New Multi-Objective Feature Selection Algorithm for Handwritten Numeral Classification
- Analogy-Based Approaches to Improve Software Project Effort Estimation Accuracy
- Linear Regression Supporting Vector Machine and Hybrid LOG Filter-Based Image Restoration
- Fractional Fuzzy Clustering and Particle Whale Optimization-Based MapReduce Framework for Big Data Clustering
- Implementation of Improved Ship-Iceberg Classifier Using Deep Learning
- Hybrid Approach for Face Recognition from a Single Sample per Person by Combining VLC and GOM
- Polarity Analysis of Customer Reviews Based on Part-of-Speech Subcategory
- A 4D Trajectory Prediction Model Based on the BP Neural Network
- A Blind Medical Image Watermarking for Secure E-Healthcare Application Using Crypto-Watermarking System
- Discriminating Healthy Wheat Grains from Grains Infected with Fusarium graminearum Using Texture Characteristics of Image-Processing Technique, Discriminant Analysis, and Support Vector Machine Methods
- License Plate Recognition in Urban Road Based on Vehicle Tracking and Result Integration
- Binary Genetic Swarm Optimization: A Combination of GA and PSO for Feature Selection
- Enhanced Twitter Sentiment Analysis Using Hybrid Approach and by Accounting Local Contextual Semantic
- Cloud Security: LKM and Optimal Fuzzy System for Intrusion Detection in Cloud Environment
- Power Average Operators of Trapezoidal Cubic Fuzzy Numbers and Application to Multi-attribute Group Decision Making