Analysis of surface deformation and driving forces in Lanzhou
-
Wenhui Wang
 ,
Lifeng Zhang
,
Lifeng Zhang

Abstract
Surface deformation has become an important factor affecting urban development. Lanzhou is an important location in the Belt and Road Initiative, an international development policy implemented by the Chinese government. Because of rapid urbanization in Lanzhou, surface deformation occurs easily. However, the spatial-temporal characteristics of surface deformation and the interaction of driving forces behind surface deformation in Lanzhou are unclear. This paper uses small baseline subset InSAR (SBAS-InSAR) technology to obtain the spatial-temporal characteristics of surface deformation in Lanzhou based on 32 Sentinel-1A data from March 2015 to January 2017. We further employ a geographical detector (geo-detector) to analyze the driving forces (single-factor effects and multifactor interactions) of surface deformation. The results show that the central urban area of Lanzhou was stable, while there was surface deformation around Nanhuan road, Dongfanghong Square, Jiuzhou, Country Garden, Dachaiping, Yujiaping, Lanzhou North Freight Yard, and Liuquan Town. The maximum deformation rate was −26.50 mm year−1, and the maximum rate of increase was 9.80 mm year−1. The influence factors of surface deformation in Lanzhou was a complex superposition relationship among various influencing factors, not a result of the single factor. The interaction between the built-up area and land cover types was the most important factor behind surface deformation in Lanzhou. This paper provides the reference data and scientific foundation for disaster prevention in Lanzhou.
1 Introduction
Surface deformation is a geological phenomenon caused by various factors. Urban surface deformation can damage road surfaces, roadbeds, and even buildings and urban infrastructures, causing casualties and economic losses [1,2]. Especially surface deformation has a great impact on the road surface, such as accidents, slower movement speeds, capacity loss, and severe discomfort states [3,4]. In recent years, urban surface deformation has become one of the dangerous geological occurrences, affecting sustainable development in many countries around the world. The scale of urban development in Lanzhou has expanded rapidly, nearly doubling from 1961 to 2015. Surface deformation in the main urban area of Lanzhou has become more serious in recent years [5], as shown in Figure 1, and it is necessary to use special methods to monitor surface deformation in this city.
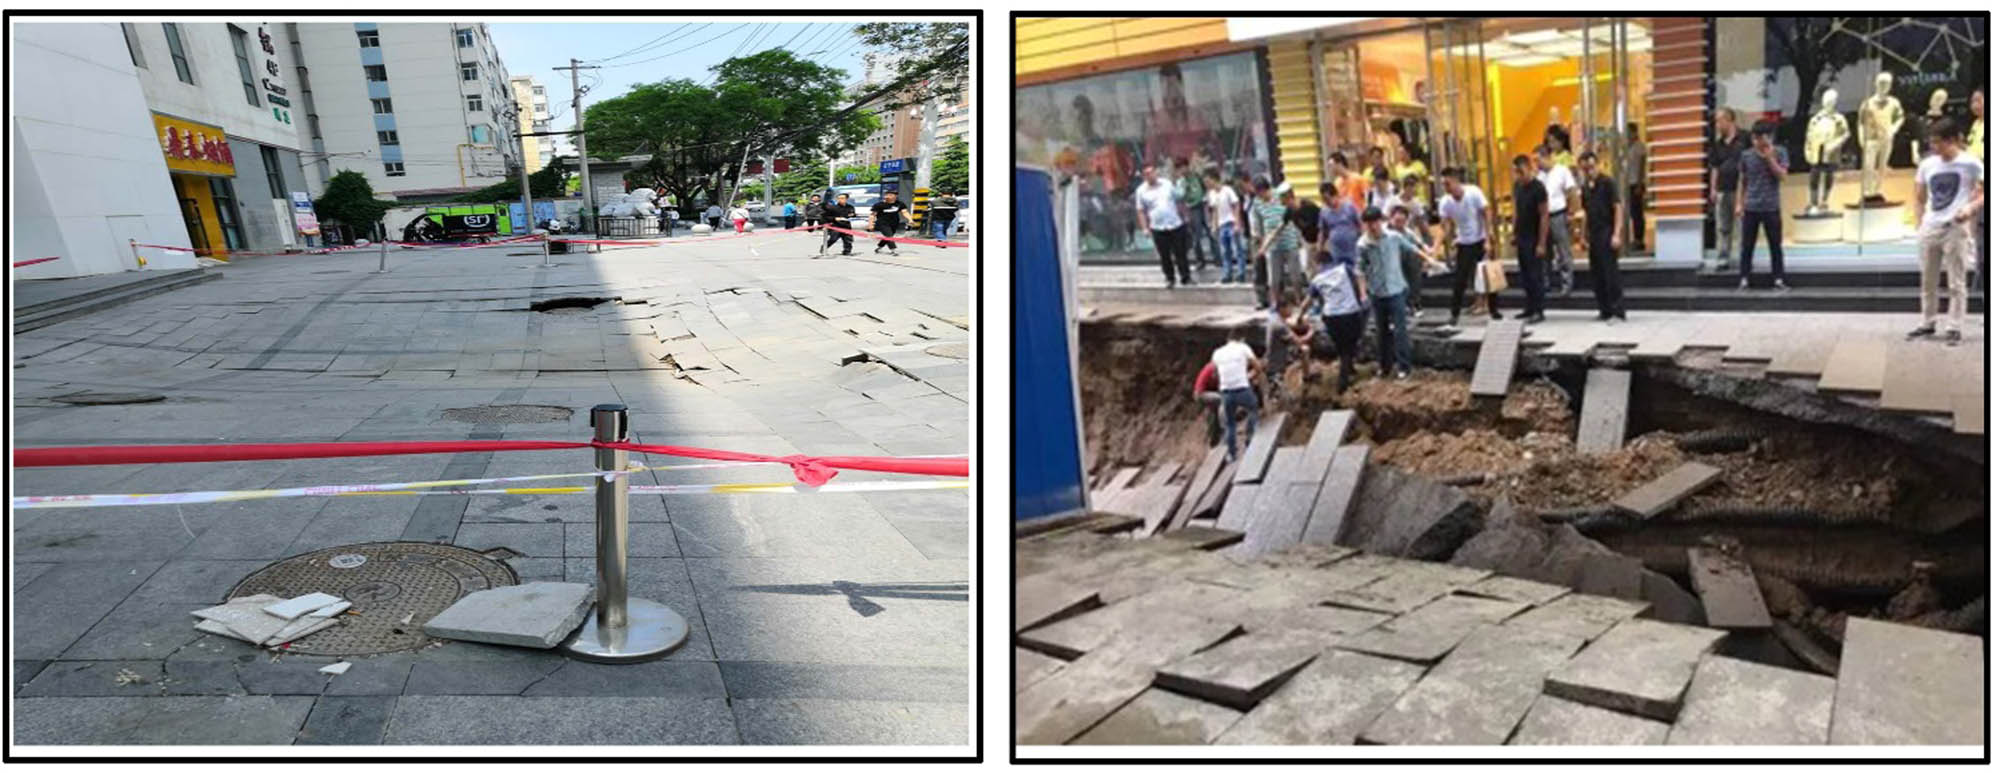
Accidents caused by deformation in Lanzhou.
At present, the traditional methods to monitor surface deformation include leveling and the global positioning system (GPS) [6,7], but these methods generally have shortcomings such as low-time frequency, long time, high input, and slow data update. With the development of earth observation technologies, interferometric synthetic aperture radar (InSAR) has become an excellent method for observing surface deformation. Compared with traditional methods, InSAR technology has the characteristics of wide coverage, including short-range weather impact and all-weather observation, which can solve the abovementioned shortcomings. InSAR has been widely used in surface deformation monitoring [8,9], road network deformation monitoring [10–13], building monitoring [14,15], subway deformation monitoring [16], railway subsidence [17], snow thickness inversion [18], landslide monitoring [19,20], and other fields. Berardino [21] and Lanari [22] proposed the small baseline subset (SBAS) InSAR that solved the discontinuous time problem has a high density of information for time and space which captures the deformation rate throughout the whole observation period [23]. SBAS-InSAR is thus suitable for deformation monitoring in the city area.
A geographical detector (geo-detector) is a tool for detecting and exploiting spatial differentiation [24]. It can detect both numerical and qualitative data, as well as to detect different driving force interactions. Therefore, geo-detector can be applied to study the relative influence of different driving forces. As such, it is widely used in the fields of land use [25], public health [26], environment [27], and geology [28]. Groundwater [2,29], geological structure [30], land cover types [8,31–33] precipitation [34], temperature [35–37], density of road network [10], and built-up area [38–40] are the main causes of surface deformation. No previous studies have reported the use of geo-detector to quantify the relationship between surface deformation and natural and human factors. Therefore, this paper proposes the use of geo-detector to study the relative influence of different driving forces (precipitation, temperature, built-up area, density of road network, and land cover types) behind the spatial distribution of surface deformation and quantitatively explore the influence of different combinations of driving forces on surface deformation.
The research on surface deformation has achieved some important results in Lanzhou. For example, Wang [41] used ENVISAT ASAR data to analyze surface deformation in the Lanzhou from 2003 to 2010, the results showed that the most significant areas of surface deformation in Lanzhou were in the regions where landslides and mudslides frequently occurred. Xue [42] used persistent scatter interferometric synthetic aperture radar (PS-InSAR) technology to study the causes and mechanisms of slope formation in Lanzhou from 2003 to 2010 and to access the stability of loess slopes by using the analytical hierarchy process (AHP). However, these researches mainly focused on qualitative analysis, and the spatial-temporal characteristics of surface deformation and the interaction of driving forces behind surface deformation in Lanzhou are unclear. Besides that, the latest surface deformation monitoring results are not reported.
This paper uses the combination of SBAS-InSAR and geo-detector to make up for the deficiencies of existing research. The goal of this paper is to obtain the spatial-temporal characteristics of surface deformation and to explore the driving factors that caused surface deformation in the main urban area of Lanzhou, Gansu Province, China. This paper uses SBAS-InSAR technology to monitor time-series deformation, deformation rate, and cumulative deformation. The geo-detector is used to analyze the relationship between the deformation and temperature, precipitation, the density of road network, land cover types, and built-up area, by exploring single driving factor and multidriving factor interactions. In doing so, it will provide reference data and a scientific basis for disaster prevention and ecologically sustainable development in Lanzhou city.
2 Study area and datasets
Lanzhou is located in the plain along the Yellow River basin, covering the geographic area between 36°1′32″–36°9′41″N and 103°30′3″–104°4′23″E. It is a region with serious soil erosion, and the city has a high population density and dense road network. The main urban area of Lanzhou mainly includes Chengguan district, Qilihe district, Xigu district, and Anning district. The study area includes land-creation areas, railways, subways, highways, railway stations, and industrial parks.
The terrain of the study area is high in the southwest, low in the northeast, and the mountains in the north and south are on either side of the river. The main city is located in a valley between the two mountains. The weather in Lanzhou is a temperate continental climate. The annual average temperature is 10.30°C, and the four seasons are distinct. The average annual precipitation is 327.00 mm with more concentrated rainfall from June to September [43]. The study area is shown in Figure 2.
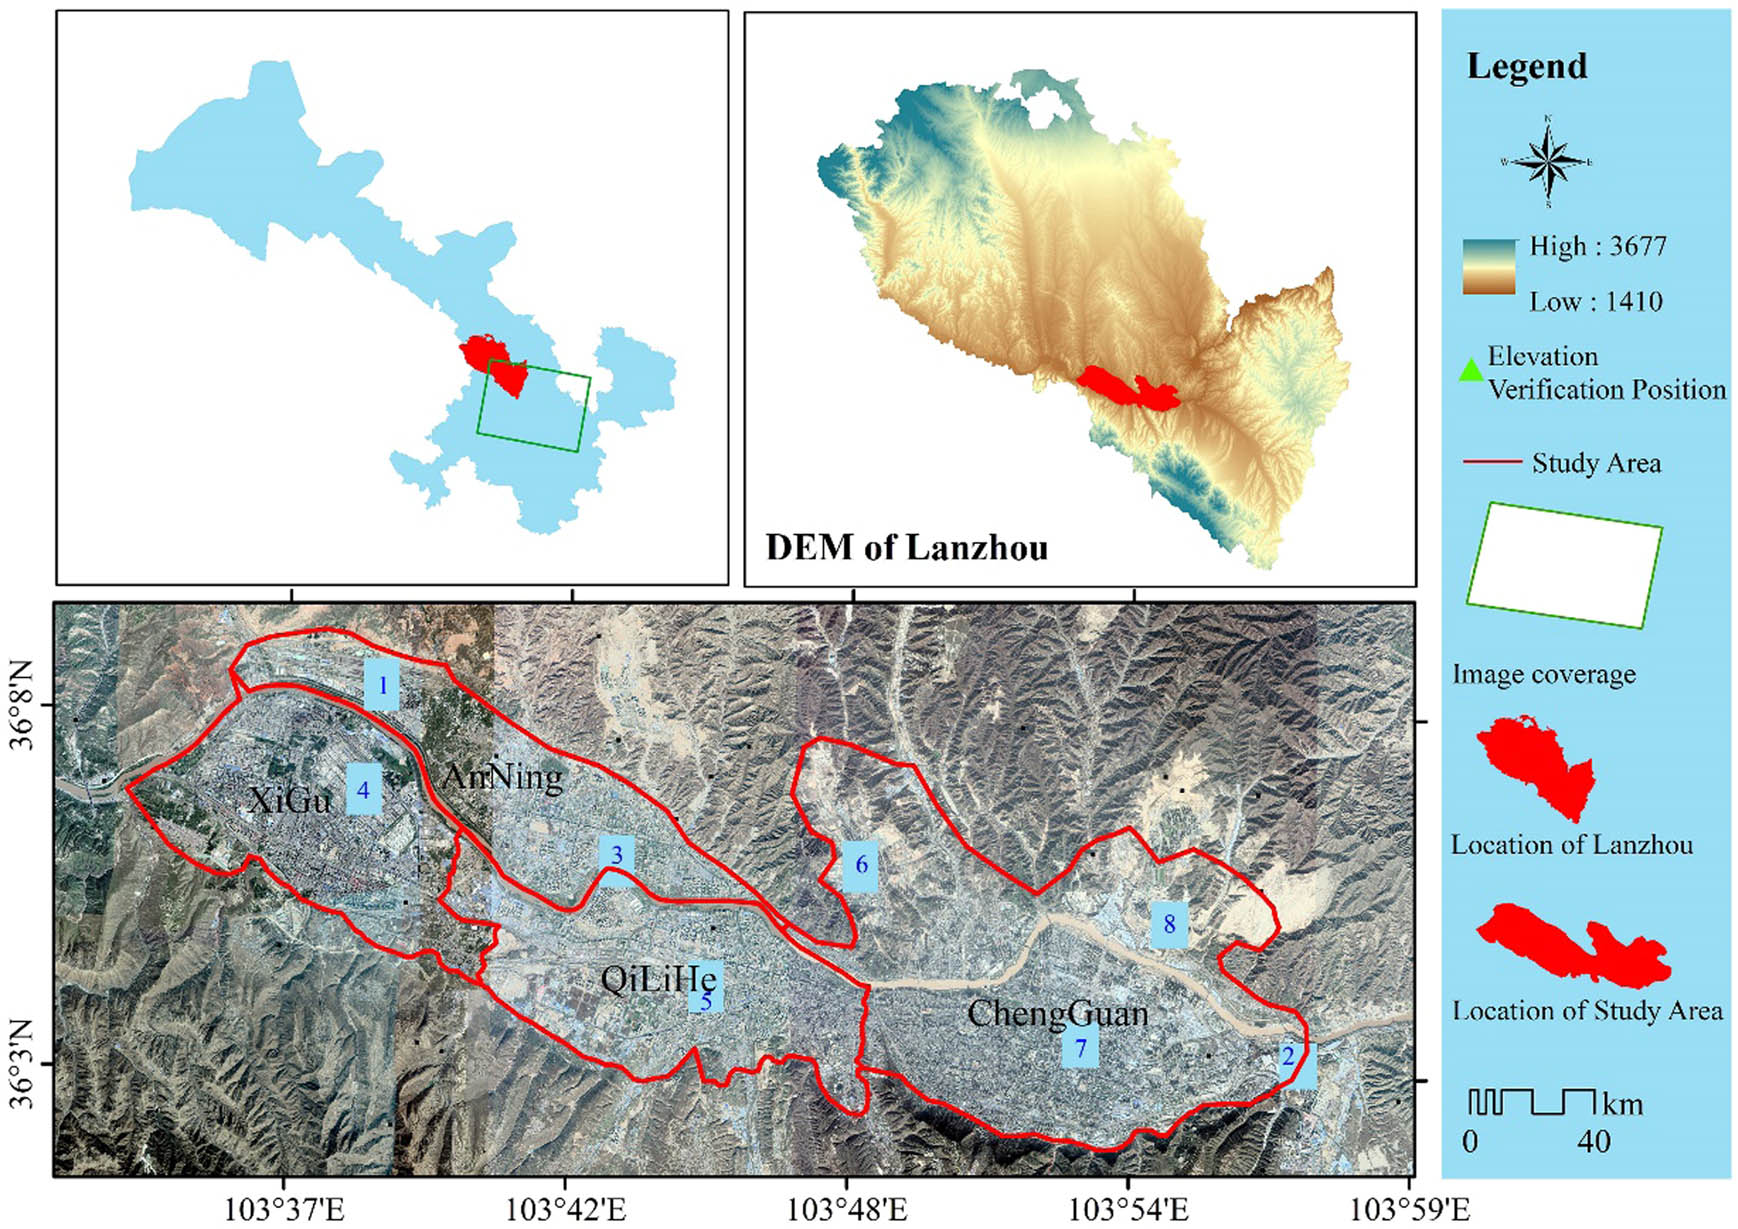
The Lanzhou area.
This paper uses Sentinel-1A data to monitor surface deformation. The Sentinel-1A satellite is an Earth observation satellite in the European Space Agency’s Copernicus Plan, which carries a C-band synthetic aperture radar that provides continuous images. Sentinel-1A was successfully launched in 2014 and began acquiring images with a revisit period of 12 days and a short time span. In this paper, 32 Sentinel-1A images covering the research area from 2015 to 2017 were selected for the experiment. The images were captured through VV polarization and IW imaging mode. This paper used the 30 m SRTM DEM [44,45] provided by the United States Geological Survey (USGS) to remove terrain phases, and it used the elevation data provided by the local Surveying and Mapping Department to verify the experimental results. Elevation data were obtained by aerial surveys with an accuracy of 1:500. Meteorological data [46] (temperature [47] and precipitation [48]) were provided by the Center for Climatic Research, Department of Geography, University of Delaware, Newark. Data of land cover types data were derived from Tsinghua University’s global 10 m resolution land cover types map [49]. Built-up area changes were extracted from Landsat 8 OIL images. Road data were provided by the Department of Resources of Lanzhou. Meteorological data, land cover types data, built-up area, and road data were then combined with the deformation results to analyze deformation mode-features, including evolutionary process and other causes of deformation in Lanzhou. The datasets used in the paper are listed in Table 1.
Data and resources
| Data name | Data resource |
|---|---|
| Sentinel-1A | https://search.asf.alaska.edu/ |
| SRTM DEM | https://earthexplorer.usgs.gov/ |
| Temperature | http://climate.geog.udel.edu/∼climate/html_pages/download.html |
| Precipitation | http://climate.geog.udel.edu/∼climate/html_pages/download.html |
| Landsat 8 OLI | https://earthexplorer.usgs.gov/ |
| Land cover types | http://data.ess.tsinghua.edu.cn/ |
| Roads | Department of Resources of Lanzhou |
| Aerial survey elevation | Department of Resources of Lanzhou |
3 Methods
This paper uses SBAS-InSAR technology to monitor time-series deformation, deformation rate, and cumulative deformation. The geo-detector is used to analyze the relationship among the surface deformation and the density of road networks, built-up area, land cover types, precipitation, and temperature by exploring single driving factor and multidriving factor interactions. The flow chart is shown in Figure 3.
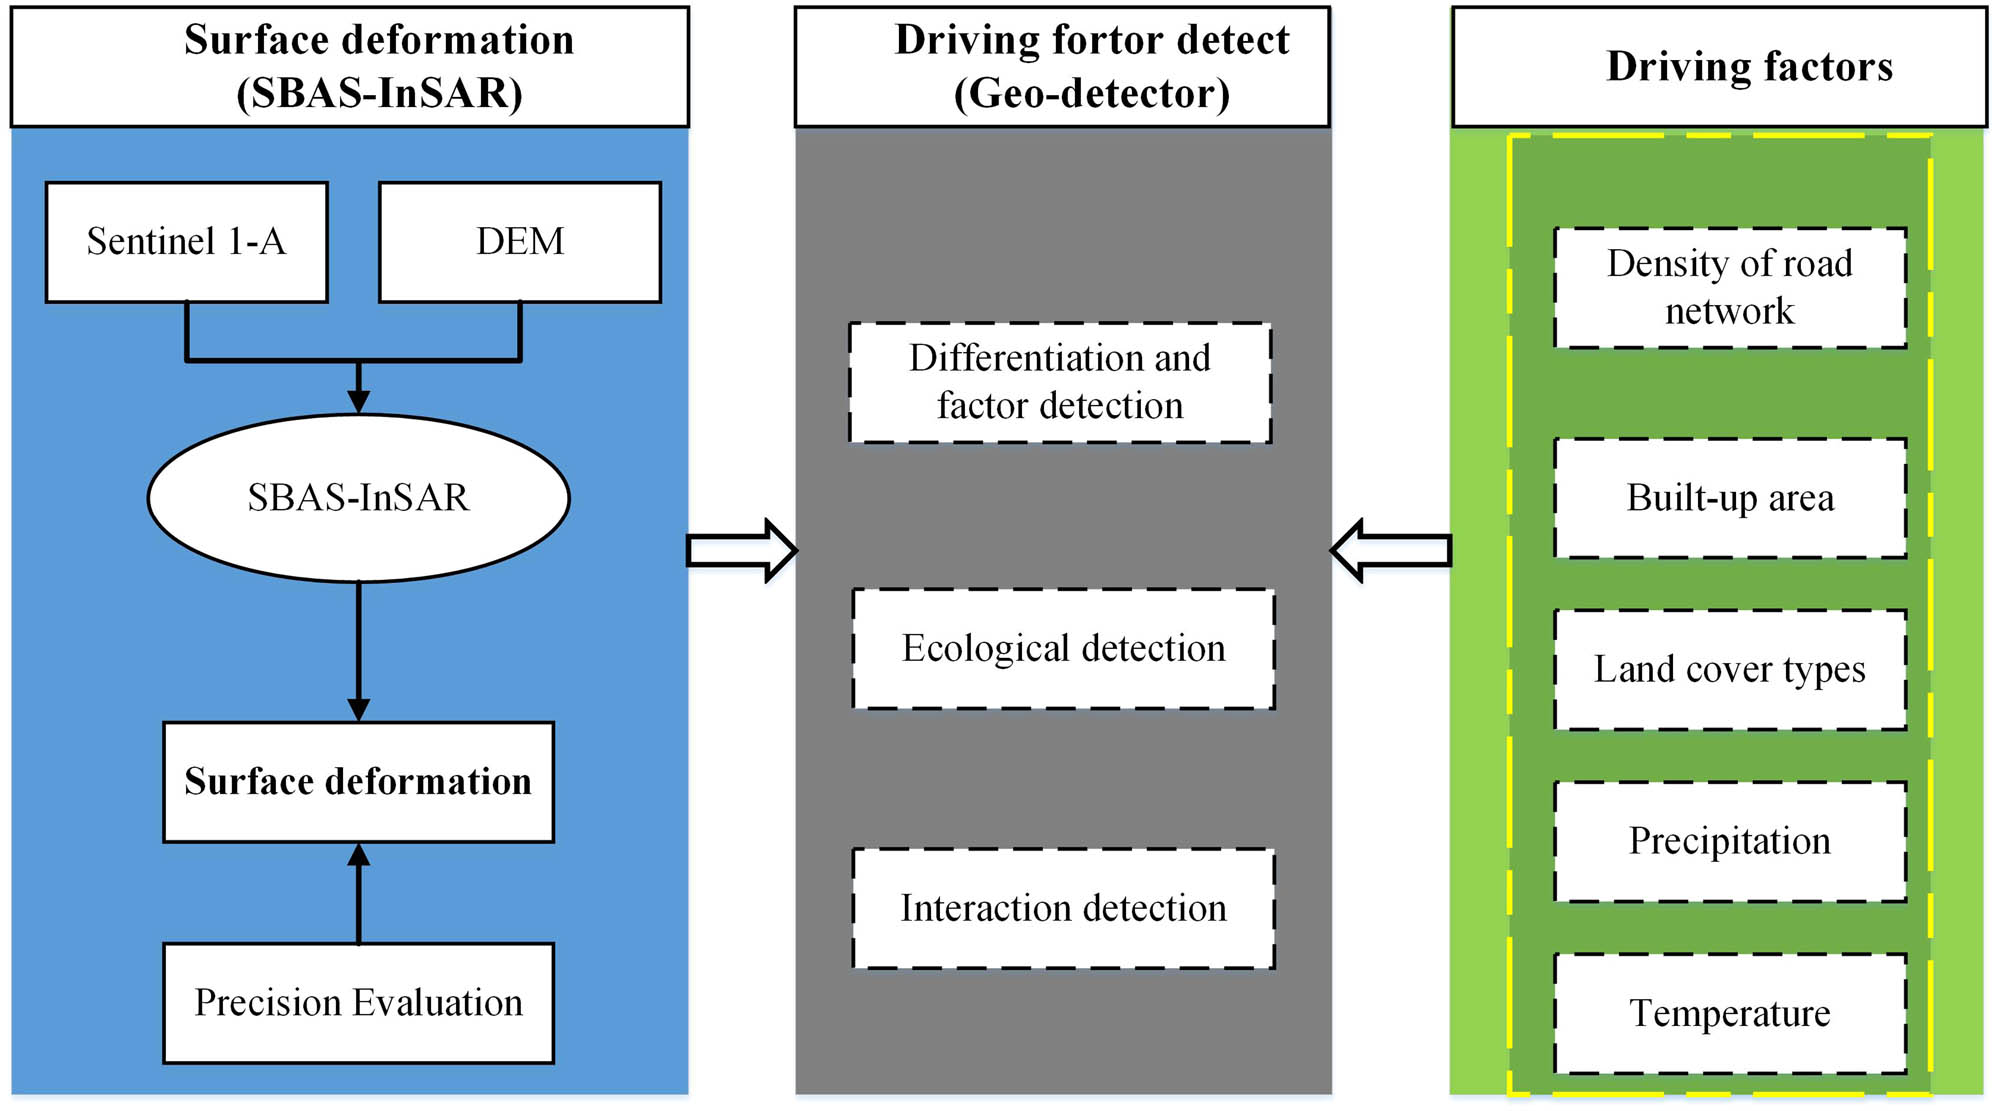
The flowchart of this study.
3.1 Basic theories of SBAS-InSAR
SBAS-InSAR was proposed by Berardino et al. [21] and Lanari et al. [22]. SBAS-InSAR is a time-series analysis method that combines data to obtain short space baseline differential interferogram datasets. These differential interferograms can overcome spatial decorrelation phenomena. Using singular value decomposition (SVD) to solve the deformation rate, isolated SAR data sets separated by large spatial baselines can be connected to improve the time sampling rate of the observed data. The high-density temporal and spatial information of SBAS-InSAR can effectively eliminate the atmospheric effect phase, making the measurement results more accurate [23].
The basic principle is as follows:
M-scene SAR images of the same region are obtained in the time period from t1 to tM, one of which is selected as the common main image, and then n-scene interferogram is generated according to the interference combination principle, which satisfies the following relationship:
The ith-scene (i = 1, 2,…,N) interferogram generated from the main image called A and the minor image named B, and the interference phase generated at point (x, r) can be expressed as follows:
where
Assuming that the deformation rate between different interferometric graphs is
Three-dimensional phase unwinding of the interferograms of N-scene SAR images can be used to calculate the deformation rates of different SAR image acquisition times.
This paper used 32 Sentinel-1A SLC images covering the study area from March 2015 to January 2017. The experimental platform of this article is ENVI5.3. There are six steps of SBAS-InSAR in ENVI. The first step is the connection graph generation. This step defines the combination of pairs (interferograms) that will be processed by the SBAS. Given N acquisitions, the maximum theoretical available connections are (N*(N − 1))/2. The super master will be automatically chosen among the input acquisitions. Image 2016/02/13 was automatically selected as the super master image, with a maximum time baseline of 200 days, the range looks of 4, azimuth looks of 1. The super master is the reference image of the whole process, and all the processed slant range pairs will be co-registered on this reference geometry. The second step is interferometry, which is to generate a stack of unwrapped interferograms. All of the interferograms are finally co-registered on the super master geometry and ready for the refinement and re-flattening tool and the SBAS inversion kernels. To increase the SNR of the interferograms and provide a more reliable coherence estimation, the multilooking is 4:1. The unwrapping method for the SBAS is the Delaunay MCF, this method works well for the connection of groups of high coherence pixels to other isolated high coherence groups. The third step is refinement and re-flattening. This step is executed to estimate and remove the remaining phase constant and phase ramps from the unwrapped phase stack. The fourth step is an inversion to the first step. This step implements the SBAS inversion kernel that retrieves the first estimate of the displacement rate and the residual topography. Moreover, a second unwrapping is done within this stage on the input interferograms to refine and improve the input stack because of the next step. We chose the most robust inversion model: linear model. Coherence thresholds is an important criterion for evaluating the quality of interference [23,50,51]. The coherence threshold in this step is 0.75. This step will get the estimated deformation rate. The fifth step is inversion second step. After the retrieval of the displacement time-series first estimation, a custom atmospheric filtering is performed on these preliminary results to recover the final and cleaned displacement time series. The purpose of the atmospheric filter is to smooth the displacement temporal signature respecting some physical properties of the atmosphere. This filter is implemented with a low-pass spatial filter, combined with a high-temporal pass filter. The sixth step is geocoding, geocoding converts results to the geographic coordinate system. We convert LOS (dLOS) into vertical displacement (dv) for every time-series using the Sentinel-1A incidence angle (θ = 39.58°): dv = dLOS/cos θ.
3.2 Basic theories of geo-detector
The geographic detector model (geo-detector) is a statistical method proposed by Wang [24,52], which can detect spatial variability and reveal driving forces. The core idea of this method is: if a factor has an important influence on the appearance of a phenomenon in space, then the factor should have a similar spatial distribution as the phenomenon. This method can not only detect the influence of a single factor but also judge the strength, direction, and linearity of the interaction across multiple factors. The geo-detector includes four detectors: differentiation and factor detection, interaction detection, risk area detection, and ecological detection.
Differentiation and factor detection can detect to what extent a factor X explains the spatial differentiation of attribute Y through the following expression:
where h = 1, L is the strata of variable Y or factor X (that is classification or partitioning); Nh and N are the number of units in layer h and the whole region, respectively. The variables
Interaction detection (that is, to identify the interaction between different risk factors Xs) combines evaluation factors X1 and X2. It is increased or reduced when the explanatory power of the dependent variable Y. The evaluation method first calculates the q value of Y, caused by two kinds of factors X1 and X2, respectively: q(X1) and q(X2). It then calculates their interaction q-value: q(X1 ∩ X2) and compares q(X1), q(X2), and q(X1 ∩ X2).
The relationship between the two factors can be divided into the following categories (Table 2):
The relationship between the two factors
| Verdict | Interaction |
|---|---|
| q(X1 ∩ X2) < Min(q(X1), q(X2)) | Nonlinear attenuation |
| Min(q(X1), q(X2)) < q(X1 ∩ X2) < Max(q(X1)), q(X2)) | One-factor nonlinear reduction |
| q(X1 ∩ X2) > Max(q(X1), q(X2)) | Double factor enhancement |
| Q(X1 ∩ X2) = q(X1) + q(X2) | Independence |
| q(X1 ∩ X2) > q(X1) + q(X2) | Nonlinear enhancement |
Risk zone detection uses the t-statistic to determine whether there is a significant difference in the mean value of attributes between the two subregions.
where
Null hypothesis
Ecological detection is used to compare whether there is a significant difference in the influence factor X1 and X2 on the spatial distribution of attribute Y, which is measured by the statistic F.
where
The uses of geographical detectors are as follows:
Data collection and arrangement: these data include dependent variable Y and independent variable data X. The independent variable is type quantity, the independent variable is discretized by the Jenks Natural Breaks (Jenks).
The sample (Y, X) was read into the geographic detector software, and then the software was run. The results mainly consisted of four parts: differentiation and factor detection, interaction detection, risk area detection, and ecological detection. Differentiation and factor detection, interaction detection, and ecological detection were analyzed in this paper.
3.3 Data processing
Aerial survey elevation was used to verify the accuracy of SBAS-InSAR. To simplify data processing, this paper used the same shapefile to cut elevation data from the aerial survey and SBAS-InSAR, to calculate the average of aerial survey elevation and SBAS-InSAR elevation data, and to compute the root-mean-square error (RMSE). The Department of Resources of Lanzhou offered eight aerial survey elevation sites, as shown in Figure 2.
In this paper, to simplify the work of analysis, the study area is divided into 34 grids by finishnet in ArcGIS 10.6, as seen in Figure 4a. The density of the road network and the built-up area was calculated for each net and analyzed in the next section; 30 random points in each grid were generated according to the divided study area. Using the generated random points to extract the attributes of deformation rate, temperature, precipitation, road network density, land cover types, and built-up area, but some random points can’t extract attributes for no attribute, there are 788 random points remaining after removing invalid points (Figure 4a). The extracted attributes were used to detect the spatial differentiation of surface deformation in the main urban area of Lanzhou. The Independent variable is a numerical quantity, they need to be discretized. We used the Jenks Natural Breaks (Jenks) method to reclassify road network density, built-up area, land cover types, precipitation, and temperature. Road network density and built-up area were reclassified into 20 categories due to their large differences in values. The land cover types of data were processed in seven categories. The precipitation and temperature were reclassified into six and eight categories, respectively. The X data referred to density of road network, built-up area, land cover types, precipitation, and temperature. The Y data referred to the deformation rate. X and Y data were imported into the geo-detector for calculation.
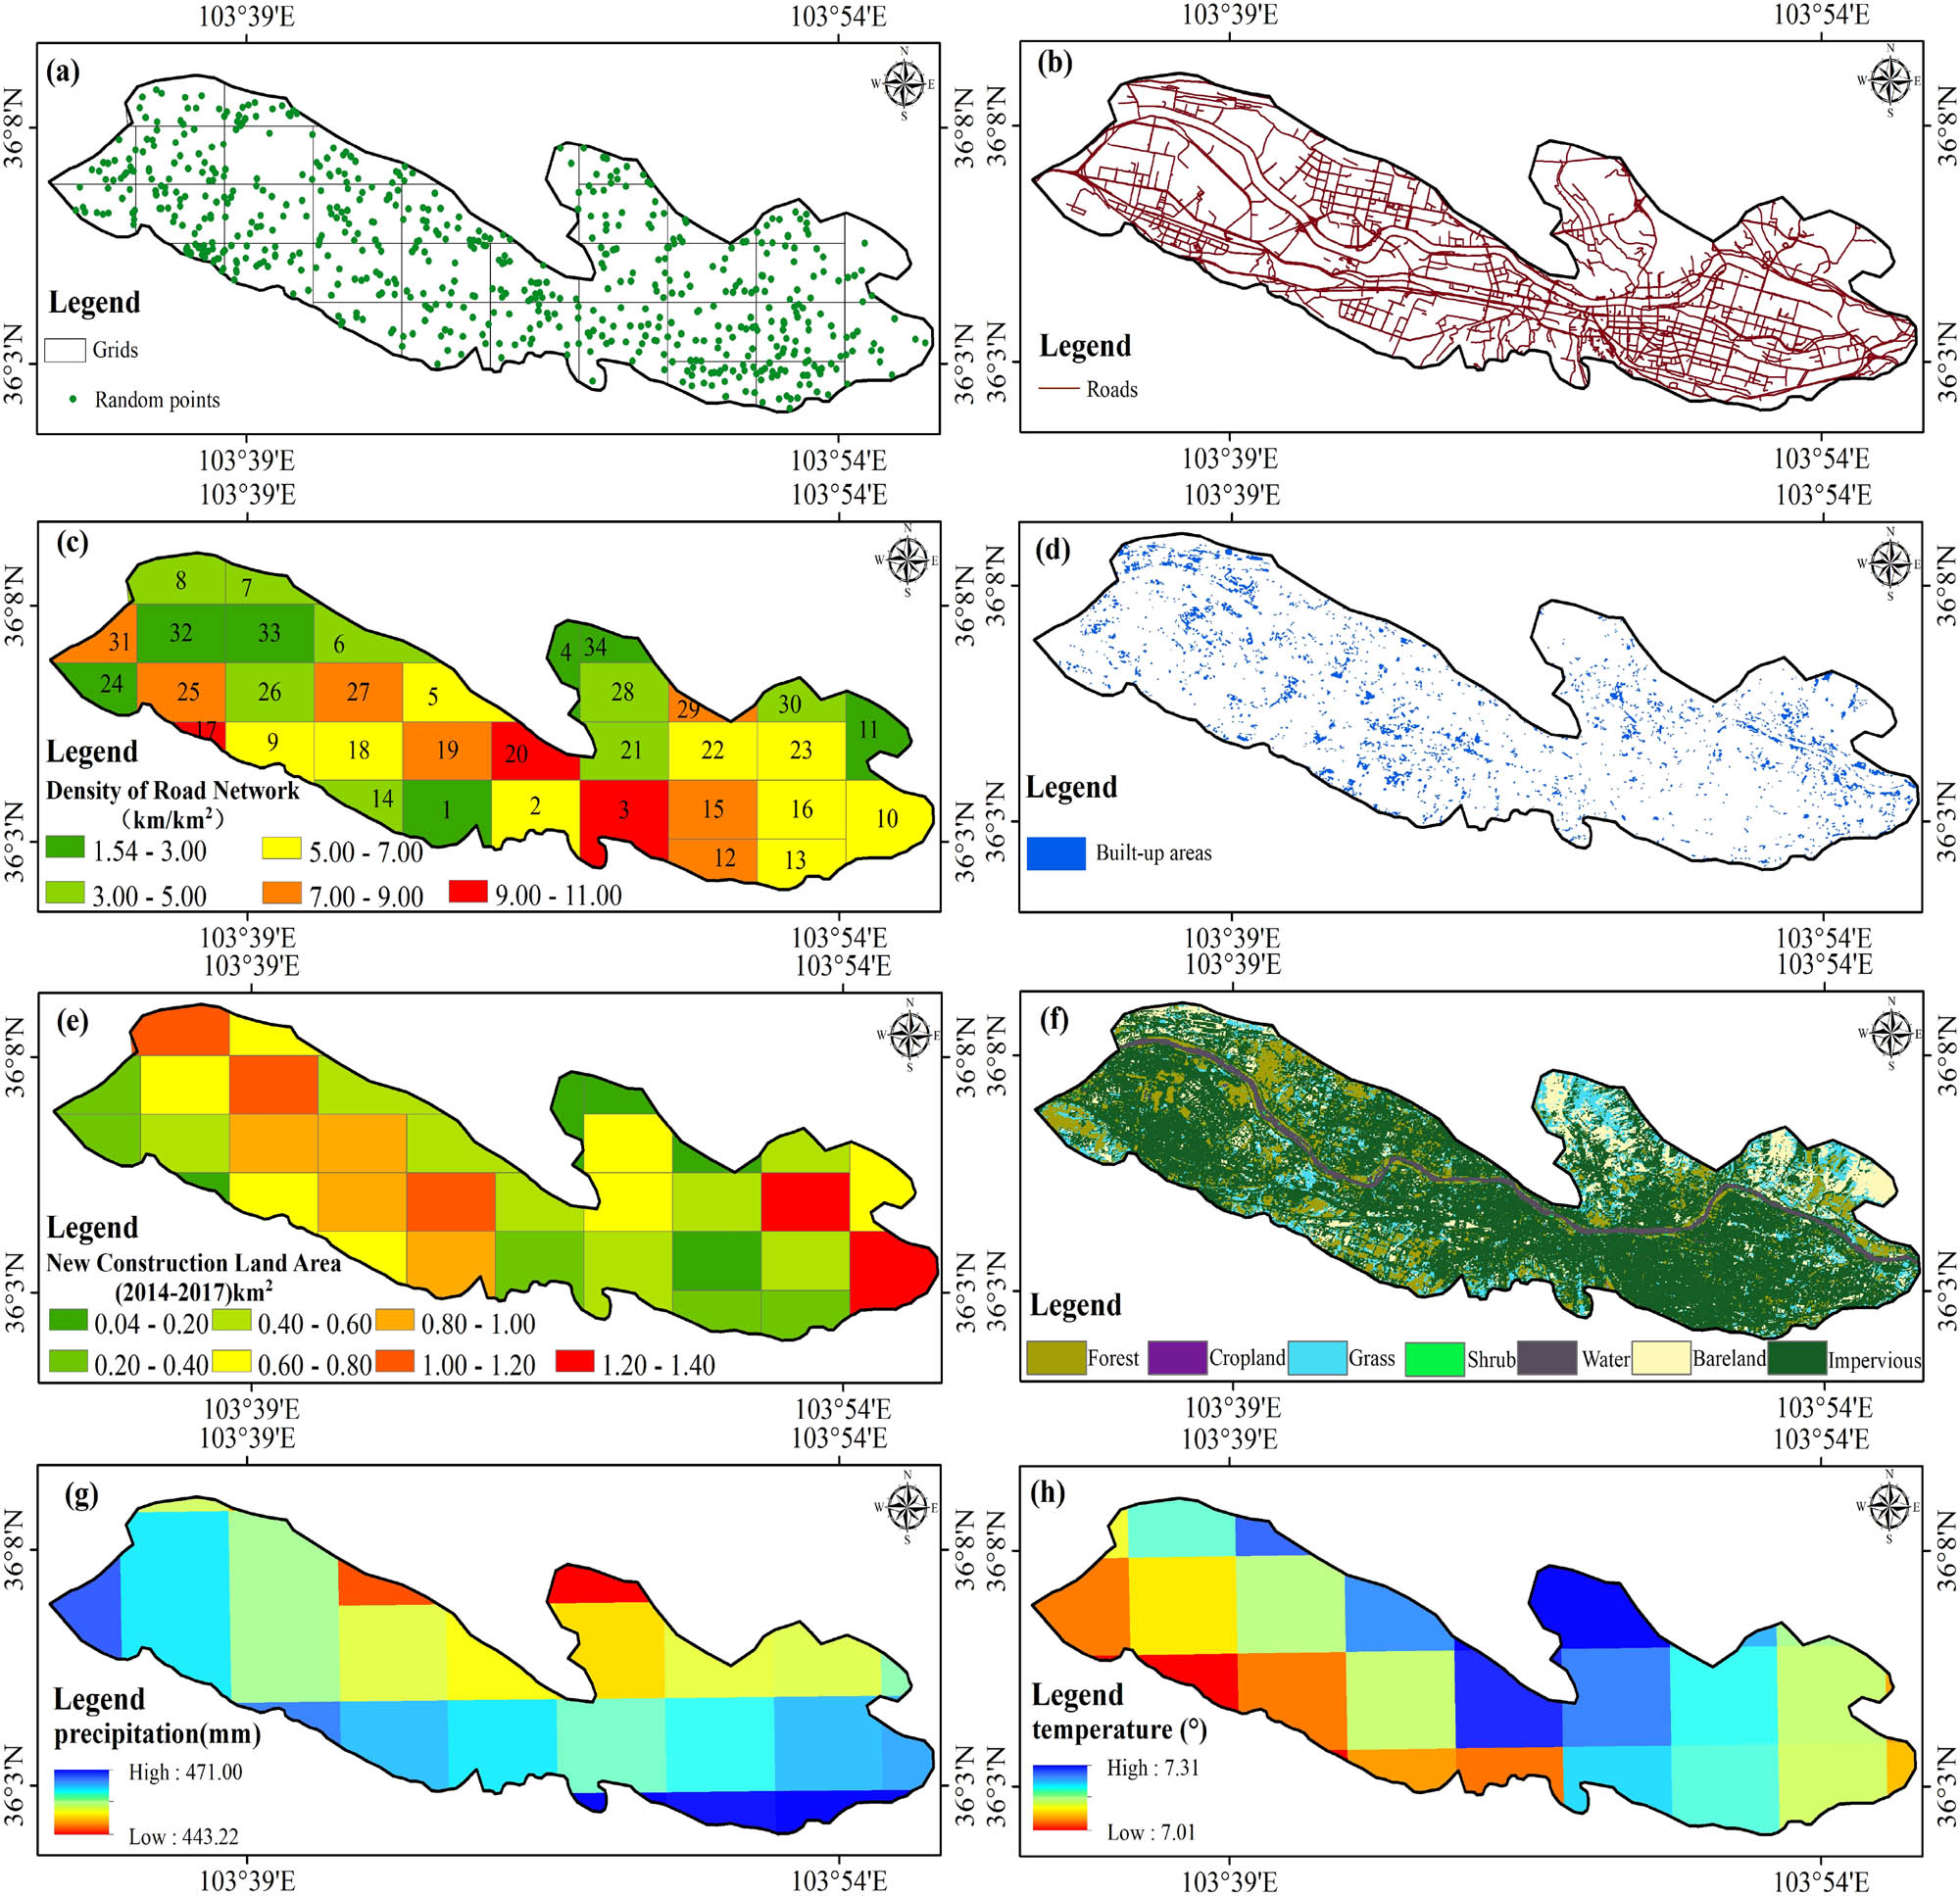
Results of data processing: (a) grids and random points, (b) road network, (c) density of road network, (d) built-up area, (e) built-up area in grids, (f) land cover types, (g) precipitation, (h) temperature.
Road maps were obtained from the Department of Resources of Lanzhou, mainly including urban highways, highways, state roads, pedestrian paths, nine grade roads, provincial roads, railways, county roads, and township roads, to a total of 510.978 km. The roads were merged into a new layer (Figure 4b). The density of the road network was calculated by road length. The density of the road network was calculated by the grid and the road length, the road length in each grid was calculated, and then the road length was divided by the grid area, finally, the road network density was obtained (Figure 4c).
Data for the built-up area (Figure 4d) were extracted from Landsat 8 OLI. First, experiments to monitor change in the built-up area Lanzhou from 2015 to 2017 were completed using Landsat 8 OLI images during the same period. After pre-processing the images, they were classified through the Random Forest method, and the ground objects were divided into a built-up area, roads, green spaces, water bodies, and others. Second, the classification results were input in the change monitoring process, monitoring results of the changes in the main urban area of Lanzhou from 2015 to 2017 were obtained, where the converted into the built-up area were extracted as the built-up area in this paper. To facilitate the calculation, the area of the construction area in the grid was calculated as the area of the construction area of each grid (Figure 4e).
This paper used the 2017 global 10 m resolution land cover types map (Figure 4f) released by Tsinghua University and the deformation rate map to analyze the relationship between land cover types and surface deformation in the main urban area of Lanzhou. We used the study area vector to cut the cover types map into seven types: cropland, forest, grass, shrub, water, impervious, and bare land. Cropland and shrub accounted for a relatively small scale, so cropland, forest, grass, and shrub were merged into vegetation for the convenience of research. Bodies of water in SBAS-InSAR lose coherence in the deformation rate graph, so no research was conducted on them in this paper. Therefore, the relevant land cover types in this study were as follows: vegetation, impervious, and bare land. The deformation rate of the three land types was obtained by using the three types of land to cut the deformation rate map separately.
Precipitation (Figure 4g) and temperature (Figure 4h) were applied to verify the impact of meteorological factors on the surface deformation of the main urban area of Lanzhou. Precipitation and temperature grid data were obtained from the Center for Climatic Research, Department of Geography, University of Delaware, Newark. The spatial resolution of the grid data is 0.25 degrees. The precipitation and temperature raster maps of the study area were obtained by the interpolation of grid data through inverse distance weighting (IDW). Then, the average monthly precipitation and temperature of the study area were compared with surface deformation to calculate a correlation.
4 Results and analysis
4.1 Precision evaluation
Since level data could not be obtained, the paper used local surveying and mapping department elevation and field data to verify the SBAS-InSAR results. The mapping accuracy of local surveying and mapping department elevation is 1:1,00,000. There were two ways to evaluate the accuracy of the result: horizontal accuracy and elevation accuracy, which were evaluated separately. In practical applications, only the elevation accuracy needs to be evaluated. The RMSE calculation is simple and easy to understand, and it can describe the dispersion degree of terrain parameters and true values from the whole [53]. Therefore, the RMSE measures of the two groups of elevation were compared and analyzed in this paper. As Figure 5 demonstrates, the results showed that the difference between the two groups of data was very small (between −2 and 2), and the RMSE was 1.17, indicating that the results of this study have high reliability.
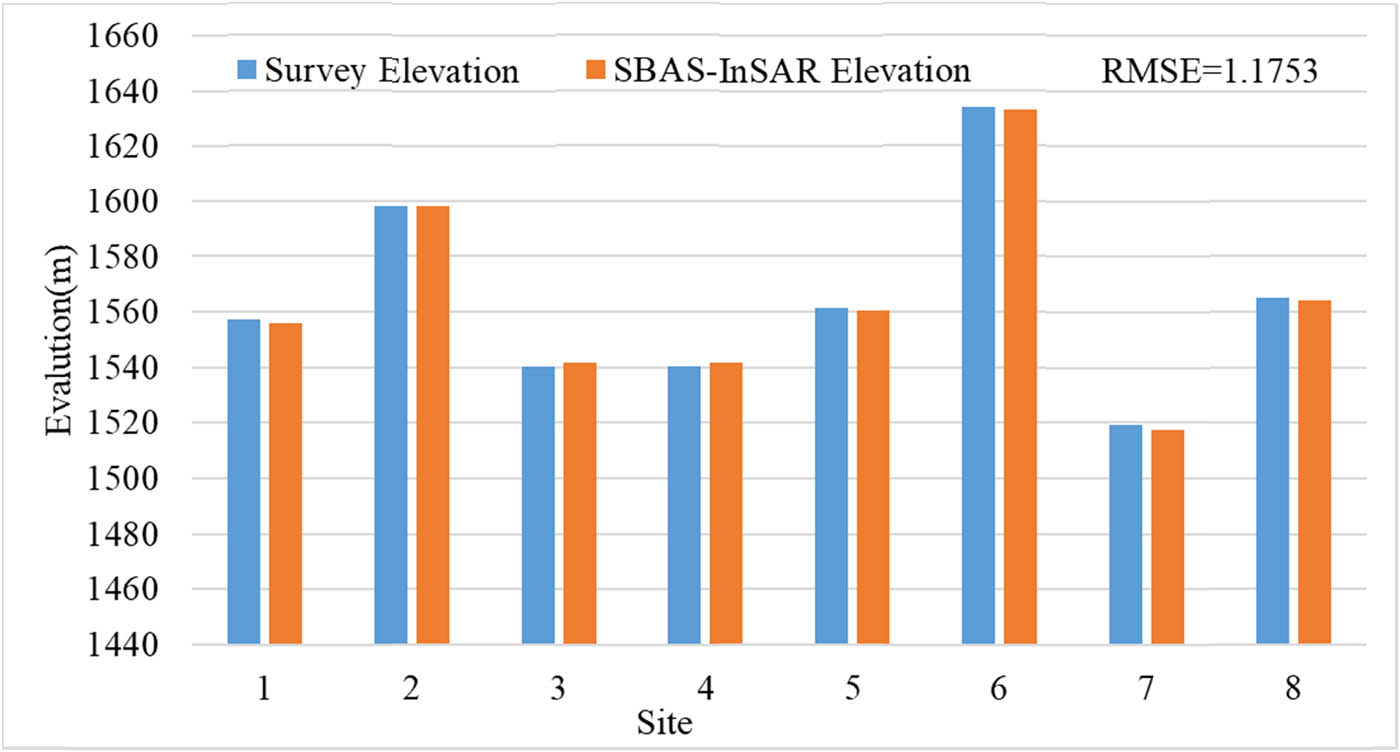
The elevation evaluation.
The research team went to the field to investigate the deformation of Lanzhou (Figure 6). According to the results, Country Garden and Jiuzhou are more severely deformed, and the Lanzhou west station, which is a high-speed railway station in Lanzhou, was not as serious. The researchers found the deformation of these locations to be consistent with the InSAR results, and the deformation of Country Garden and Jiuzhou was identifiable to the human eyes. The types of deformation mainly were cracks, subsidence, and collapses. In particular, the road cracks are very common, with a width of about 5–10 cm and a length of several meters. Wall crack width is several centimeters, land subsidence tens of centimeters (Figure 6).
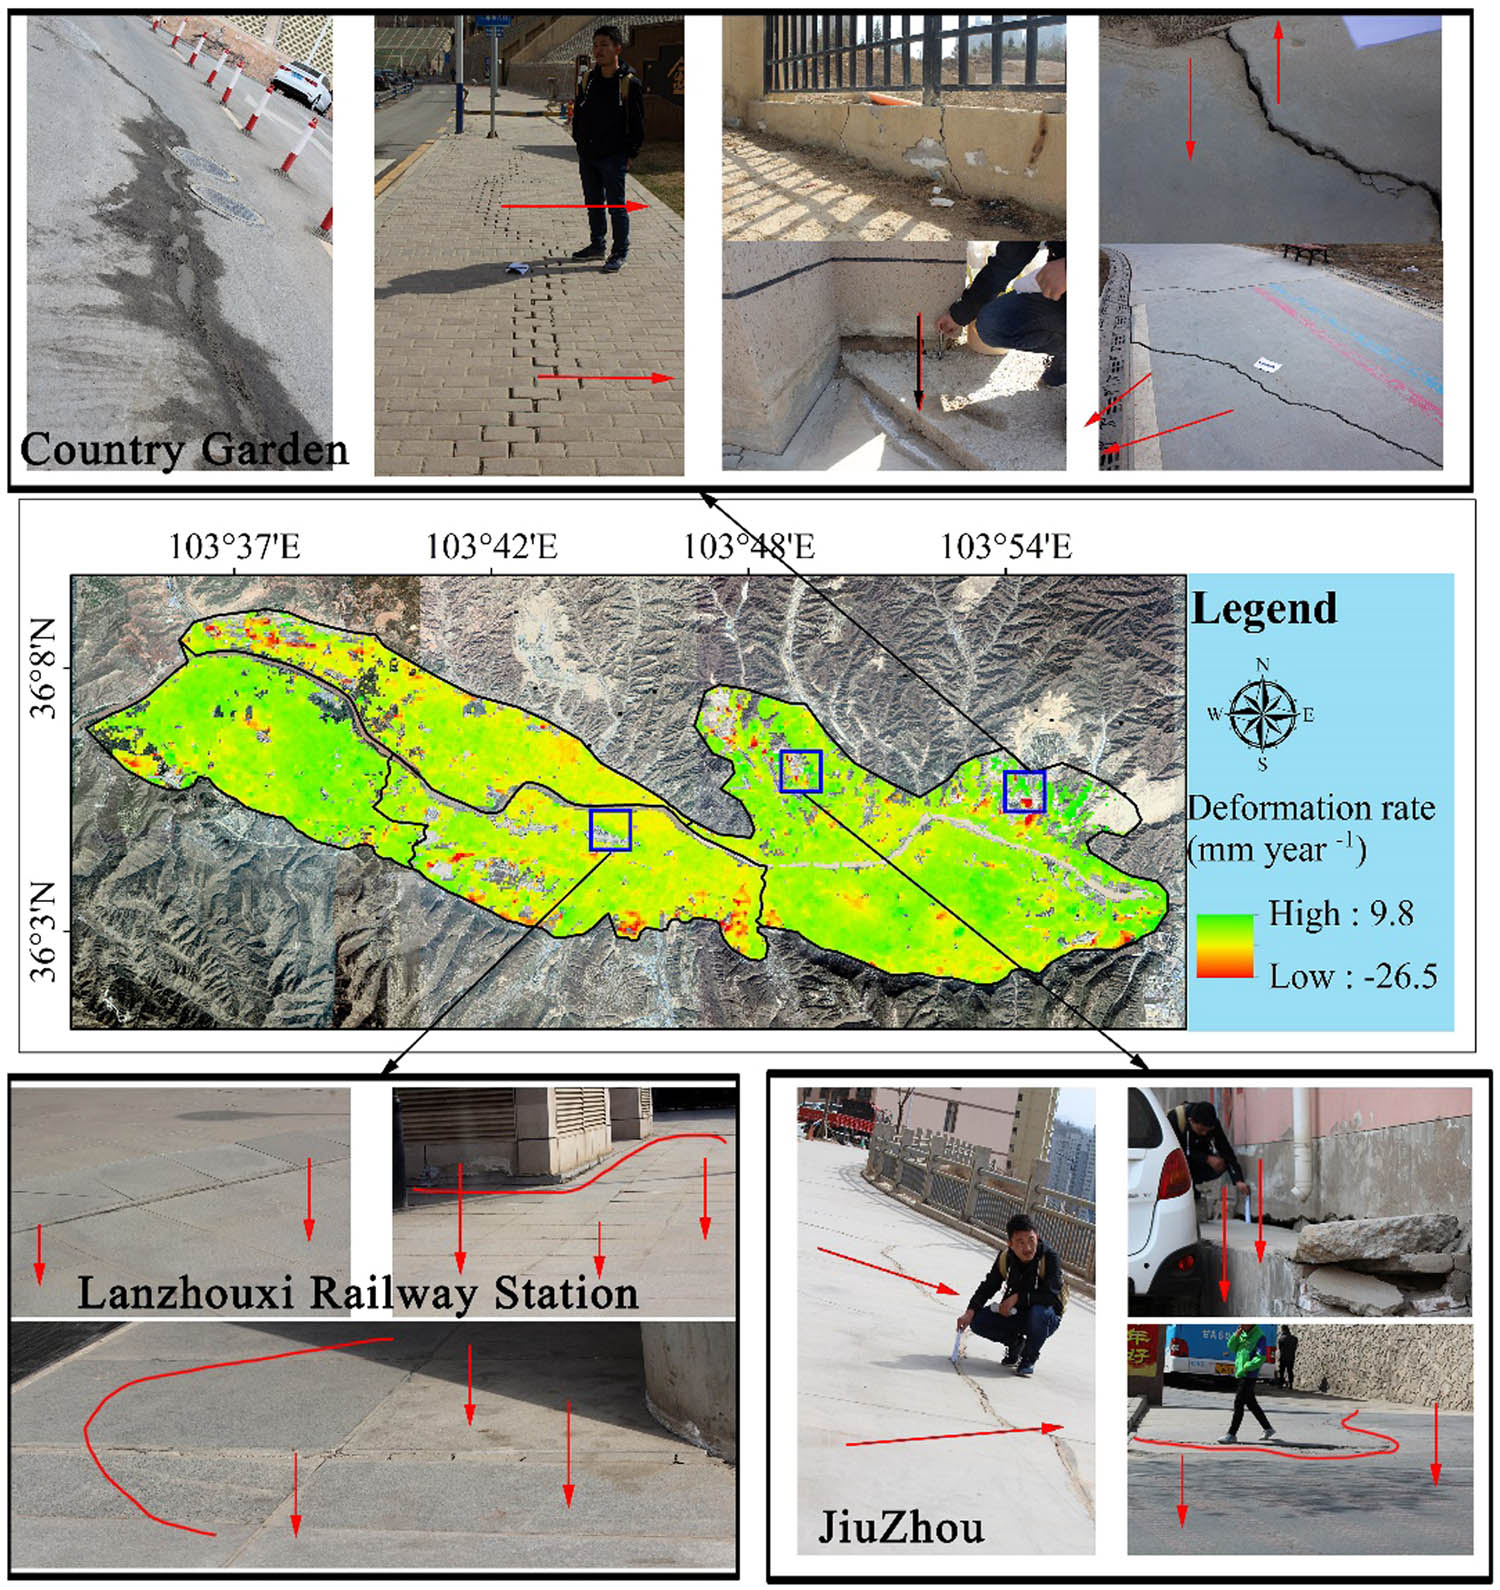
Field evaluation.
4.2 Deformation results
Based on SBAS-InSAR technology, the time-series deformation map and deformation rate map of the study area from March 2015 to January 2017 were obtained.
Figures 5 and 6 show, respectively, the deformation rate and the time-series deformation of the main urban area of Lanzhou from March 2015 to January 2017. The maximum deformation rate was −26.50 mm year−1, and the maximum rate of increase was 9.80 mm year−1. The accumulative deformation was −60.14 mm. From the perspective of its spatial distribution (Figure 7), the main urban area of Lanzhou was stable, but a few regions were unstable. The deformation of the Chengguan district was mostly concentrated in the area around the Nanhuan road, Dongfanghong square, Jiuzhou, and Country Garden. The deformation of Qilihe district was mainly in the Dachaiping and Yujiaping areas. The deformation of the Anning district was mainly in the Lanzhou North Freight Yard, and the deformation of the Xigu district was mainly in the Liuquan Town.
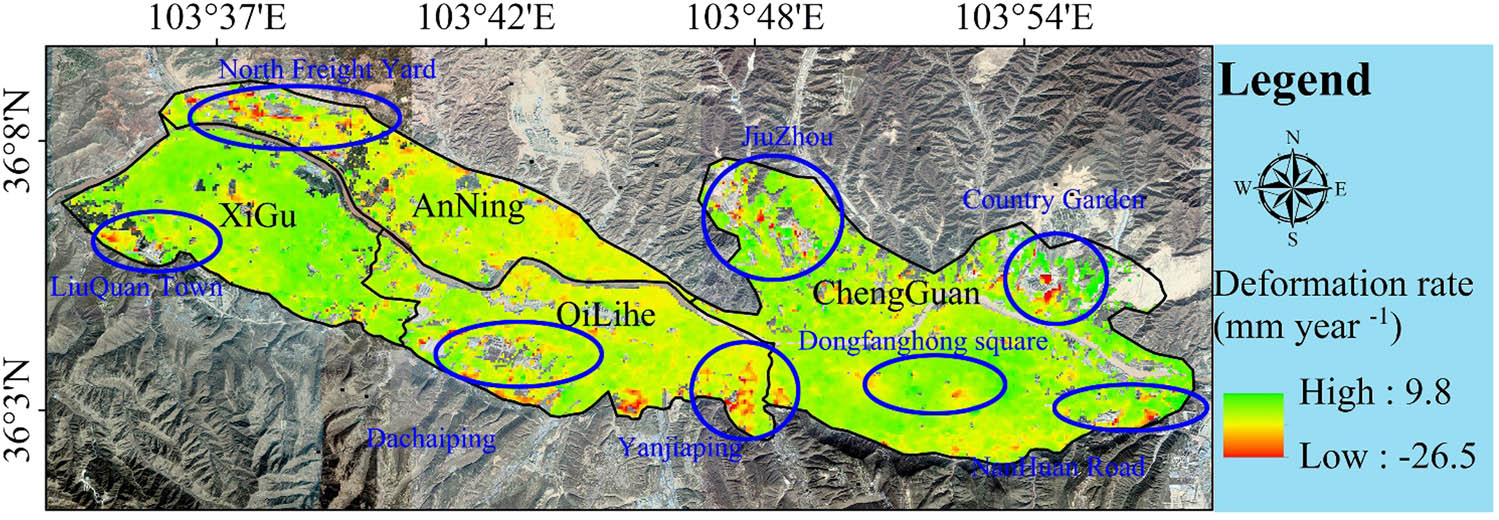
Deformation rate of the study area.
Figure 8 shows the rate of deformation over time. It can be concluded that the first deformation began on 2015/03/14 in Lanzhou Country Garden, Jiuzhou, North Freight Yard, Yanjiaping, and Dachaiping. As time progressed, deformation in these areas gradually grew, and the range of deformation gradually expanded. By 2016/07/30, the uplifting trend of Xigu district had intensified, and some areas with large deformation in the central city (Dongfanghong Square) had begun to stand out. By 2016/10/16, the uplifting trend of Xigu district had slowed down. The time-series deformation peaked by 2017/01/20. The partial deformation of the central city was further aggravated.
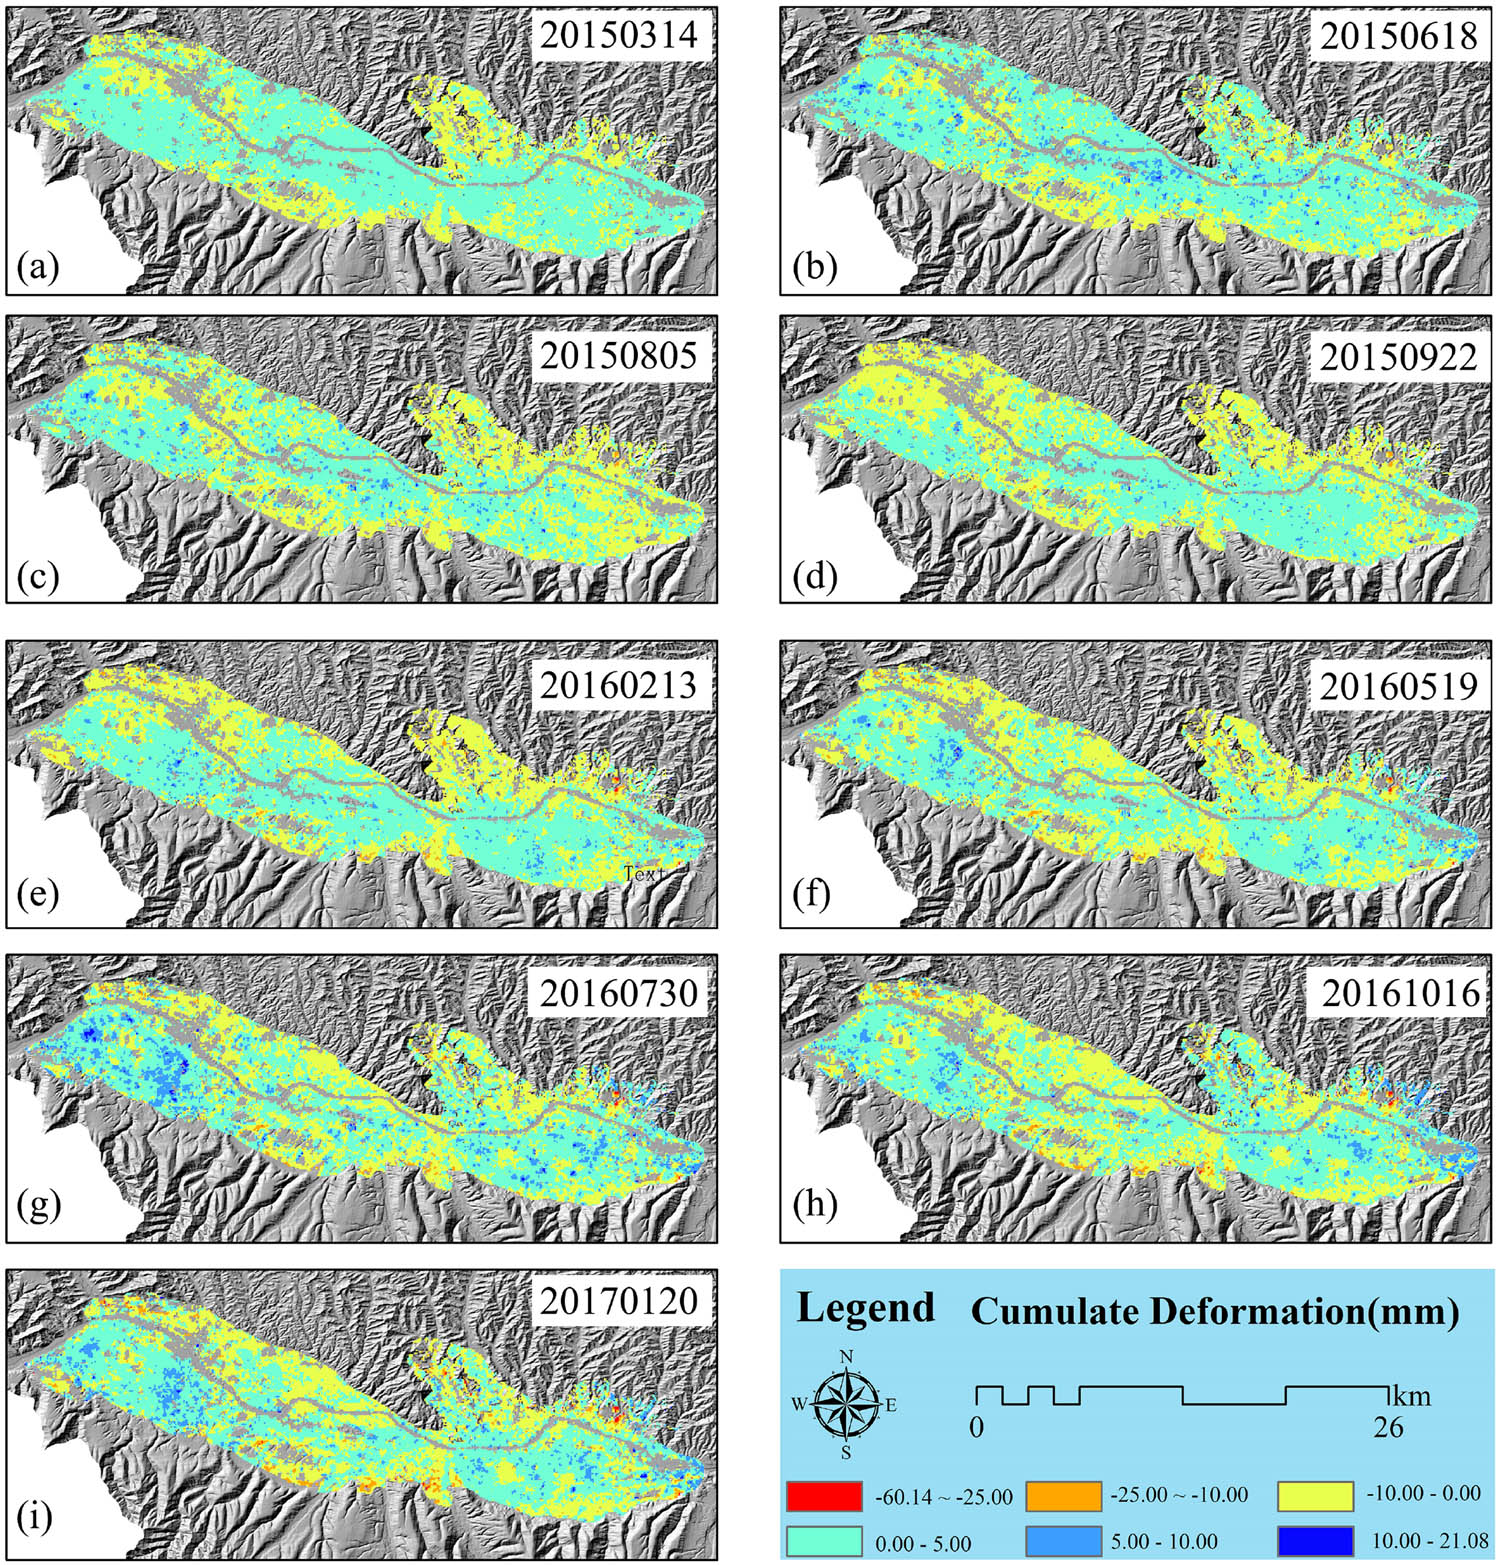
Time-series deformation.
In this paper, the raster deformation rate maps with a coherence of 0.70 in SBAS-InSAR results were converted into vector points, covering a total of 415,893 vector points in the study area (see Table 3), and the vector points with a deformation rate of −5 to 5 mm year−1 accounted for the vast majority of the deformation rate (96.90%). Only a small number of points were between −5.00 to −26.50 mm year−1 and 5.00–10.00 mm year−1, indicating the main urban area of Lanzhou was stable from March 2015 to January 2017, but there were also some regions with large deformation, which deserve further study.
Statistics of the deformation rate
| Deformation rate (mm year−1) | Number of points | Percentage of total points (%) | Accumulated percentage of total points (%) |
|---|---|---|---|
| −26.5.0 to −20.00 | 105 | 0.02 | 0.02 |
| −20.00 to −5.00 | 126,26 | 3.03 | 3.06 |
| −5.00 to 5.00 | 4,03,039 | 96.90 | 99.96 |
| 5.00–10.00 | 123 | 0.02 | 100 |
5 Discussion
5.1 The analysis of differentiation and factor detection
Table 4 describes the driving coefficient of each driving force and its explanatory force. The driving coefficient q is the highest in the built-up area and the lowest in land cover types. The p-value represents a significant test. The smaller the P, the higher the accuracy of the data. Therefore, the built-up area and the density of the road network are the main driving forces for surface deformation in Lanzhou from 2015 to 2017. The deformation rate for the built-up area is interpreted as 40.10%, while the interpretation for the density of road network interpretation is 39.65%. The deformation rate for temperature and precipitation is interpreted as 12.90% and 15.30%, respectively, but the influence of these factors on the deformation rate of Lanzhou cannot be ignored. The actual influence of temperature and precipitation higher than the experimental value, since the resolution of the meteorological data, is insufficient leading to differences in the spatial distribution of the meteorological data. This paper further analyzed the spatial distribution and cause of each driving force.
Factor detector results
| Driving factor | Density of road network | Built-up area | Land cover types | Temperature | Precipitation |
|---|---|---|---|---|---|
| q statistic | 0.39 | 0.40 | 0.07 | 0.12 | 0.15 |
| p value | 0.00 | 0.00 | 0.03 | 0.00 | 0.00 |
5.1.1 Density of road network and surface deformation
It is essential to analyze the relationship between surface deformation and density road network for road surface deformations that have a significant effect on the speed profile of vehicles and traffic flow conditions [3,4]. This paper studied the density road network to explain the reason for surface deformation. The density of the road network is between 1.54 and 11 km km2 (Figure 9a). The density of the road network has 19 areas between 5 and 11 km. They are concentrated in the Chengguan district and Qilihe district. There were 19 time-series deformation of grids greater than 20 mm (absolute value). The density of the road network is greater than 5, and the time series form variables are greater than 20 mm at area intersections (Figure 9c), amount to a total of 12 areas (5, 9, 10, 12, 13, 15, 16, 17, 18, 20, 27, 29). The density of the road network is likely to the major cause of Nanhuan Road, Dongfanghong Square, and Dachaiping’s deformation, as shown in Figure 9a. Soil deformation and stratum movement are caused by the loading and unloading on the ground, which may affect the surface structure, the relatively concentrated ground load is an important factor of road deformation [10,54,55].
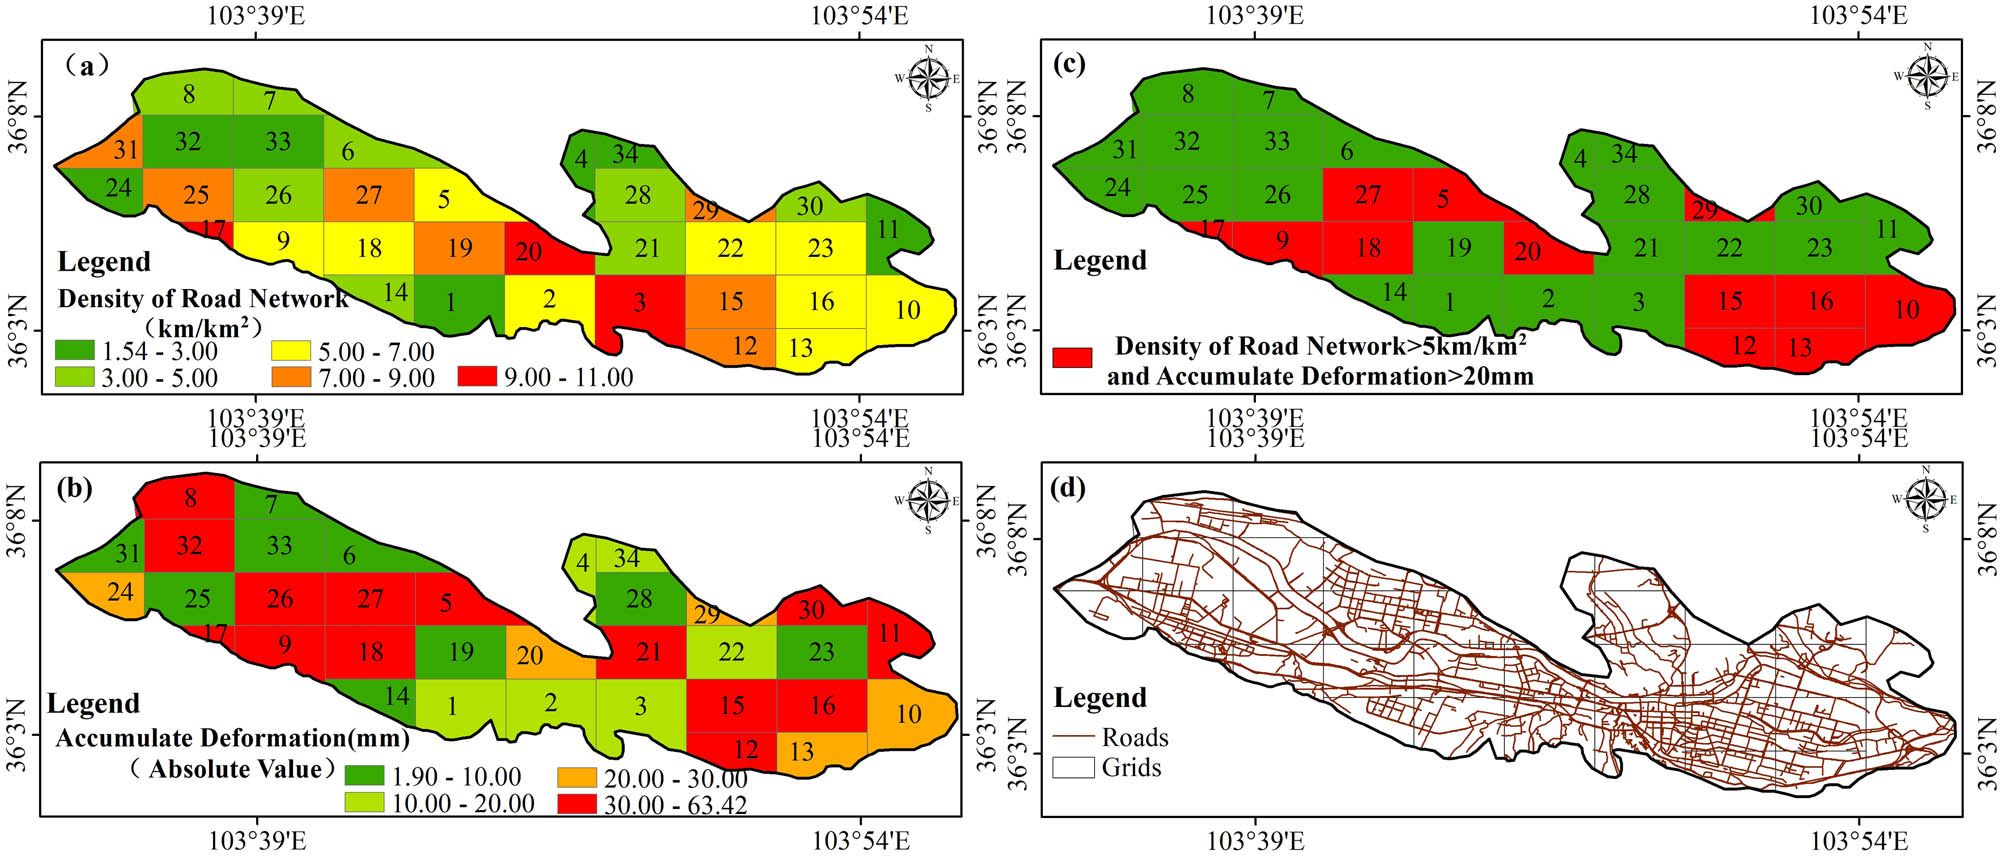
Density of road network and time-series deformation: (a) density of road network; (b) time series deformation; (c) the area where the density of road network >5 km/km2 and time series d > 20 mm; (d) the road network in Lanzhou.
5.1.2 Built-up area and surface deformation
Urbanization is the focus of many Chinese scholars [56,57]. Population density and built-up areas are often important indicators of urban sprawl. After reviewing the statistical yearbooks in Lanzhou from 2015 to 2017 [58,59], we found that economic output increased from 20.093 to 252.354 billion yuan from 2015 to 2017, urban population density increased from 3,514 people km2 to 3,576 people km2; the urbanization process was fast. To analyze the urbanization effect on surface deformation in Lanzhou, this paper analyzes the spatial relationship between the built-up area and the surface deformation. The relationship reflects the relationship between urbanization and surface deformation.
As shown in Figure 10d, the built-up area of Lanzhou is 19.38 km2. Using Fishnet, the study divides these areas into 34 grids: the area of the built-up area of each grid is shown in Figure 10a, the cumulative deformation is shown in Figure 10b, with time-series deformations larger than 20 mm and the built-up area larger than 0.8 km2 selected. As shown in Figure 10c, the surface deformation of the 8, 10, 18, 26, and 27 regions may be related to changes in the built-up area [60]. Figure 10c/8 and Figure 10c/10 show the Lanzhou north freight yard and Nanhuan road, respectively, which also have a large built-up area and serious deformation. The built-up area is also an indispensable cause of surface deformation in the region. The construction of a large number of projects, including the development of underground spaces and the excavation of building foundation pits, resulted in the extraction of underground liquid supports, the excavation of solid supports, and the destruction of the stress balance of the rock and soil, leading to surface deformation [10].
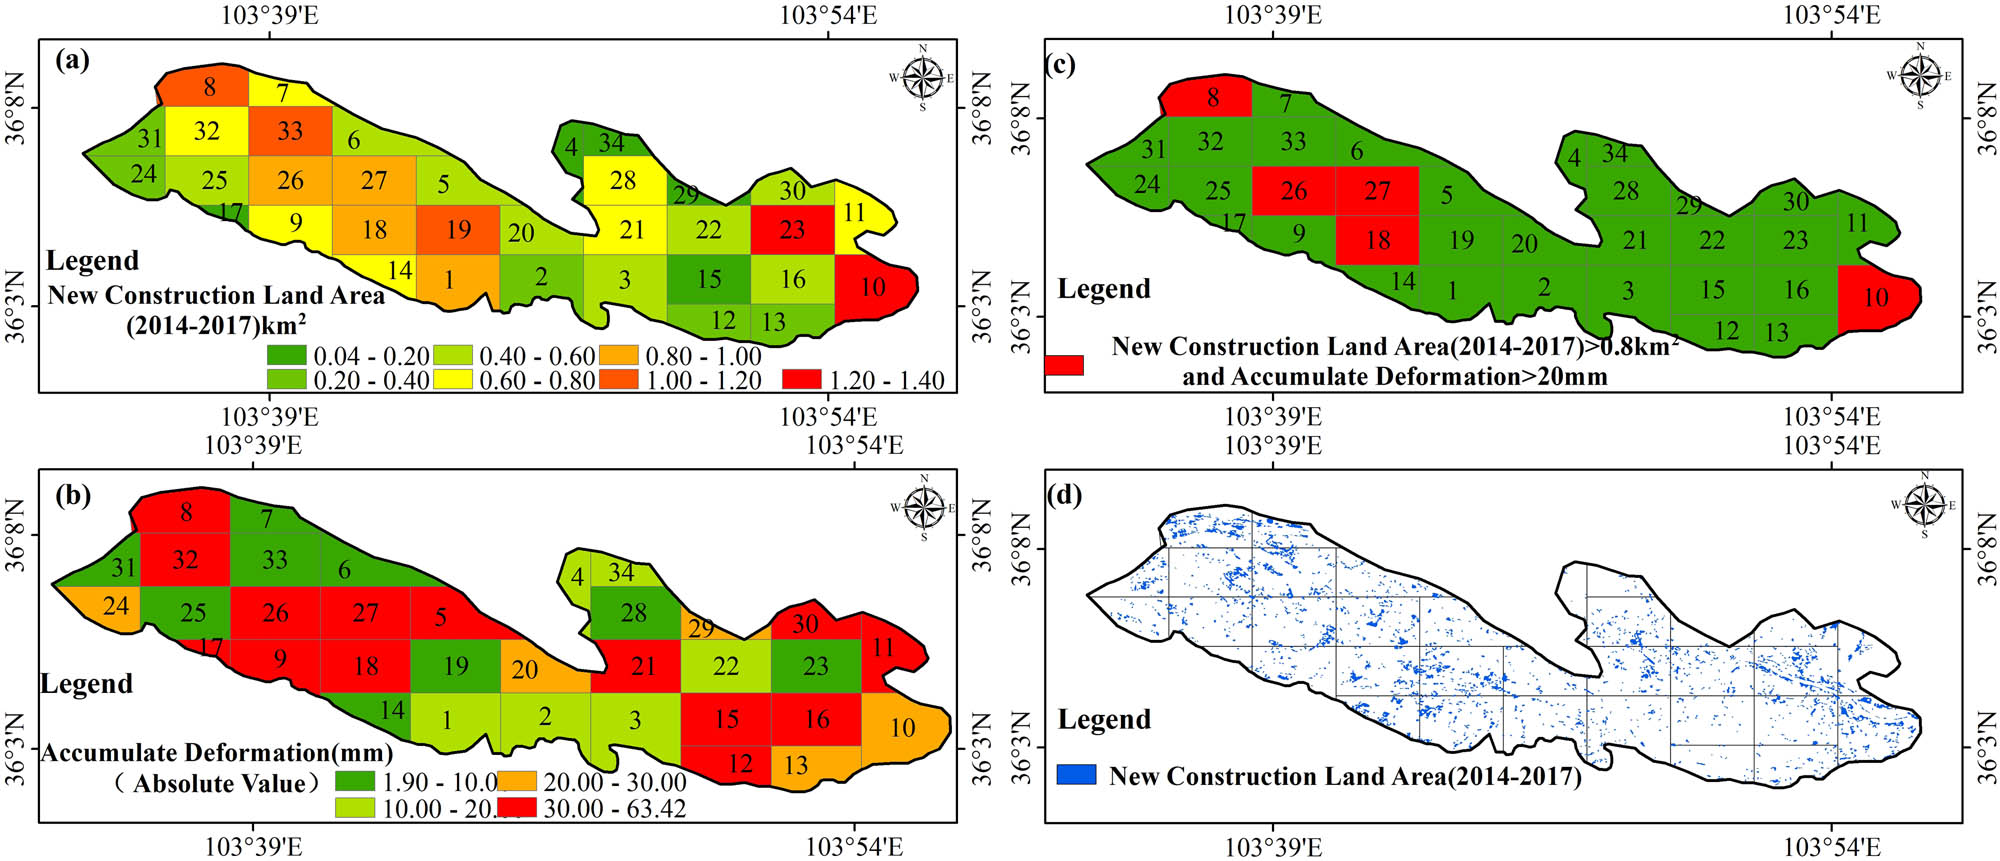
Built-up area and time-series deformation: (a) built-up area from change detection; (b) time series deformation in Lanzhou; (c) the area where the built-up area (2015–2017) >0.80 km2 and time-series deformation >20 mm; (d) the area of the built-up area in Lanzhou.
5.1.3 Land cover types and surface deformation
Figure 11 shows that impervious land (Figure 11a) accounts for the largest section of the study area, followed by vegetation (Figure 11b), the urban area is relatively evenly distributed, and other areas are symmetrically distributed. In general, vegetation coverage in Lanzhou is low. Finally, the bare land is distributed mainly in Jiuzhou and Country Garden (Figure 11c). After observing the optical image, the reason for this distribution is continuous land-creation projects.
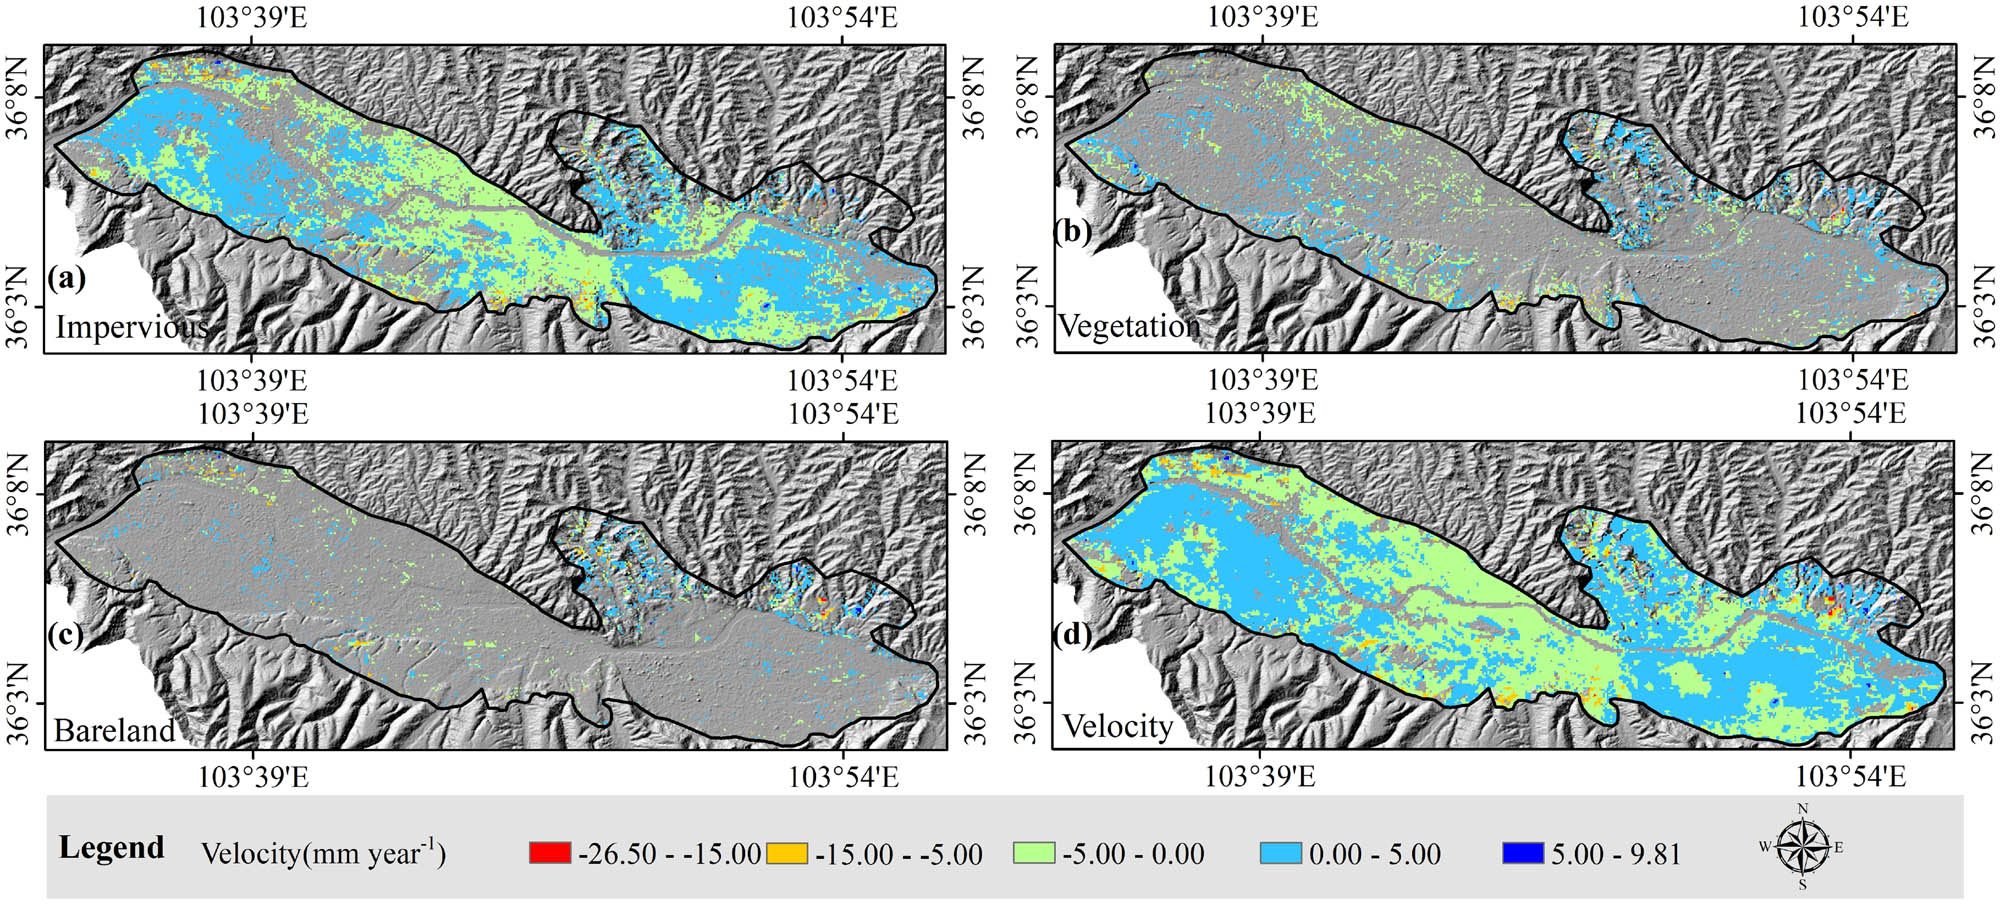
The land cover types with deformation rate: (a) deformation rate in impervious; (b) deformation rate in vegetation; (c) surface deformation in bar land; (d) the deformation rate in Lanzhou.
The area of impervious land (Figure 11a) accounts for the largest sectionof Lanzhou, and the deformation rate is between −5 and 5 mm year−1 (Figure 11a). Surface deformation varies in the North Freight Yard, Dachaiping, Yujiaping, Jiuzhou, and Country Garden Large, between −5 and −15 mm year−1, and the deformation rate of Jiuzhou and Country Garden varies between −15 and −26.50 mm year−1. The vegetation area is small and the distribution is relatively uniform, with a deformation rate mainly concentrated between −5 and 5 mm year−1. Surface deformation in vegetation is relatively small and relatively stable (Figure 11b). Bare land is mainly distributed in North Freight Yard, Jiuzhou, and Country Garden (Figure 11c), and the surface deformation of these areas is also serious. The land cover types are more obvious in bare land. The deep reason is the continue of land-creation. According to relevant scholars, human settlements [61] and industrial areas are inextricably linked to surface deformation. Because groundwater exploitation in human activities is also serious, leading to a decline in groundwater level. Groundwater decline and surface deformation are closely related [29,62].
5.1.4 Meteorological factors and surface deformation
Precipitation and deformation values are also related (Figure 12a). In the winter between 2015 and 2016, there was less precipitation in the study area and more deformation, whereas in the summer (July, August, and September), precipitation was great and deformation as small, especially in 2016, when precipitation was more pronounced. Heavy precipitation supplements groundwater, thus reducing surface deformation [35].
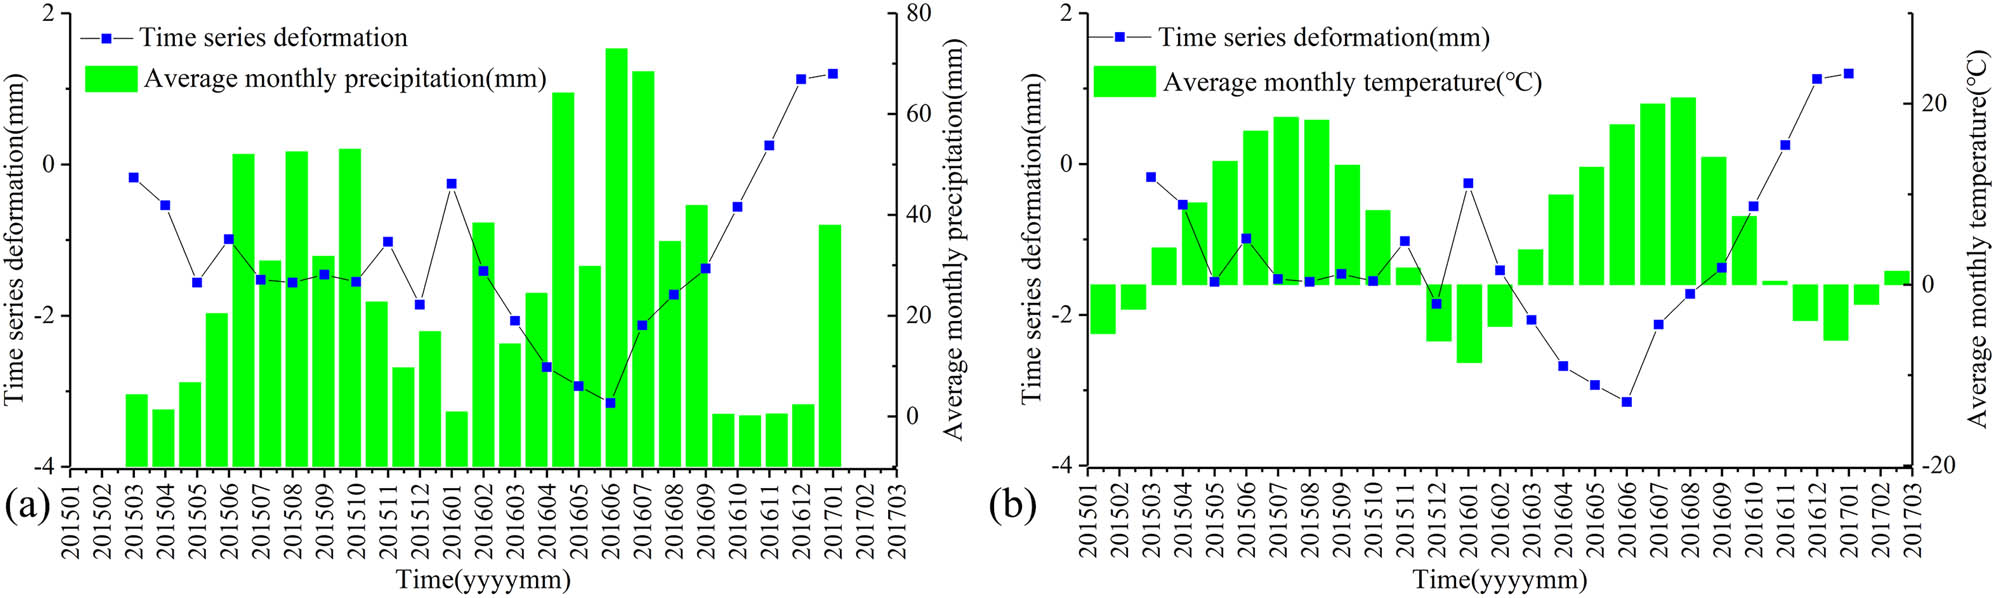
Time-series deformation and average monthly precipitation and temperature. (a) Average time-series deformation and the monthly mean precipitation. (b) Average time-series deformation and the monthly mean temperature.
The temperature rises from February to August and falls from September to January (Figure 12b). The highest temperature is about 20°C in the summer and the lowest temperature is about −10°C in the winter. As the temperature rises, the surface sinks, and with the decrease of temperature, the surface shows an upward trend. This phenomenon is mainly due to the seasonal temperature decrease in the Lanzhou area: freezing soil causes the volume to expand. As the temperature rises, the frozen soil gradually melts and the volume shrinks, leading to surface deformation [8,38].
Furthermore, to quantitatively study the relationship between the time-series deformation and meteorological factors, the correlation between precipitation and temperature and time-series deformation is analyzed, through a linear equation and correlation coefficient (R), as shown in Figure 13. Time-series deformation has a clear negative correlation with precipitation and temperature. The correlation coefficient (R) of the precipitation and time-series deformation is −0.61 (Figure 13a), and the correlation coefficient (R) between temperature and time-series deformation is −0.583 (Figure 13b). The correlation between precipitation and time-series deformation is stronger than temperature, indicating that precipitation has a greater impact on surface deformation.
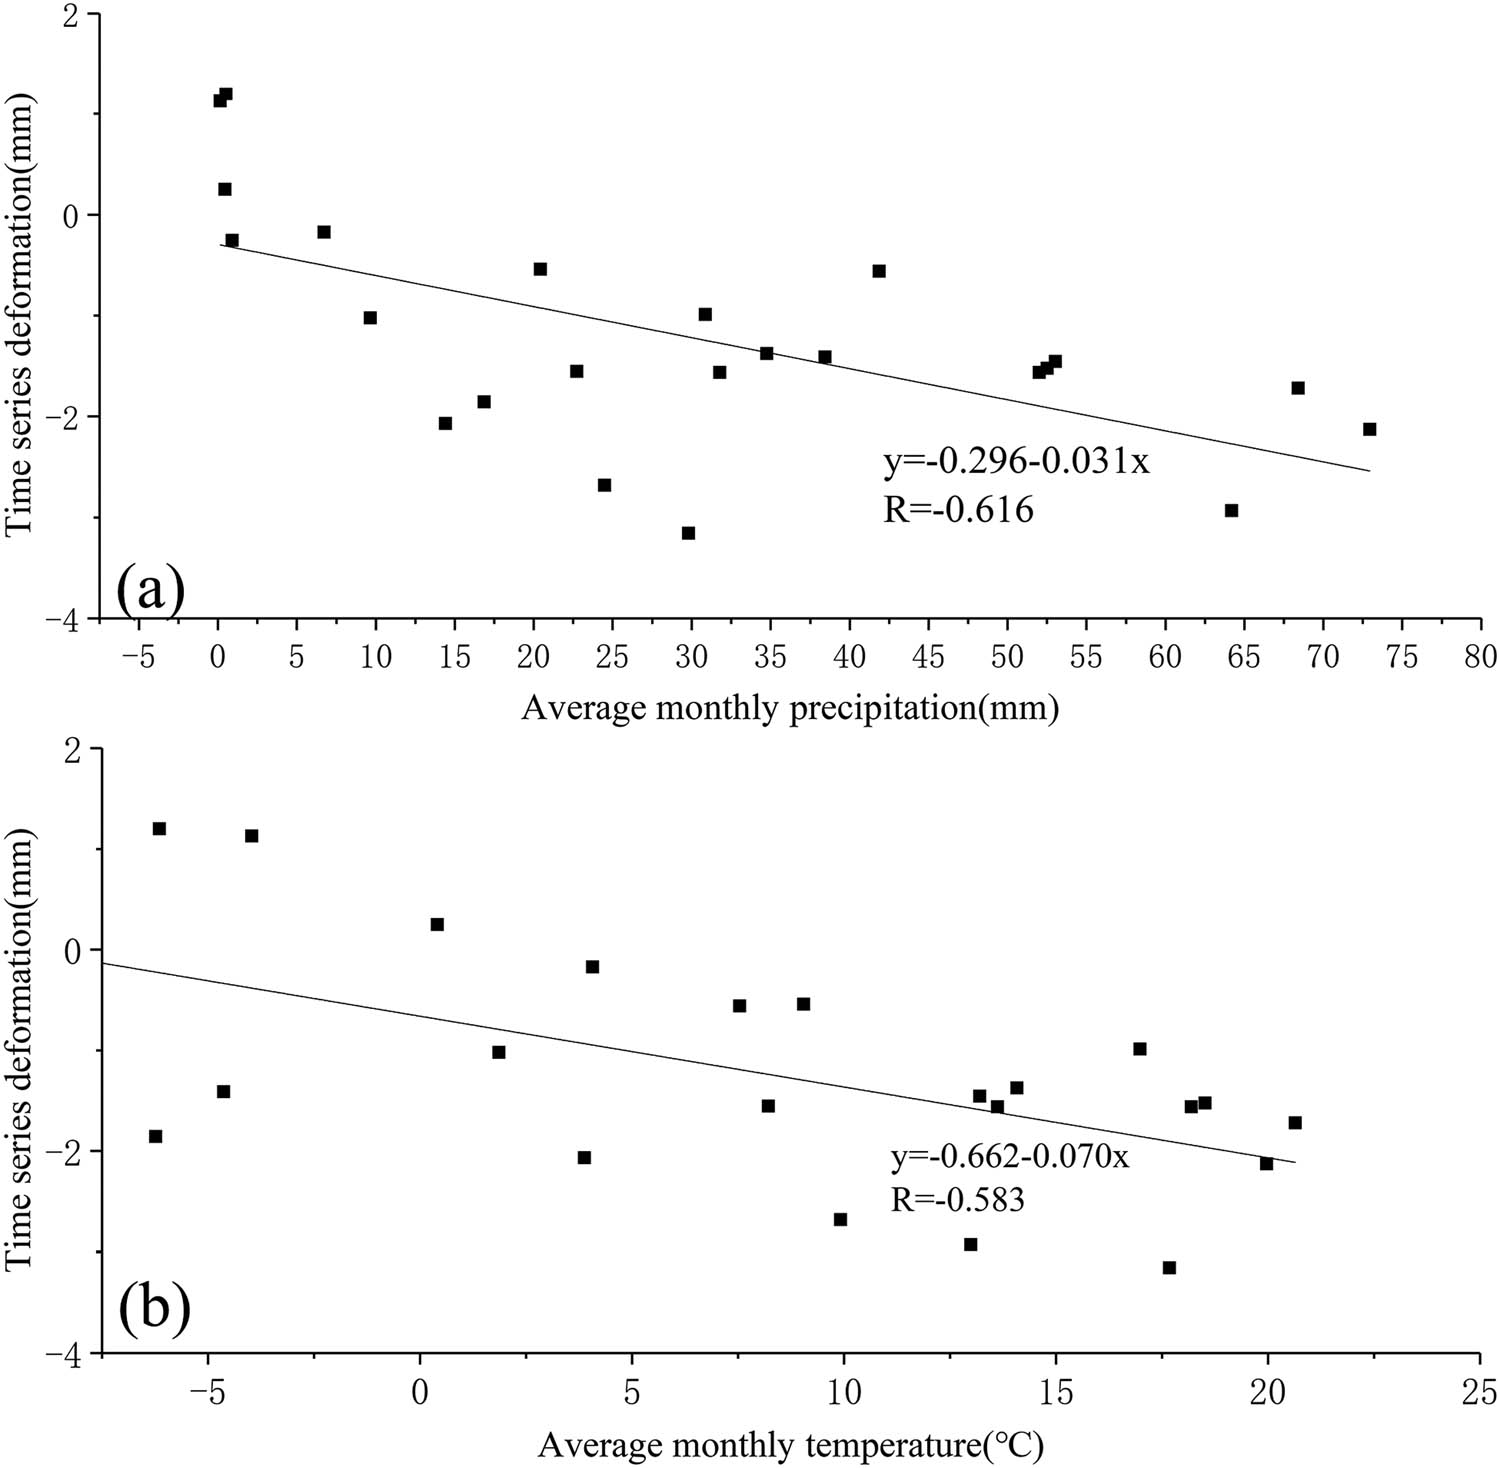
The correlation between precipitation, temperature, and deformation. (a) Correlations between average time series deformation and monthly mean precipitation. (b) Correlations between average time series deformation and monthly mean temperature.
5.2 The analysis of ecological detection
Figure 14 depicts the result of ecological detection, which means the difference in the combined effects of the driving forces on surface deformation: the effects of temperature, precipitation, density of road network, land cover types, and built-up area show varying levels of influence on surface deformation are significantly different. There is no major difference in the influence of the built-up area and density of road network on surface deformation, while there is a significant difference in the influence of built-up area and temperature, precipitation, and land cover types on surface deformation, and there is also a significant difference in the influence of road and temperature, precipitation, and land cover types. In addition, there is no significant difference in the influence of temperature, precipitation, and land cover types, and no significant difference in the influence of precipitation and land cover types. From the above, it can be concluded that the impact of the built-up area and density of the road network on surface deformation is consistent. Temperature and precipitation are both meteorological factors, and their effects on surface deformation are consistent. It can be found that the influences of land cover types and temperature and precipitation on surface deformation are also consistent (Figure 14).
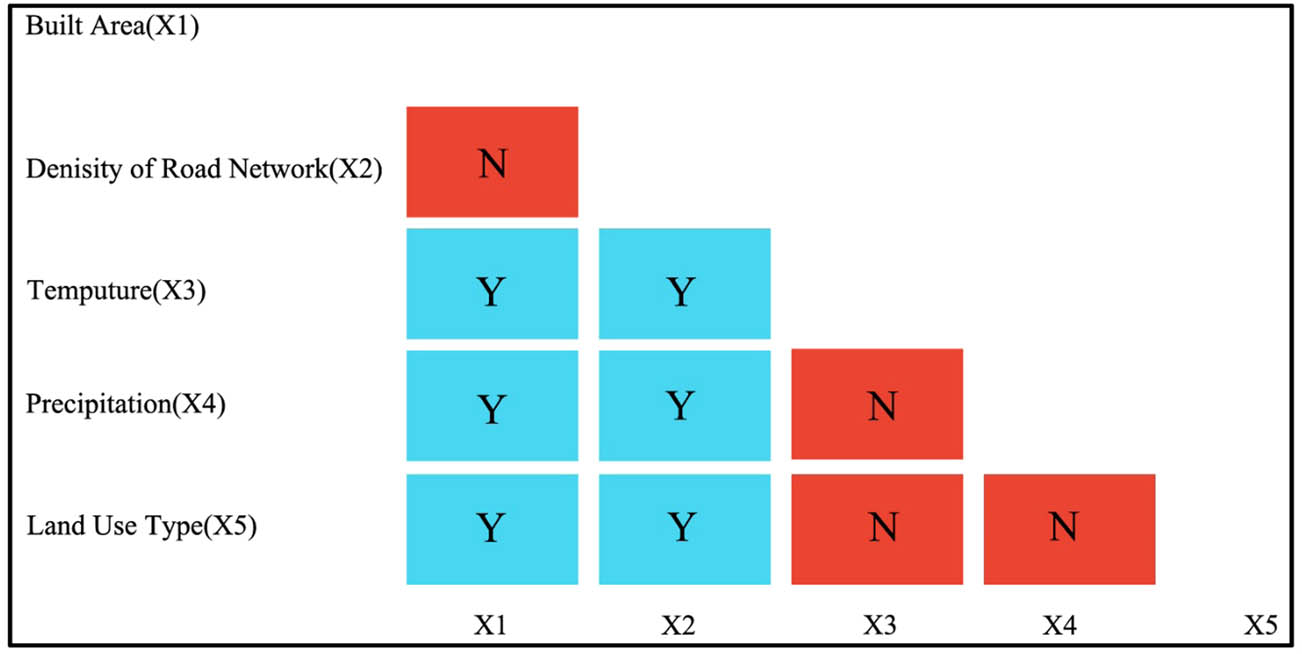
The difference in the combined effects of the driving forces. N: there is no significant difference in the influence of two driving forces; Y: there is a significant difference in the influence of two driving forces.
5.3 The analysis of interaction detection
Table 5 describes the results of interaction detection. Interaction detection identified the interaction between different risk factors Xs. From Table 5, it can be concluded that the spatial distribution and differentiation of surface deformation in the main urban area of Lanzhou is not only affected by a single driving factor but a result of the interaction of multiple driving factors, whose combined effect is more significant than any single driving factor. The interactive explanatory power between the built-up area and land cover types is 0.55, which demonstrates, the greatest impact on surface deformation, followed by the density of road network ∩ land cover types and the density of road network ∩ temperature, which are 0.54 and 0.52, respectively. Compared with the explanatory power of the single driving factor, all driving factors have an enhanced effect on the spatial distribution and differentiation characteristics of surface deformation after mutual interaction, and the effect is not independent. The interaction between the driving factors is a complex superposition relationship, rather than a simple operational relationship. It is worth noting that the interaction patterns between land cover types and density of road network, temperature, precipitation, and built-up area are a nonlinear enhancement, because their explanatory power is quite different from that of other driving factors [63].
The interaction detector
| Interactive factor X1 ∩ X2) | P(X1) | P(X2) | P(X1 ∩ X2) | Interaction result | Effect mode |
|---|---|---|---|---|---|
| Built-up area ∩ density of road network | 0.40 | 0.40 | 0.42 | P(A ∩ B) > max[P(A), P(B)] | Bilinear enhancement |
| Built-up area ∩ temperature | 0.40 | 0.13 | 0.50 | P(A ∩ B) > max[P(A), P(B)] | Bilinear enhancement |
| Built-up area ∩ precipitation | 0.40 | 0.15 | 0.44 | P(A ∩ B) > max[P(A), P(B)] | Bilinear enhancement |
| Built-up area ∩ land cover types | 0.40 | 0.07 | 0.55 | P(A ∩ B) > P(A) + P(B) | Nonlinear enhancement |
| Density of road network ∩ temperature | 0.40 | 0.13 | 0.52 | P(A ∩ B) > max[P(A), P(B)] | Bilinear enhancement |
| Density of road network ∩ precipitation | 0.40 | 0.15 | 0.46 | P(A ∩ B) > max[P(A), P(B)] | Bilinear enhancement |
| Density of road network ∩ land cover types | 0.40 | 0.07 | 0.54 | P(A ∩ B) > P(A) + P(B) | Nonlinear enhancement |
| Temperature ∩ precipitation | 0.13 | 0.15 | 0.18 | P(A ∩ B) > max[P(A), P(B) ] | Bilinear enhancement |
| Temperature ∩ land cover types | 0.13 | 0.07 | 0.25 | P (A ∩ B) > P(A) + P(B) | Nonlinear enhancement |
| Precipitation ∩ land cover types | 0.15 | 0.07 | 0.29 | P(A ∩ B) > P(A) + P(B) | Nonlinear enhancement |
6 Conclusions
This paper obtained the spatial-temporal characteristics of surface deformation by using SBAS-InSAR technology in the main urban area of Lanzhou, Gansu Province, China, based on Sentinel-1A descending data from March 2015 to January 2017. Moreover, the geo-detector is used to quantitatively analyze the driving factors among the surface deformation and temperature, precipitation, the density of road networks, land cover types, and built-up area, by exploring single driving factor and multidriving factor interactions. The results showed that the overall surface deformation in Lanzhou was stable, and the deformation rate was −26.50 to 9.80 mm year−1. However, surface deformations in Nanhuan road, Dongfanghong square, Jiuzhou, Country Garden, Dachaiping, Yujiaping area, Lanzhou North Freight Yard, and Liuquan town were serious and deserving of special attention. The geo-detector demonstrated the explanatory power of the driving factors, and with a sequence of single factors as follows: built-up area (0.40), the density of road network (0.39), precipitation (0.15, temperature (0.12), land cover types (0.07), which indicated that the main factors in single factors causing the surface deformation are built-up area and the density of road network. We found that each driving factor does not act on surface deformation alone, but rather through a more complicated superposition relationship. Interactive explanatory power was stronger than a single explanatory factor. Built-up area ∩ land cover types and the density of road networks ∩ land cover types were the main causes of surface deformation.
In this paper, it is the first time to analyze the influencing factors of surface deformation with the geo-detector method and quantify the quantitative relationship between surface deformation and influencing factors. The geo-detector provides a good analytical tool to monitor the multifactor interactions causing surface deformation. The combination of InSAR and geo-detector can also be used for the analysis of driving forces in other disasters. The study provides reference data and a scientific basis for disaster prevention and ecologically sustainable in Lanzhou. The disadvantage of this paper is that groundwater level extraction, age of building construction (and urbanization in general), thickness, and geotechnical characteristics of the compressible layers and faults were not considered for the absence of data. The disadvantage will be perfected in our future work.
Conflict of Interest: The authors declare no conflict of interest.
Author Contributions: W. W. conceived the idea, designed and performed the experiments, produced the results, and drafted the manuscript. Y. H. contributed to translate and modify the paper. L. Z. audited the figures. Y. C. downloaded the data. L. Q. finished geo-detector. H. P. finished methods.
Funding: This work is funded by the National Key R&D Program of China (2017YFB0504201), The Youth fund of LZJTU, No. 2017002; LZJTU EP, No. 201806, Tianyou Youth talent lift program of Lanzhou Jiaotong University, the National Scientific Foundation of China (Grants No. 41371435, 41761088, 41761014, 41761082, 41801395, and 41861059) and the National Key Research and Development Program of China (2016YFC0803106), “InSAR monitoring of land subsidence in the main urban area of Lanzhou city” by the department of education of Gansu Province(2019A-043); China postdoctoral science foundation (2019M660092XB).
References
[1] Du Z, Ge L, Ng AH, Zhu Q, Yang X, Li L. Correlating the subsidence pattern and land use in Bandung, Indonesia with both Sentinel-1/2 and ALOS-2 satellite images. Int J Appl Earth Observation Geoinf. 2018;67:54–68.10.1016/j.jag.2018.01.001Search in Google Scholar
[2] Babaee S, Mousavi Z, Masoumi Z, Malekshah AH, Roostaei M, Aflaki M. Land subsidence from interferometric SAR and groundwater patterns in the Qazvin plain, Iran. Int J Remote Sens. 2020;41(12):4778–96.10.1080/01431161.2020.1724345Search in Google Scholar
[3] Aydin MM, Topal A. Effects of pavement surface deformations on traffic flow. Transport. 2019;34(2):204–14.10.3846/transport.2019.8631Search in Google Scholar
[4] Aydin MM, Topal A. Effect of road surface deformations on lateral lane utilization and longitudinal driving behaviours. Transport. 2016;31(2):192–201.10.3846/16484142.2016.1193049Search in Google Scholar
[5] He Y, Wang W, Yan H, Zhang L, Chen Y, Yang S. Characteristics of surface deformation in Lanzhou with Sentinel-1A TOPS. Geosciences. 2020;10:99.10.3390/geosciences10030099Search in Google Scholar
[6] Peltier A, Scott B, Hurst T. Ground deformation patterns at White Island volcano (New Zealand) between 1967 and 2008 deduced from levelling data. J Volcanology & Geotherm Res. 2009;181(3–4):207–18.10.1016/j.jvolgeores.2009.01.020Search in Google Scholar
[7] Palano M, Guarrera E, Mattia. M. GPS deformation patterns at Mount St. Helens (Washington,DC, USA) from 2004 to 2010. Terra Nova. 2012;24(5):148–55.10.1111/j.1365-3121.2011.01049.xSearch in Google Scholar
[8] Wang F, Ding Q, Zhang L, Wang MC, Wang Q. Analysis of land surface deformation in Chagan Lake Region using TCPInSAR. Sustainability. 2019;11:5090.10.3390/su11185090Search in Google Scholar
[9] Zhu W, Li W, Zhang Q, Yang Y, Zhang Y, Qu W, et al. A decade of ground deformation in Kunming (China) revealed by multi-temporal synthetic aperture radar interferometry (InSAR) technique. Sensors. 2019;19(20):4425.10.3390/s19204425Search in Google Scholar PubMed PubMed Central
[10] Qin X, Yang M, Liao M, Wang H, Yang T. Exploring temporal-spatial characteristics of Shanghai Road network settlement with multi-temporal PSInSAR Tecnique. Geomat Inf Sci Wuhan Univ [ChEngl Abstr]. 2017;42(2):170–7.Search in Google Scholar
[11] Jeon SS, Park YK, Eum KY. Stability assessment of roadbed affected by ground subsidence adjacent to urban railways. Nat Hazards Earth Syst Sci. 2018;18(8):2261–71.10.5194/nhess-18-2261-2018Search in Google Scholar
[12] Serrano-Juan A, Pujades E, Vázquez-Suñè E, Crosetto M, Cuevas-González. Leveling vs. InSAR in urban underground construction monitoring: pros and cons. Case of la sagrera railway station (Barcelona, Spain). Eng Geol. 2016;218(2017):1–11.10.1016/j.enggeo.2016.12.016Search in Google Scholar
[13] Polcari M, Moro M, Romaniello V, Stramondo S. Anthropogenic subsidence along railway and road infrastructures in Northern Italy highlighted by Cosmo-SkyMed satellite data. J Appl Remote Sens. 2019;13(2):1.10.1117/1.JRS.13.024515Search in Google Scholar
[14] Ferretti A, Ferrucci F, Prati C, Rocca F. SAR analysis of building collapse by means of the permanent scatterers technique. Int Geosci Remote Sens Symposium. 2000;3219–21.10.1109/IGARSS.2000.860388Search in Google Scholar
[15] Sousa JJ, Bastos L. Multi-temporal SAR interferometry reveals acceleration of bridge sinking before collapse. Nat Hazards Earth Syst Sci. 2013;13(3):659–67.10.5194/nhess-13-659-2013Search in Google Scholar
[16] Liu Q, Yue G, Ding X, Yang K, Feng G, Xiong Z. Temporal and spatial characteristics analysis of deformation along foshan subway using time series InSAR. Geomat Inf Sci Wuhan University[in Chin Engl Abstr]. 2019;44:1099–106.Search in Google Scholar
[17] Hu F, Freek J, Chang L, Wu J, Ramon F. Monitoring deformation along railway systems combining multi-temporal InSAR and LiDAR data. Remote Sens. 2019;11:19.10.3390/rs11192298Search in Google Scholar
[18] Liu Y, Li L, Yang J, Chen X, Zhang R. Snow depth inversion based on D-InSAR method[in Chinese with English abstract]. J Remote Sens. 2018;22(05):802–9.Search in Google Scholar
[19] Kang Y, Zhao C, Zhang Q, Liu X. Research on the InSAR technique of landslide detection: a case study of Wudongde Hydropower station section. Jin shajiang[in Chin Engl Abstr] J Geodesy Geodynamics. 2018;38(10):1053–7.Search in Google Scholar
[20] Lu Y, Li W, Xu Q, Dong X, Dai C, Wang C. Early detection of landslides in the upstream and downstream areas of the Baige Landslide, the Jinsha River based on optical remote sensing and InSAR Tec. Geomat Inf Sci Wuhan University[in Chin Engl Abstr]. 2019;44(9):1342–54.Search in Google Scholar
[21] Berardino P, Fornaro G, Lanari R, Sansosti E. A new algorithm for surface deformation monitoring based on small baseline differential SAR interferograms. IEEE Transactions on Geoscience & Remote Sensing. 2002;40(11):2375–83.10.1109/TGRS.2002.803792Search in Google Scholar
[22] Lanari, Mora O, Manunta M, Mallorquí JJ, Berardino P, Sansosti E. A small-baseline approach for investigating deformations on full-resolution differential SAR interferograms. IEEE Trans Geosci Remote Sens. 2004;42(7):1377–86.10.1109/TGRS.2004.828196Search in Google Scholar
[23] Liao W. Time series InSAR technology and application. Beijing: Science Press; 2014.Search in Google Scholar
[24] Wang J, Xu C. Geo-detector: principle and prospective. Acta Geographica Sinica[in Chin Engl Abstr]. 2017;72(1):116–34.Search in Google Scholar
[25] Ju H, Zhang Z, Zuo L, Wang J, Zhang S, WangX, et al. Driving forces and their interactions of built-up land expansion based on the geographical detector – a case study of Beijing, China. Int J Geographical Inf Sci. 2016;30(11):2188–207.10.1080/13658816.2016.1165228Search in Google Scholar
[26] Liao Y, Zhang Y, He L, Wang J, Liu X, Zhang N, et al. Temporal and spatial analysis of neural tube defects and detection of geographical factors in Shanxi Province, China. PLoS One. 2016;11(4):2188–207.10.1371/journal.pone.0150332Search in Google Scholar PubMed PubMed Central
[27] Chen C, Zhang Q, Lv X, Huang X. Analysis on spatial-temporal characteristics and driving mechanisms of cropland occupation and supplement in Jiangsu Province[in Chinese with English abstract]. Economic Geogr. 2016;36(4):155–63.Search in Google Scholar
[28] Hu K, Wei L, Liu S, Li X. Spatial pattern of debris-flow catchments and the rainfall amount of triggering debris flows in the Hengduan Mountains region. Acta Geographica Sinica[in Chin Engl Abstr]. 2019;11:2303–13.Search in Google Scholar
[29] Tang J, Liu G, Song Y, Chen W, Yu B. Significant subsidence detection and analysis by PALSAR and ASAR PSI[in Chinese with English abstract]. J Remote Sens. 2015;19(6):1019–29.Search in Google Scholar
[30] Wang H, Feng G, Xu B, Yu Y, Li L, Du Y, et al. Deriving spatio-temporal development of ground subsidence due to subway construction and operation in delta regions with PS-InSAR data: a case study in Guangzhou, China. Remote Sens. 2017;9(10):1004–12.10.3390/rs9101004Search in Google Scholar
[31] Ahmad W, Choi M, Kim S, Kim D. Detection of land subsidence and its relationship with land cover types using ESA Sentinel satellite data: a case study of Quetta Valley, Pakistan. Int J Remote Sens. 2019;40(24):9572–603.10.1080/01431161.2019.1633704Search in Google Scholar
[32] Zhou C, Gong H, Chen B, Gao M, Cao Q, Cao J, et al. Land subsidence response to different land use types and water resource utilization in Beijing-Tianjin-Hebei. China Remote Sens. 2020;12(3):457.10.3390/rs12030457Search in Google Scholar
[33] Minderhoud PS, Coumou L, Erban LE, Middelkoop H, Stouthamer E, Addink EA. The relation between land use and subsidence in the Vietnamese Mekong delta. Sci Total Environ. 2018;634(SEP.1):715–26.10.1016/j.scitotenv.2018.03.372Search in Google Scholar PubMed PubMed Central
[34] Wang F, Ding Q, Zhang L, Wang M, Wang Q. Analysis of land surface deformation in Chagan Lake Region using TCPInSAR. Sustainability. 2019;11(18):5090.10.3390/su11185090Search in Google Scholar
[35] Zhou L, Guo J, Hu J, Li J, Xu Y, Pan Y, et al. Wuhan surface subsidence analysis in 2015–2016 based on Sentinel-1A data by SBAS-InSAR. Remote Sens. 2017;9(10):982.10.3390/rs9100982Search in Google Scholar
[36] Chen YX, Jiang LM, Liang LL, Zhou ZW. Monitoring permaforst deformation in the upstream Heihe River, Qilian Mountain by using multi-temporal Sentinel InSAR dataset[in Chinese with English abstract]. Chin J Geophys. 2019;62:2441–54.Search in Google Scholar
[37] Li SS, Li ZW, Hu J, Sun Q, Yu XY. Investigation of the Seasonal oscillation of the permaforst over Qinghai-Tibet Plateau with SBAS-InSAR algorithm[in Chinese with English abstract]. Chin J Geophys. 2013;56:1476–86.Search in Google Scholar
[38] Wang S, Xu B, Shan W, Shi J, Li Z, Feng G. Monitoring the degradation of island permafrost using time-series InSAR technique: a case study of Heihe, China. Sensors. 2019;19(6):1364.10.3390/s19061364Search in Google Scholar PubMed PubMed Central
[39] Wang Y, Guo Y, Hu S, Li Y, Wang J, Liu X, et al. Ground deformation analysis using InSAR and backpropagation prediction with influencing factors in Erhai Region, China. Sustainability. 2019;11:2853.10.3390/su11102853Search in Google Scholar
[40] Scoular J, Ghail R, Mason PJ, Lawrence J, Bellhouse M, Holley R, et al. Retrospective InSAR analysis of East London during the construction of the Lee Tunnel. Remote Sens. 2020;12:5.10.3390/rs12050849Search in Google Scholar
[41] Wang T. Surface Deformation Monitoring Research Based on Time Series InSAR Technology-Acase Study of Lanzhou. Lanzhou: M.S, Lanzhou University; 2015.Search in Google Scholar
[42] Xue Y, Meng X, Li K, Chen G. Loess slope instability assessment based on PS-InSAR detected and spatial analysis in Lanzhou Region, China. Adv Mater Res. 2014;2342–52.10.4028/www.scientific.net/AMR.1065-1069.2342Search in Google Scholar
[43] Zhang L. Spatial-temporal Process Analyses on Urban Expansion of Lanzhou under Different Terrain. Lanzhou: M.S. Lanzhou University; 2017.Search in Google Scholar
[44] Rana V, Suryanarayana T. Visual and statistical comparison of ASTER, SRTM, and Cartosat digital elevation models for watershed. J Geovisualization Spat Anal. 2019;3(23):12.10.1007/s41651-019-0036-zSearch in Google Scholar
[45] Reute H, Jarvis A. An evaluation of void filling interpolation methods for SRTM data. Int J Geographic Inf Sci. 2007;21:983–1008.10.1080/13658810601169899Search in Google Scholar
[46] Durre I, Menne M, Gleason B, Houston T, Vose R. Comprehensive automated quality assurance of daily surface observations. J Appl Meteorol Climatol. 2010;49:1615–33.10.1175/2010JAMC2375.1Search in Google Scholar
[47] Willmott C, Matsuura K. Terrestrial Air Temperature: 1900–2017 Gridded Monthly Time Series (1900–2017); 2017.Search in Google Scholar
[48] Willmott C, Matsuura K. Terrestrial Precipitation: 1900–2017 Gridded Monthly Time Series (1900–2017); 2017.Search in Google Scholar
[49] Gong P, Liu H, Zhang M, Li C, Wang J, Huang H, et al. Stable classification with limited sample: transferring a 30 m resolution sample set collected in 2015 to mapping 10 m resolution global land cover in 2017. Sci Bull. 2019;64:370–80.10.1016/j.scib.2019.03.002Search in Google Scholar
[50] Simons M, Rosen PA. Interferometric synthetic aperture radar geodesy. Treatise Geophysics. 2007;3(6):391–446.10.1016/B978-044452748-6/00059-6Search in Google Scholar
[51] Gabriel AK, Goldstein RM, Zebker HA. Mapping small elevation changes over large areas: differential radar interferometry. J Geophys Res. 1989;94(b7):9183–91.10.1029/JB094iB07p09183Search in Google Scholar
[52] Wang JF, Li XH, Christakos G, Liao YL, Zhang T, Gu X. Geographical detectors-based health risk assessment and its application in the neural tube defects study of the Heshun region, China. Int J Geographical Inf Sci. 2010;24(1):107–27.10.1080/13658810802443457Search in Google Scholar
[53] Li J. Elevation Information Extraction and Accuracy Anaysis Based on InSAR. Haebin: Haebin Institute of Technology; 2012.Search in Google Scholar
[54] Hu Z, Wang Y, Chen Y, Xiao H. Deformation and failure mechanism of rapid stabilization for dredger fill in road engineering. Arab J Geoences. 2020;13(6):1–11.10.1007/s12517-020-5271-6Search in Google Scholar
[55] Leng J, Gabr MA. Deformation-resistance model for geogrid-reinforced unpaved road. Transportation Res Rec. 1975;2006:146–54.10.1177/0361198106197500116Search in Google Scholar
[56] Wang X, Wan G. China’s urban employment and urbanization rate: a re-estimation[in Chinese with English abstract]. China & World Economy. 2014;1:30–44.10.1111/j.1749-124X.2014.12051.xSearch in Google Scholar
[57] He Y, Dou P, Yan H, Zhang L, Yang S. Quantifying the main urban area expansion of Guangzhou using Landsat imagery. Int J Remote Sens. 2018;39(21):7693–717.10.1080/01431161.2018.1478465Search in Google Scholar
[58] Lanzhou Municipal Bureau of Statistics. Lanzhou statistical yearbook. Beijing: China Statistics Press; 2014.Search in Google Scholar
[59] Lanzhou Municipal Bureau of Statistics. Lanzhou statistical yearbook. Beijing: China Statistics Press; 2017.Search in Google Scholar
[60] Li G, Zhang R, Liu G, Yu B, Zhang B. Land subsidence detection and analysis over Beijing-Tianjin-Hebei area based on Sentinel-1A TS-DInSAR[in Chinese with English abstract]. J Remote Sens. 2018;22(4):633–46.Search in Google Scholar
[61] Zhou C, Gong H, Chen B, Li J, Gao M, Zhu F, et al. InSAR time-series analysis of land subsidence under different land use types in the Eastern Beijing Plain, China. Remote Sens. 2017;9(4):380.10.3390/rs9040380Search in Google Scholar
[62] Yang Y, Wang C, Hong W, Fuhrmann T, Chen Y, Wei S. Surface deformation from Sentinel-1A InSAR: relation to seasonal groundwater extraction and rainfall in central Taiwan. Remote Sens. 2019;11(23):2817.10.3390/rs11232817Search in Google Scholar
[63] Song T, Cheng Y, Liu W, Liu H. The spatial disparity and impact mechanism of geo-economy in the border areas of China[in Chinese with English abstract]. Acta Geographica Sin. 2017;72(10):1731–45.Search in Google Scholar
© 2020 Wenhui Wang et al., published by De Gruyter
This work is licensed under the Creative Commons Attribution 4.0 International License.
Articles in the same Issue
- Regular Articles
- The simulation approach to the interpretation of archival aerial photographs
- The application of137Cs and210Pbexmethods in soil erosion research of Titel loess plateau, Vojvodina, Northern Serbia
- Provenance and tectonic significance of the Zhongwunongshan Group from the Zhongwunongshan Structural Belt in China: insights from zircon geochronology
- Analysis, Assessment and Early Warning of Mudflow Disasters along the Shigatse Section of the China–Nepal Highway
- Sedimentary succession and recognition marks of lacustrine gravel beach-bars, a case study from the Qinghai Lake, China
- Predicting small water courses’ physico-chemical status from watershed characteristics with two multivariate statistical methods
- An Overview of the Carbonatites from the Indian Subcontinent
- A new statistical approach to the geochemical systematics of Italian alkaline igneous rocks
- The significance of karst areas in European national parks and geoparks
- Geochronology, trace elements and Hf isotopic geochemistry of zircons from Swat orthogneisses, Northern Pakistan
- Regional-scale drought monitor using synthesized index based on remote sensing in northeast China
- Application of combined electrical resistivity tomography and seismic reflection method to explore hidden active faults in Pingwu, Sichuan, China
- Impact of interpolation techniques on the accuracy of large-scale digital elevation model
- Natural and human-induced factors controlling the phreatic groundwater geochemistry of the Longgang River basin, South China
- Land use/land cover assessment as related to soil and irrigation water salinity over an oasis in arid environment
- Effect of tillage, slope, and rainfall on soil surface microtopography quantified by geostatistical and fractal indices during sheet erosion
- Validation of the number of tie vectors in post-processing using the method of frequency in a centric cube
- An integrated petrophysical-based wedge modeling and thin bed AVO analysis for improved reservoir characterization of Zhujiang Formation, Huizhou sub-basin, China: A case study
- A grain size auto-classification of Baikouquan Formation, Mahu Depression, Junggar Basin, China
- Dynamics of mid-channel bars in the Middle Vistula River in response to ferry crossing abutment construction
- Estimation of permeability and saturation based on imaginary component of complex resistivity spectra: A laboratory study
- Distribution characteristics of typical geological relics in the Western Sichuan Plateau
- Inconsistency distribution patterns of different remote sensing land-cover data from the perspective of ecological zoning
- A new methodological approach (QEMSCAN®) in the mineralogical study of Polish loess: Guidelines for further research
- Displacement and deformation study of engineering structures with the use of modern laser technologies
- Virtual resolution enhancement: A new enhancement tool for seismic data
- Aeromagnetic mapping of fault architecture along Lagos–Ore axis, southwestern Nigeria
- Deformation and failure mechanism of full seam chamber with extra-large section and its control technology
- Plastic failure zone characteristics and stability control technology of roadway in the fault area under non-uniformly high geostress: A case study from Yuandian Coal Mine in Northern Anhui Province, China
- Comparison of swarm intelligence algorithms for optimized band selection of hyperspectral remote sensing image
- Soil carbon stock and nutrient characteristics of Senna siamea grove in the semi-deciduous forest zone of Ghana
- Carbonatites from the Southern Brazilian platform: I
- Seismicity, focal mechanism, and stress tensor analysis of the Simav region, western Turkey
- Application of simulated annealing algorithm for 3D coordinate transformation problem solution
- Application of the terrestrial laser scanner in the monitoring of earth structures
- The Cretaceous igneous rocks in southeastern Guangxi and their implication for tectonic environment in southwestern South China Block
- Pore-scale gas–water flow in rock: Visualization experiment and simulation
- Assessment of surface parameters of VDW foundation piles using geodetic measurement techniques
- Spatial distribution and risk assessment of toxic metals in agricultural soils from endemic nasopharyngeal carcinoma region in South China
- An ABC-optimized fuzzy ELECTRE approach for assessing petroleum potential at the petroleum system level
- Microscopic mechanism of sandstone hydration in Yungang Grottoes, China
- Importance of traditional landscapes in Slovenia for conservation of endangered butterfly
- Landscape pattern and economic factors’ effect on prediction accuracy of cellular automata-Markov chain model on county scale
- The influence of river training on the location of erosion and accumulation zones (Kłodzko County, South West Poland)
- Multi-temporal survey of diaphragm wall with terrestrial laser scanning method
- Functionality and reliability of horizontal control net (Poland)
- Strata behavior and control strategy of backfilling collaborate with caving fully-mechanized mining
- The use of classical methods and neural networks in deformation studies of hydrotechnical objects
- Ice-crevasse sedimentation in the eastern part of the Głubczyce Plateau (S Poland) during the final stage of the Drenthian Glaciation
- Structure of end moraines and dynamics of the recession phase of the Warta Stadial ice sheet, Kłodawa Upland, Central Poland
- Mineralogy, mineral chemistry and thermobarometry of post-mineralization dykes of the Sungun Cu–Mo porphyry deposit (Northwest Iran)
- Main problems of the research on the Palaeolithic of Halych-Dnister region (Ukraine)
- Application of isometric transformation and robust estimation to compare the measurement results of steel pipe spools
- Hybrid machine learning hydrological model for flood forecast purpose
- Rainfall thresholds of shallow landslides in Wuyuan County of Jiangxi Province, China
- Dynamic simulation for the process of mining subsidence based on cellular automata model
- Developing large-scale international ecological networks based on least-cost path analysis – a case study of Altai mountains
- Seismic characteristics of polygonal fault systems in the Great South Basin, New Zealand
- New approach of clustering of late Pleni-Weichselian loess deposits (L1LL1) in Poland
- Implementation of virtual reference points in registering scanning images of tall structures
- Constraints of nonseismic geophysical data on the deep geological structure of the Benxi iron-ore district, Liaoning, China
- Mechanical analysis of basic roof fracture mechanism and feature in coal mining with partial gangue backfilling
- The violent ground motion before the Jiuzhaigou earthquake Ms7.0
- Landslide site delineation from geometric signatures derived with the Hilbert–Huang transform for cases in Southern Taiwan
- Hydrological process simulation in Manas River Basin using CMADS
- LA-ICP-MS U–Pb ages of detrital zircons from Middle Jurassic sedimentary rocks in southwestern Fujian: Sedimentary provenance and its geological significance
- Analysis of pore throat characteristics of tight sandstone reservoirs
- Effects of igneous intrusions on source rock in the early diagenetic stage: A case study on Beipiao Formation in Jinyang Basin, Northeast China
- Applying floodplain geomorphology to flood management (The Lower Vistula River upstream from Plock, Poland)
- Effect of photogrammetric RPAS flight parameters on plani-altimetric accuracy of DTM
- Morphodynamic conditions of heavy metal concentration in deposits of the Vistula River valley near Kępa Gostecka (central Poland)
- Accuracy and functional assessment of an original low-cost fibre-based inclinometer designed for structural monitoring
- The impacts of diagenetic facies on reservoir quality in tight sandstones
- Application of electrical resistivity imaging to detection of hidden geological structures in a single roadway
- Comparison between electrical resistivity tomography and tunnel seismic prediction 303 methods for detecting the water zone ahead of the tunnel face: A case study
- The genesis model of carbonate cementation in the tight oil reservoir: A case of Chang 6 oil layers of the Upper Triassic Yanchang Formation in the western Jiyuan area, Ordos Basin, China
- Disintegration characteristics in granite residual soil and their relationship with the collapsing gully in South China
- Analysis of surface deformation and driving forces in Lanzhou
- Geochemical characteristics of produced water from coalbed methane wells and its influence on productivity in Laochang Coalfield, China
- A combination of genetic inversion and seismic frequency attributes to delineate reservoir targets in offshore northern Orange Basin, South Africa
- Explore the application of high-resolution nighttime light remote sensing images in nighttime marine ship detection: A case study of LJ1-01 data
- DTM-based analysis of the spatial distribution of topolineaments
- Spatiotemporal variation and climatic response of water level of major lakes in China, Mongolia, and Russia
- The Cretaceous stratigraphy, Songliao Basin, Northeast China: Constrains from drillings and geophysics
- Canal of St. Bartholomew in Seča/Sezza: Social construction of the seascape
- A modelling resin material and its application in rock-failure study: Samples with two 3D internal fracture surfaces
- Utilization of marble piece wastes as base materials
- Slope stability evaluation using backpropagation neural networks and multivariate adaptive regression splines
- Rigidity of “Warsaw clay” from the Poznań Formation determined by in situ tests
- Numerical simulation for the effects of waves and grain size on deltaic processes and morphologies
- Impact of tourism activities on water pollution in the West Lake Basin (Hangzhou, China)
- Fracture characteristics from outcrops and its meaning to gas accumulation in the Jiyuan Basin, Henan Province, China
- Impact evaluation and driving type identification of human factors on rural human settlement environment: Taking Gansu Province, China as an example
- Identification of the spatial distributions, pollution levels, sources, and health risk of heavy metals in surface dusts from Korla, NW China
- Petrography and geochemistry of clastic sedimentary rocks as evidence for the provenance of the Jurassic stratum in the Daqingshan area
- Super-resolution reconstruction of a digital elevation model based on a deep residual network
- Seismic prediction of lithofacies heterogeneity in paleogene hetaoyuan shale play, Biyang depression, China
- Cultural landscape of the Gorica Hills in the nineteenth century: Franciscean land cadastre reports as the source for clarification of the classification of cultivable land types
- Analysis and prediction of LUCC change in Huang-Huai-Hai river basin
- Hydrochemical differences between river water and groundwater in Suzhou, Northern Anhui Province, China
- The relationship between heat flow and seismicity in global tectonically active zones
- Modeling of Landslide susceptibility in a part of Abay Basin, northwestern Ethiopia
- M-GAM method in function of tourism potential assessment: Case study of the Sokobanja basin in eastern Serbia
- Dehydration and stabilization of unconsolidated laminated lake sediments using gypsum for the preparation of thin sections
- Agriculture and land use in the North of Russia: Case study of Karelia and Yakutia
- Textural characteristics, mode of transportation and depositional environment of the Cretaceous sandstone in the Bredasdorp Basin, off the south coast of South Africa: Evidence from grain size analysis
- One-dimensional constrained inversion study of TEM and application in coal goafs’ detection
- The spatial distribution of retail outlets in Urumqi: The application of points of interest
- Aptian–Albian deposits of the Ait Ourir basin (High Atlas, Morocco): New additional data on their paleoenvironment, sedimentology, and palaeogeography
- Traditional agricultural landscapes in Uskopaljska valley (Bosnia and Herzegovina)
- A detection method for reservoir waterbodies vector data based on EGADS
- Modelling and mapping of the COVID-19 trajectory and pandemic paths at global scale: A geographer’s perspective
- Effect of organic maturity on shale gas genesis and pores development: A case study on marine shale in the upper Yangtze region, South China
- Gravel roundness quantitative analysis for sedimentary microfacies of fan delta deposition, Baikouquan Formation, Mahu Depression, Northwestern China
- Features of terraces and the incision rate along the lower reaches of the Yarlung Zangbo River east of Namche Barwa: Constraints on tectonic uplift
- Application of laser scanning technology for structure gauge measurement
- Calibration of the depth invariant algorithm to monitor the tidal action of Rabigh City at the Red Sea Coast, Saudi Arabia
- Evolution of the Bystrzyca River valley during Middle Pleistocene Interglacial (Sudetic Foreland, south-western Poland)
- A 3D numerical analysis of the compaction effects on the behavior of panel-type MSE walls
- Landscape dynamics at borderlands: analysing land use changes from Southern Slovenia
- Effects of oil viscosity on waterflooding: A case study of high water-cut sandstone oilfield in Kazakhstan
- Special Issue: Alkaline-Carbonatitic magmatism
- Carbonatites from the southern Brazilian Platform: A review. II: Isotopic evidences
- Review Article
- Technology and innovation: Changing concept of rural tourism – A systematic review