Displacement and deformation study of engineering structures with the use of modern laser technologies
-
Jacek Sztubecki
 ,
Adam Bujarkiewicz
,
Adam Bujarkiewicz

Abstract
Modern measuring technologies give the means to perform tasks previously impossible with conventional methods. Their main advantages include reduced time consumption and higher measurement precision. Contemporary displacement and deformation studies of engineering structures often involve application of laser technologies, which are characterised by high precision of measurements. This article presents an analysis of results obtained from measurements of changes in the geometry of an engineering structure in which two complementary measuring technologies were used, i.e. tachymetric measurement with a Leica TDRA6000 laser station and laser scanning with a 3D FARO Focus S150 scanner. The utilised laser station enabled determination of 3D displacements in the local control point network installed on the studied structure as well as transfer of point clouds obtained from laser scans into a uniform coordinate system. The hybrid technology employed and the measurement method used ensured that the accuracy of the determined displacements and deformations of the structural components of the structure was high. The described measurement and result processing technology makes it possible to comprehensively analyse the geometric performance of structures, which consequently leads to the development of more complete conclusions concerning prevention of adverse effects of displacements and deformations in engineering structures.
1 Introduction
To evaluate positional changes in engineering structures or their parts over time, measurements using geodetic methods are usually performed as basic measurements. Geodetic monitoring is implemented by performing a series of measurements of a control point network installed on the structure [1,2] or by measuring the characteristic points of the structure that reflect its current geometric state in relation to the nominal state [3,4]. Displacement and deformation studies involve measurements and subsequent analysis leading to the formulation of conclusions regarding the dynamics of the incidence of positional and geometric changes in the structure. A major factor that gives rise to such phenomena is displacement in the structure foundation caused by uneven ground subsidence. Vertical displacements are studied by means of precision geometric levelling. This approach is often sufficient but in some cases the scope of the study has to be extended. Development of measuring technology broadens the spectrum of available possibilities [5,6]. Tachymetric technologies currently used in metrological industrial measurements are characterised by high precision of distance and direction measurements. It is necessary that specific measuring conditions are observed, as it allows the obtained results of 3D reference network displacement measurements to have accuracy similar to the results obtained by means of precision levelling. Not only does the implementation of the aforesaid technology facilitate the determination of 3D displacements in the local control point network installed on the structure but it also facilitates the preparation of a base of reference points for other measuring methods, e.g. for laser scanning or photogrammetric measurements [7,8].
Combining these technologies with classic high-precision measurements allows us to capture a broader spectrum of features of the tested objects. Such solutions are successfully used in inventory measurements and monitoring of both small [9] and larger facilities [10,11] or large areas exposed to various types of risks [12,13].
The article presents a technology for determination of deformations in built structures with the use of modern laser technologies. Two measuring devices were used for the measurements – a coordinate laser station Leica TDRA6000 and a 3D scanner manufactured by FARO. The study results have been presented as a coloured map of structural deformations.
2 Study methodology
2.1 Object of study
The study was conducted on an overground skyway, located on the premises of UTP University of Science and Technology campus in Bydgoszcz, which was constructed in 2001 and has since been serving as an overground footbridge connecting university buildings. After 18 years in service, scratches and cracks on walls and the floor of this structure have been noted. They evidence the presence of structural deformations. The location and shape of the structure are shown in Figure 1.
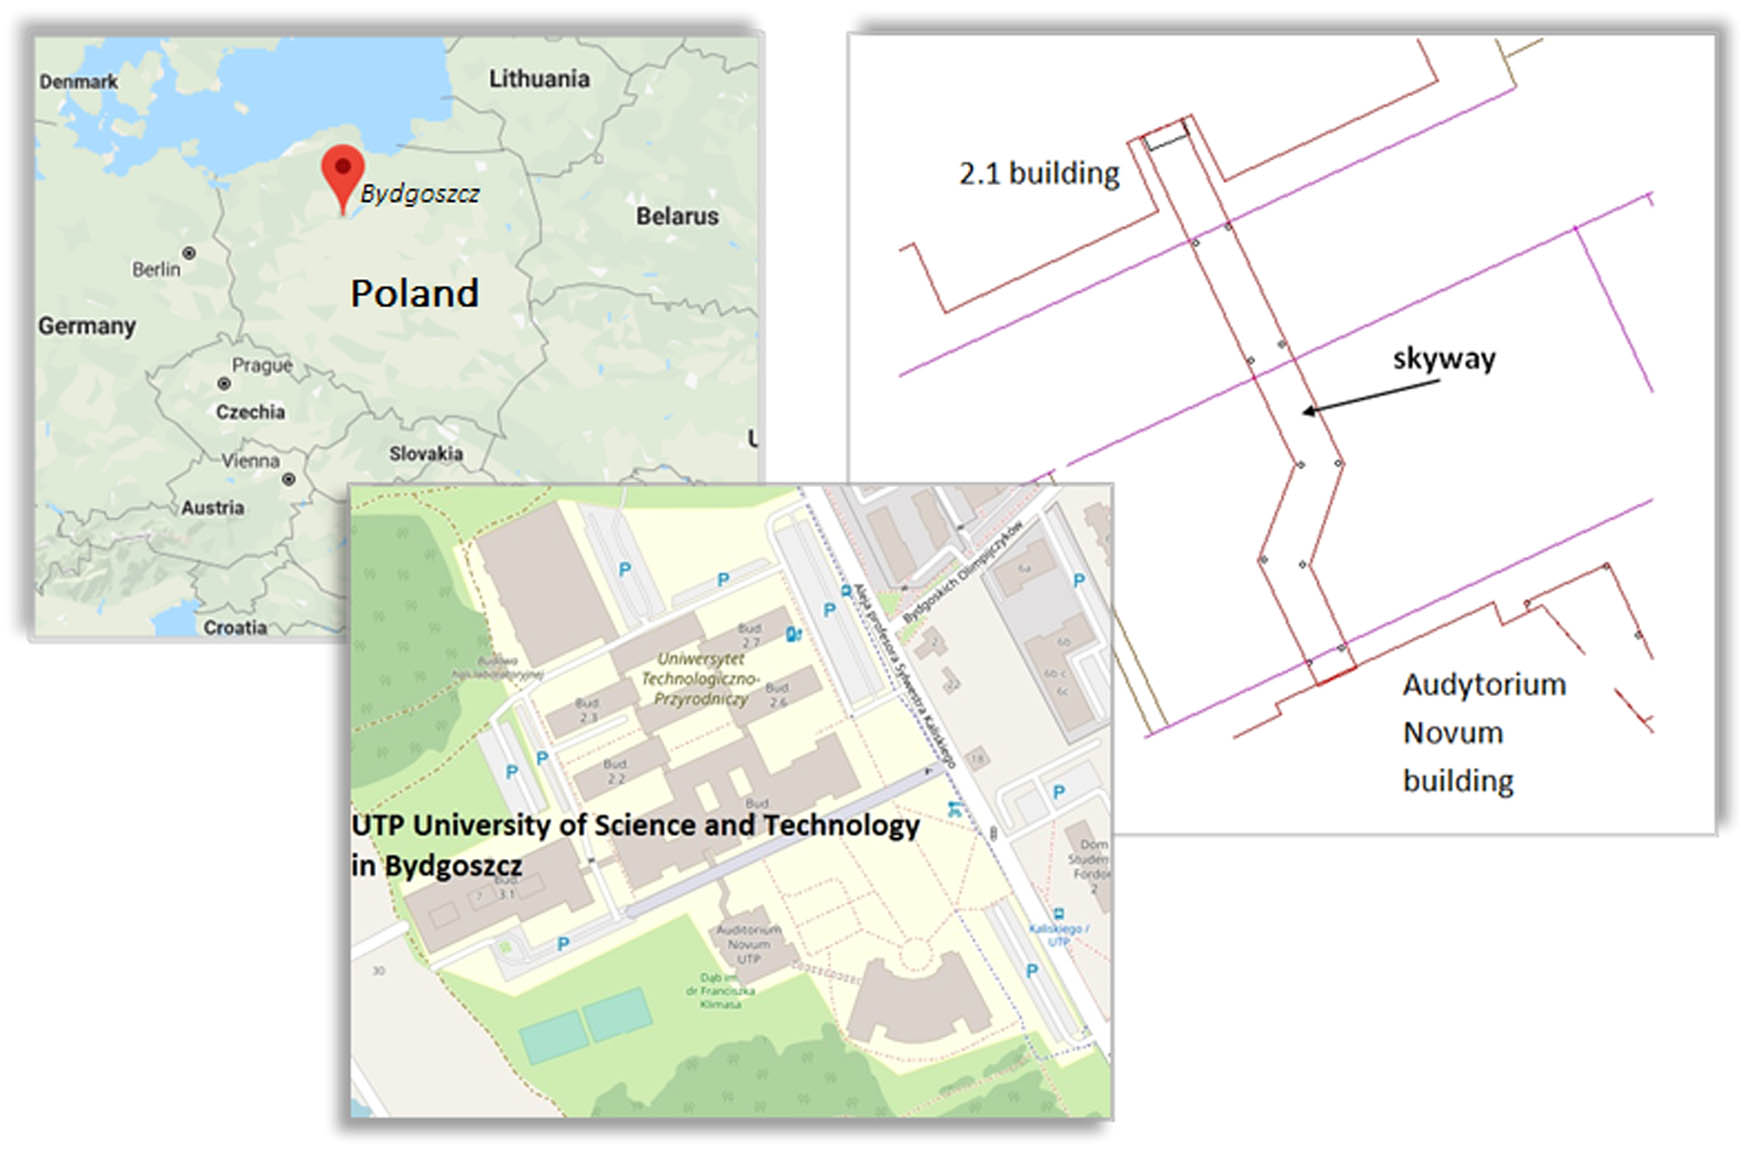
Layout showing the positions of the skyway and adjacent buildings.
The skyway has been designed as a reinforced concrete frame structure supported by 12 columns. It runs at a height of approx. 4 m above the ground level and its total length is 47.5 m. A view of the skyway from its western side is shown in Photo 1.
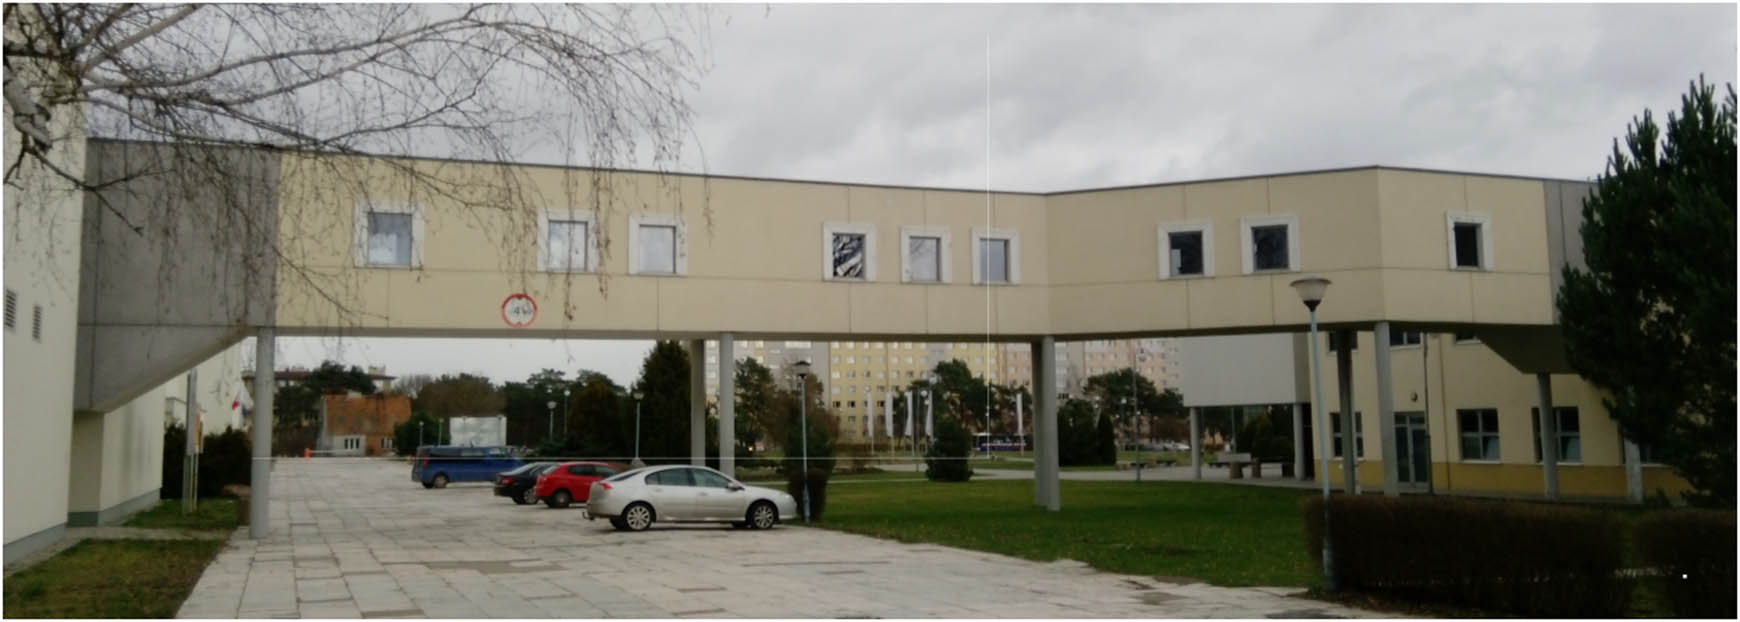
A view of the skyway from its western side.
2.2 Study methods
The primary objective of the study was to ascertain the cause of scratches on walls and the floor inside the skyway. The conduct of the study necessitated the employment of a few complementary measuring methods and a subsequent analysis and evaluation of the results obtained.
In the initial stage of the study, the scratches were assumed to have been caused by settlement of the columns supporting the structure which in turn had occurred due to the presence of expansive clay in the studied area. Hence, a set of control marks was permanently affixed to the columns and monitored for vertical displacements. A view of the marks is shown in Photo 2.
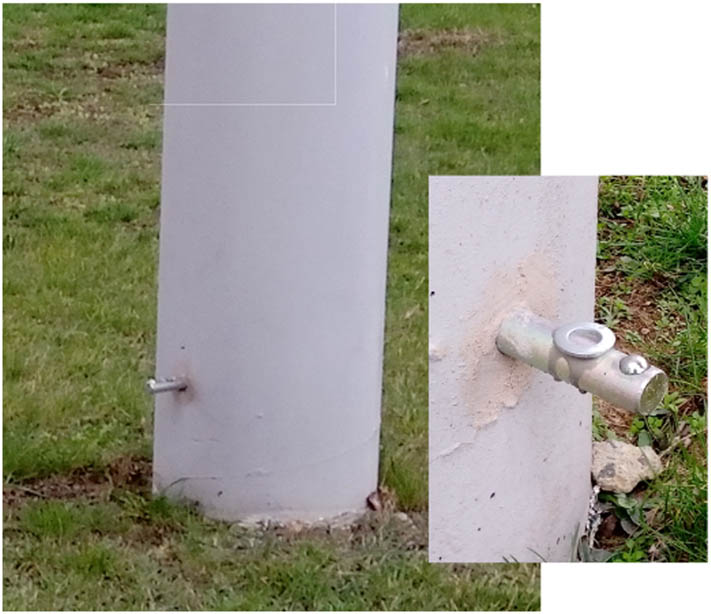
Stabilisation of outdoor marks.
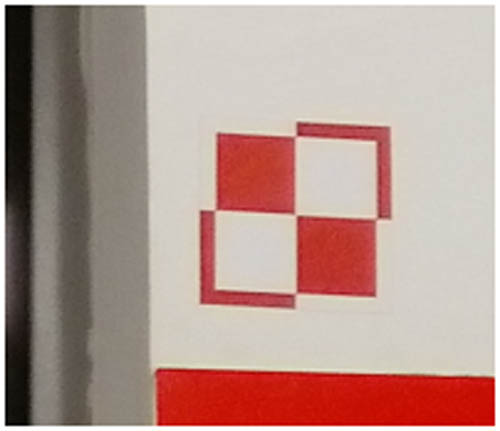
To reveal the causes of structural damage, a set of control points and reference points was also installed inside the structure. The points in the form of steel washers were permanently affixed to the floor (Photo 3) and arranged inside the skyway (points 1 through 12) directly above the columns and in adjacent buildings (reference points P1–P6). The network of these points is shown in Figure 2.
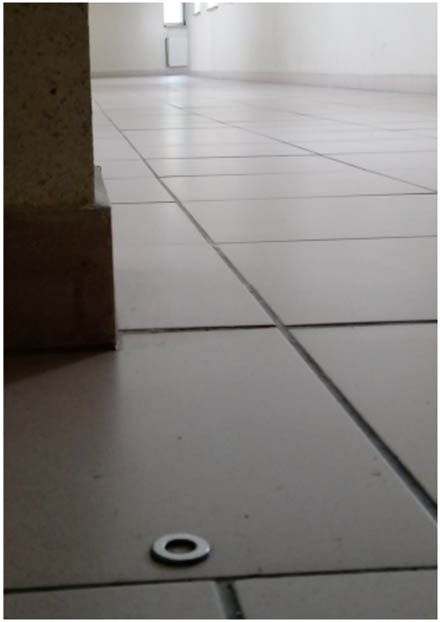
The method for stabilisation of control points inside the skyway.
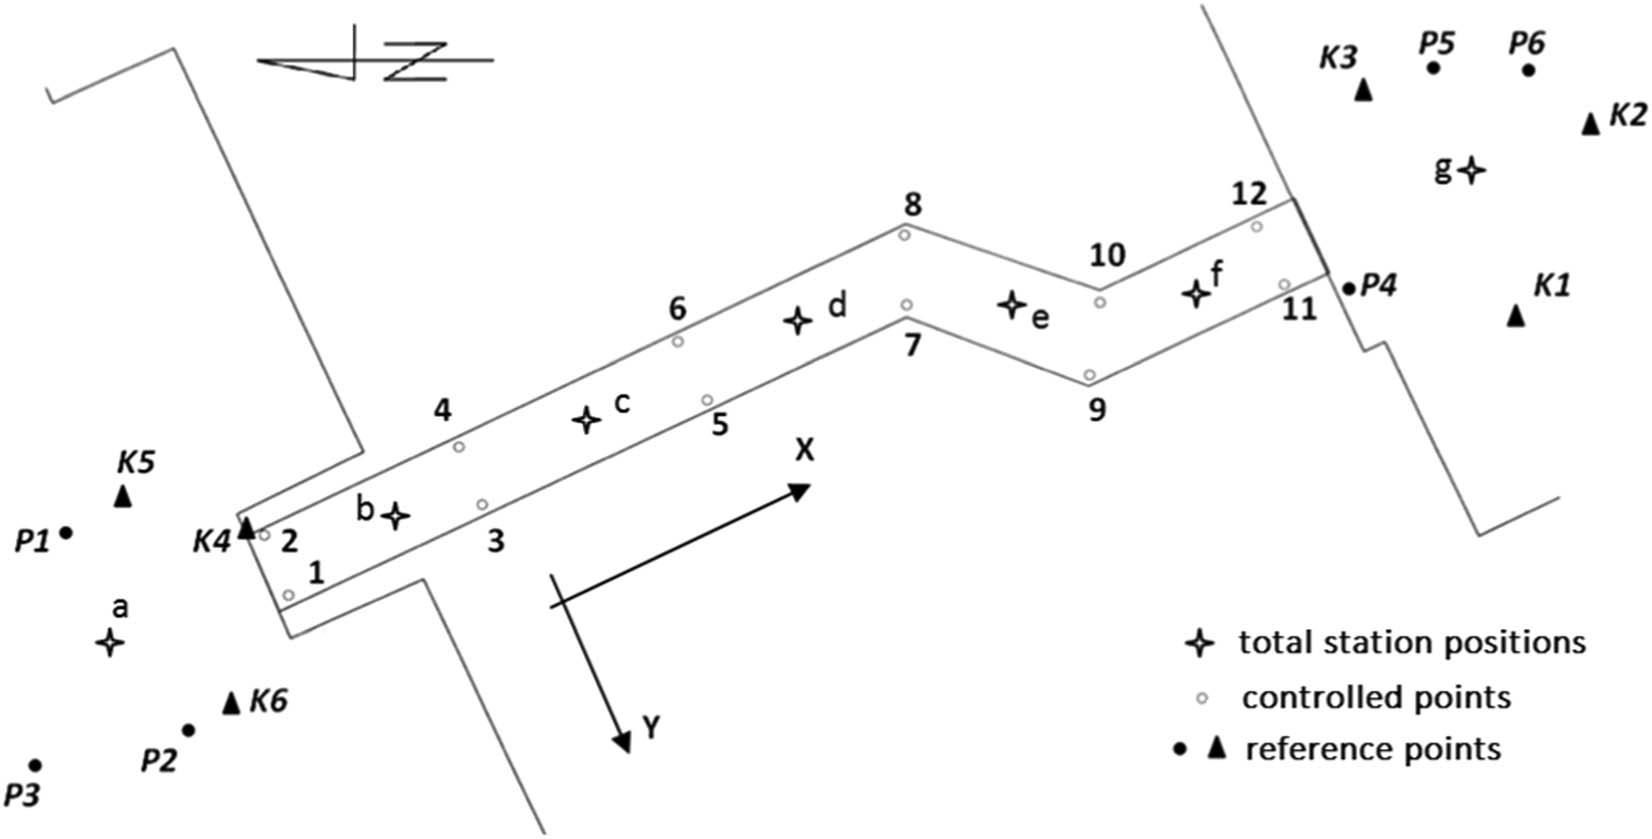
Layout showing the arrangement of control and reference points inside the skyway and in adjacent buildings.
Displacements of control points located on the structure were surveyed over a period of 1 year, in different seasons and at varying temperatures.
Measurements of the outdoor network were performed by means of precision levelling with a Ni007 level. The network of points inside the skyway was measured with a coordinate laser station TDRA6000 manufactured by Leica. The laser station allows observation of the 3D points with a maximum error of ±0.25 mm [14]. Coordinate laser station TDRA6000 is an example of an improved accuracy distance measuring tool. The main features of TDRA6000 include [15]:
certificate-confirmed distance measurement with a standard error of ±0.1 mm,
certificate-confirmed measurement of vertical and horizontal angles with a standard error of ±1.3 c (0.42″),
tracking mode using automatic target recognition and reflector tracking and
recording of measured data with a frequency of 5 Hz.
Measurements of the network with the laser station involved recording 3D coordinates of control points on each of seven free stands. Only the nearest control points were observed from each stand. Measurements at each stand were carried out twice and calculations and processing of the data collected were performed in two stages. In the first stage, differences in elevation between points were calculated and then the network was subjected to rigorous adjustment. The second stage involved determination of horizontal displacements of the installed network. It was conducted by applying isometric transformations integrating free stands and Helmert transformations on six adjustment points (P1–P6), the purpose of which was to present control point coordinates from individual measurement series in a uniform coordinate system. Horizontal displacements of the points were determined by calculating differences in X and Y coordinates between consecutive measurement series [16].
There were a total of five series of measurements performed for both networks. Dates of the measurements conducted and temperatures during the measurements are shown in Table 1.
Basic details of measurement sessions
| Measurement date | Temperature (deg. C) | |
|---|---|---|
| Measurement 0 | 21.07.2017 | 23 |
| Measurement 1 | 04.09.2017 | 14 |
| Measurement 2 | 10.11.2017 | 6 |
| Measurement 3 | 10.03.2018 | 3 |
| Measurement 4 | 22.08.2018 | 27 |
The two final measurement series, i.e. those on 10.03.2018 and 22.08.2018, also included measurements carried out by means of laser scanning with a 3D Focus scanner manufactured by Faro. These were carried out on nine stands. At the first and the last stand, the scanner recorded the position of six adjustment points (K1–K6) whose spatial coordinates had been determined in the course of measurements with the TDRA6000 laser station (Photo 4). With adjustment point coordinates as a basis, the integrated point cloud was transformed into a uniform system established from laser station measurements.
Adjustment points used in the laser scanning method.
3 Results
All deformations were determined in reference to measurement 0. The results achieved after making calculations included:
vertical displacements of the benchmark network outside the skyway,
vertical displacements of the network of control points arranged inside the skyway,
horizontal displacements of the network of control points arranged inside the skyway and
deformations of internal skyway walls.
Vertical displacements of the outdoor and indoor network are detailed in Tables 2 and 3.
Vertical displacements of outdoor network marks
| Mark | Meas. 0–Meas. 1 | Meas. 0–Meas. 2 | Meas. 0–Meas. 3 | Meas. 0–Meas. 4 | ||||
|---|---|---|---|---|---|---|---|---|
| dZ (mm) | mdZ (mm) | dZ (mm) | mdZ (mm) | dZ (mm) | mdZ (mm) | dZ (mm) | mdZ (mm) | |
| 1 | −0.33 | 0.03 | −0.50 | 0.04 | −0.05 | 0.09 | −0.36 | 0.03 |
| 3 | −0.30 | 0.02 | −0.36 | 0.03 | −0.21 | 0.06 | 0.05 | 0.02 |
| 4 | −0.25 | 0.03 | −0.42 | 0.04 | −0.25 | 0.08 | 0.03 | 0.03 |
| 5 | −0.64 | 0.03 | −0.46 | 0.04 | −0.32 | 0.08 | −0.45 | 0.03 |
| 6 | −0.56 | 0.03 | −0.35 | 0.05 | −0.27 | 0.10 | −0.41 | 0.03 |
| 7 | −0.35 | 0.04 | 0.12 | 0.05 | 0.81 | 0.11 | 0.29 | 0.04 |
| 8 | −0.24 | 0.04 | 0.31 | 0.05 | 1.13 | 0.11 | 0.34 | 0.04 |
| 9 | 0.12 | 0.03 | 0.71 | 0.04 | 0.99 | 0.10 | 0.93 | 0.03 |
| 10 | 0.13 | 0.02 | 0.74 | 0.03 | 1.08 | 0.07 | 0.88 | 0.02 |
| 11 | 0.06 | 0.03 | 0.36 | 0.04 | 0.45 | 0.08 | −0.23 | 0.03 |
| 12 | −0.08 | 0.03 | 0.18 | 0.04 | 0.26 | 0.09 | −0.23 | 0.03 |
Vertical displacements of indoor points
| Point no. | Meas. 0–Meas. 1 | Meas. 0–Meas. 2 | Meas. 0–Meas. 3 | Meas. 0–Meas. 4 | ||||
|---|---|---|---|---|---|---|---|---|
| dZ (mm) | mdZ (mm) | dZ (mm) | mdZ (mm) | dZ (mm) | mdZ (mm) | dZ (mm) | mdZ (mm) | |
| 1 | 0.15 | 0.07 | −0.19 | 0.06 | −0.58 | 0.07 | 0.18 | 0.08 |
| 2 | 0.08 | 0.07 | −0.17 | 0.06 | −0.43 | 0.07 | 0.18 | 0.08 |
| 3 | −0.05 | 0.07 | −0.99 | 0.07 | −1.83 | 0.07 | 0.62 | 0.08 |
| 4 | −0.09 | 0.07 | −1.13 | 0.07 | −1.76 | 0.07 | 0.51 | 0.08 |
| 5 | −0.13 | 0.08 | −1.21 | 0.07 | −1.89 | 0.08 | 0.56 | 0.08 |
| 6 | −0.22 | 0.08 | −1.23 | 0.07 | −1.89 | 0.08 | 0.37 | 0.08 |
| 7 | −0.01 | 0.08 | −0.69 | 0.07 | −0.90 | 0.08 | 1.24 | 0.08 |
| 8 | 0.17 | 0.08 | −0.50 | 0.07 | −0.55 | 0.08 | 1.16 | 0.08 |
| 9 | −0.07 | 0.07 | −0.67 | 0.07 | −0.85 | 0.07 | 1.39 | 0.08 |
| 10 | 0.06 | 0.07 | −0.49 | 0.07 | −0.66 | 0.07 | 1.33 | 0.08 |
| 11 | 0.03 | 0.07 | −0.36 | 0.06 | −0.66 | 0.07 | 0.37 | 0.08 |
| 12 | −0.18 | 0.07 | −0.59 | 0.06 | −0.94 | 0.07 | 0.13 | 0.08 |
The results of the measurements performed with the Ni007 level show vertical displacements of marks within the range of −0.64 to 1.13 mm. The maximum mean error of displacement determination mdZ(max) is equal to 0.11 mm, which indicates that the results are reliable. As it transpires from the data presented in Table 2, the maximum displacement occurred in mark no. 8 between the first and third series, with a value of 1.37 mm. Nevertheless, the values of the displacements determined are so small that they could not have had any significant effect on the structural performance and creation of any scratches and cracks. Such behaviour of the foundation might have been caused by changes in soil and humidity conditions occurring in the course of the year-round monitoring.
Measurements of the indoor point network with the use of the TDRA6000 laser station have shown that vertical displacement values for these points in reference to the initial measurement fall within the range of −1.89 to +1.39 mm. The values of mean errors of the determined displacements indicate that they are reliable and support the correctness of the measuring method applied. The maximum displacement was noted for point no. 5 between the third and fourth series; it was equal to 2.45 mm.
Differences between displacement values for benchmarks fixed to column bases (Table 2) and displacements in points located at the intersection of the skyway floor and extended column axes (Table 3) may be caused by changes in column lengths under the influence of ambient temperature variations. The maximum difference between atmospheric temperatures recorded during the measurements was noted for the third and fourth measurement sessions; it was equal to 24°C. The effect of temperature on structural displacements may be tracked on diagrams in Figure 3. Part C of Figure 3, provided to show the difference between displacements in column bases and tops, presents the structural displacements stripped of the impact of soil and humidity conditions. For most columns (numbered 3 to 12), differences between extreme displacement values are similar; they are equal to 2.21 mm on average. Columns 1 and 2 are less susceptible to displacements caused by temperature as they are half as long as the other columns.
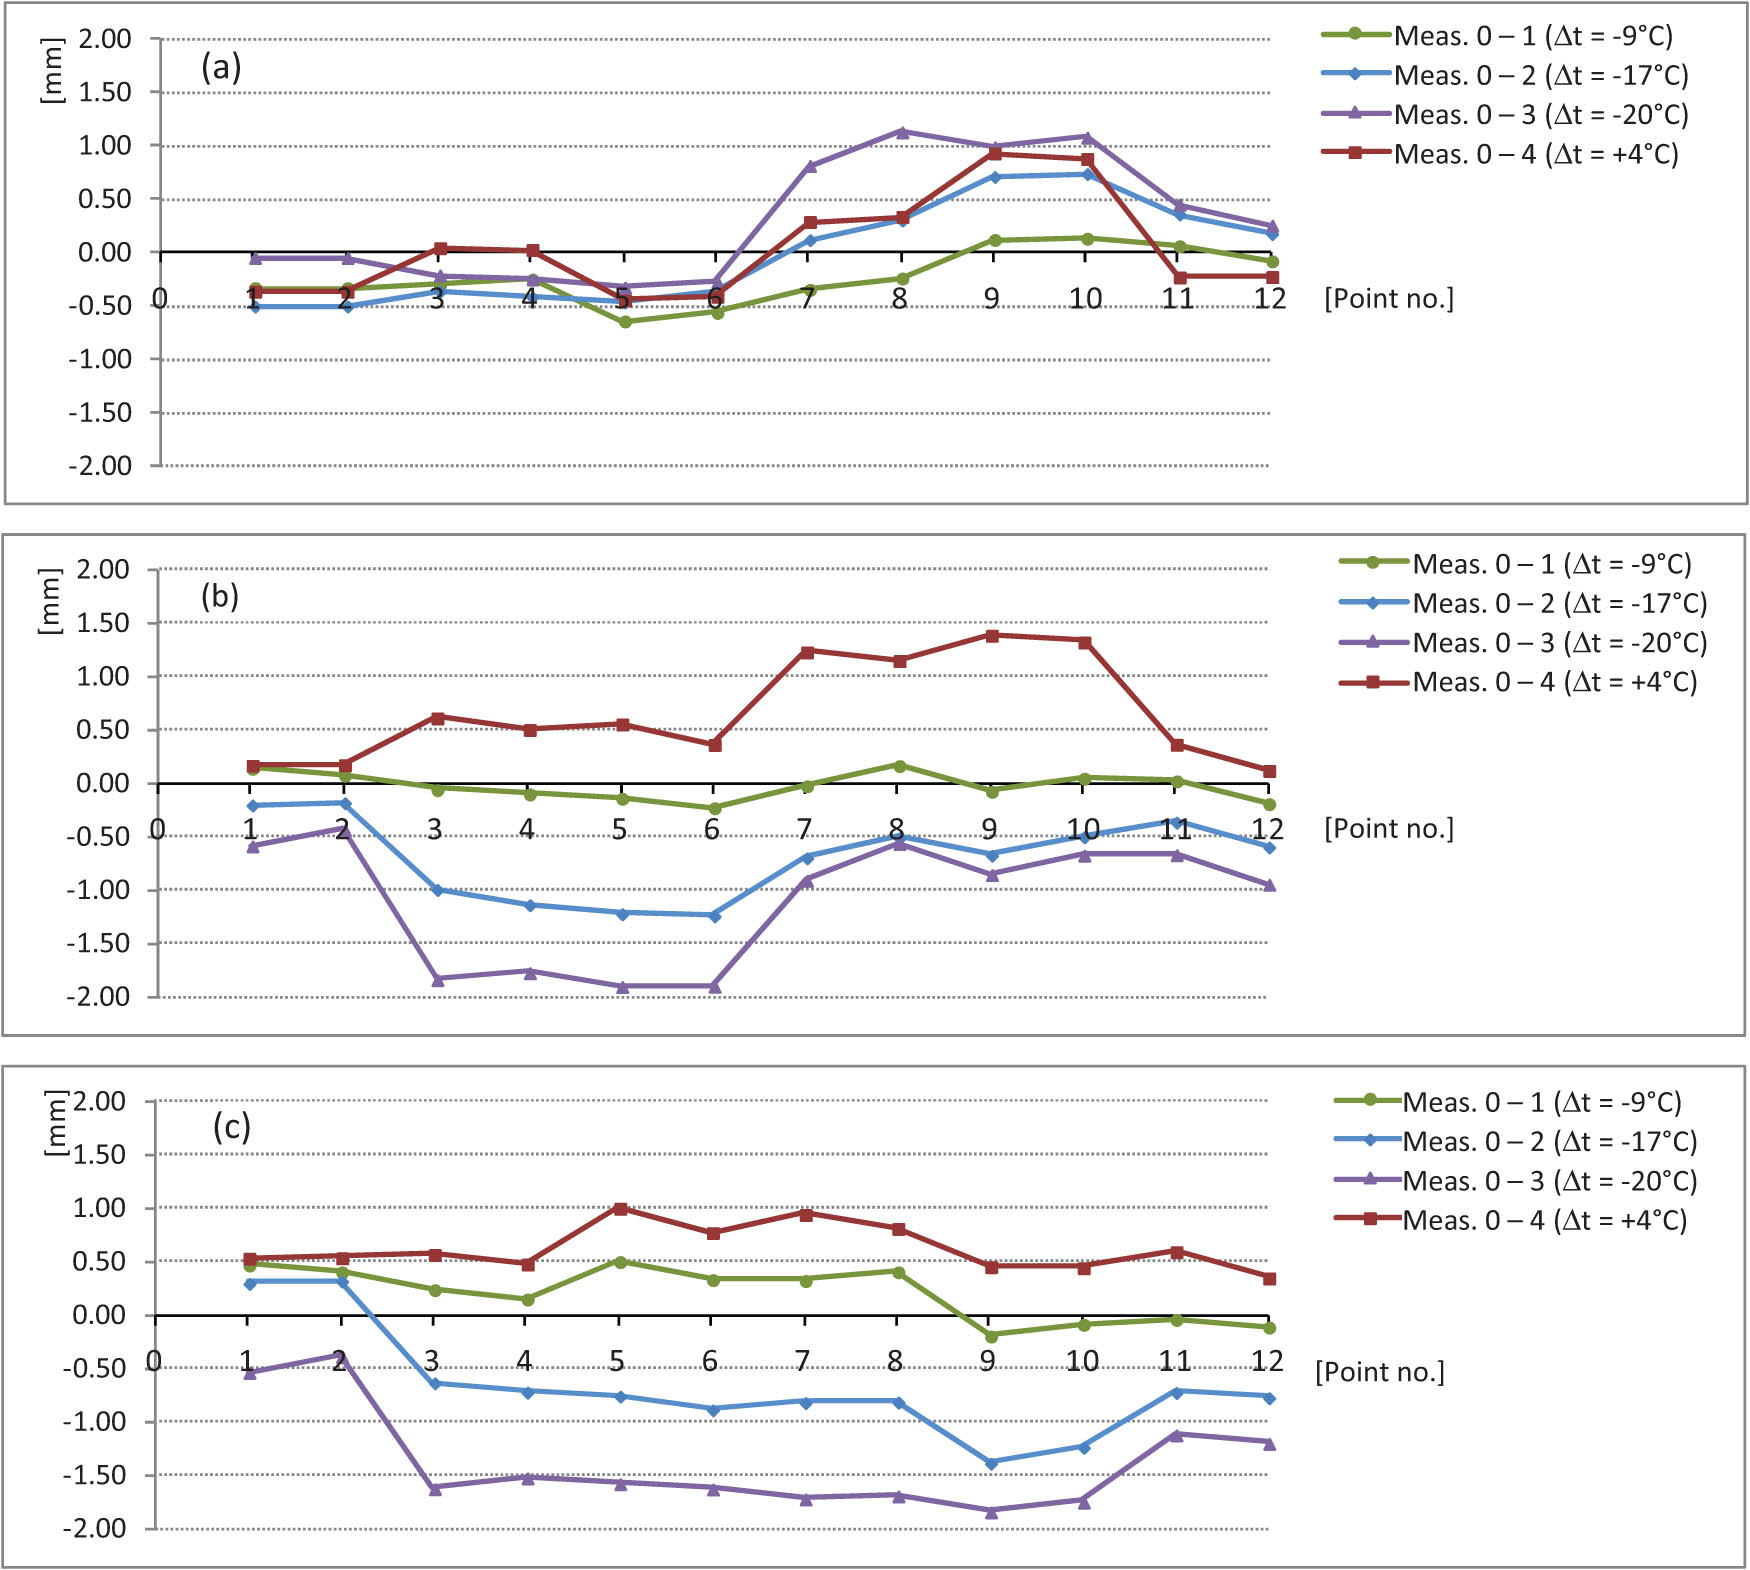
Diagrams of vertical displacements in the surveyed network points for all measurements. (a) Column bases, (b) column tops (intersection of skyway floor and extended column axes), (c) difference between column tops and bases.
Horizontal displacements of control points arranged on the floor inside the skyway are detailed in Table 4 and shown in the form of diagrams in Figures 4 and 5. The errors for Helmert transformation used to determine these displacements are specified in Table 5.
Specification of horizontal displacements of the indoor network
| Point no. | Meas. 0–Meas. 1 | Meas. 0–Meas. 2 | Meas. 0–Meas. 3 | Meas. 0–Meas. 4 | ||||
|---|---|---|---|---|---|---|---|---|
| dX (mm) | dY (mm) | dX (mm) | dY (mm) | dX (mm) | dY (mm) | dX (mm) | dY (mm) | |
| 1 | 0.45 | 0.94 | 0.50 | 0.30 | 0.97 | −0.07 | −0.29 | −0.50 |
| 2 | 0.44 | 0.86 | 0.72 | 0.06 | 1.17 | −0.40 | −0.23 | −0.41 |
| 3 | 0.17 | 1.18 | 0.14 | −0.41 | 0.23 | −0.83 | 0.04 | −0.72 |
| 4 | 0.24 | 1.13 | 0.31 | −0.58 | 0.38 | −1.01 | 0.08 | −0.59 |
| 5 | −0.35 | 0.77 | −0.82 | −0.66 | −1.51 | −1.78 | 0.47 | 0.04 |
| 6 | −0.34 | 0.66 | −0.81 | −0.82 | −1.27 | −1.99 | 0.49 | 0.17 |
| 7 | −0.87 | 0.19 | −1.81 | −1.37 | −2.74 | −2.54 | 0.95 | 0.15 |
| 8 | −0.83 | 0.11 | −1.67 | −1.50 | −2.64 | −2.78 | 1.22 | 0.22 |
| 9 | −1.57 | 0.19 | −2.71 | −1.21 | −3.60 | −1.90 | 0.82 | −0.83 |
| 10 | −1.69 | 0.14 | −2.80 | −1.23 | −3.94 | −1.84 | 1.18 | −0.72 |
| 11 | −1.90 | 0.28 | −3.25 | −0.10 | −4.66 | 0.01 | 1.92 | −0.60 |
| 12 | −2.09 | 0.13 | −3.56 | −0.34 | −5.04 | −0.31 | 1.89 | −0.48 |
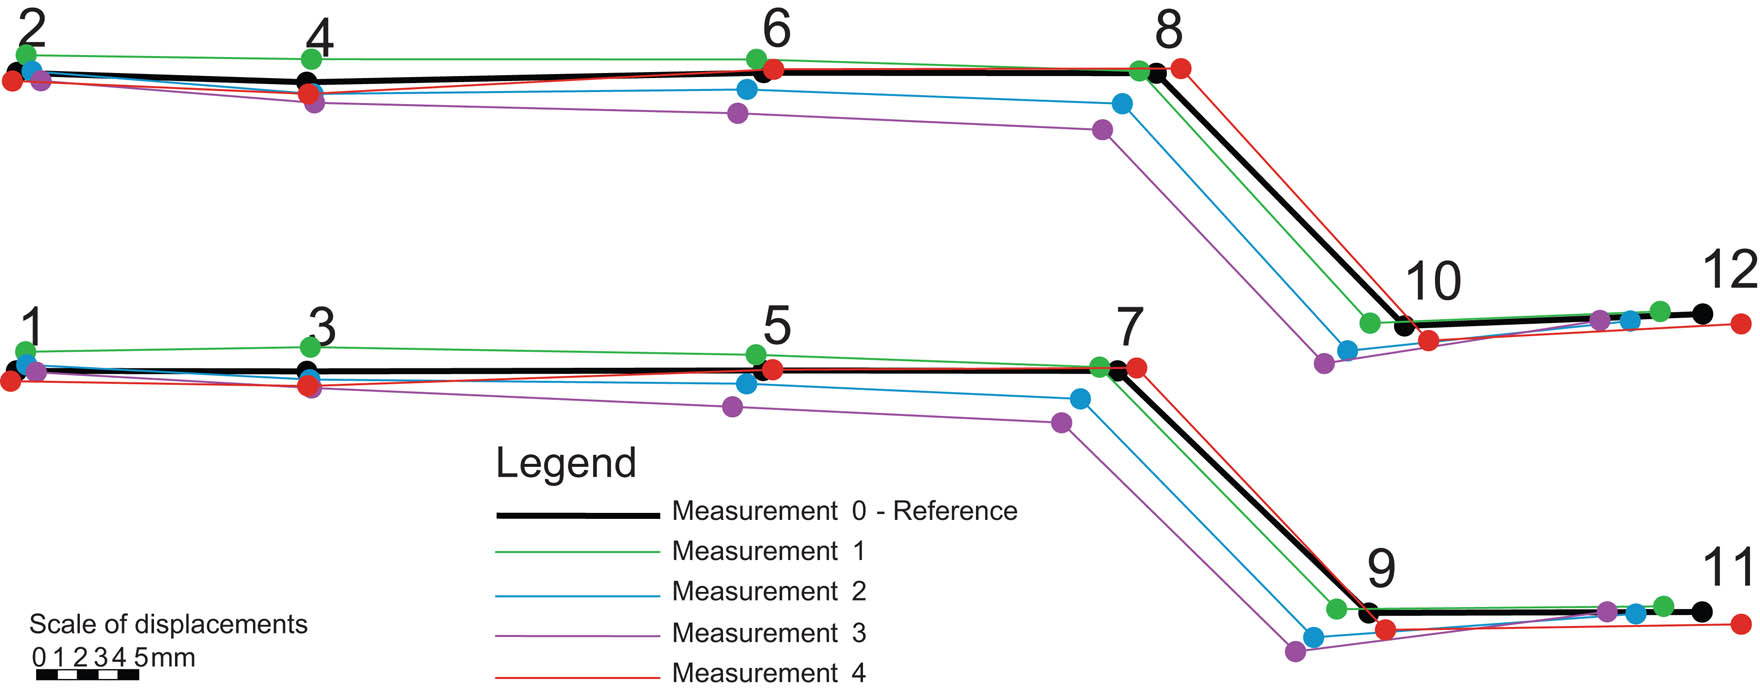
Diagram of horizontal displacements of control points for all measurements.
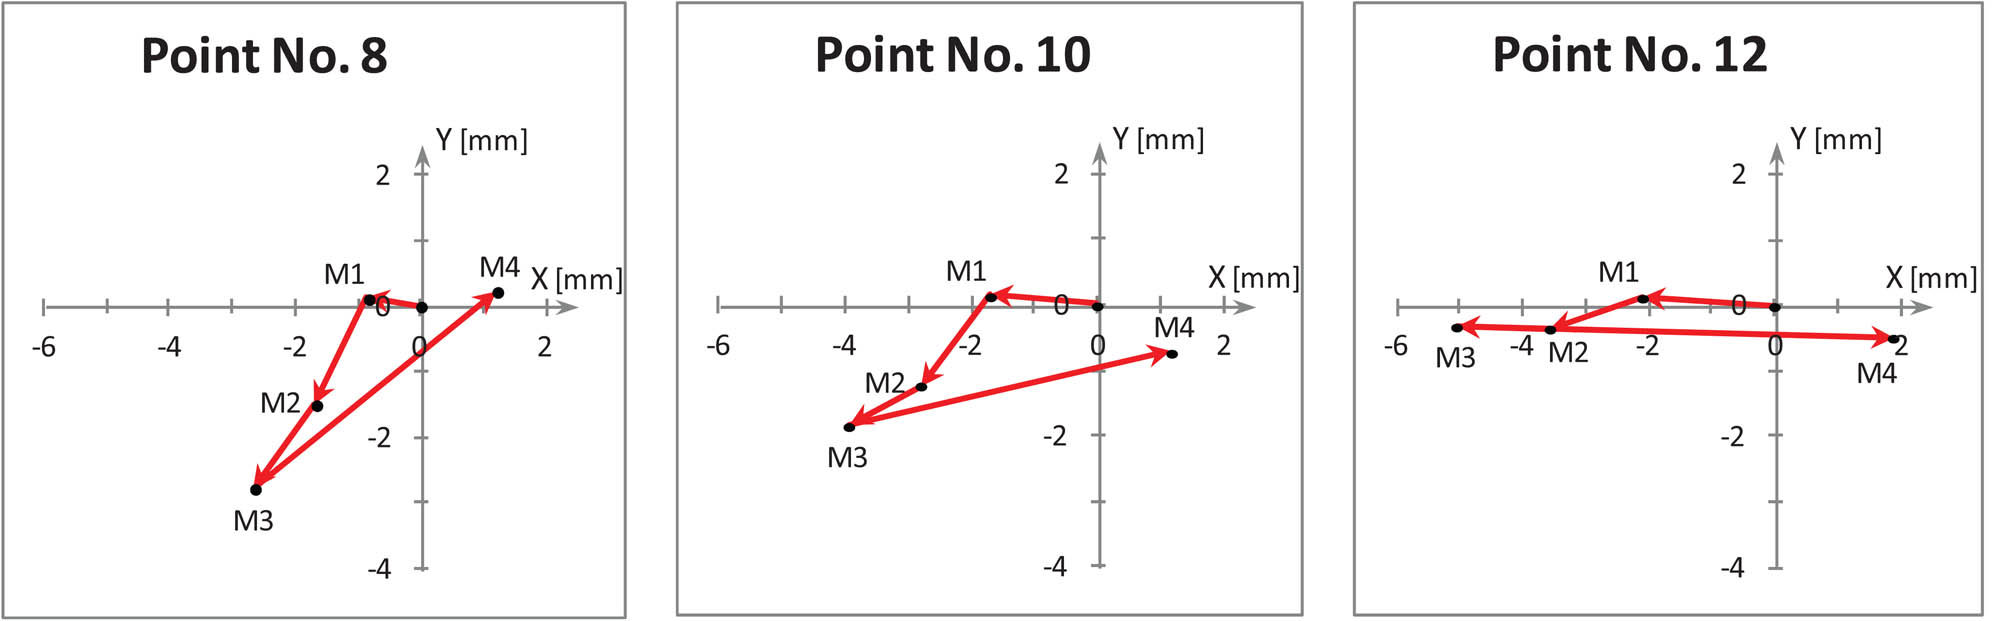
Diagram of recorded horizontal displacements for three selected control points (M1, M2, M3, M4 – consecutive measurements).
Specification of Helmert transformation errors
| mX (mm) | mY (mm) | M (mm) | |
|---|---|---|---|
| Meas. 0–Meas. 1 | 0.34 | 0.36 | 0.49 |
| Meas. 0–Meas. 2 | 0.47 | 0.60 | 0.76 |
| Meas. 0–Meas. 3 | 0.50 | 0.73 | 0.88 |
| Meas. 0–Meas. 4 | 0.54 | 0.61 | 0.81 |
Helmert transformation errors specified in Table 5 indicate that the obtained displacement values are reliable. The maximum horizontal displacements were noted between the third and fourth measurement series, with the displacement along the X-axis for point no. 12 having a value of 6.93 mm and the displacement along the Y-axis for point no. 8 having a value of 3.00 mm. These displacements have arisen from dimensional changes of the structure caused by temperature variation. They may contribute to structure cracking and scratching to a substantial degree.
The results of the noted horizontal displacements of the floor compelled the authors to carry out more thorough measurements intended to determine the nature of deformations in the entire skyway structure. To this end, the course of the third and fourth measurement sessions additionally included measurements with the 3D FARO Focus S150 scanner. Each of these measurements was transformed into a uniform system of coordinates on the basis of six adjustment points whose position was established using the TDRA6000 laser station.
Laser scanning was carried out under radically different temperature conditions (Table 1). An analysis of point clouds obtained from laser scans allowed for the determination of internal structural wall deformations caused by the temperature factor. Exemplary 3D views of the deformations (deviations across the scanned states of the structure) are shown in Figures 6 and 7.
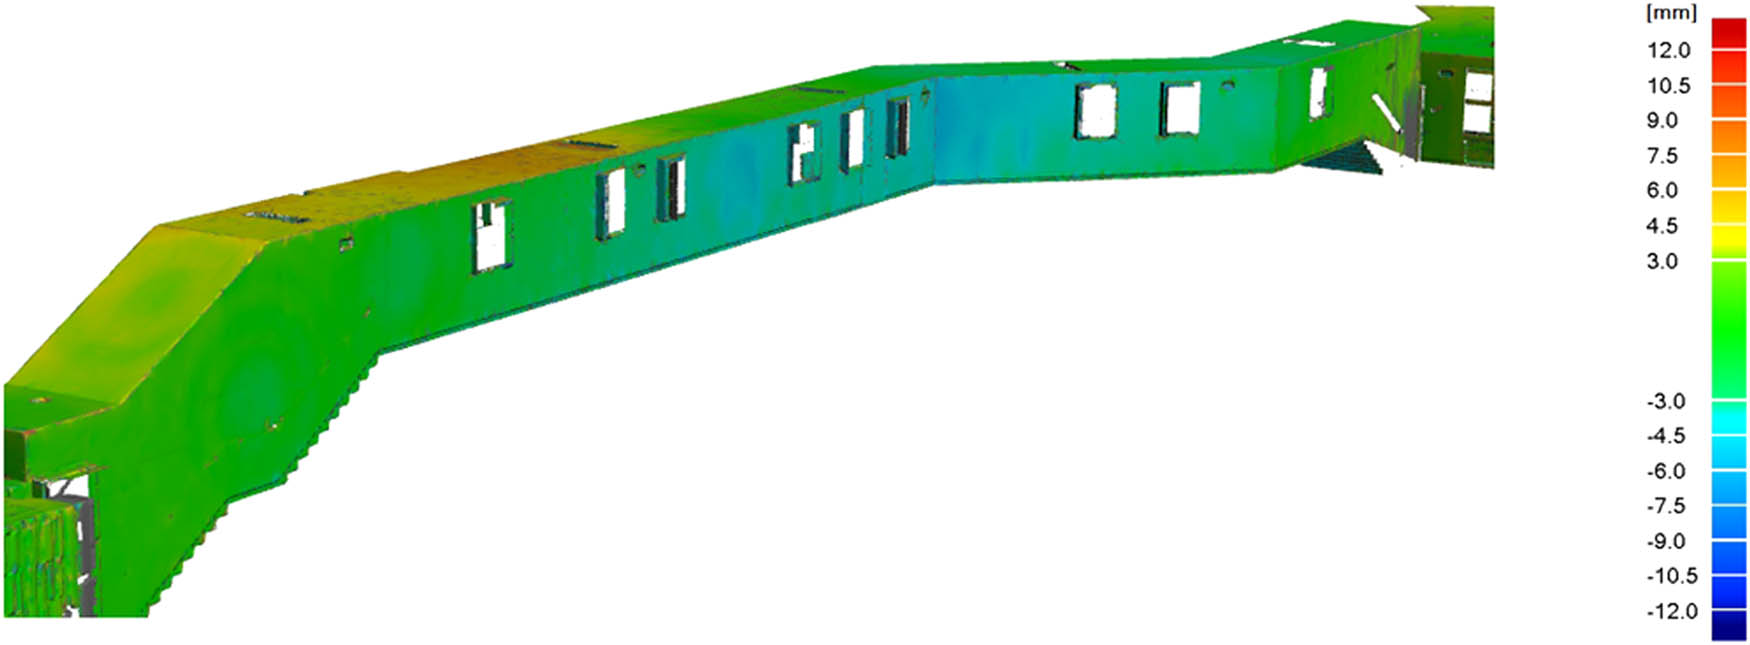
A view of internal structural wall deformations rendered from scans (north-western side of the skyway).
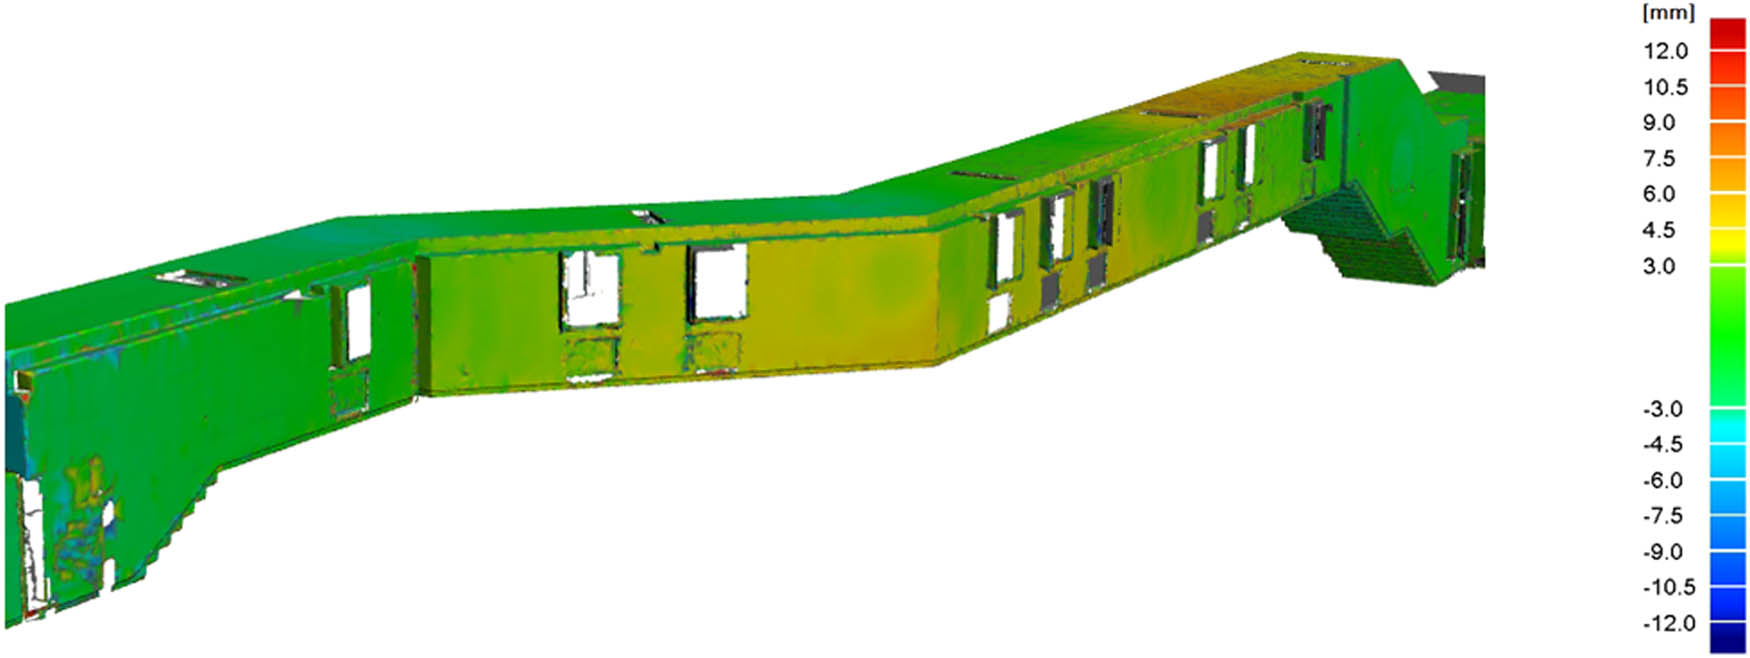
A view of internal structural wall deformations rendered from scans (south-eastern side of the skyway).
Faro Scene software was used for processing the point clouds. The points clouds was merged and adapted to the coordinate system. A colour deviation map was obtained by comparing both point clouds. To make this comparison, the reference scans were processed into a triangle net. Point clouds were matched using the “cloud to cloud” method. The average matching error between scans ranged from 0.2 to 0.7 mm for the first measurement and from 0.5 to 1.5 mm for the second measurement. The resulting integrated cloud was matched to six reference points. The average matching error was 1.4 mm for the first measurement and 1.7 mm for the second measurement. The internal skyway wall deformation values obtained fully correspond to displacement tendencies shown by the points on the skyway floor. This is supported by the fact that the skyway structure moves under varying temperature conditions. Adjustment of the point clouds obtained from laser scanner measurements to a frame of reference established by means of a laser station gives a means to analyse the obtained results in a more comprehensive manner.
4 Summary and conclusions
The results of the year-round survey of control points on the structure have revealed that displacements in the studied structure depend on varying soil and humidity conditions only to a small extent. A majority of the displacements observed are determined by changes in the temperature of the structure. Their impact in the studied period effected vertical structural displacements (detectable on the floor inside the overground skyway) of up to 2.66 mm (2.21 mm on average).
Thermal expansion also causes extensive horizontal displacements in the overground part of the structure. At ambient temperature extremes, the maximum value of displacement towards the skyway main axis reached 6.93 mm (for point no. 12). Due to the specific shape of the structure (geometric deflection in points 7, 8, 9 and 10), transverse displacements were also present – they reached 3.0 mm in point no. 8. The scale of these displacements may be detrimental to the durability of the entire structure.
In addition, supplementary laser scanning enabled determination of spots of particular susceptibility to the effects of deformation. An in-depth analysis of the results in terms of structural engineering may be indicative of actions to be undertaken in order to eradicate adverse effects of the displacements.
The described measurement and result processing technology provides the means to conduct comprehensive analyses of the geometric performance of structures, which in consequence induces formulation of more complete conclusions concerning prevention of adverse effects of displacements and deformations in engineering structures. The obtained results confirm that laser techniques are suitable for monitoring the technical condition of structures and for damage cause analysis.
Acknowledgments
This work was performed using apparatus supported financially within the framework of the project: “The implementation of the second stage of the Regional Center of Innovation” co-financed by the European Regional Development Fund under the Regional Operational Program Kujawsko–Pomorskie 2007–2013.
References
[1] Mrówczyńska M, Gibowski S. Indicating vertical deviation of historical buildings using geodetic methods – case study of brick and wood tower in Nowe Miasteczko. Civil Environ Eng Rep. 2016;22:127–35. 10.1515/ceer-2016-0041.Search in Google Scholar
[2] Sztubecki J, Mrówczyńska M, Bujarkiewicz A. Proposition of determination of displacements using the TDRA6000 laser station. E3S Web Conf. 2018;55:00011. 10.1051/e3sconf/20175500011.Search in Google Scholar
[3] Skrzypczak I, Oleniacz G. Serviceability limit verification for structural elements of steel hall. Proceedings of the 10th International Conference on Environmental Engineering. Vilnius Gediminas Technical University. Article ID: enviro. 2017.243. 10.3846/enviro.2017.243.Search in Google Scholar
[4] Skrzypczak I, Oleniacz G, Leń P, Mika M. Measurements of displacements and deformations and reliability analysis of base transceiver station (BTS) made of steel. Proceedings of the 10th International Conference on Environmental Engineering. Vilnius Gediminas Technical University. Article ID: enviro. 2017.242. 10.3846/enviro.2017.242.Search in Google Scholar
[5] Wojcik GJ, Lakanen SA, Laser Tracker, a handy tool for metrology and alignment. Proceedings of the 7th International Workshops on Accelerator Alignment, SPring-8 Japan, 14 November 2002.Search in Google Scholar
[6] Golparvar-Fard M, Bohn J, Teizer J, Savarese S, Peña-Mora F. Evaluation of image-based modeling and laser scanning accuracy for emerging automated performance monitoring techniques. Automat Construct. 2011;20:1143–55. 10.1016/j.autcon.2011.04.016.Search in Google Scholar
[7] Alemdar ZF, Browning J, Olafsen J. Photogrammetric measurements of RC bridge column deformations. Eng Struct. 2011;33(8):2407–2415. 10.1016/j.engstruct.2011.04.015.Search in Google Scholar
[8] Bougard AJ, Ellis BR. Laser measurement of building vibration and displacement. Shock Vibr. 2000;7(5):287–98. 10.1155/2000/142757.Search in Google Scholar
[9] Oleniacz G, Skrzypczak I, Ślęczka L, Świętoń T, Rymar M. Survey of the Urban bell in the belfry of St. Trinity church in Krosno. Rep Geodesy Geoinform. 2017;103(1):38–45. 10.1515/rgg-2017-0004.Search in Google Scholar
[10] Jiang R, Jáuregui DV, White KR. Close-range photogrammetry applications in bridge measurement: literature review. Measurement. 2008;41:823–34. 10.1016/j.measurement.2007.12.005.Search in Google Scholar
[11] Alba M, Fregonese L, Prandi F, Scaioni M, Valgoi P. Structural monitoring of a large dam by terrestrial laser scanning. Int Arch Photogramm Rem Sens Spat Inform Sci. 2006;36(5):6.Search in Google Scholar
[12] Wagner A. A new approach for geo-monitoring using modern total stations and RGB + D images. Measurement. 2016;82:64–74. 10.1016/j.measurement.2015.12.025.Search in Google Scholar
[13] Skrzypczak I, Kokoszka W, Kogut J, Oleniacz G. Methods of measuring and mapping of landslide areas. 3rd World Multidisciplinary Earth Sciences Symposium. IOP Conf Ser-Earth Environ Sci. 2017;95:2. 10.1088/1755-1315/95/2/022013.Search in Google Scholar
[14] Hexagon, Products, 2019, https://www.hexagonmi.com/products/industrial-theodolites-and-laser-stations/leica-tdra6000-laser-station.Search in Google Scholar
[15] Sztubecki J, Bujarkiewicz A, Sztubecka M. Measuring displacements in engineering structures by means of a coordinate laser station. Civil Environ Eng Rep. 2016;23(4):145–60. 10.1515/ceer-2016-0059.Search in Google Scholar
[16] Sztubecki J, Bujarkiewicz A, Derejczyk K, Przytuła M. A hybrid method of determining deformations of engineering structures with a laser station and a 3d scanner. Civil Environ Eng Rep. 2018;28(2):177–85. 10.2478/ceer-2018-0028.Search in Google Scholar
© 2020 Jacek Sztubecki et al., published by De Gruyter
This work is licensed under the Creative Commons Attribution 4.0 International License.
Articles in the same Issue
- Regular Articles
- The simulation approach to the interpretation of archival aerial photographs
- The application of137Cs and210Pbexmethods in soil erosion research of Titel loess plateau, Vojvodina, Northern Serbia
- Provenance and tectonic significance of the Zhongwunongshan Group from the Zhongwunongshan Structural Belt in China: insights from zircon geochronology
- Analysis, Assessment and Early Warning of Mudflow Disasters along the Shigatse Section of the China–Nepal Highway
- Sedimentary succession and recognition marks of lacustrine gravel beach-bars, a case study from the Qinghai Lake, China
- Predicting small water courses’ physico-chemical status from watershed characteristics with two multivariate statistical methods
- An Overview of the Carbonatites from the Indian Subcontinent
- A new statistical approach to the geochemical systematics of Italian alkaline igneous rocks
- The significance of karst areas in European national parks and geoparks
- Geochronology, trace elements and Hf isotopic geochemistry of zircons from Swat orthogneisses, Northern Pakistan
- Regional-scale drought monitor using synthesized index based on remote sensing in northeast China
- Application of combined electrical resistivity tomography and seismic reflection method to explore hidden active faults in Pingwu, Sichuan, China
- Impact of interpolation techniques on the accuracy of large-scale digital elevation model
- Natural and human-induced factors controlling the phreatic groundwater geochemistry of the Longgang River basin, South China
- Land use/land cover assessment as related to soil and irrigation water salinity over an oasis in arid environment
- Effect of tillage, slope, and rainfall on soil surface microtopography quantified by geostatistical and fractal indices during sheet erosion
- Validation of the number of tie vectors in post-processing using the method of frequency in a centric cube
- An integrated petrophysical-based wedge modeling and thin bed AVO analysis for improved reservoir characterization of Zhujiang Formation, Huizhou sub-basin, China: A case study
- A grain size auto-classification of Baikouquan Formation, Mahu Depression, Junggar Basin, China
- Dynamics of mid-channel bars in the Middle Vistula River in response to ferry crossing abutment construction
- Estimation of permeability and saturation based on imaginary component of complex resistivity spectra: A laboratory study
- Distribution characteristics of typical geological relics in the Western Sichuan Plateau
- Inconsistency distribution patterns of different remote sensing land-cover data from the perspective of ecological zoning
- A new methodological approach (QEMSCAN®) in the mineralogical study of Polish loess: Guidelines for further research
- Displacement and deformation study of engineering structures with the use of modern laser technologies
- Virtual resolution enhancement: A new enhancement tool for seismic data
- Aeromagnetic mapping of fault architecture along Lagos–Ore axis, southwestern Nigeria
- Deformation and failure mechanism of full seam chamber with extra-large section and its control technology
- Plastic failure zone characteristics and stability control technology of roadway in the fault area under non-uniformly high geostress: A case study from Yuandian Coal Mine in Northern Anhui Province, China
- Comparison of swarm intelligence algorithms for optimized band selection of hyperspectral remote sensing image
- Soil carbon stock and nutrient characteristics of Senna siamea grove in the semi-deciduous forest zone of Ghana
- Carbonatites from the Southern Brazilian platform: I
- Seismicity, focal mechanism, and stress tensor analysis of the Simav region, western Turkey
- Application of simulated annealing algorithm for 3D coordinate transformation problem solution
- Application of the terrestrial laser scanner in the monitoring of earth structures
- The Cretaceous igneous rocks in southeastern Guangxi and their implication for tectonic environment in southwestern South China Block
- Pore-scale gas–water flow in rock: Visualization experiment and simulation
- Assessment of surface parameters of VDW foundation piles using geodetic measurement techniques
- Spatial distribution and risk assessment of toxic metals in agricultural soils from endemic nasopharyngeal carcinoma region in South China
- An ABC-optimized fuzzy ELECTRE approach for assessing petroleum potential at the petroleum system level
- Microscopic mechanism of sandstone hydration in Yungang Grottoes, China
- Importance of traditional landscapes in Slovenia for conservation of endangered butterfly
- Landscape pattern and economic factors’ effect on prediction accuracy of cellular automata-Markov chain model on county scale
- The influence of river training on the location of erosion and accumulation zones (Kłodzko County, South West Poland)
- Multi-temporal survey of diaphragm wall with terrestrial laser scanning method
- Functionality and reliability of horizontal control net (Poland)
- Strata behavior and control strategy of backfilling collaborate with caving fully-mechanized mining
- The use of classical methods and neural networks in deformation studies of hydrotechnical objects
- Ice-crevasse sedimentation in the eastern part of the Głubczyce Plateau (S Poland) during the final stage of the Drenthian Glaciation
- Structure of end moraines and dynamics of the recession phase of the Warta Stadial ice sheet, Kłodawa Upland, Central Poland
- Mineralogy, mineral chemistry and thermobarometry of post-mineralization dykes of the Sungun Cu–Mo porphyry deposit (Northwest Iran)
- Main problems of the research on the Palaeolithic of Halych-Dnister region (Ukraine)
- Application of isometric transformation and robust estimation to compare the measurement results of steel pipe spools
- Hybrid machine learning hydrological model for flood forecast purpose
- Rainfall thresholds of shallow landslides in Wuyuan County of Jiangxi Province, China
- Dynamic simulation for the process of mining subsidence based on cellular automata model
- Developing large-scale international ecological networks based on least-cost path analysis – a case study of Altai mountains
- Seismic characteristics of polygonal fault systems in the Great South Basin, New Zealand
- New approach of clustering of late Pleni-Weichselian loess deposits (L1LL1) in Poland
- Implementation of virtual reference points in registering scanning images of tall structures
- Constraints of nonseismic geophysical data on the deep geological structure of the Benxi iron-ore district, Liaoning, China
- Mechanical analysis of basic roof fracture mechanism and feature in coal mining with partial gangue backfilling
- The violent ground motion before the Jiuzhaigou earthquake Ms7.0
- Landslide site delineation from geometric signatures derived with the Hilbert–Huang transform for cases in Southern Taiwan
- Hydrological process simulation in Manas River Basin using CMADS
- LA-ICP-MS U–Pb ages of detrital zircons from Middle Jurassic sedimentary rocks in southwestern Fujian: Sedimentary provenance and its geological significance
- Analysis of pore throat characteristics of tight sandstone reservoirs
- Effects of igneous intrusions on source rock in the early diagenetic stage: A case study on Beipiao Formation in Jinyang Basin, Northeast China
- Applying floodplain geomorphology to flood management (The Lower Vistula River upstream from Plock, Poland)
- Effect of photogrammetric RPAS flight parameters on plani-altimetric accuracy of DTM
- Morphodynamic conditions of heavy metal concentration in deposits of the Vistula River valley near Kępa Gostecka (central Poland)
- Accuracy and functional assessment of an original low-cost fibre-based inclinometer designed for structural monitoring
- The impacts of diagenetic facies on reservoir quality in tight sandstones
- Application of electrical resistivity imaging to detection of hidden geological structures in a single roadway
- Comparison between electrical resistivity tomography and tunnel seismic prediction 303 methods for detecting the water zone ahead of the tunnel face: A case study
- The genesis model of carbonate cementation in the tight oil reservoir: A case of Chang 6 oil layers of the Upper Triassic Yanchang Formation in the western Jiyuan area, Ordos Basin, China
- Disintegration characteristics in granite residual soil and their relationship with the collapsing gully in South China
- Analysis of surface deformation and driving forces in Lanzhou
- Geochemical characteristics of produced water from coalbed methane wells and its influence on productivity in Laochang Coalfield, China
- A combination of genetic inversion and seismic frequency attributes to delineate reservoir targets in offshore northern Orange Basin, South Africa
- Explore the application of high-resolution nighttime light remote sensing images in nighttime marine ship detection: A case study of LJ1-01 data
- DTM-based analysis of the spatial distribution of topolineaments
- Spatiotemporal variation and climatic response of water level of major lakes in China, Mongolia, and Russia
- The Cretaceous stratigraphy, Songliao Basin, Northeast China: Constrains from drillings and geophysics
- Canal of St. Bartholomew in Seča/Sezza: Social construction of the seascape
- A modelling resin material and its application in rock-failure study: Samples with two 3D internal fracture surfaces
- Utilization of marble piece wastes as base materials
- Slope stability evaluation using backpropagation neural networks and multivariate adaptive regression splines
- Rigidity of “Warsaw clay” from the Poznań Formation determined by in situ tests
- Numerical simulation for the effects of waves and grain size on deltaic processes and morphologies
- Impact of tourism activities on water pollution in the West Lake Basin (Hangzhou, China)
- Fracture characteristics from outcrops and its meaning to gas accumulation in the Jiyuan Basin, Henan Province, China
- Impact evaluation and driving type identification of human factors on rural human settlement environment: Taking Gansu Province, China as an example
- Identification of the spatial distributions, pollution levels, sources, and health risk of heavy metals in surface dusts from Korla, NW China
- Petrography and geochemistry of clastic sedimentary rocks as evidence for the provenance of the Jurassic stratum in the Daqingshan area
- Super-resolution reconstruction of a digital elevation model based on a deep residual network
- Seismic prediction of lithofacies heterogeneity in paleogene hetaoyuan shale play, Biyang depression, China
- Cultural landscape of the Gorica Hills in the nineteenth century: Franciscean land cadastre reports as the source for clarification of the classification of cultivable land types
- Analysis and prediction of LUCC change in Huang-Huai-Hai river basin
- Hydrochemical differences between river water and groundwater in Suzhou, Northern Anhui Province, China
- The relationship between heat flow and seismicity in global tectonically active zones
- Modeling of Landslide susceptibility in a part of Abay Basin, northwestern Ethiopia
- M-GAM method in function of tourism potential assessment: Case study of the Sokobanja basin in eastern Serbia
- Dehydration and stabilization of unconsolidated laminated lake sediments using gypsum for the preparation of thin sections
- Agriculture and land use in the North of Russia: Case study of Karelia and Yakutia
- Textural characteristics, mode of transportation and depositional environment of the Cretaceous sandstone in the Bredasdorp Basin, off the south coast of South Africa: Evidence from grain size analysis
- One-dimensional constrained inversion study of TEM and application in coal goafs’ detection
- The spatial distribution of retail outlets in Urumqi: The application of points of interest
- Aptian–Albian deposits of the Ait Ourir basin (High Atlas, Morocco): New additional data on their paleoenvironment, sedimentology, and palaeogeography
- Traditional agricultural landscapes in Uskopaljska valley (Bosnia and Herzegovina)
- A detection method for reservoir waterbodies vector data based on EGADS
- Modelling and mapping of the COVID-19 trajectory and pandemic paths at global scale: A geographer’s perspective
- Effect of organic maturity on shale gas genesis and pores development: A case study on marine shale in the upper Yangtze region, South China
- Gravel roundness quantitative analysis for sedimentary microfacies of fan delta deposition, Baikouquan Formation, Mahu Depression, Northwestern China
- Features of terraces and the incision rate along the lower reaches of the Yarlung Zangbo River east of Namche Barwa: Constraints on tectonic uplift
- Application of laser scanning technology for structure gauge measurement
- Calibration of the depth invariant algorithm to monitor the tidal action of Rabigh City at the Red Sea Coast, Saudi Arabia
- Evolution of the Bystrzyca River valley during Middle Pleistocene Interglacial (Sudetic Foreland, south-western Poland)
- A 3D numerical analysis of the compaction effects on the behavior of panel-type MSE walls
- Landscape dynamics at borderlands: analysing land use changes from Southern Slovenia
- Effects of oil viscosity on waterflooding: A case study of high water-cut sandstone oilfield in Kazakhstan
- Special Issue: Alkaline-Carbonatitic magmatism
- Carbonatites from the southern Brazilian Platform: A review. II: Isotopic evidences
- Review Article
- Technology and innovation: Changing concept of rural tourism – A systematic review