Operating Efficiency in the Capital-Intensive Semiconductor Industry: A Nonparametric Frontier Approach
-
Guangshun Qiao
 und
Yulin Lu
und
Yulin Lu

Abstract
This article uses a nonparametric production frontier approach to investigate the operating efficiency differences by the impacts of capital expenditure and business model in the global semiconductor industry. Handling the impact of capital expenditure as a fixed input by the directional distance estimator, this study compares the operating efficiencies in the global semiconductor industry between the integrated device manufacturers and the fabless and foundry firms over 1999–2018. The estimation results indicate that the operating efficiencies do vary in the semiconductor by the business model. The vertically integrated manufacturers dominate the semiconductor industry, and the capital-intensive manufacturers operate more efficiently than the asset-light fabless firms on average.
1 Introduction
Integrated circuits (ICs) are essential components of virtually all modern electronic devices. Since Bell laboratories invented the transistors in 1947 and Texas Instruments released the first working IC in 1958, the semiconductor industry, which is the aggregate of companies engaged in the design and fabrication of semiconductor devices or IC chips, has been at the forefront of the digital economy for decades. From laptop to smartphone and artificial intelligence (AI), semiconductor devices are present in nearly all aspects of modern technology. The personal computer revolution in the 1970–1980s was a result of advances in semiconductor technology, such as the Intel 8,008 microprocessor (Ceruzzi, 1996). In the development and expansion of the World Wide Web revolution in the 1990s, application-specific integrated circuits played a significant role in enabling fast and efficient networking and data processing, contributing to the growth of web-based technologies and consumer electronics (Makimoto, 2002). The rise of the smartphone in the 2010s was supported by higher-performance system-on-a-chip (SoC), such as the Apple A series and Qualcomm Snapdragon series. ChatGPT, latterly the most popular deep learning workload, required significant computational power and was trained on Nvidia[1] graphics processing units (GPUs).
Due to the growth in emerging technologies such as AI, cloud computing, Internet of Things, 5G networks, autonomous vehicles, industrial automation, and renewable energy systems, the needs for more powerful, energy-efficient, and miniaturized semiconductor devices have been consistently increasing. The 2023 Semiconductor Industry Association (SIA) factbook reported that the global semiconductor sales reached the highest-ever annual total of $574 million in 2022.[2] McKinsey’s preliminary forecast shows that the global semiconductor industry is poised to become a trillion-dollar industry by 2030 (Burkacky et al., 2022).
1.1 Structural Change History in the Semiconductor Industry
The semiconductor industry has a long history of structural change. Prior to the 1980s, a few integrated device manufacturers (IDMs), such as Intel, Infineon,[3] ST,[4] and Texas Instruments, were the dominant players in the semiconductor industry. These IDMs have in-house capabilities to perform all of the production processes (e.g., research and design [R&D], front-end fabrication, and back-end assembly and test [A&T]). For example, as a leading IC manufacturer, Intel has several fab production sites (located in the US, Ireland, Israel, etc.), A&T sites (located in the US, China, Malaysia, Vietnam, etc.), and tens of thousands employees and partners all over the world. The vertical integration of managing the entire production process internally allows Intel to have greater control over quality, intellectual property (IP), and the ability to optimize the manufacturing process for specific needs (Malone, 2014).
The semiconductor industry is renowned for its rapid technological advancements. This dynamic field continually pushes the boundaries of innovation, driving progress in areas of miniaturization, performance improvements, power efficiency, and emerging technologies. For example, the semiconductor industry had experienced significant shrinks in process technology nodes,[5] from around 130 nm in 2000, to 32 nm in 2010, and 7 nm in 2020 (Flamm, 2017). However, due to physical constraints, manufacturing challenges, heat dissipation, and power consumption issues, semiconductors with ever-expanding complexity approach the limits of Moore’s law[6] (Mack, 2011). The expenses of building a semiconductor fabrication facility had increased from around $1 billion in the 2000s to more than $10 billion nowadays (e.g., see Ibrahim et al., 2014; Lambrechts et al., 2018). The substantial increase in fab construction costs became prohibitive for almost all the IC suppliers. It stimulated business model innovation in the semiconductor industry and gave birth to the fabless–foundry business model in the mid-1980s (Sarma & Sun, 2017).
In the fabless–foundary business model, fabless companies dedicate their time to IC design and brand operation, while pure-play foundries devote themselves to front-end fabrication, and a third group of companies are allotted for back-end outsourced semiconductor assembly and test (OSAT) operations. By specializing in IC design with brand operation, fabless companies can concentrate their efforts and resources on creating differentiated and competitive chips where technological innovation meets strategic marketing, leveraging the manufacturing capabilities of semiconductor foundries and OSATs (Hurtarte et al., 2011). At the same time, foundries and OSATs take care of the actual manufacturing process, fabrication, and quality control, allowing fabless companies to focus on their core competencies, resulting in a more flexible semiconductor business ecosystem.
A milestone of the vertical disintegration in the semiconductor industry is the establishment of the Taiwan Semiconductor Manufacturing Company (TSMC) in 1987. TSMC introduced the concept of a pure-play semiconductor foundry, specializing solely in the manufacturing of ICs and committed to be a long-term non-competitive partner with the fabless firms. By continuously investing in advanced process technologies, TSMC quickly established itself as a leader in semiconductor manufacturing. Presently, TSMC is the first company to commercialize the 7nm process technology[7] and the largest dedicated semiconductor foundry worldwide.[8] Its advanced process technologies, highly automated manufacturing facilities, the ability to scale production, and a strong focus on customer satisfaction have helped TSMC to build long-term relationships with its customers, enabling it to capture a significant share of the high-end semiconductor market and making it a crucial player in the semiconductor ecosystem (e.g., see Hsieh et al., 2002).
1.2 CAPEX Plays a Crucial Role
The fabless–foundry business model has significantly changed the structure of the semiconductor value chain over the last few decades and has been a topic of wide interest (e.g., see Adner & Kapoor, 2010; Macher et al., 2007; Sarma & Sun, 2017). Many factors might affect production costs and productivity in the innovation-driving IC industry, such as capital allocation (Brown et al., 2005), technological capability (Park et al., 2021; Sher & Yang, 2005), business model (Shin et al., 2017), device type (Park et al., 2018), institutional factor (Gugler & Siebert, 2007; Lu et al., 2013; Walheer & He, 2020), and foreign competition (Henderson & Scott, 2018).
The major challenges in the capital-intensive semiconductor industry are the heavy capital expenditure (CAPEX) for cleanroom and costly equipment for front-end fabrication and back-end A&T procedures. Cleanrooms must be free of all airborne particles, which requires advanced filtration systems, controlled air flow, and rigorous cleaning procedures. Additionally, due to the complexity of the manufacturing processes and the need for precision and accuracy in the production of semiconductor chips, the equipment used in front-end fabrication and back-end A&T is costly (Monch et al., 2012). For example, extreme ultraviolet lithography (EUV)[9] is a critical technology for advanced semiconductor manufacturing processes. Each EUV machine made by ASML[10] costs around $200 million or even higher. The high costs associated with CAPEX can be a significant barrier for new companies looking to enter the semiconductor industry, as well as a challenge for existing companies looking to expand their manufacturing capacity (Powell et al., 2015).
Another challenge in the semiconductor industry is the cyclicality of demand (Rastogi et al., 2011; Tan & Mathews, 2010). The semiconductor industry is highly dependent on end-market demand, which can be volatile and subject to rapid shifts. It is difficult for companies to accurately forecast demand and plan production capacity, which might lead to costly overproduction or underproduction. In order to achieve full-capacity utilization, the foundries and OSATs seek to optimize productivity by serving many fabless companies, while even IDMs are renting their idle capacity to competitors to reduce the financial burden. It also triggered many of the IDMs to start outsourcing manufacturing partially from the dedicated foundries and became fab-lite[11] (Saha, 2015). In comparison, the fabless companies, mostly startups or spin-offs that are getting rid of the burden in setting up, maintaining, and upgrading fabs, are more flexible to integrate within local knowledge networks and focus in less crowded niche markets, specialized applications, or innovative technologies to explore technological diversity and comparative advantage, and compete with the IDMs.
Besides the huge equipment expenditures, R&D costs for developing leading-edge products such as microprocessors and radiofrequency devices also raise steadily. With the shrinking of process node, technological complexity and design complexity increase exponentially. The slow progress in node technology requires continuous investments in both R&D and advanced fabrication facilities. Based on the 2023 SIA factbook, US semiconductor companies accounted for sales totaling $275 billion in 2022, or 48% of the global market. At the same time, US semiconductor firms also invested $58.8 billion in R&D, the highest in history to remain competitive in the industry. The uncertainty of R&D investments and the IP protection by incumbents set high barriers to entry and favor the success of large IDMs, such as Intel, ST, and Texas Instruments, which are able to make risky investments and thus have a higher chance to foresee and lead the technology evolutions.
1.3 Trade-offs Between Business Models
There has been a long-lasting debate on which business model is operating more efficiently, or which business model is more likely to dominate the semiconductor industry. On the one hand, the reduced barriers to entry by vertical specialization drastically reduces the burden of CAPEX and ensures the domination of new markets by the fabless design houses. The entry of new fabless companies, most of which are spinoffs from industry incumbents, spur innovation and propel the diversification of products in various applications (Pellens & Della Malva, 2018).
Furthermore, vertical disintegration in the semiconductor value chain is accompanied and twisted by the trend of industry globalization (Brown et al., 2005). Since the 1990s, fabless firms have had substantial shares or even dominated in most of the fastest-growing market segments (Balconi & Fontana, 2011). Foundries are also becoming technology transferors rather than merely manufacturing capacity providers in the semiconductor value chain (Li et al., 2011). In addition, the collaboration between the asset-light fabless and the pure-play foundry provides more robust protection of IP rights (Sarma & Sun, 2017). When the fabless firms pass on their design blueprints to pure-play foundries, the threats of replication and the risk of IP theft are relatively low, comparing with the early years when fabless firms’ ICs could only be manufactured by their rival IDMs.
On the other hand, despite a trend toward vertical specialization driven by the entry of fabless firms, the vertically integrated IDMs have continued to persist and coexist with the fabless entrants in the semiconductor industry. Dibiaggio (2007) and Monteverde (1995) credit the efficiency of IDMs to the internalization of transaction costs. Ernst (2005), Macher (2006), and Kapoor and Adner (2012) hold the knowledge-based view that the IDMs achieve performance advantages when technological developments involve complex problems. Kapoor (2013) proposed and found that the incumbents who persist with vertical integration increase their emphasis on systemic innovations. Due to the inherently increasing complexity of the semiconductor supply chain, currently there does not exist an adequate reference model for the semiconductor industry, and more appropriate and state-of-the-art models are in great demand to analyze the semiconductor supply chain (Monch et al., 2012).
The semiconductor industry is commonly characterized as both technology-intensive and capital-intensive. Much research on the topic of structural change in the semiconductor industry emphasizes the evolution of technology (Chen et al., 2019; Cho, 2020; Hwang & Choung, 2014; Shin et al., 2017). The impacts of capital investments in the semiconductor industry have not been discussed adequately. Besides the research shown earlier that focus on analyzing the impacts of technology evolution in the semiconductor industry, this study plans to emphasize the feature of capital intensive in comparing the trade-offs of business model in the semiconductor industry. This study applies up-to-date econometric methods to handle the impacts of CAPEX as a lump sum fixed input and explores the differences of operating efficiency by business model in the highly dynamic semiconductor industry in the past two decades. The methodological contributions of article will be discussed in the next subsections.
1.4 Brief Literature Review
Taking advantage of a flexible functional form, data envelopment analysis (DEA) is one of the most popular approaches for efficiency estimation. There are rich records for performance evaluation in the semiconductor industry using the DEA approach. For instance, Kozmetsky and Yue (1998) examined the cost efficiency of 56 IC companies worldwide and showed that US, Japanese, South Korean, and Taiwanese IC companies had become the major participants in the global semiconductor industry in the early 1990s. Lu and Hung (2010) compared the managerial performance efficiency of 48 leading vertically disintegrated firms in Taiwan’s IC value chain and noted that fabless companies perform better than foundries and OSATs. Jang et al. (2016) measured the cumulative change in R&D efficiency of 49 global leading fabless companies and noted that during the period 2007–2013, the overall R&D efficiency declined slightly. Li et al. (2019) explored 64 major Chinese enterprises in the semiconductor industry and found that the most significant factor limiting future improvements to innovation efficiency was a low level of scale efficiency.
One common problem of these studies, among others, such as Lu et al. (2013), Hsu (2015), Hung et al. (2014), and Tsai et al. (2017), is the slow convergence rate of the nonparametric DEA estimator.[12] Accompanied by the increasing numbers of input and output dimensions, the convergence rate in DEA estimation is decreasing sharply. In cases when the observations are restricted to a small number either by geographic boundary or by business model boundary, the issue of slow convergence rate in DEA estimation may become severe and critical. For example, the research of Kuo and Yang (2012), Lu and Hung (2010), and Wu et al. (2006) used a small number of 38–39 companies to evaluate the performance of the fabless corporations in Taiwan, while in some extreme cases, such as Chen and Chen (2011), Hung and Lu (2008), Lin et al. (2019), and Liu and Wang (2008), the studies contained only 10–25 companies. The effective parametric sample size of the DEA estimators in these approaches was very small, which might lead to unconvincing results.[13]
1.5 Methodological Features
The main methodological feature in this study, after highlighting the slow convergence rate in DEA estimation, is to provide an empirical example of choosing the appropriate estimation methods in analyzing the operational efficiencies of the semiconductor industry, aiming to gain a faster convergence rate and hence a lower order of estimation error. The semiconductor industry is, indeed, a highly globalized industry. For example, Silicon Valley, located in the southern San Francisco Bay Area of California, US, renowned for its collaborative ecosystem that fosters entrepreneurship and innovation, has attracted a cluster of famous fabless semiconductor companies, such as Nvidia, Qualcomm,[14] AMD,[15] and Xilinx.[16] While the US has a strong presence in the fabless semiconductor sector, there are also fabless companies based in other countries such as the UK, Israel, Japan, and China. In order to support the growth of the fabless semiconductor industry on a global scale, foundries and OSATs are located in various regions around the world to cater to the global demand for semiconductor production and ensure a diverse supply chain for semiconductor manufacturing. Hence, this study considers the deeply globalized semiconductor value chain as an aggregated industry and collects data on 470 semiconductor companies all over the world with 5,136 observations in 1999–2018. The global database not only provides a worldwide perspective of the semiconductor industry, but also gains a faster convergence rate in DEA estimation. Furthermore, this study uses a dimensionality reduction technique to further improve the convergence rate.
Another methodological feature in this article is to treat the CAPEX as a fixed input by using the directional distance measure. CAPEX is a kind of lump sum investment, which involves significant upfront expenses that are expected to yield long-term benefits. By allocating funds toward acquiring new technology, upgrading infrastructure, and expanding facilities, companies can enhance productivity, improve operational efficiency, and leverage the latest technological advancements to stay competitive in the market. Although CAPEX decisions play a crucial role in determining the level of productivity and technology within an organization, in the short run, CAPEX is not under managers’ direct control. The directional distance estimator provides a convenient method to distinguish the non-discretionary fixed input CAPEX with other variables. The setting of this method will be discussed further in the next section.
Another methodological feature in this article is to investigate the impacts of the business model in the semiconductor industry through a conditional nonparametric frontier approach. Recent developments in nonparametric frontier estimation (Daraio & Simar, 2014; Daraio et al., 2020) provide tools to analyze the operating efficiencies in the semiconductor industry under various types of constraints such as capital investments and the business model. While the heterogeneity by CAPEX is treated as a fixed input variable by the directional distance estimator (Daraio et al., 2020), the heterogeneity by the business model is handled by the conditional efficiency estimators (Daraio & Simar, 2007). In addition, separability test recommended by Simar and Wilson (2020) is applied to choose the optimal conditions considering both the heterogeneities by the business model and time.
1.6 Findings and Organization
This article aims to follow the Daraio et al.'s (2020) approach to shed light on disentangling the impact of capital investments and comparing the technical efficiencies between IDMs and vertically disintegrated fabless and foundry firms in the semiconductor industry. The estimation results indicate that CAPEX plays a crucial role in the semiconductor industry and vertically integrated manufacturers dominate the industry. Since semiconductor companies heavily rely on CAPEX to acquire advanced equipment, to establish and upgrade manufacturing facilities, and to develop cutting-edge technologies, the capital-intensive IDMs and OSATs operate more efficiently than the asset-light fabless firms on average. It is worth noting that such kind of operating efficiency is probably not attributed to management improvement, but generated from subsidies or M&A (VerWey, 2019). In fostering a healthy and competitive semiconductor ecosystem, we suggest to tilt the subsidies of the semiconductor industry towards the fabless sector to encourage more innovation and diversification.
This article is organized as follows. Section 2 explains the nonparametric frontier framework and discusses the diagnostics and test statistics to choose a suitable estimator in this research. Section 3 introduces the data and defines the variables. Section 4 presents the empirical results and discusses the effect of capital investment and business model in the semiconductor industry. Section 5 concludes.
2 Methodology
2.1 DEA Approach
The economic theory of efficiency in production can be traced to Farrell (1957). Attributed by its flexibility and adaptability, DEA (Charnes et al., 1978) is considered the mainstream approach in frontier analysis for assessing technical efficiency.[17] A large and growing literature has developed on the application of the DEA approach in the semiconductor industry (e.g., see Jang et al., 2016; Li et al., 2019; Sueyoshi & Ryu, 2020; Tsai et al., 2017; Zhou et al., 2020). This article follows the DEA approach and applies the latest methodological advancements of Bădin et al. (2012), Daraio et al. (2020), and Simar and Wilson (2020) to address the impacts of CAPEX, business model, and time in the ever-evolving semiconductor industry.
Production theory primarily examines how the production process works within a firm to combine
2.2 Directional Distance Measure
There are four kinds of commonly used efficiency measures in the DEA approach, namely, input-oriented Debreu–Farrel measure, out-oriented Debreu–Farrel measure, hyperbolic measure (Wilson, 2012), and directional distance measure (Chambers et al., 1998). The input-, output-, and hyperbolic oriented measures are radial measures that allow for only nonnegative values. In contrast, the directional distance measure is an additive measure. The directional distance measure is given by:
which projects (
The directional distance measure allows for negative values of
2.3 Estimation of the Frontier
The attainable set
where
The trade-off between FDH and DEA is not trivial. Simar and Wilson (2015) summarized that the FDH and DEA estimators converge to limiting distributions at rates of
After the diagnostics of dimension reduction, a test of convexity is recommended for the trade-off between
2.4 Conditional Efficiency Measures
There exist factors such as the business model, constraints of technology and regulatory, and differences in ownership, which are beyond control of the manager but may influence the production process. These factors are denoted as environmental factors
A conditional directional distance measure is given by:
Plugging a nonparametric estimator of
2.5 Second Stage Analysis
In a particular case,
Bădin et al. (2012) derived the pure efficiency from the location-scale model as:
The pure efficiency in equation (2.5) provides a measure of inefficiency whitened from the main effect of the environmental factors. This article uses the pure efficiency to measure the impacts of business model and time in the semiconductor industry.
3 Data and Variable Specification
The data are collected from the Sub-Industry of Semiconductors in the Compustat database. In order to provide a global perspective for the semiconductor value chain, we combined data from both the Compustat North America database and the Compustat Global database to cover companies in the industry worldwide. As the semiconductor industry is famous for being a cyclical industry (e.g., see Rastogi et al., 2011; Tan & Mathews, 2010), we gather 20 years of data in 1999–2018 to cover a sufficient period with multiple business cycles in the industry. We exclude liquid crystal display manufacturers, light-emitting diode manufacturers, and photovoltaic producers from the dataset, limiting the sample to only IC manufacturers in a narrow sense. Hence, the panel data include 5,136 observations from 470 unique companies in the global semiconductor industry in 1999–2018.
The reason for the data to begin in 1999 is twofold. First, the global semiconductor value chain has been preliminarily established in the late 1990s since the inception of the fabless–foundry business model in the late 1980s. Since 1999, there are plenty of available annual reports for the fabless and foundry firms on the open market. Second, the year 1999 is a suitable starting point to observe the development trend in the global semiconductor industry. Two years after the 1997 Asian financial crisis, the semiconductor industry is in a golden decade without massive exogenous shocks until the 2008 financial crisis.
Identifying the inputs and outputs of the production function has always been a subject of controversy, either in parametric or in nonparametric frontier estimations, without exception in the semiconductor industry. Hence, we sort the most commonly used variables in 37 empirical studies, which apply the DEA approach in the semiconductor industry. Besides a few variables chosen for specific topics, the commonly used variables in these articles are highly concentrated into two input and two output categories. The first input category measures variable inputs, including labor, raw material, R&D, sales, and marketing expenditure, while the second input category measures fixed assets. Therefore, we specify
Comparably, the first output category measures revenue and the second output category measures the market value of the firms. Hence, we specify
Table 1 gives the summary statistics for the variables in 1999–2018 pooled data. In order to provide a uniform standard across years, all the variables except
Summary statistics for 1999–2018 pooled data
| Variable | Min | Q1 | Median | Mean | Q3 | Max |
|---|---|---|---|---|---|---|
|
|
0.001 | 0.160 | 0.486 | 3.082 | 2.011 | 107.600 |
|
|
0.001 | 24.170 | 88.008 | 475.252 | 301.645 | 18226.000 |
|
|
0.000 | 4.302 | 18.330 | 160.217 | 67.001 | 13543.000 |
|
|
0.549 | 5.885 | 20.087 | 125.406 | 67.185 | 1982.015 |
|
|
0.005 | 6.065 | 27.787 | 554.060 | 174.405 | 48976.000 |
|
|
0.003 | 47.283 | 161.799 | 1064.110 | 563.655 | 70848.000 |
|
|
0.175 | 44.279 | 151.749 | 1114.748 | 487.730 | 74563.000 |
| Obs. | 5,136 | |||||
| Uniq. Obs. | 470 | |||||
Note.
Besides inputs and outputs, we specify
Table 2 breaks down the 5,136 observations by the business model. It is no surprise that over half of the companies are fabless. As the barriers to entry, which rely heavily on CAPEX, are much lower for fabless than for the others, fabless companies spring up like the mushrooms in the late 1990s to the early 2000s. At the same time, the number of firms operating in other kinds of business models remains relatively stable. After the golden decade of fast growth in the semiconductor industry come to an end in the mid-2000s (e.g., see Flamm, 2017), the proportions of firms in each business model are gradually fixed. Around 60% of the firms are fabless, while 20% of the firms are IDMs and the rest 20% are either front-end wafer fabs or back-end OSATs.
Number of companies by business model
| Year | All | IDM | Foundry | A&T | Fabless |
|---|---|---|---|---|---|
| 1999 | 125 | 38 | 10 | 9 | 68 |
| 2000 | 149 | 43 | 10 | 15 | 81 |
| 2001 | 155 | 46 | 10 | 16 | 83 |
| 2002 | 213 | 48 | 17 | 27 | 121 |
| 2003 | 241 | 49 | 19 | 30 | 143 |
| 2004 | 264 | 54 | 21 | 30 | 159 |
| 2005 | 260 | 54 | 17 | 27 | 162 |
| 2006 | 267 | 56 | 20 | 30 | 161 |
| 2007 | 269 | 52 | 21 | 33 | 163 |
| 2008 | 278 | 51 | 20 | 35 | 172 |
| 2009 | 290 | 53 | 21 | 36 | 180 |
| 2010 | 300 | 59 | 23 | 38 | 180 |
| 2011 | 298 | 60 | 22 | 39 | 177 |
| 2012 | 301 | 61 | 22 | 38 | 180 |
| 2013 | 313 | 65 | 24 | 41 | 183 |
| 2014 | 302 | 62 | 25 | 43 | 172 |
| 2015 | 288 | 59 | 24 | 42 | 163 |
| 2016 | 283 | 54 | 23 | 44 | 162 |
| 2017 | 275 | 51 | 23 | 45 | 156 |
| 2018 | 265 | 48 | 22 | 44 | 151 |
| Obs. | 5,136 | 1,063 | 394 | 662 | 3,017 |
| Uniq. Obs. | 470 | 83 | 36 | 63 | 288 |
Obs. denotes the observations, and uniq. obs. denotes the companies.
4 Empirical Results
Most nonparametric estimators suffer from the curse of dimensionality. Based on the three diagnostics introduced in Appendix A, the necessity for dimension reduction is unambiguous. With seven dimensions (
Among studies that use the nonparametric frontier approach to estimate efficiency and benchmark performance of firms in the semiconductor industry, the vast majority choose the DEA estimator, without comparing the pros and cons between the FDH estimator and the DEA estimator. The DEA estimator is probably a better choice without dimension reduction, as the slower convergence rate of FDH estimator may increase measurement error rapidly with increasing dimensions. However, it is worth to reevaluate the trade-off between the FDH and DEA estimators with dimension reduction. The drawback of the DEA estimator is imposing convexity on the production set
Table 3 provides the results of the convexity test.[21] At 95% confidence level, the null hypotheses of convexity are rejected for over 80% of the 20 years’ annual data, except 3 years (2009, 2011, and 2012) in the hyperbolic measure. Simar and Vanhems (2012) linked the directional distance measure with the hyperbolic measure by a monotonic transformation, so that the results in Table 3 are also valid for the directional distance estimator. Hence, we choose the FDH estimator.
Results of convexity test
| Year |
|
Statistic |
|
|---|---|---|---|
| 1999 | 125 | 2.222 | 0.011 |
| 2000 | 149 | 1.594 | 0.006 |
| 2001 | 155 | 1.853 | 0.040 |
| 2002 | 213 | 3.138 | 0.005 |
| 2003 | 241 | 2.901 | 0.001 |
| 2004 | 264 | 3.440 | 0.000 |
| 2005 | 260 | 3.238 | 0.000 |
| 2006 | 267 | 3.651 | 0.000 |
| 2007 | 269 | 3.915 | 0.003 |
| 2008 | 278 | 3.227 | 0.008 |
| 2009 | 290 | 2.162 | 0.057 |
| 2010 | 300 | 2.890 | 0.006 |
| 2011 | 298 | 2.102 | 0.088 |
| 2012 | 301 | 1.014 | 0.174 |
| 2013 | 313 | 1.989 | 0.020 |
| 2014 | 302 | 3.552 | 0.001 |
| 2015 | 288 | 1.452 | 0.041 |
| 2016 | 283 | 2.053 | 0.018 |
| 2017 | 275 | 4.831 | 0.000 |
| 2018 | 265 | 4.963 | 0.000 |
We use 100 splits and 1,000 bootstrap replications.
In order to consider a discrete environmental variable such as the business model
Test of separability conditional on
|
|
|
|||
|---|---|---|---|---|
| Statistic |
|
Statistic |
|
|
|
Conditional on
|
||||
| Fabless vs IDM | 7.567 | 0.000 | 0.992 | 0.925 |
| Fabless vs OSAT | 4.126 | 0.000 | 1.000 | 0.000 |
| IDM vs OSAT | 3.883 | 0.000 | 0.870 | 0.715 |
|
Conditional on
|
||||
| Pooled vs optimal time | 3.230 | 0.000 | 0.983 | 0.000 |
|
Conditional on
|
||||
| 2-Year groups | 26.273 | 0.000 | 1.000 | 0.000 |
| 4-Year groups | 18.572 | 0.000 | 1.000 | 0.000 |
| 5-Year groups | 17.242 | 0.000 | 1.000 | 0.000 |
| Optimal time | 19.891 | 0.000 | 1.000 | 0.000 |
For the environmental variable
Although
Alternatively, treating
Table 5 shows the summary of the efficiency scores conditional on both the business model
Summary statistics of the efficiency scores
| Sample set | Sample size | Min | Q1 | Median | Mean | Q3 | Max |
|---|---|---|---|---|---|---|---|
| 2-year groups | |||||||
| Fabless | 3,017 | 0.000 | 0.000 | 0.023 | 0.097 | 0.085 | 13.859 |
| IDM | 1,063 | 0.000 | 0.000 | 0.002 | 0.046 | 0.033 | 1.943 |
| OSAT | 1,056 | 0.000 | 0.000 | 0.000 | 0.041 | 0.029 | 1.167 |
| 4-year groups | |||||||
| Fabless | 3,017 | 0.000 | 0.005 | 0.036 | 0.129 | 0.107 | 15.171 |
| IDM | 1,063 | 0.000 | 0.000 | 0.009 | 0.067 | 0.061 | 1.939 |
| OSAT | 1,056 | 0.000 | 0.000 | 0.005 | 0.064 | 0.055 | 1.901 |
| 5-year groups | |||||||
| Fabless | 3,017 | 0.000 | 0.009 | 0.042 | 0.147 | 0.115 | 15.179 |
| IDM | 1,063 | 0.000 | 0.000 | 0.012 | 0.074 | 0.069 | 2.377 |
| OSAT | 1,056 | 0.000 | 0.000 | 0.008 | 0.074 | 0.071 | 2.000 |
| Optimal time | |||||||
| Fabless | 3,017 | 0.000 | 0.027 | 0.073 | 0.258 | 0.175 | 19.151 |
| IDM | 1,063 | 0.000 | 0.006 | 0.043 | 0.131 | 0.171 | 2.087 |
| OSAT | 1,056 | 0.000 | 0.004 | 0.036 | 0.142 | 0.146 | 2.660 |
Figure 1 visualizes the trends of the annual mean efficiencies by the business model and year. Treating
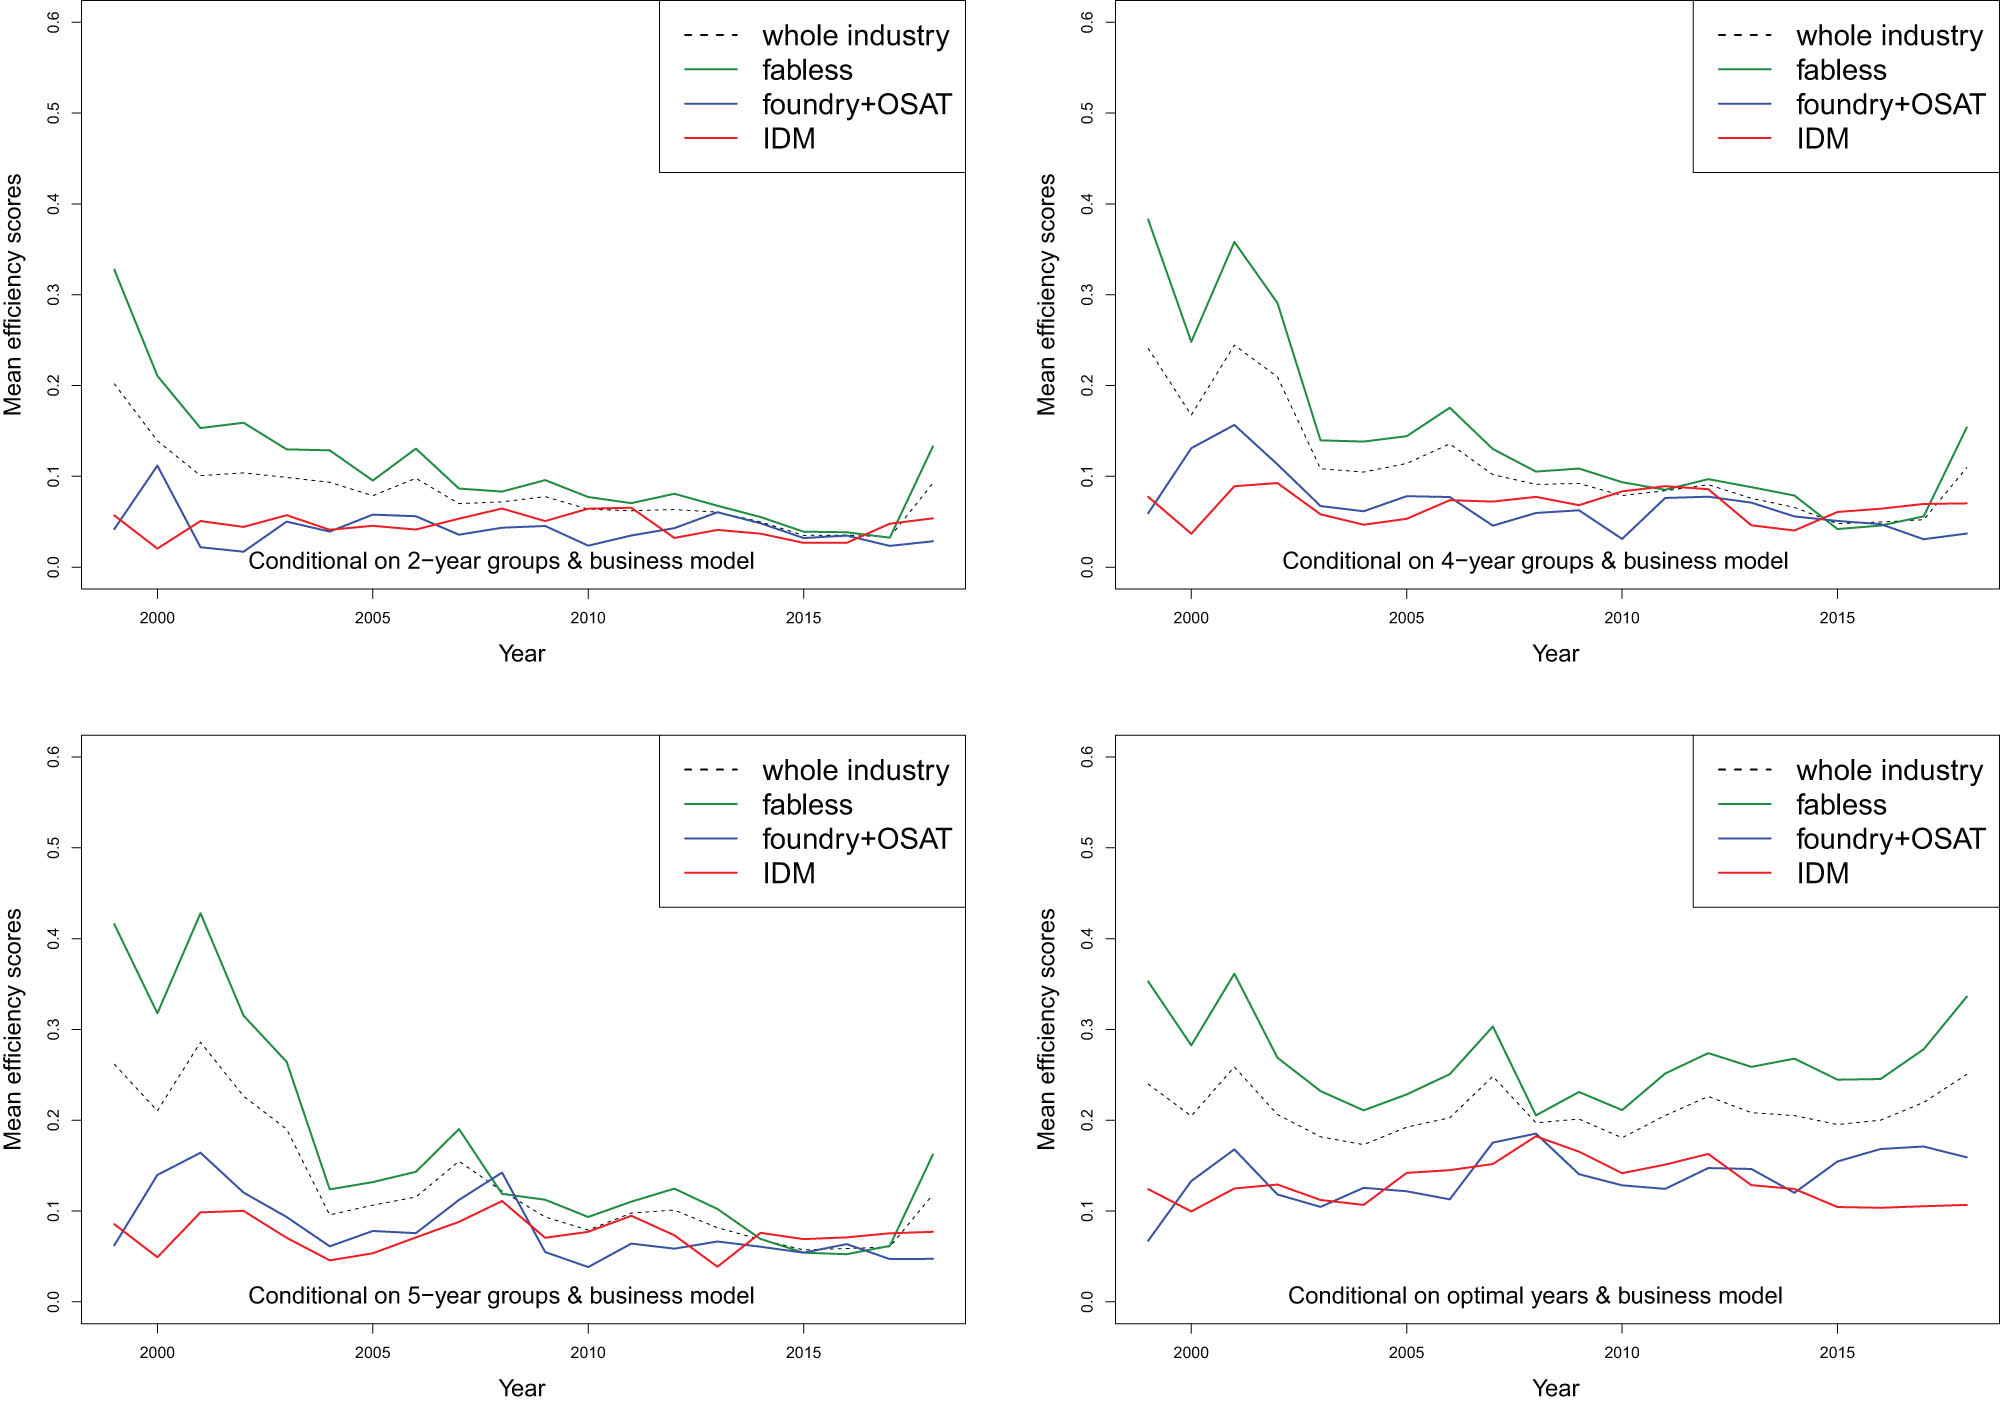
Mean
Figure 1 also demonstrates that if
M&A activities in the semiconductor industry also contribute to the blurring of boundaries between IDMs and fabless companies. The industry has seen numerous mergers, acquisitions, and strategic partnerships aimed at expanding product portfolios, accessing new markets, and driving innovation. On the one hand, fabless giant Qualcomm has made over 41 acquisitions and 108 investments, such as the acquisition of Atheros (a leading provider of wireless networking solutions) in 2011 and CSR (a England-based fabless known for its wireless chips) in 2015, continuously diversifying its product portfolio and strengthening its position in the mobile and networking markets. The merger of Avago and Broadcom in 2015 combined Avago’s expertise in analog and mixed-signal semiconductor solutions with Broadcom’s strengths in connectivity and networking technologies. On the other hand, IDM giant Intel has so far acquired more than 90 companies, including the acquisition of Altera Corporation (a prominent manufacturer of programmable logic devices) in 2015. This acquisition enabled Intel to integrate Altera’s FPGA technology with its processors, offering customized solutions for various applications.
Another interesting discovery is that the curves of different business models in the bottom-right panel of Figure 1 tend to converge in 2008, the year of global finanical crisis. That is, under a severe condition such as the 2008 financial crisis, the differences in operating efficiency become unconspicuous among business models. However, it is important to note that different business models still play a role in determining how companies weather the crisis. While the differences in operating efficiency might not be as apparent during extreme conditions, they can still influence a company’s ability to adapt, survive, and eventually recover. As the economy recovered from the 2008 crisis, the differences in operating efficiency among business models once again became noticeable in the semiconductor industry.
Figure 2 shows the annual mean efficiency curves by business model and optimal time, with 95% confidence interval. The confidence interval is derived by new central limit theorem (Kneip et al., 2015, p. 409). The variances for the fabless firms are higher compared with the IDMs or OSATs, implying higher risks and uncertainties for the fabless business model.

Mean
As the separability condition does not hold (Table 4), we use a flexible nonparametric location-scale model for a second-stage regression. The pure efficiency can be derived from equation (2.5). In practice, we obtain
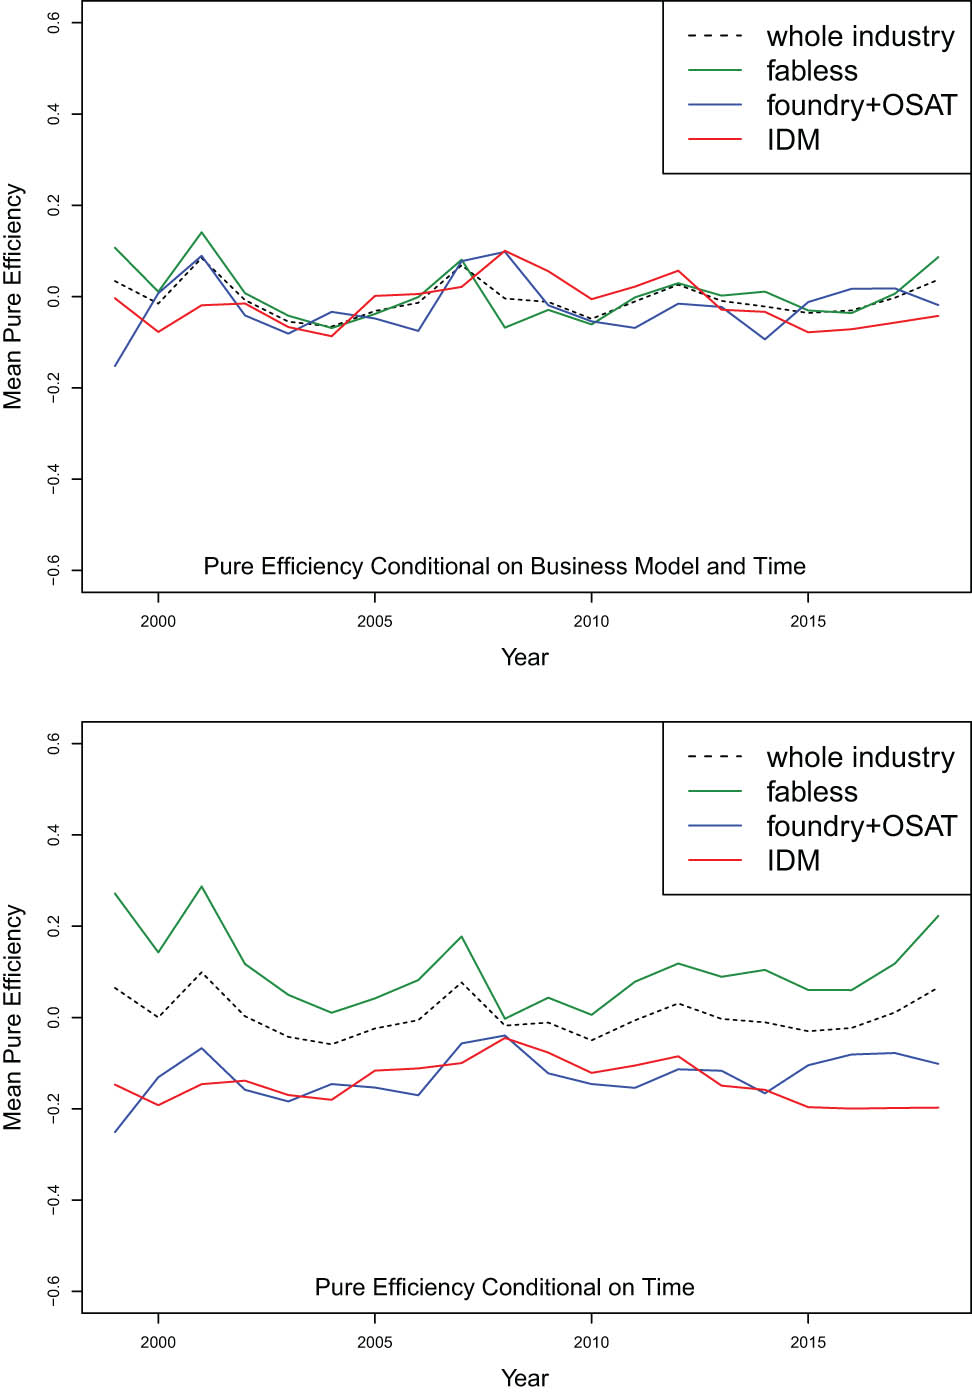
Pure efficiency.
The lower panel in Figure 3 illustrates the pure efficiency
5 Summary
The semiconductor industry is famous for the high barriers to entry, especially in the capital-intensive manufacturing portion. The incumbent IDMs, benefitted by the economy of scale and protected by the economic moat by huge CAPEX, have dominated the semiconductor industry since the onset of the industry in the 1960s. However, wagering on novel technologies and processes with the ever-expanding complexity of ICs becomes a weighty burden even for the giant IDMs. The fabless–foundry business model alleviates the financial risks of capital investment, reduces the barriers to entry, accelerats technology iterations, and leads to a flourishing of fabless design houses for various applications.
This study compares the operating efficiencies between the IDMs and the fabless–foundry business models to shed light on which business model will be the market trend and dominate the semiconductor industry in the long run. Based on the capital-intensive feature of the semiconductor industry, this study chooses a directional distance measure to handle the constraint of CAPEX. At the same time, conditional FDH estimators are used to handle the effects of business model and time in the nonparametric frontier approach. The empirical results provide clear evidence that the IDMs are operating more efficiently, while fabless firms are operating less efficiently by and large. A second-stage nonparametric location-scale regression is used to further check the robustness of the finding. By setting different conditions in the second-stage regression, we show strong evidence that the technical efficiencies do vary in the semiconductor by the business model, and the asset-light fabless firms are operating less efficiently comparing with the capital-intensive IDMs, foundries, and OSATs on average.
Nevertheless, there are several limitations in this study. The method is mainly econometric. Criteria for PCA, the separability condition, the optimal bandwidth, etc. are statistical, lacking solid ground in economics. The dynamics in the semiconductor industry had not been fully measured, which may need more advanced econometric methods and data with more technical details for further research.
Though the fabless–foundry business model encourages entrance of the fabless startups, the CAPEX barriers accompanying with technical barriers still limit the fields and applications for the fabless firms to growth and development. The IDMs, having more room to optimize the operation and lead the technology development with a strategic product roadmap by vertical integration, will continuously dominate the semiconductor industry in the foreseeable future. At the same time, the fabless–foundry business model is an important complement of the IDMs to explore a broader scope in the semiconductor industry. In fostering a healthy and competitive semiconductor ecosystem, we suggest to tilt the subsidies of the semiconductor industry toward the fabless sector to promote innovation, to support entrepreneurship and startups, to leverage specialization and expertise, and to encourage more diversification.
-
Funding information: No funding was used for this article.
-
Conflict of interest: The authors declare no known competing financial interests or personal relationships that could have appeared to influence this article’s results.
-
Article note: As part of the open assessment, reviews and the original submission are available as supplementary files on our website.
-
Data availability statement: The data used in this study are available from the corresponding author on request.
Appendix A Principal Component Analysis
PCA is a mapping
The first diagnostic is to compute the effective parametric sample size
A second diagnostic is to consider the proportion of
A third diagnostic is to determine the ratios
In practice, Wilson (2018) proposed standardizing the matrices
B Computation of the Directional Distance Measure
This study follows the Daraio et al. (2020) approach to compute the directional distance measure using the FDH estimator.
First, use the Hadamard component-wise division of vectors
Then, the directional distance estimator in equation (2.1) can be expressed explicitly as:
where
Similarly, the conditional directional distance estimator in equation (2.4) can be expressed as:
where
C Kernel Method
A nonparametric estimator of
where
In this study, the optimal bandwidth
where

Optimal time window of
References
Adner, R., & Kapoor, R. (2010). Value creation in innovation ecosystems: How the structure of technological interdependence affects firm performance in new technology generations. Strategic Management Journal, 31, 306–333. 10.1002/smj.821Suche in Google Scholar
Bădin, L., Daraio, C., & Simar, L. (2010). Optimal bandwidth selection for conditional efficiency measures: A data-driven approach. European Journal of Operational Research, 201, 633–640. 10.1016/j.ejor.2009.03.038Suche in Google Scholar
Bădin, L., Daraio, C., & Simar, L. (2012). How to measure the impact of environmental factors in a nonparametric production model. European Journal of Operational Research, 223, 818–833. 10.1016/j.ejor.2012.06.028Suche in Google Scholar
Bădin, L., Daraio, C., & Simar, L. (2014). Explaining inefficiency in nonparametric production models: The state of the art. Annals of Operations Research, 214, 5–30. 10.1007/s10479-012-1173-7Suche in Google Scholar
Balconi, M., & Fontana, R. (2011). Entry and innovation: An analysis of the fabless semiconductor business. Small Business Economics, 37, 87–106. 10.1007/s11187-009-9231-5Suche in Google Scholar
Banker, R. D., Charnes, A., & Cooper, W. W. (1984). Some models for estimating technical and scale inefficiencies in data envelopment analysis. Management Science, 30, 1078–1092. 10.1287/mnsc.30.9.1078Suche in Google Scholar
Brown, C., Linden, G., & Macher, J. (2005). Offshoring in the semiconductor industry: A historical perspective. Brookings Trade Forum, 279–333. 10.1353/btf.2006.0009Suche in Google Scholar
Burkacky, O., Dragon, J., & Lehmann, N. (2022). The semiconductor decade: A trillion-dollar industry. McKinsey & Company, 1. Suche in Google Scholar
Ceruzzi, P. (1996). From scientific instrument to everyday appliance: The emergence of personal computers, 1970-77. History and Technology, an International Journal, 13(1), 1–31. 10.1080/07341519608581893Suche in Google Scholar
Chambers, R. G., Chung, Y. H., & Färe, R. (1998). Profit, directional distance functions, and Nerlovian efficiency. Journal of Optimization Theory and Applications, 98, 351–364. 10.1023/A:1022637501082Suche in Google Scholar
Charnes, A., Cooper, W. W., & Rhodes, E. (1978). Measuring the efficiency of decision making units. European Journal of Operational Research, 2, 429–444. 10.1016/0377-2217(78)90138-8Suche in Google Scholar
Chen, Y. S., & Chen, B. Y. (2011). Applying DEA, MPI, and grey model to explore the operation performance of the Taiwanese wafer fabrication industry. Technological Forecasting & Social Change, 78, 536–546. 10.1016/j.techfore.2010.04.013Suche in Google Scholar
Chen, T. C., Guo, D. Q., Chen, H. M., & Wei, T. T. (2019). Effects of R&D intensity on firm performance in Taiwanas semiconductor industry. Economic Research-Ekonomska istraživanja, 32(1), 2377–2392. 10.1080/1331677X.2019.1642776Suche in Google Scholar
Cho, Y. (2020). The effects of knowledge assets and path dependence in innovations on firm value in the Korean semiconductor industry. Sustainability, 12(6), 2319. 10.3390/su12062319Suche in Google Scholar
Daraio, C., & Simar, L. (2005). Introducing environmental variables in nonparametric frontier models: A probabilistic approach. Journal Productivity Analysis, 24, 93–121. 10.1007/s11123-005-3042-8Suche in Google Scholar
Daraio, C., & Simar, L. (2007). Advanced robust and nonparametric methods in efficiency analysis. New York: Springer Science & Business Media, LLC. Suche in Google Scholar
Daraio, C., & Simar, L. (2014). Directional distances and their robust versions: Computational and testing issues. European Journal of Operational Research, 237, 358–369. 10.1016/j.ejor.2014.01.064Suche in Google Scholar
Daraio, C., Simar, L., & Wilson, P. W. (2020). Fast and efficient computation of directional distance estimators. Annals of Operations Research, 288, 805–835. 10.1007/s10479-019-03163-9Suche in Google Scholar
Dibiaggio, L. (2007). Design complexity, vertical disintegration and knowledge organization in the semiconductor industry. Industrial and Corporate Change, 16, 239–267. 10.1093/icc/dtm006Suche in Google Scholar
Ernst, D. (2005). Limits to modularity: Reflections on recent developments in chip design. Industry and Innovation, 12, 303–335. 10.1080/13662710500195918Suche in Google Scholar
Farrell, M. J. (1957). The measurement of productive efficiency. Journal of the Royal Statistical Society, 120, 253–281. 10.2307/2343100Suche in Google Scholar
Flamm, K. (2017). Has Moore’s law been repealed? An economist’s perspective. Computing in Science & Engineering, 19, 29–40. 10.1109/MCSE.2017.30Suche in Google Scholar
Gugler, K., & Siebert, R. (2007). Market power versus efficiency effects of mergers and research joint ventures: Evidence from the semiconductor industry. The Review of Economics and Statistics, 89(4), 645–659. 10.1162/rest.89.4.645Suche in Google Scholar
Hall, P., Racine, J. S., & Li, Q. (2004). Cross-validation and the estimation of conditional probability densities. Journal of the American Statistical Association, 99, 1015–1026. 10.1198/016214504000000548Suche in Google Scholar
Henderson, J., & Scott, A. J. (2018). The growth and internationalisation of the American semiconductor industry: Labour processes and the changing spatial organisation of production. In: The Development of High Technology Industries (pp. 37–79). Routledge. 10.4324/9781351269001-3Suche in Google Scholar
Hsieh, Y., Lin, N., & Chiu, H. (2002). Virtual factory and relationship marketing - a case study of a Taiwan semiconductor manufacturing company. International Journal of Information Management, 22, 109–126. 10.1016/S0268-4012(01)00049-4Suche in Google Scholar
Hsu, L. C. (2015). Using a decision-making process to evaluate efficiency and operating performance for listed semiconductor companies. Technological and Economic Development of Economy, 21, 301–331. 10.3846/20294913.2013.876689Suche in Google Scholar
Hung, S. W., He, D. S., & Lu, W. M. (2014). Evaluating the dynamic performances of business groups from the carry-over perspective: A case study of Taiwanas semiconductor industry. Omega, 46, 1–10. 10.1016/j.omega.2014.01.003Suche in Google Scholar
Hung, S. W., & Lu, W. M. (2008). The comparative productivity efficiency of Taiwan’s integrated circuits packaging/testing firms. Information Systems and Operational Reserach, 46, 189–198. 10.3138/infor.46.3.189Suche in Google Scholar
Hurtarte, J. S., Wolsheimer, E. A., & Tafoya, L. M. (2011). Understanding fabless IC technology. Elsevier. Suche in Google Scholar
Hwang, H., & Choung, J. (2014). The co-evolution of technology and institutions in the catch-up process: The case of the semiconductor industry in Korea and Taiwan. The Journal of Development Studies, 50, 1240–1260. 10.1080/00220388.2014.895817Suche in Google Scholar
Ibrahim, K., Chik, M. A., & Hashim, U. (August 2014). Horrendous capacity cost of semiconductor wafer manufacturing. In: 2014 IEEE International Conference on Semiconductor Electronics (ICSE2014) (pp. 329–331). IEEE. 10.1109/SMELEC.2014.6920864Suche in Google Scholar
Jang, H., Lee, S., & Suh, E. (2016). A comparative analysis of the change in R&D efficiency: A case of R&D leaders in the technology industry. Technology Analysis & Strategic Management, 28, 886–900. 10.1080/09537325.2016.1180354Suche in Google Scholar
Jeong, S., Park, B. U., & Simar, L. (2010). Nonparametric conditional efficiency measures: asymptotic properties. Annals of Operations Research, 173, 105–122. 10.1007/s10479-008-0359-5Suche in Google Scholar
Kapoor, R. (2013). Persistence of integration in the face of specialization: How firms navigated the winds of disintegration and shaped the architecture of the semiconductor industry. Organization Science, 24, 1195–1213. 10.1287/orsc.1120.0802Suche in Google Scholar
Kapoor, R., & Adner, R. (2012). What firms make vs what they know: How firms’ production and knowledge boundaries affect competitive advantage in the face of technological change. Organization Science, 23, 1227–1248. 10.1287/orsc.1110.0686Suche in Google Scholar
Kneip, A., Simar, L., & Wilson, P. W. (2015). When bias kills the variance: Central limit theorems for DEA and FDH efficiency scores. Econometric Theory, 31, 394–422. 10.1017/S0266466614000413Suche in Google Scholar
Kneip, A., Simar, L., & Wilson, P. W. (2016). Testing hypotheses in nonparametric models of production. Journal of Business and Economic Statistics, 34, 435–456. 10.1080/07350015.2015.1049747Suche in Google Scholar
Kozmetsky, G., & Yue, P. (1998). Comparative performance of global semiconductor companies. Omega, 26, 153–175. Suche in Google Scholar
Kuo, M. H., & Yang, C. (2012). Does intellectual capital matter? Assessing the profitability and marketability of IC design companies. Quality & Quantity, 46, 1865–1881. 10.1007/s11135-011-9562-6Suche in Google Scholar
Lambrechts, W., Sinha, S., Abdallah, J. A., & Prinsloo, J. (2018). Extending Mooreas law through advanced semiconductor design and processing techniques. CRC Press. Suche in Google Scholar
Lampe, H. W., & Hilgers, D. (2015). Trajectories of efficiency measurement: A bibliometric analysis of DEA and SFA. European Journal of Operational Research, 240(1), 1–21. 10.1016/j.ejor.2014.04.041Suche in Google Scholar
Li, H., He, H., Shan, J., & Cai, J. (2019). Innovation efficiency of semiconductor industry in China: A new framework based on generalized three-stage DEA analysis. Socio-Economic Planning Sciences, 66, 136–148. 10.1016/j.seps.2018.07.007Suche in Google Scholar
Li, Q., Lin, J., & Racine, J. S. (2013). Optimal bandwidth selection for nonparametric conditional distribution and quantile functions. Journal of Business & Economic Statistics, 31, 57–65. 10.1080/07350015.2012.738955Suche in Google Scholar
Li, Y., Huang, M., & Chen, D. (2011). Semiconductor industry value chain: Characters’ technology evolution. Industrial Management & Data Systems, 111, 370–390. 10.1108/02635571111118260Suche in Google Scholar
Lin, F., Lin, S. W., & Lu, W. M. (2019). Dynamic eco-efficiency evaluation of the semiconductor industry: A sustainable development perspective. Environ Monit Assess, 191, 1–16. 10.1007/s10661-019-7598-6Suche in Google Scholar
Liu, F., & Wang, P. (2008). DEA Malmquist productivity measure: Taiwanese semiconductor companies. International Journal of Production Economics, 112, 367–379. 10.1016/j.ijpe.2007.03.015Suche in Google Scholar
Lu, W. M., & Hung, S. W. (2010). Assessing the performance of a vertically disintegrated chain by the DEA approach - A case study of Taiwanese semiconductor firms. International Journal of Production Research, 48, 1155–1170. 10.1080/00207540802484929Suche in Google Scholar
Lu, W. M., Wang, W. K., & Lee, H. L. (2013). The relationship between corporate social responsibility and corporate performance: Evidence from the US semiconductor industry. International Journal of Production Research, 51, 5683–5695. 10.1080/00207543.2013.776186Suche in Google Scholar
Macher, J. T. (2006). Technological development and the boundaries of the firm: A knowledge-based examination in semiconductor manufacturing. Management Science, 52, 826–843. 10.1287/mnsc.1060.0511Suche in Google Scholar
Macher, J. T., Mowery, D. C., & Di Minin, A. (2007). The “non-globalization” of innovation in the semiconductor industry. California Management Review, 50, 217–242. 10.2307/41166425Suche in Google Scholar
Mack, C. A. (2011). Fifty years of Moore’s law. IEEE Transactions on Semiconductor Manufacturing, 24, 202–207. 10.1109/TSM.2010.2096437Suche in Google Scholar
Makimoto, T. (2002). The hot decade of field programmable technologies. In: 2002 IEEE International Conference on Field-Programmable Technology, 2002. (FPT). Proceedings (pp. 3–6). IEEE. Suche in Google Scholar
Malone, M. S. (2014). The Intel trinity: How Robert Noyce, Gordon Moore, and Andy Grove Built the World as most important company. Harper Collins. Suche in Google Scholar
Mastromarco, C., & Simar, L. (2015). Effect of FDI and time on catching up: New insights from a conditional nonparametric frontier analysis. Journal of Applied Econometrics, 30(5), 826–847.10.1002/jae.2382Suche in Google Scholar
Mönch, L., Fowler, J. W., & Mason, S. J. (2012). Production planning and control for semiconductor wafer fabrication facilities: Modeling, analysis, and systems (p. 52). Springer Science & Business Media. 10.1007/978-1-4614-4472-5Suche in Google Scholar
Monteverde, K. (1995). Technical dialog as an incentive for vertical integration in the semiconductor industry. Management Science, 41, 1624–1638. 10.1287/mnsc.41.10.1624Suche in Google Scholar
Park, J. H., Chung, H., Kim, K. H., Kim, J. J., & Lee, C. (2021). The impact of technological capability on financial performance in the semiconductor industry. Sustainability, 13(2), 489. 10.3390/su13020489Suche in Google Scholar
Park, J. H., Kook, S. H., Im, H., Eum, S., & Lee, C. (2018). Fabless semiconductor firms’ financial performance determinant factors: Product platform efficiency and technological capability. Sustainability, 10(10), 3373. 10.3390/su10103373Suche in Google Scholar
Pellens, M., & Della Malva, A. (2018). Corporate science, firm value, and vertical specialization: Evidence from the semiconductor industry. Industrial and Corporate Change, 27(3), 489–505. 10.1093/icc/dtx040Suche in Google Scholar
Powell, D. M., Fu, R., Horowitz, K., Basore, P. A., Woodhouse, M., & Buonassisi, T. (2015). The capital intensity of photovoltaics manufacturing: Barrier to scale and opportunity for innovation. Energy & Environmental Science, 8(12), 3395–3408. 10.1039/C5EE01509JSuche in Google Scholar
Qiao, G., & Wang, Z. A. (2021). Vertical integration vs specialization: A nonparametric conditional efficiency estimate for the global semiconductor industry. Journal of Productivity Analysis, 56(2–3), 139–150. 10.1007/s11123-021-00616-xSuche in Google Scholar
Rastogi, A. P., Fowler, J. W., Carlyle, W. M., Araz, O. M., Maltz, A., & Büke, B. (2011). Supply network capacity planning for semiconductor manufacturing with uncertain demand and correlation in demand considerations. International Journal of Production Economics, 134(2), 322–332. 10.1016/j.ijpe.2009.11.006Suche in Google Scholar
Saha, S. K. (2015). Emerging business trends in the microelectronics industry. Open Journal of Business and Management, 4(1), 105–113. 10.4236/ojbm.2016.41012Suche in Google Scholar
Sarma, S., & Sun, L. (2017). The genesis of fabless business model: Institutional entrepreneurs in an adaptive ecosystem. Asia Pacific Journal of Management, 34, 587–617. 10.1007/s10490-016-9488-6Suche in Google Scholar
Sher, P. J., & Yang, P. Y. (2005). The effects of innovative capabilities and R&D clustering on firm performance: The evidence of Taiwanese semiconductor industry. Technovation, 25(1), 33–43. 10.1016/S0166-4972(03)00068-3Suche in Google Scholar
Shin, N., Kraemer, K., & Dedrick, J. (2017). R&D and firm performance in the semiconductor industry. Industry and Innovation, 24, 280–297. 10.1080/13662716.2016.1224708Suche in Google Scholar
Simar, L., & Vanhems, A. (2012). Probabilistic characterization of directional distances and their robust versions. Journal of Econometrics, 166, 342–354. 10.1016/j.jeconom.2011.10.002Suche in Google Scholar
Simar, L., & Wilson, P. W. (2007). Estimation and inference in two-stage, semi-parametric models of productive efficiency. Journal of Econometrics, 136, 31–64. 10.1016/j.jeconom.2005.07.009Suche in Google Scholar
Simar, L., & Wilson, P. W. (2011). Two-stage DEA: Caveat emptor. Journal Productivity Analysis, 36, 205–218. 10.1007/s11123-011-0230-6Suche in Google Scholar
Simar, L., & Wilson, P. W. (2015). Statistical approaches for non-parametric frontier models: A guided tour. International Statistical Review, 83, 77–110. 10.1111/insr.12056Suche in Google Scholar
Simar, L., & Wilson, P. W. (2020). Hypothesis testing in nonparametric models of production using multiple sample splits. Journal Productivity Analysis, 53, 287–303. 10.1007/s11123-020-00574-wSuche in Google Scholar
Sueyoshi, T., & Ryu, Y. (2020). Performance assessment of the semiconductor industry: Measured by DEA environmental assessment. Energies, 13(22), 5998. 10.3390/en13225998Suche in Google Scholar
Tan, H., & Mathews, J. A. (2010). Cyclical industrial dynamics: The case of the global semiconductor industry. Technological Forecasting & Social Change, 77, 344–353. 10.1016/j.techfore.2009.08.003Suche in Google Scholar
Tsai, C. H., Wu, H. Y., Chen, I. S., Chen, J. K., & Ye, R. W. (2017). Exploring benchmark corporations in the semiconductor industry based on efficiency. Journal of High Technology Management Research, 28, 188–207. 10.1016/j.hitech.2017.10.007Suche in Google Scholar
VerWey, J. (2019). Chinese semiconductor industrial policy: Past and present. J. Int’l Com. & Econ., 1. Suche in Google Scholar
Walheer, B., & He, M. (2020). Technical efficiency and technology gap of the manufacturing industry in China: Does firm ownership matter?. World Development, 127, 104769. 10.1016/j.worlddev.2019.104769Suche in Google Scholar
Wilson, P. W. (2008). FEAR 1.0: A software package for frontier efficiency analysis with R. Socio-Economic Planning Sciences, 42, 247–254. 10.1016/j.seps.2007.02.001Suche in Google Scholar
Wilson, P. W. (2012). Asymptotic properties of some non-parametric hyperbolic efficiency estimators. Exploring research frontiers in contemporary statistics and econometrics: A Festschrift for Léopold Simar (pp. 115–150). 10.1007/978-3-7908-2349-3_6Suche in Google Scholar
Wilson, P. W. (2018). Dimension reduction in nonparametric models of production, European Journal of Operational Research, 267, 349–367. 10.1016/j.ejor.2017.11.020Suche in Google Scholar
Wu, W. Y., Tsai, H. J., Cheng, K. Y., & Lai, M. (2006). Assessment of intellectual capital management in Taiwanese IC design companies: Using DEA and the Malmquist productivity index. R&D Management, 36, 531–545. 10.1111/j.1467-9310.2006.00452.xSuche in Google Scholar
Zhou, X., Chen, H., Chai, J., Wang, S., & Lev, B. (2020). Performance evaluation and prediction of the integrated circuit industry in China: A hybrid method. Socio-Economic Planning Sciences, 69, 100712. 10.1016/j.seps.2019.05.003Suche in Google Scholar
© 2024 the author(s), published by De Gruyter
This work is licensed under the Creative Commons Attribution 4.0 International License.
Artikel in diesem Heft
- Regular Articles
- Political Turnover and Public Health Provision in Brazilian Municipalities
- Examining the Effects of Trade Liberalisation Using a Gravity Model Approach
- Operating Efficiency in the Capital-Intensive Semiconductor Industry: A Nonparametric Frontier Approach
- Does Health Insurance Boost Subjective Well-being? Examining the Link in China through a National Survey
- An Intelligent Approach for Predicting Stock Market Movements in Emerging Markets Using Optimized Technical Indicators and Neural Networks
- Analysis of the Effect of Digital Financial Inclusion in Promoting Inclusive Growth: Mechanism and Statistical Verification
- Effective Tax Rates and Firm Size under Turnover Tax: Evidence from a Natural Experiment on SMEs
- Re-investigating the Impact of Economic Growth, Energy Consumption, Financial Development, Institutional Quality, and Globalization on Environmental Degradation in OECD Countries
- A Compliance Return Method to Evaluate Different Approaches to Implementing Regulations: The Example of Food Hygiene Standards
- Panel Technical Efficiency of Korean Companies in the Energy Sector based on Digital Capabilities
- Time-varying Investment Dynamics in the USA
- Preferences, Institutions, and Policy Makers: The Case of the New Institutionalization of Science, Technology, and Innovation Governance in Colombia
- The Impact of Geographic Factors on Credit Risk: A Study of Chinese Commercial Banks
- The Heterogeneous Effect and Transmission Paths of Air Pollution on Housing Prices: Evidence from 30 Large- and Medium-Sized Cities in China
- Analysis of Demographic Variables Affecting Digital Citizenship in Turkey
- Green Finance, Environmental Regulations, and Green Technologies in China: Implications for Achieving Green Economic Recovery
- Coupled and Coordinated Development of Economic Growth and Green Sustainability in a Manufacturing Enterprise under the Context of Dual Carbon Goals: Carbon Peaking and Carbon Neutrality
- Revealing the New Nexus in Urban Unemployment Dynamics: The Relationship between Institutional Variables and Long-Term Unemployment in Colombia
- The Roles of the Terms of Trade and the Real Exchange Rate in the Current Account Balance
- Cleaner Production: Analysis of the Role and Path of Green Finance in Controlling Agricultural Nonpoint Source Pollution
- The Research on the Impact of Regional Trade Network Relationships on Value Chain Resilience in China’s Service Industry
- Social Support and Suicidal Ideation among Children of Cross-Border Married Couples
- Asymmetrical Monetary Relations and Involuntary Unemployment in a General Equilibrium Model
- Job Crafting among Airport Security: The Role of Organizational Support, Work Engagement and Social Courage
- Does the Adjustment of Industrial Structure Restrain the Income Gap between Urban and Rural Areas
- Optimizing Emergency Logistics Centre Locations: A Multi-Objective Robust Model
- Geopolitical Risks and Stock Market Volatility in the SAARC Region
- Trade Globalization, Overseas Investment, and Tax Revenue Growth in Sub-Saharan Africa
- Can Government Expenditure Improve the Efficiency of Institutional Elderly-Care Service? – Take Wuhan as an Example
- Media Tone and Earnings Management before the Earnings Announcement: Evidence from China
- Review Articles
- Economic Growth in the Age of Ubiquitous Threats: How Global Risks are Reshaping Growth Theory
- Efficiency Measurement in Healthcare: The Foundations, Variables, and Models – A Narrative Literature Review
- Rethinking the Theoretical Foundation of Economics I: The Multilevel Paradigm
- Financial Literacy as Part of Empowerment Education for Later Life: A Spectrum of Perspectives, Challenges and Implications for Individuals, Educators and Policymakers in the Modern Digital Economy
- Special Issue: Economic Implications of Management and Entrepreneurship - Part II
- Ethnic Entrepreneurship: A Qualitative Study on Entrepreneurial Tendency of Meskhetian Turks Living in the USA in the Context of the Interactive Model
- Bridging Brand Parity with Insights Regarding Consumer Behavior
- The Effect of Green Human Resources Management Practices on Corporate Sustainability from the Perspective of Employees
- Special Issue: Shapes of Performance Evaluation in Economics and Management Decision - Part II
- High-Quality Development of Sports Competition Performance Industry in Chengdu-Chongqing Region Based on Performance Evaluation Theory
- Analysis of Multi-Factor Dynamic Coupling and Government Intervention Level for Urbanization in China: Evidence from the Yangtze River Economic Belt
- The Impact of Environmental Regulation on Technological Innovation of Enterprises: Based on Empirical Evidences of the Implementation of Pollution Charges in China
- Environmental Social Responsibility, Local Environmental Protection Strategy, and Corporate Financial Performance – Empirical Evidence from Heavy Pollution Industry
- The Relationship Between Stock Performance and Money Supply Based on VAR Model in the Context of E-commerce
- A Novel Approach for the Assessment of Logistics Performance Index of EU Countries
- The Decision Behaviour Evaluation of Interrelationships among Personality, Transformational Leadership, Leadership Self-Efficacy, and Commitment for E-Commerce Administrative Managers
- Role of Cultural Factors on Entrepreneurship Across the Diverse Economic Stages: Insights from GEM and GLOBE Data
- Performance Evaluation of Economic Relocation Effect for Environmental Non-Governmental Organizations: Evidence from China
- Functional Analysis of English Carriers and Related Resources of Cultural Communication in Internet Media
- The Influences of Multi-Level Environmental Regulations on Firm Performance in China
- Exploring the Ethnic Cultural Integration Path of Immigrant Communities Based on Ethnic Inter-Embedding
- Analysis of a New Model of Economic Growth in Renewable Energy for Green Computing
- An Empirical Examination of Aging’s Ramifications on Large-scale Agriculture: China’s Perspective
- The Impact of Firm Digital Transformation on Environmental, Social, and Governance Performance: Evidence from China
- Accounting Comparability and Labor Productivity: Evidence from China’s A-Share Listed Firms
- An Empirical Study on the Impact of Tariff Reduction on China’s Textile Industry under the Background of RCEP
- Top Executives’ Overseas Background on Corporate Green Innovation Output: The Mediating Role of Risk Preference
- Neutrosophic Inventory Management: A Cost-Effective Approach
- Mechanism Analysis and Response of Digital Financial Inclusion to Labor Economy based on ANN and Contribution Analysis
- Asset Pricing and Portfolio Investment Management Using Machine Learning: Research Trend Analysis Using Scientometrics
- User-centric Smart City Services for People with Disabilities and the Elderly: A UN SDG Framework Approach
- Research on the Problems and Institutional Optimization Strategies of Rural Collective Economic Organization Governance
- The Impact of the Global Minimum Tax Reform on China and Its Countermeasures
- Sustainable Development of Low-Carbon Supply Chain Economy based on the Internet of Things and Environmental Responsibility
- Measurement of Higher Education Competitiveness Level and Regional Disparities in China from the Perspective of Sustainable Development
- Payment Clearing and Regional Economy Development Based on Panel Data of Sichuan Province
- Coordinated Regional Economic Development: A Study of the Relationship Between Regional Policies and Business Performance
- A Novel Perspective on Prioritizing Investment Projects under Future Uncertainty: Integrating Robustness Analysis with the Net Present Value Model
- Research on Measurement of Manufacturing Industry Chain Resilience Based on Index Contribution Model Driven by Digital Economy
- Special Issue: AEEFI 2023
- Portfolio Allocation, Risk Aversion, and Digital Literacy Among the European Elderly
- Exploring the Heterogeneous Impact of Trade Agreements on Trade: Depth Matters
- Import, Productivity, and Export Performances
- Government Expenditure, Education, and Productivity in the European Union: Effects on Economic Growth
- Replication Study
- Carbon Taxes and CO2 Emissions: A Replication of Andersson (American Economic Journal: Economic Policy, 2019)