Government Expenditure, Education, and Productivity in the European Union: Effects on Economic Growth
-


Abstract
In this article, we will analyse the effects of public spending on education on productivity, wages, and growth at European Union level. We are trying to find out to what extent education expenditures and human capital contribute to improving productivity, achieving higher wages, and enhancing the standard of living of the population, as measured by per capita growth. Our results do not show a clear and direct relationship between public expenditure on education and productivity, but an indirect relationship through the acquisition of a higher level of human capital and technological skills, which leads to output increases.
1 Introduction
Among the areas in which equality should be a primary objective is education, since the development of human capital favours wage redistribution and the satisfaction of people (Albert & Davia, 2005). This is achieved, basically, through the improvement of the opportunities for insertion in the labour market, the economic position, and the social condition of the individual, reducing income disparity and social inequality (Lathapipat, 2016).
The number of highly educated people has increased notably in the last decades, which has translated into significant economic growth. This fact is closely related to the advances of technology, which in turn has a clear relationship with increases in human capital. Given that investment in human capital is nearly linked to spending on education, many countries have undertaken reforms in recent years and, consequently, spending per student has grown significantly on average in OECD countries. However, the impact of education on development varies widely among countries due to differences in the institutional environment. The marginal performance of education may decline, as the supply of skilled labour expands while demand remains stagnant, due to lower educational quality (Pritchett, 2001).
But there is recognized consensus on that investing in education is important to achieve positive results in terms of redistribution and equality, although it has received limited attention in comparative research on welfare states (West & Nikolai, 2013). In this article, we will analyse the effects of public spending on education on productivity, wages, and growth at the European Union (EU) level. We try to find out to what extent spending on education and human capital contributes to improving productivity, achieving higher wages, and improving the standard of living of the population, measured by per capita growth. As far as we know, empirical studies do not analyse the effects of education spending simultaneously with productivity, wage gains, and per capita growth. Therefore, we will address these issues in this article.
First, the academic literature will be reviewed focusing on the impact of public spending on education on human capital development. Later, to perform the quantitative analysis, we will use the methodologies for cointegrated panel data, dynamic ordinary least squares (DOLS) and fully modified ordinary least squares (FMOLS), that solve the problem of endogeneity and eliminate small sample bias. In this study, data on the variables of interest shall be obtained from Eurostat.
The structure of this article is as follows. The empirical literature on the subject will be reviewed in Section 2. The methodology and exploratory analysis of the data are presented in Section 3. The empirical application and results will be discussed in Section 4. Finally, Section 5 shows some conclusions, limitations, and extensions of the work.
2 The Determinant Drivers: Some Literature on the Issue
To guide the literature review, we will group the studies into four blocks. The first of these provides an overview of the empirical analyses relating human capital to economic growth. The second block comprises those that relate the development of human capital to the reduction of inequalities. Finally, the third and fourth blocks review the studies that link the educational level of the population with productivity and those that try to measure the efficiency of spending on education, respectively.
2.1 The Relationship Between Human Capital and Economic Growth
The acquisition of knowledge and skills by individuals is a form of capital holding that, like other types of capital, is acquired through an investment process. As Becker (1962, 1964) said, education and training are the most important investments in human capital.
A large number of studies focusing on the theory of human capital confirm its relevance. The relationship between human capital and economic growth has been studied by authors such as Barro (2001), Becker (1964), De la Fuente and Doménech (2006), Frank (1960), Galor and Tsiddon (1997), Krueger and Lindahl (2001), Lucas (1988), Mankiw et al. (1992), Mincer (1984), Romer (1986, 1989), Schultz (1961), Stokey (1991) or Weisbrod (1962), among others.
Among the results obtained by empirical approaches, it is found that education generates positive externalities that give rise to private and social returns. A wide range of studies found that increases in school enrolment, as well as the increases in highly skilled workers, raise GDP per capita and productivity. For example, Angrist and Krueger (1991), Bassani and Scarpetta (2001), Card (2001), Denison (1985), Dickson (2013), Griliches (1997), Gurney and Englander (1994), Jenkins (1995), Nelson and Phelps (1966), and Pritchett (2001) to name a few.
Regarding the fact that education can promote both private and social benefits, Krueger (1999) stressed that the literature shows two important conclusions. First, the initial stock of human capital is more relevant than that of physical capital. Second, secondary and post-secondary education are more important than primary education.
Along these lines, Funke and Strulik (2000) observed that physical capital contributes greatly to the growth of per capita income in the early stages of development, but it is through the accumulation of knowledge (through continuing education and training) that progress is made towards higher stages of economic development. Later, Krueger and Lindahl (2001) showed that technological progress is related to an expansion of human capital when starting from high levels of it, while crime reduction or well-informed political decision-making are related to the development of human capital from lower levels.
As Barro (2002) stated, the difference between prosperity and poverty for a country depends on how fast it grows in the long run. This author revealed that for a specific level of initial per capita GDP obtained with a higher proportion of human capital than physical capital, it tends to promote higher growth through two channels: the absorption of more developed technologies facilitated by more developed human capital and the difficulty of adjusting human capital, as opposed to physical. This implies that countries with a higher proportion of human capital relative to physical capital tend to grow faster by adjusting the amount of physical capital upwards.
Fleisher et al. (2010) established a positive link between investments in human capital, specifically higher education, and economic growth, particularly in the outer regions of China. In a different context, Hanushek (2013) emphasized the significance of cognitive skills and educational quality in driving long-term economic growth. More recently, Lim et al. (2018) introduce a comprehensive global measure of human capital, assessing the combined impact of education and health as critical determinants for economic growth.
From a labour market perspective, Teixeira and Queirós (2016) addressed the need to align a well-educated workforce with specific industries for sustained economic development. In this context, Cinnirella and Streb (2017) reveal the vital role of boosting human capital, particularly through basic education, for the ongoing economic growth, improved labour productivity and accelerated technological change.
From another point of view, it is worth noting that public institutions play a central role in the investment in human capital. Sylwester (2000) reveal that income inequality primarily drives public education expenditures, positively correlated with future economic growth but negatively impacting contemporaneous growth. Blankenau and Simpson (2004) argue that while public expenditures positively affect economic growth, this impact may diminish or negate under certain conditions, depending on factors like government spending, tax structure, and production technologies. The expansion of higher education globally, driven by institutional processes, underscores a societal shift where education is acknowledged as indispensable “human capital” for unrestricted progress (Schofer & Meyer, 2005). This evolution highlights the vital link between institutions and the interdependence of human capital with economic development. Tsai et al. (2010) corroborate these findings, noting differences between developed and developing countries. Similarly, Nissan et al. (2011) identifies a direct and indirect association between institutional quality and human capital development. From the same perspective, Dias and Tebaldi (2012) delve into the relationship between human capital, institutions, and economic growth. Ramos et al. (2012), from a novel perspective, discover, based on microdata in the EU, that human capital, measured as overeducation, contributes to economic growth.
Qadri and Waheed (2013) highlight positive returns on investment in human capital for both lower-income and higher-income countries, with the former experiencing greater benefits. Churchill et al. (2015) find that government education expenditure positively influences economic growth in developed countries but not in less developed ones, with government health expenditure exhibiting a negative growth effect. In this regard, Affandi et al. (2019) assert that human capital is a key driver for economic growth.
Nowadays, regarding our research goal, the case of the EU-27 countries, we could obtain some information on the relationship between spending on education and the evolution of GDP per capita, looking at the data.
In Figures 1–4, we can see the evolution of public spending on education in the European countries and the EU average. Given the reference of the EU average, it is easy to perceive the heterogeneous pattern of the expenditure in education. In the Western group, the data from Ireland follow a descendent evolution. In the Norther group, most of the countries exhibit figures above the EU average. We found the opposite when looking at Central and Southern countries. However, with the exception of Cyprus, Malta, Poland, and Slovenia, the rest of the countries show figures below the EU average for most of the years.
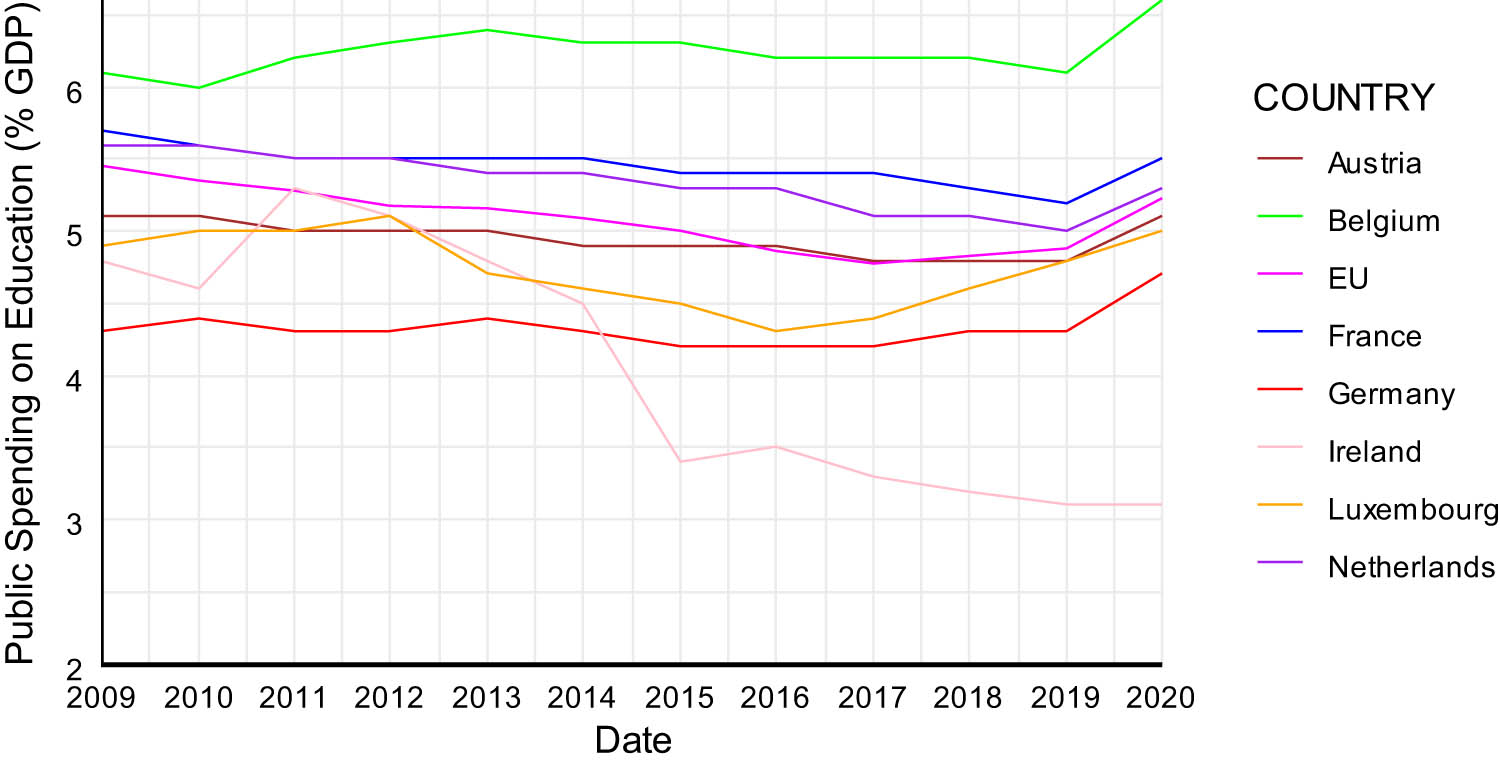
Public spending on Education in Western Europe (2009–2020). Source: Own elaboration based on Eurostat data.

Public spending on Education in Northern Europe (2009–2020). Source: Own elaboration based on Eurostat data.
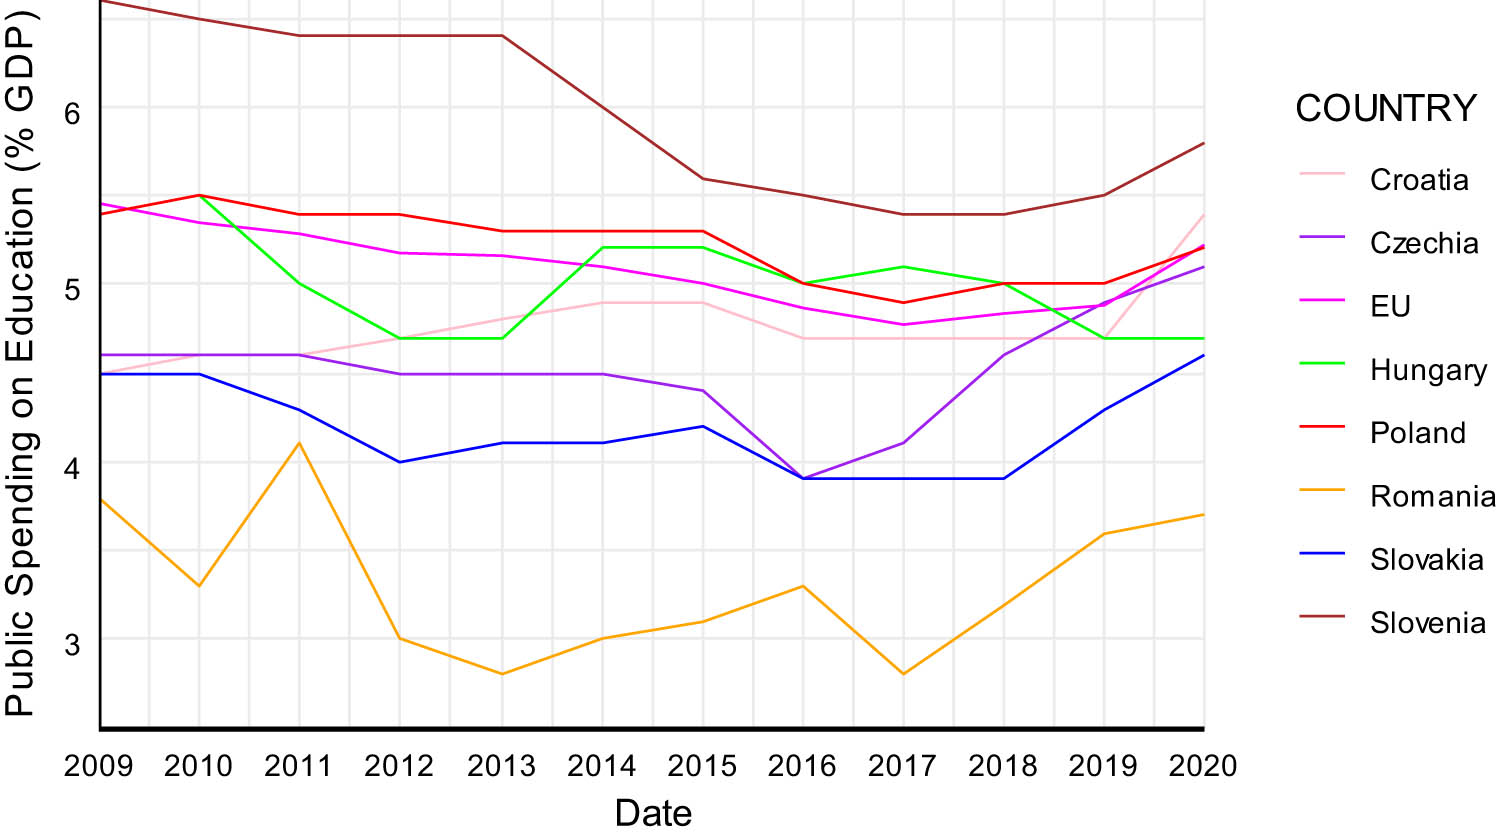
Public spending on Education in Central Europe (2009–2020). Source: Own elaboration based on Eurostat data.

Public spending on Education in Southern Europe (2009–2020). Source: Own elaboration based on Eurostat data.
Figures 5–8 show the growth of GDP per capita for the same groups of European countries. The impressive increase of GDP for the case of Ireland, reaching the maximum in 2015, is remarkable. Even in 2020, the year of the crisis of COVID-19, Ireland show a figure above the rest of the countries and that of the UE average. Regarding the Norther countries, the evolution of GDP per capita reveals a rapid recovery after the financial crisis of 2008, reaching positive values around the EU average for the rest of the period. For Central and Southern countries, the recovery begins some years later, around 2012 and 2013. But the evolution is irregular when we look at the entire period. In all the countries or that two groups, the GDP per capita figures sharply decline in 2019.

Real GDP per capita growth rate in Western Europe (%) (2009–2020). Source: Own elaboration based on Eurostat data.
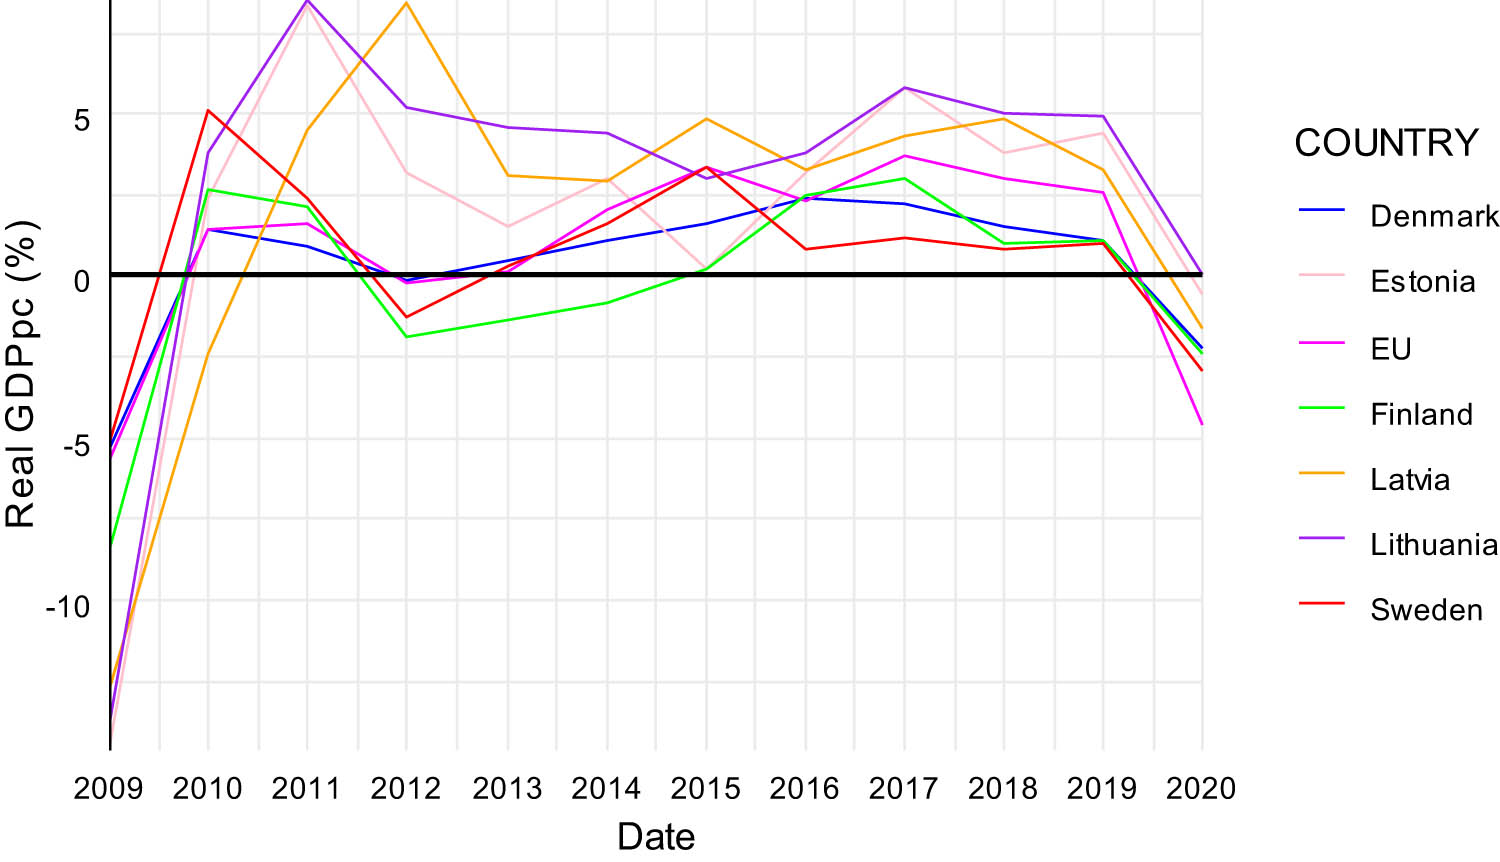
Real GDP per capita growth rate in Northern Europe (%) (2009–2020). Source: Own elaboration based on Eurostat data.

Real GDP per capita growth rate in Central Europe (%) (2009–2020). Source: Own elaboration based on Eurostat data.
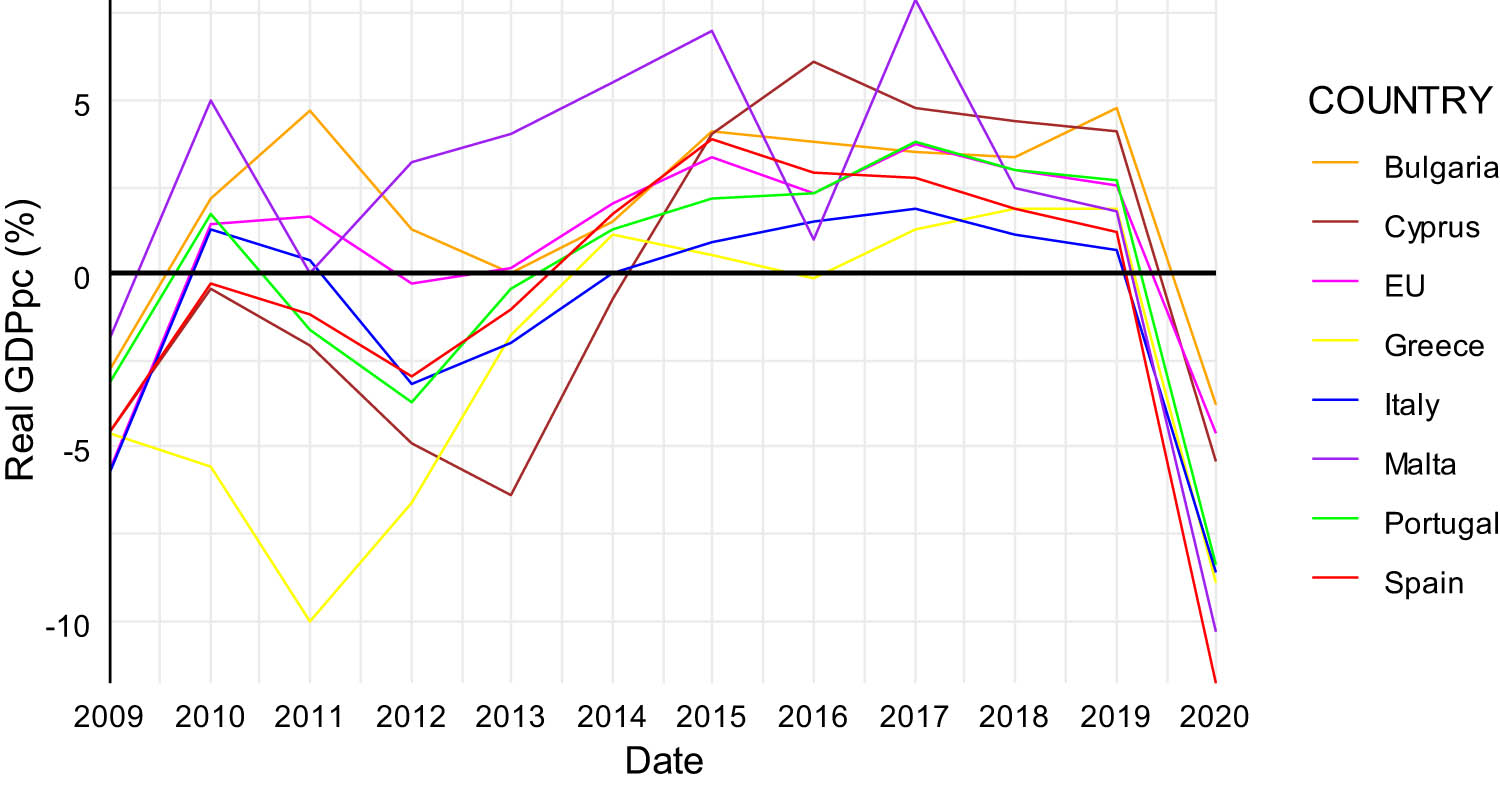
Real GDP per capita growth rate in Southern Europe (%) (2009–2020). Source: Own elaboration based on Eurostat data.
2.2 The Human Capital and the Reduction of Inequalities
Barro and Lee (2013) argued that the level and the distribution of educational achievements also have effects on social progress. Hence, the acquisition of human capital and its contribution to reducing inequalities has also been studied by various authors such as Benabou (1996), Castelló and Doménech (2014), Chani et al. (2014), Checchi (2006), Glomm and Ravikumar (1992), or Murphy and Topel (2016). According to Le Grand (2018), education is the great equalizer of the conditions of men and women.
But despite the enormous development of economies achieved by many countries, manifested in aspects such as convergence in the increase in life expectancy, or the accumulation of human capital, there are still notable differences between rich and poor. Schultz (1961) stated that investment in human capital accounts for most of the impressive increase in real income per worker. On this subject, Becker (1964) addressed that the incomes of the most educated people are almost always much higher than the average, although profits are generally higher in the least developed countries. This could be explained by the greater inequality of this group of countries. The starting assumption is that human capital development contributes to the reduction of inequality, which directly influences the economic growth.
As Castelló and Doménech (2008) showed, while the secondary school enrolment rate was almost 100% in rich countries, more than 70% of children in sub-Saharan Africa were not enrolled in secondary school and, therefore, entered the labour market as unskilled persons, workers since childhood.
One of the main objectives of growth in education spending is to reduce inequality, which has a significant impact on aggregate output. Gradstein (2003) found that inequality in the distribution of public spending on education slows down long-term growth and that income inequality is also harmful in this sense. Viaene and Zilcha (2003) found, within a general equilibrium framework with human capital accumulation, the cross-country differences in income distribution. Specifically, among other variables, they found that education technology generates a cross-country variation in the equilibrium income distributions. Coady and Gupta (2012) revealed that income inequality has been expanding in many advanced economies since 1980. This is due to an array of variables such as the effects of globalisation on the wages of low-skilled workers, which are also adversely affected by technological change. According to Fredriksen (2012), inequality has increased within a “core” of eight European countries, where large income increases, among the top 10% of those earning, appear to be the main driver of this evolution. Along the same lines, Fournier and Johansson (2016) showed that public investment and education boost potential growth, while other social expenditures such as pensions and public subsidies reduce it. In addition, reforms aimed at improving the efficiency of the public sector, as well as educational reform that promotes completion of secondary education, would contribute to reducing income inequality.
The relationship between inequality and human capital can be analysed from a bidirectional perspective. In this regard, Sawicka and Stolarczyk (2018) found that equality of opportunities in the labour market, social life, education, and public life enhances the value of human capital, generating economic benefits while lack of such equality causes losses. As a driver of equal opportunities, education is a powerful tool for achieving social inclusion, which leads to a decrease in income inequality, promoting intergenerational mobility. Conversely, a higher per capita income, greater trade openness, and accelerated technological progress tend to contribute to heightened inequality in both income and education distribution (Lee & Lee, 2018). As an example of the importance of these arguments, the United Nations significantly incorporates these ideas into the Sustainable Development Goals promoting Quality Education as Goal No. 4, closely linked to No. 5: Gender Equality, No. 8: Decent Work and Economic Growth, and No. 10: Reducing Inequalities.
When studying inequality, most authors focus on wages as the variable to be analysed. But when measuring wages, the concentration of graduates in public sector employment is identified as a problem in growth studies. This problem lies in the fact that public sector wages do not normally reflect market wages (Pissarides, 2000). On the other hand, Psacharopoulos and Patrinos (2004) pointed out the growing concern of governments and other agencies in the educational reforms on returns, to guide macro-political decisions on the management and financing of educational reforms.
Although wages are an indicator of well-being, it is useful to analyse other factors such as job quality and satisfaction. In this sense, Albert and Davia (2005) found a strong relationship between education and satisfaction, explained by the link between education and job quality. However, the authors pointed out that this link is not conclusive due to salary expectations and characteristics. According to Castriota (2006), the higher the educational level, the less relevant is the absolute level of income for self-declaration of satisfaction with life. This explains why the pattern of southern European countries is more in line with common evidence (Albert & Davia, 2005).
2.3 Level of Education and Productivity
The traditional theory of human capital (Becker, 1962) conceives education as an investment in human capital, which favours greater workers’ productivity and greater returns in the form of better salaries. It is also worth highlighting the theory of signalling (Spence, 1973) according to which the educational level of the individual is an indicator of his productivity, and it is the cost of acquiring education (in monetary terms and effort), which differentiates the most productive workers from the rest. To contrast the predominance of those approaches, we found Chevalier et al. (2004) who ask themselves about the mechanism through which education translates into higher salaries. They found, at least in the case of the UK, that education raises productivity and that this fact predominates over the education as a signal.
A higher level of human capital provides a greater capacity to absorb new technologies and business techniques. In other words, the level of human capital, approximated as the educational level of the active population, can have an impact on productivity levels (what is known in the literature as “level-level effect”) and/or on the growth rates of this (“level-growth effect”). Specifically, the first effect is due to school returns, while the second is through innovation. Just as the accumulation of human capital produces income growth, so do the corresponding social or national aggregates (Mincer, 1984). In fact, both Barro (2001) and Lucas (1988) pointed out that the educational level can also affect productivity through different ways such as improving the capacity for innovation and the quality of the workforce.
Numerous studies have highlighted the importance of education on labour productivity. For instance, Benhabib and Spiegel (1994) found that productivity growth would be around 0.13% against a 1% increase in human capital. This fact has the strongest impact on regional productivity, with R&D stock showing a positive bi-directional causality (Bronzini & Piselli, 2009). In this sense, Becker (1964) had affirmed that the expansion of scientific and technical knowledge, which increases the productivity of labour and other inputs in production, is the reason for the persistent growth per capita in the United States, Japan, and European countries in the last hundred years. Consequently, there is a link between wage growth and education and training.
The growing number of skilled workers and the ability to absorb advanced innovations is related to productivity. For that reason, many studies have pointed to the relationship between human capital, measured as education attainment, and labour productivity. Moretti (2004) studied the magnitude of human capital spillovers and found that the productivity of firms increased as employed college graduates were employed. Bowlus and Robinson (2012) investigated human capital prices and quantities in the United States from 1963 to 2008, employing four education levels as skill types. They found a high correlation in human capital prices across different skill types, an increase in prices until the mid-1970s followed by a decline, and changes in human capital quantities explaining a substantial part of relative wage and total factor productivity evolution. Chansarn (2010) showed the suitability of education as a key factor in labour productivity by analysing 30 countries during the period 1981–2005. Later, Mason et al. (2012) found the same relationship, considering both certified and uncertified skills as drivers to improve labour productivity. However, these results are limited to individuals with higher education degrees.
For the case of EU and in most of the regions of Spain, De la Fuente (2011) found that social returns to investment in human capital were higher than those on physical capital. The same results were found by Benos and Karagiannis (2016), for the case of Greece, showing that human capital presents a strong positive association with productivity through upper secondary and tertiary education. In this sense, Barro and Lee (2013) argued that the level and distribution of educational achievement also have an impact on social and welfare outcomes, such as infant mortality, fertility, child education, and income distribution, in addition to social status, as Fershtman et al. (1996) had already pointed out. In addition, these authors stated that, in general, growth may be favoured by an increase in the number of workers investing in education. However, they found inefficiency in talent allocation. In this sense, and more recently, Vandenbussche et al. (2006) argued that an optimal composition of public spending on education is necessary, and this depends on the relative distance of the economy from the technological frontier. While Kampelmann et al. (2018) find that higher education credentials have a stronger effect on firms’ productivity than on wage cost. And, therefore, the room for employability increases for higher educated workers. More recently, Hansen et al. (2021) have examined the labour market returns of skill signals, finding that even when high grades initially translate into higher earnings, employers learn about workers productivity later. By exploring the linkages between innovation and economic growth, Biasi et al. (2021) address that a high-quality education, through building cognitive and non-cognitive skills, increases the productivity of students turning them into potential innovators.
After reviewing the empirical findings, we could ask ourselves about what current data, of the EU-27, could tell us about the level of education and productivity.
In Figures 9–12, we can see the evolution of labour productivity in the European countries and the EU average. The evolution of productivity shows a similar pattern to the previously observed for GDP per capita (Figure 5), drawing again attention the value reached in Ireland in 2015, and even Ireland shows figures above the EU average in 2019 and 2020. When looking at the Northern countries, they also exhibit a similar pattern to that of the GDP per capita evolution we have seen before (Figure 6). Paying attention to the Central and Southern countries, the most remarkable is the case of Greece, where labour productivity remains below the average, and below positive figures, for the whole period. The rest of the countries show trends oscillating around the EU average, but after 2019, labour productivities decline sharply in all the countries.

Labour productivity in Western Europe (%) (2009–2020). Source: Own elaboration based on Eurostat data.

Labour productivity in Northern Europe (%) (2009–2020). Source: Own elaboration based on Eurostat data.
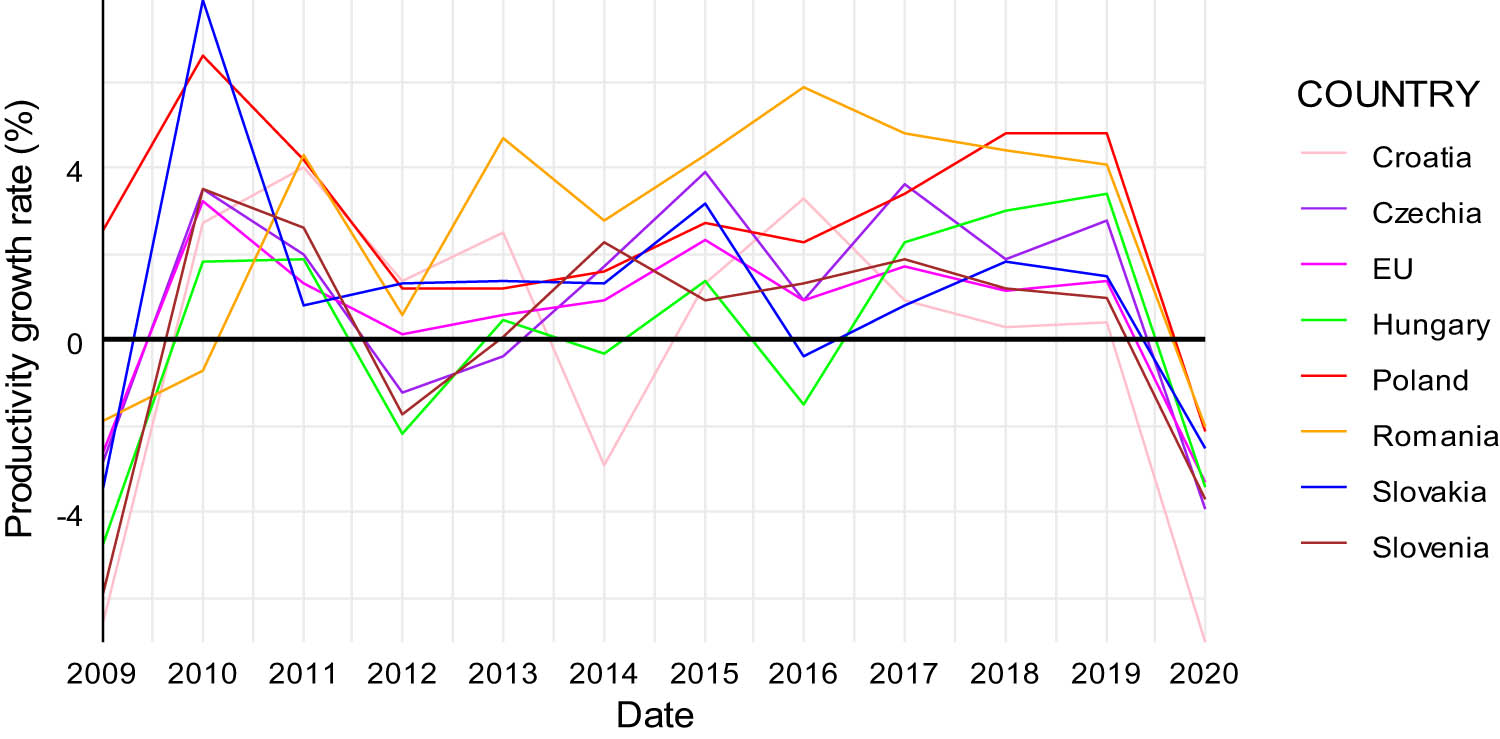
Labour productivity in Central Europe (%) (2009–2020). Source: Own elaboration based on Eurostat data.
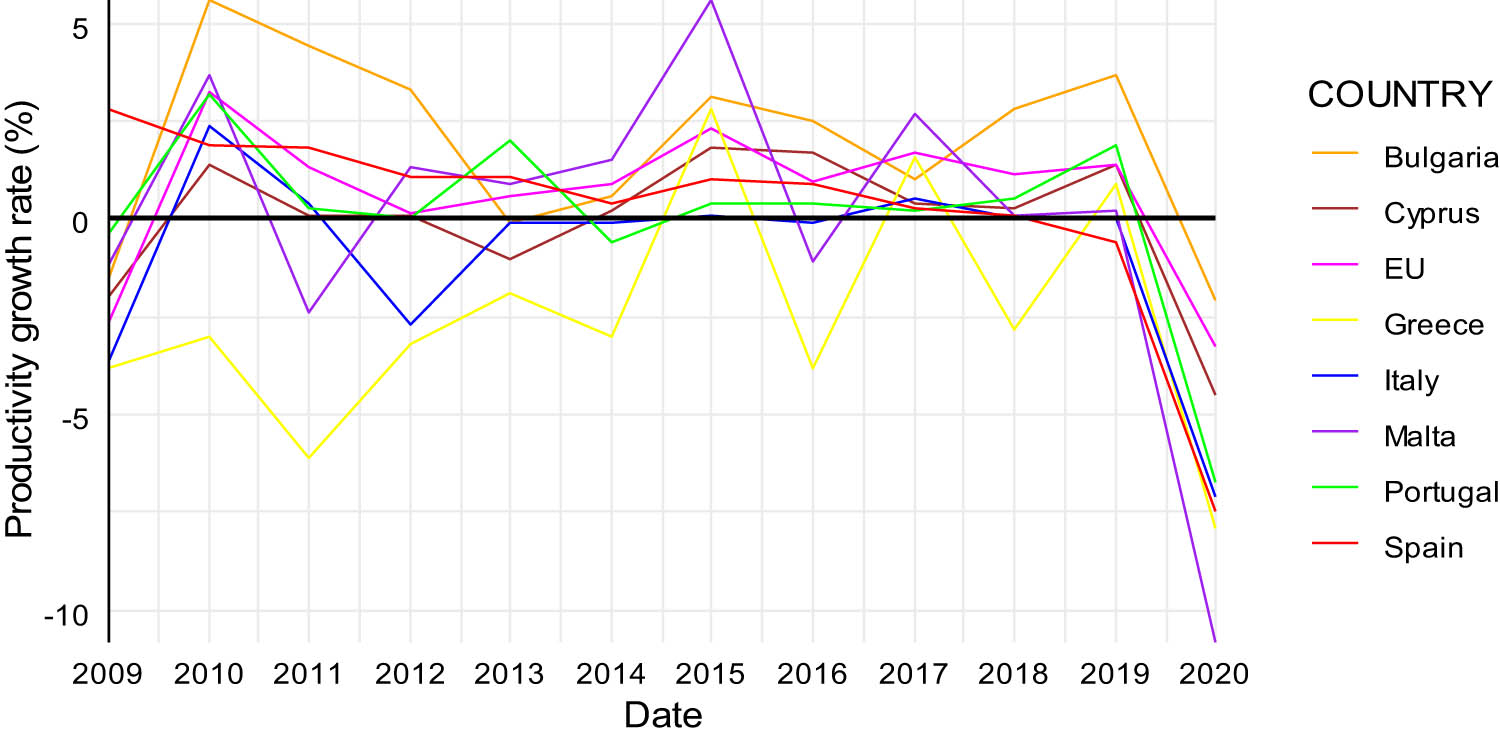
Labour productivity in Southern Europe (%) (2009–2020). Source: Own elaboration based on Eurostat data.
In Figures 13–16, we can see the evolution the attainment of tertiary education level in the European countries and the EU average. All the countries exhibit a growing trend of graduates in higher education level. In the Western and Northern countries, with the exception of Germany from 2013 onwards, all the countries show figures above the EU average. On the contrary, among the Central and Southern countries, only Cyprus and Spain exhibit figures above the EU average.
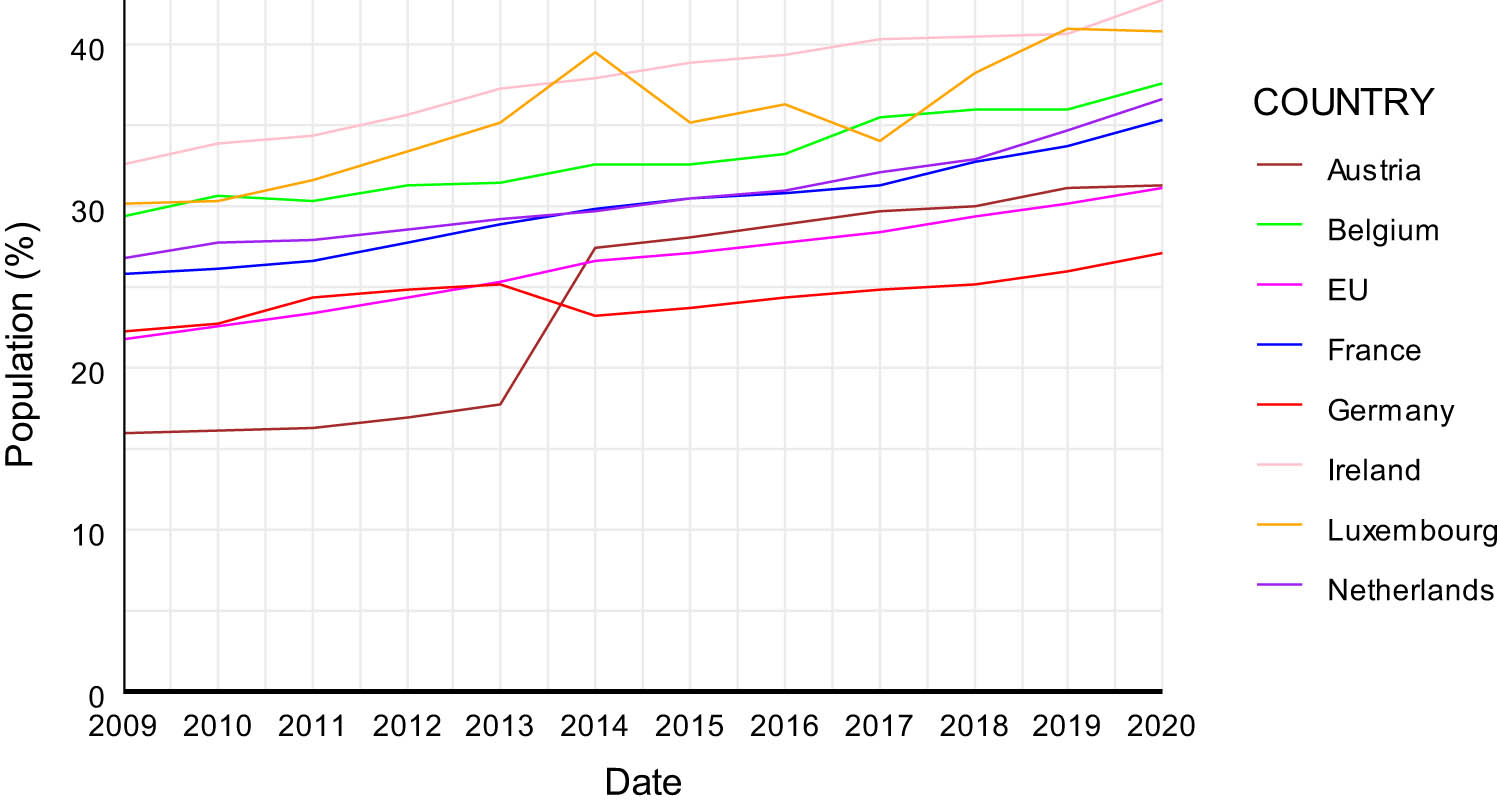
Population with tertiary education in Western Europe (2009–2020). Source: Own elaboration based on Eurostat data.
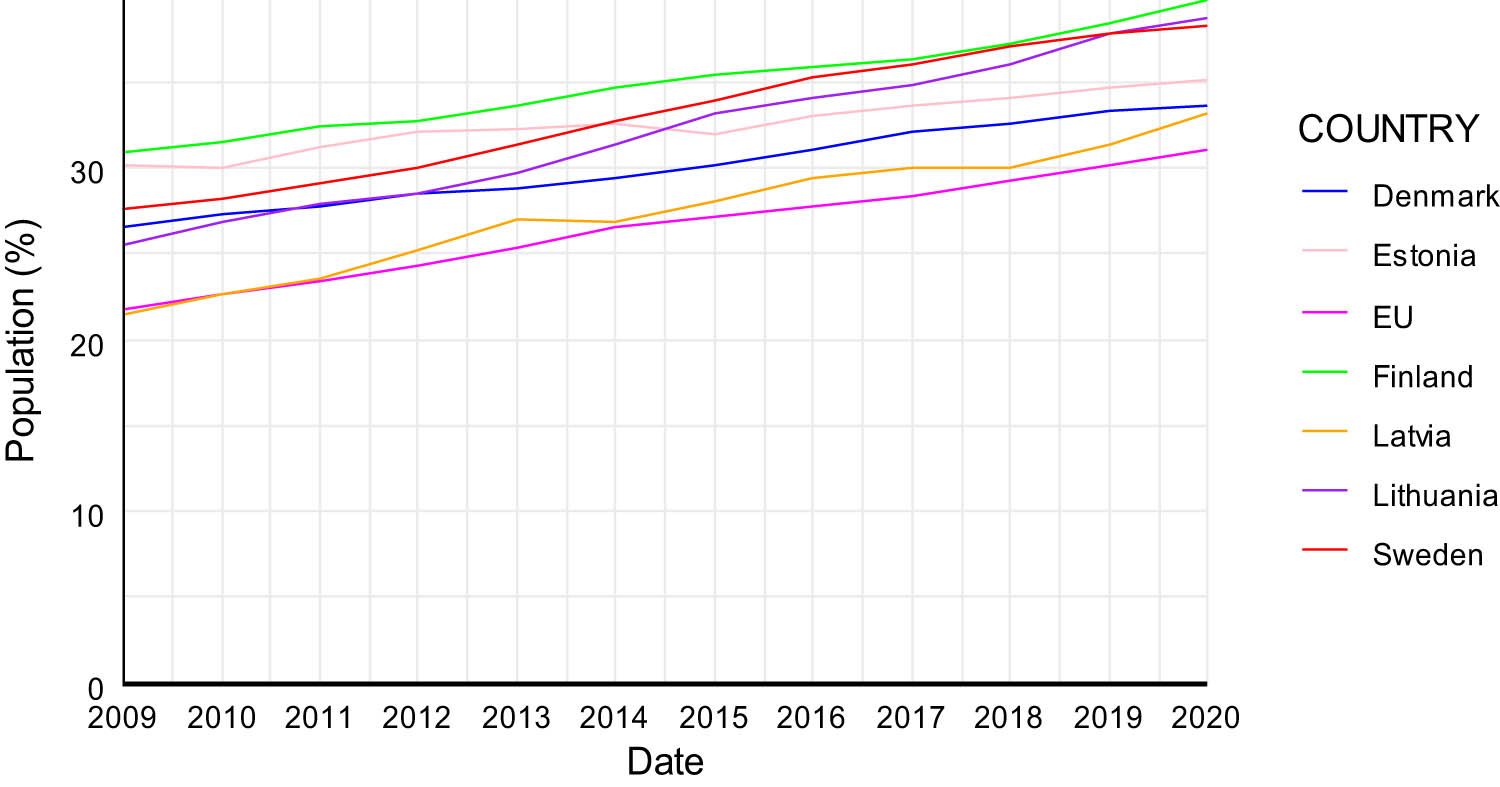
Population with tertiary education in Northern Europe (2009–2020). Source: Own elaboration based on Eurostat data.

Population with tertiary education in Central Europe (2009–2020). Source: Own elaboration based on Eurostat data.
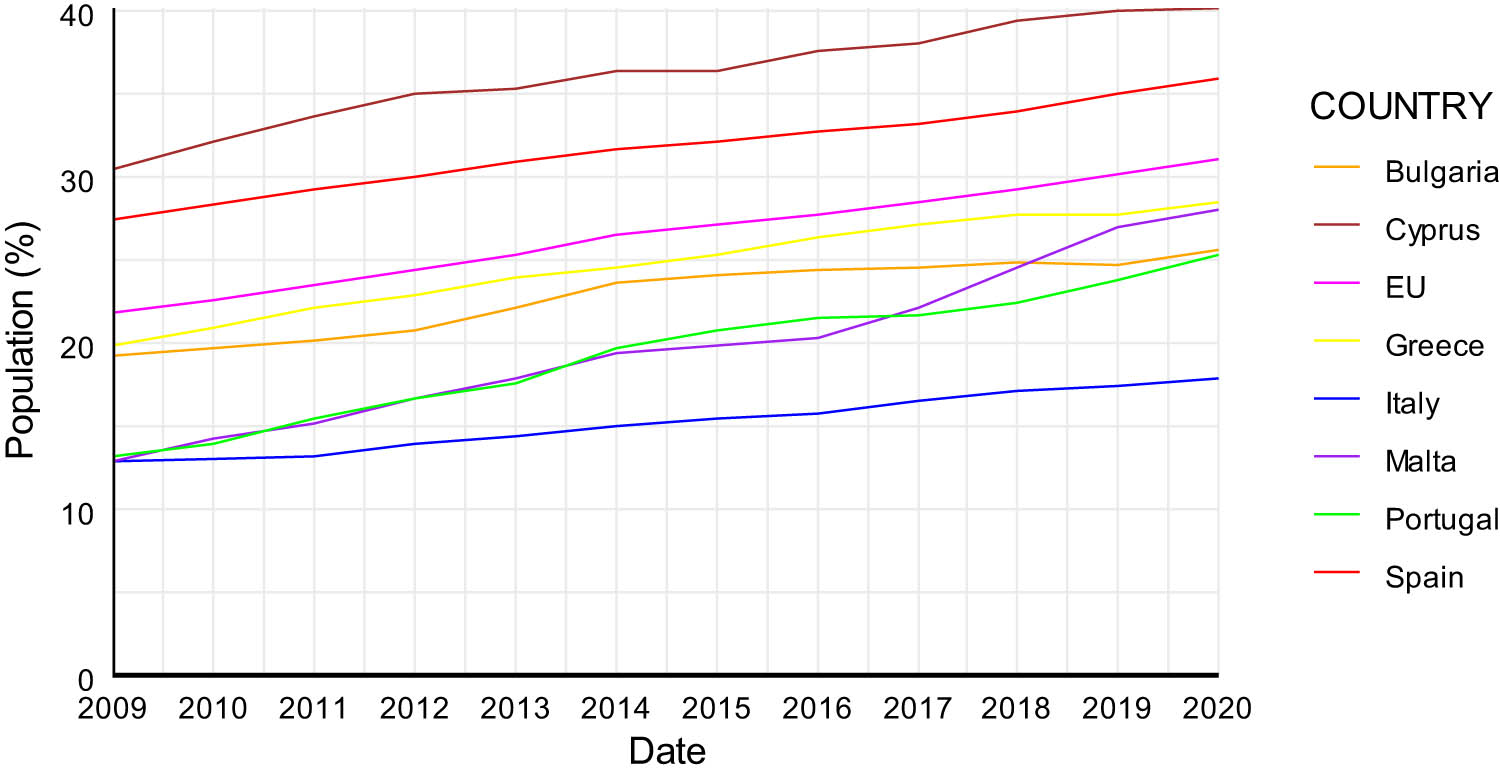
Population with tertiary education in Southern Europe (2009–2020). Source: Own elaboration based on Eurostat data.
If we look jointly the figures for high education levels and those of labour productivity, we can observe that the data do not reveal a similar evolution of that variables for most of the countries.
2.4 The Efficiency of Spending on Education
When education succeeds in improving human capital endowment and thus productivity, it is concluded that education funding has been efficient. Education spending decisions are closely related to efficiency, which has been extensively studied.
Many studies have found a positive relation between education spending and outcomes. In this regard, subsides are a key factor for promoting economic growth (Blankenau, 2005). Despite many studies emphasize the positive relationship between educational expenditure and academic outcomes, it is crucial to use resources efficiently. Furthermore, an intricate understanding of the nexus between education and economic growth needs a nuanced distinction between the quantitative and qualitative dimensions of educational provision. This differentiation holds pivotal implications for research on educational efficiency, given the inherent challenges in measuring the qualitative aspects of education as opposed to its quantitative aspects.
According to Taylor (1994), the losses attributable to inefficiencies in secondary education likely constitute less than 1% of potential GDP. Authors such as Sutherland et al. (2007) found a weak relationship between educational achievement and increased availability of resources, which can be explained by international differences in efficiency levels in primary and secondary education. In this regard, these authors stressed that there is significant scope for improving efficiency by moving towards best practices. Hence, analyses on the efficiency of spending on education are abundant. Rajkumar and Swaroop (2008) noted that the efficiency of education spending depends on the governance of countries, measured by the degree of corruption and the quality of bureaucracy. Mandl et al. (2008) and St. Aubyn et al. (2009) studied the case of EU states and found that outcomes varied across countries depending on the independence of institutions and educational policy decisions. Blankenau and Camera (2009) pointed out that an excess of subsidies increases the number of students but decreases the incentives of these to acquire skills. Annabi et al. (2011) showed that incentives for higher education can promote the accumulation of human capital and alleviate the negative effects of unemployment. But the final impact depends on how distortive alternative fiscal instruments are and on the degree of efficiency of education spending.
Hanushek and Woessman (2011) found that it is the institutional structure that determines the incentives and that the differences in the structures of the educational systems are those that condition for the attainment achieved by the students. Agasisti (2014) and Sibiano and Agasisti (2013) found that differences in the economic development of the regions influence the acquisition of human capital and that there is no linear relationship between increases in public spending on education and increases in educational attainment. Other factors related to the composition and distribution of expenditure should therefore be addressed.
On the other hand, Heckman and Mosso (2014) noted that schooling at all stages has a positive impact on health and wages, analysing a model with multiple schooling options that recognizes the fundamentally nonlinear effect of schooling on a variety of outcomes. It is a powerful reason for governments to increase investment in education. However, the effectiveness of education is necessary and may be reduced when spending decisions are not adequate (Kingdon et al., 2014).
Wolff (2015) analysed the relationship between public spending on education and the result of students. He found that it responds to an unbalanced growth model, given that the productivity and cost of components of the educational service (use of technological advances and teacher activity, for example) do not grow at the same pace. Dissou et al. (2016) concluded that different ways of financing education led to long-term growth, but that there are differences which can be observed in the short term and the transition to the long term. Hyman (2017) found that students who were exposed to a $1,000 rise in spending per year correlates with a 3.9% higher likelihood of college enrolment and a 2.5% higher likelihood of degree attainment. More recently, Canton et al. (2018) measured the efficiency of public spending on education in the EU and found different results depending on the functioning of the institutions.
In conclusion, the intricate relationship between education spending and outcomes underscores the need for careful consideration in resource allocation. Despite positive correlations between spending and indicators like college enrolment and degree attainment, the effectiveness of education is contingent upon the efficiency of spending decisions. Studies examining the efficiency of education spending reveal diverse outcomes across countries, influenced by factors such as governance, institutional structures, and economic development. It is crucial to address the composition and distribution of expenditure to maximize the societal impacts of education. In addition, recognizing the nonlinear impact of schooling on various outcomes emphasizes the importance of aligning spending decisions with the evolving dynamics of educational service components, technological advances, and teacher activities. As governments strive to enhance the effectiveness of education in promoting health and wages, thoughtful consideration of spending decisions remains paramount in navigating the complexities of education funding.
3 Methodology and Data
As indicated earlier, and in the light of the issues covered in the literature, we intend to analyse how public expenditure on education affects productivity, wages, and growth at EU level. We are trying to find out to what extent education expenditures and human capital contribute to improving productivity, achieving higher wages, and improving the standard of living of the population, as measured by per capita growth. To complete our objectives, we will estimate in a first approximation the following equations.
where t is the time reference (year), i is the member state, h is the level of education, and j is the level of government funding education. In the first equation, PRO represents the productivity of work per person to which, presumably contributes, public spending on education GPE, public spending on R&D in the education sector, GID, and employment in high-tech intensive sectors EST, and variable that collects those workers with the highest expected level of human capital.
On the other hand, in the second equation, average wage earnings, WEM, are related with productivity, PRO, with the educational level of the population, EDU, which approximates the level of human capital acquired, and the work experience measured by the years worked, EPL, which is supposed to be an alternative to educational training and allowing to acquire human capital. The variable EPL implicitly captures the self-training as well as the specific training provided by the company. Finally, the third equation considers that both productivity and educational attainment can contribute to improving the standard of living of the population, measured by GDP growth in per capita terms, CREpc.[1]
To perform the quantitative analysis, we will use the panel data estimation methodology. In this article, data on the variables of interest have been obtained from Eurostat. The sampling period extends from 2009 to 2020, years for which we find data on the relevant variables. As showed earlier, most of the minimum values of the data correspond to 2009, the year after the outbreak of the financial crisis of 2008, and some of them to 2020, the year of the COVID-19 crisis.
The implementation of panel data econometry allows us to combine the power of averaging cross-section with all the advantages of time dependence (Baltagi, 2008). Some of the strengths and limitations of using panel datasets are listed in the study by Hsiao (2003). The advantages with respect to a single cross-section or time series are as follows: (i) more precise inference of the parameters of the model, (ii) greater ability to capture the complexity of economic relations, (iii) more informative results, (iv) allows control of unobserved individual heterogeneity, and (v) simplifies calculation and statistical inference.
In this article, specifically, as a first approximation to analyse the effects of public spending on education on productivity, wages, and growth, we will apply the methodology of cointegrated panel estimates DOLS and FMOLS. We will check the existence of unitary roots and cointegration relations to identify the presence of long-term characteristics in each variable, as well as to detect if there are long-term relationships between them.
Estimates of cointegration equations following the DOLS and FMOLS approaches were proposed by Stock and Watson (1993), Kao and Chiang (2000) and Pedroni (1999, 2000); and Phillips and Moon (1999) and Pedroni (2001), respectively. These approaches allow quantifying the long-term relationship between the variables. Specifically, DOLS estimates solve the endogeneity problem, starting from one equation models with leads and lags of explanatory variables I (1) in first differences. They also eliminate the serial correlation present in standard ordinary least squares (OLS), which results in inconsistent estimates for cointegrated panel data (Dreger & Reimers, 2005). DOLS and FMOLS estimates have the advantage of correcting serial autocorrelation, as well as the possible endogeneity of the relationship between the variables.
Both the DOLS and FMOLS approaches solve the problem of endogeneity and eliminate small sample bias. In addition to being an alternative to other methods of estimating the cointegration relationship, DOLS prevents the lack of stationarity of the series (Phillips & Hansen, 1990; Stock & Watson, 1993). This is an additional advantage, given our sampling period, due to the lack of power of the unit root tests in small samples and the presence of structural changes that may raise doubts about the order of integration of the series. But the application of FMOLS requires that all variables must have the same order of integration and that regressors must not appear as cointegrated. In this sense, following Kao and Chiang (2000), DOLS provides better results than FMOLS estimators in terms of average biases. Although in this article, as a first approximation to our study, we will perform both estimation methods.
3.1 Variables and Dataset
As we have already stated, in our first empirical analysis, we have used time series of annual data taken from Eurostat, for the years 2009 to 2020 of the 27 EU member states,[2] for the following variables:
PRO: Work productivity per person. Real labour productivity per person, as a percentage of change over the previous year.
GPE: Public expenditure on education. Total general government expenditure on education as a percentage of GDP.
GID: Expenditure on R&D in the education sector, performed within the business enterprise sector. Total expenditure on research and development in the higher education sector as a percentage of GDP, regardless of the source of funds.
EST: Employment in technology intensive sectors. Employment in high technology and knowledge intensive sectors as a percentage of total employment.
WEM: Average wage gains. Average individual annual net earnings expressed in purchasing power parity units (PPS, purchasing power standard).
WRM: Average wage income. Income from wages and salaries as a percentage of GDP.
EDS: Educational level of the population, secondary level. Percentage of population with secondary and post-secondary education.
EDT: Educational level of the population, tertiary level. Percentage of population with tertiary education.
EPL: Work experience measured by the years worked. Average years worked, duration of working life.
CRP: GDP growth. Chained volumes of GDP at market prices, as a percentage change over the previous year.
CPC: Per capita GDP growth. Chained volumes of GDP at market prices, as a percentage change over the previous year, per capita.
Table 1 shows the main statistics of the series.
Statistics of the series. EU-27, 2009–2020
| PRO | GPE | GID | EST | WEM | WRM | EDS | EDT | EPL | CRP | CPC | |
|---|---|---|---|---|---|---|---|---|---|---|---|
| Mean | 0.61 | 5.09 | 0.41 | 4.15 | 18603.93 | 36.43 | 47.39 | 26.51 | 35.06 | 0.82 | 0.80 |
| Median | 0.70 | 5.10 | 0.35 | 4.00 | 19045.50 | 37.30 | 45.90 | 27.20 | 34.80 | 1.40 | 1.30 |
| Maximum | 20.20 | 7.10 | 1.04 | 9.20 | 33707.00 | 50.40 | 71.40 | 42.80 | 42.00 | 23.20 | 23.20 |
| Minimum | −10.80 | 2.80 | 0.04 | 1.80 | 5490.00 | 22.80 | 17.70 | 11.20 | 28.80 | −14.60 | −14.60 |
| Std. Dev. | 3.01 | 0.96 | 0.22 | 1.33 | 6943.53 | 5.11 | 11.78 | 7.47 | 2.79 | 4.01 | 4.02 |
| Skewness | 0.33 | 0.01 | 0.65 | 0.90 | 0.08 | −0.13 | −0.22 | −0.06 | 0.29 | −0.43 | −0.41 |
| Kurtosis | 9.00 | 2.36 | 2.86 | 4.22 | 1.87 | 2.90 | 2.39 | 2.03 | 2.44 | 7.01 | 6.94 |
| Jarque-Bera | 492.27 | 5.39 | 23.22 | 64.77 | 17.42 | 1.03 | 7.67 | 12.92 | 8.92 | 227.76 | 219.10 |
| Probability | 0.00 | 0.06 | 0.00 | 0.00 | 0.00 | 0.59 | 0.02 | 0.01 | 0.01 | 0.00 | 0.00 |
| Sum | 200.10 | 1649.40 | 132.87 | 1345.40 | 6027674 | 11803.80 | 15356.30 | 8590.60 | 11360.30 | 266.70 | 262.2000 |
| Sum Sq. Dev. | 2935.71 | 298.51 | 16.59 | 576.48 | 1.56 × 10¹⁰ | 8451.55 | 44878.98 | 18068.93 | 2518.27 | 5190.27 | 5220.632 |
| Observ. | 324 | 324 | 324 | 324 | 324 | 324 | 324 | 324 | 324 | 324 | 324 |
| Cross sect. | 27 | 27 | 27 | 27 | 27 | 27 | 27 | 27 | 27 | 27 | 27 |
If we look at the measures of position, the values for the mean and the median are quite close in all the series. It is remarkable that the maximum values for PRO, CRP, and CPC correspond to Ireland in 2015. The same occurs for Ireland in 2020, regarding EDT and EST. Those observations could anticipate, at least for the case of Ireland, that exists some relationship among tertiary education, employment in technology intensive sectors, productivity, and economic growth. On the contrary, the minimum values for those variables correspond to Malta in 2020, Estonia in 2009 (for CRP and CPC), Portugal in 2009 for EDS, and Romania in 2009 for EST. The maximum of GPE corresponds to Denmark in 2020 and the minimum to Romania in 2013. The same countries show the maximum and the minimum for GID in 2015 and 2020, respectively. Regarding the measures of WEM and WRM, for the average wage gains, Netherlands exhibit the maximum value in 2020, while Bulgaria the minimum in 2009; and for the average wage income, the maximum value corresponds to Denmark in 2009 and the minimum to Ireland in 2020. For the EDS, the maximum value corresponds to Czechia and the minimum to Portugal in 2009. Finally, for EPL, Sweden exhibits the maximum value in 2019 and 2020, while Hungary shows the minimum in 2009.Those statistics reveals the heterogeneity of the EU-27 standards along the period. That most of the minimum values correspond to 2009, the year after the outbreak of the financial crisis of 2008, and some of them to 2020, the year of the COVID-19 crisis. Regarding the dispersion of the data, the maximum value of the standard deviation can be observed for EDS, while the minimum for GID. The values for the skeweness are near zero but showing the maximum (0.9) for EST and the minimum (−0.41) for CPC. Looking at the kurtosis, the maximum corresponds to PRO and the minimum to WEM. Finally, when looking at the Jarque-Bera statistic, the null hypothesis of the normally distributed data should be rejected for most of the variables. Although given the relatively small size of the sample, we cannot reach a clear-cut conclusion about the normality of the distributions.
3.2 Some Preliminary Results
Before making the estimates, we will explore the cointegration relationships of the variables that are analysed for the group of individuals in the set (EU member states). To this end, as a preliminary study, we will check the order of integration of the series. For this, we will apply the tests conducted by Im et al. (2003), Levin et al. (2002), Maddala and Wu (1999) or Fisher type ADF and that by Choi (2001) or Fisher type PP, whose null hypothesis is the existence of unitary root. These unit root tests for panel data are based on those developed for time series, but by also taking into account cross-sectional data they increase degrees of freedom, improve estimator properties, and correct unobserved heterogeneity. The analysis is completed with the Hadri test (2000), based on the LM estimator proposed by Kwiatkowski et al. (1992), which considers the cross-dependence between individuals (EU states) and whose null hypothesis is that the series is stationary.
The results of unit root tests are presented in the Appendix. The results of Table A1 indicate that, except for the PRO, CRP, and CPC series, the null hypothesis of the presence of a unit root in the first four tests cannot be rejected, and the hypothesis of seasonality when the Hadri test is applied. Table A2 shows the root tests for variables that presented a unit root, but this time expressed in first differences. In this case, the results show that the variables in first differences no longer present a unitary root.
Next, to identify long-run relationships among the variables, we carry on the cointegration tests proposed by Pedroni (1999, 2001) and by Kao (1999). Both extend the Engle-Granger approach to test panel data, being the null hypothesis no cointegration. The tests proposed by Pedroni consider the within dimensions (panel v, panel rho, panel PP, and panel ADF) as well as the between dimension approach (group rho, group PP, and group ADF), allowing for heterogeneous intercepts and trend coefficients across cross-sections. For a relatively sample size, as ours, Pedroni (1999) indicates the group PP, the panel PP, and the panel rho as the more reliable statistics. In addition, the Kao test also considers cross section- specific intercepts and homogeneous coefficients on the first stage regressors.
The results of the cointegration tests for the equations to be estimated given by (1)–(3) described in Section 3 are shown in the Appendix. The results indicate that the null hypothesis of no cointegration may be rejected.
Once the cointegration relationship has been verified, we will proceed to estimate the long-term parameters in the next section.
4 Discussion of the Results
After detecting the cointegration relationship, we proceed to estimate equations (1)–(3) for the variables considered. For some of them, we have used two alternative measures, as described in Subsection 3.1, namely, for wage earnings, for education, and for growth.
The basic estimates for both DOLS and FMOLS are showed below. The leads and lags of the DOLS estimates have been obtained using the Schwartz criterion and the correction of heteroscedasticity and autocorrelation of residues of Newey-West. For the FMOLS estimates, no leads and lags have been applied, and for the estimation of covariances in the long term, Barlett and Newey-West corrections have been used.
Columns (1)–(3) of the tables indicate the three possible estimation options: (i) grouped estimates (pooled), after eliminating the deterministic components of the variables; (ii) weighted grouped estimates (pooled weighted), which makes use of the information given by the residues of estimates of cross-sections; and (iii) average grouped estimates (grouped), which calculates the average of the individual cross-section.
In Table 2, we see how, regardless of the chosen method (DOLS or FMOLS), the results are mixed. The variable public education expenditure has a positive sign and is significant for the grouped estimation of DOLS and FMOLS and the weighted DOLS. However, it has a negative and significant effect on the average estimate of DOLS and weighted FMOLS. The variable R&D expenditure in the education sector shows only a positive and significant influence on the average estimate of DOLS and the weighted and average of FMOLS.[3] Finally, the variable representing employment in sectors with a high technological content always has a positive effect (except for the average estimate) and is significant in the weighted estimate in both options.
Estimates equation (1)
| Dependent variable: PRO | ||||||
|---|---|---|---|---|---|---|
| DOLS | FMOLS | |||||
| (1) | (2) | (3) | (1) | (2) | (3) | |
| GPE | 0.57*** | 0.68*** | −1.71*** | 0.34* | −0.27*** | −0.09 |
| (2.35) | (3.83) | (−2.26) | (1.57) | (−14.87) | (−0.16) | |
| GID | −7.31*** | −6.14*** | 5.93*** | −3.12 | 0.46*** | 11.27* |
| (−2.91) | (−4.38) | (3.66) | (−1.23) | (14.08) | (1.61) | |
| EST | 0.45 | 0.40* | −0.81 | 0.67* | 0.34*** | −1.15* |
| (1.04) | (1.36) | (−0.59) | (1.71) | (8.93) | (−1.48) | |
Note: t statistics in parentheses. The stars ***, **, and * indicate 1, 5, and 10% significance levels, respectively. Columns (1), (2), and (3) correspond to pooled, pooled weighted, and grouped estimates, respectively.
Given the signs and the observed significance, the result that may be more consistent is that offered by the weighted estimate (column 2) of FMOLS. Public expenditure on education shows a negative (though very low) and significant coefficient. This could be explained by the fact that in the period considered (2009–2020), it has not yet been possible to recover the return of expenditure on education. However, R&D spending in the education sector performed within the business enterprise sector and employment in sectors with a high technological content (highest expected level of human capital) contribute to explaining productivity over the period considered. Those results are in line with the reviewed literature on the basis that education affects productivity boosting innovation and quality of the workforce.
When we measure average wage gains in (logarithms of) units of PPS (Table 3 [4]), work experience is the variable that explains, with the expected sign and significantly, the evolution of these gains regardless of the estimate made.[5]
Estimates equation (2)
| Dependent variable: log (WEM) | ||||||
|---|---|---|---|---|---|---|
| (1) | (2) | (3) | ||||
| DOLS | ||||||
| PRO | 0.01 | −0.01 | 0.01 | −0.01* | 0.01 | −0.01 |
| (0.01) | (−1.03) | (1.13) | (−1.57) | (0.30) | (−0.31) | |
| EDS | −0.01*** | −0.01*** | −0.01 | |||
| (−3.58) | (−7.61) | (−0.92) | ||||
| EDT | 0.01* | 0.01*** | 0.02*** | |||
| (1.58) | (4.51) | (3.44) | ||||
| EPL | 0.07*** | 0.07*** | 0.07*** | 0.06*** | 0.07*** | 0.04*** |
| (10.73) | (6.41) | (22.23) | (10.78) | (5.88) | (4.83) | |
| FMOLS | ||||||
| PRO | −0.01 | −0.01 | −0.33*** | −0.32*** | 0.01 | −0.01 |
| (−0.32) | (−0.11) | (−3.55) | (−3.41) | (1.09) | (−0.78) | |
| EDS | −0.01*** | 0.01 | −0.01 | |||
| (−3.33) | (0.49) | (−1.25) | ||||
| EDT | 0.01 | −0.08*** | 0.02*** | |||
| (1.40) | (−8.55) | (12.26) | ||||
| EPL | 0.07*** | 0.07*** | −0.01 | 0.06*** | 0.08*** | 0.03*** |
| (10.90) | (6.23) | (−0.75) | (3.96) | (14.66) | (6.08) | |
Note: See note in Table 2.
The population with higher education contributes positively and significantly to explain wage gains, when estimated by DOLS. The opposite is true for the population with secondary education, which in no case contributes positively and significantly. Also, productivity is not significant, except in the weighted estimate of FMOLS in which it appears negative. But the main result, given by DOLS estimation, shows that tertiary education and work experience (that can be seen as a way of acquiring human capital) are the main drivers of wage gains. This result is consistent with that of the literature.
When choosing average wage incomes to measure wage gains (Table 4), productivity is always significant and shows a negative sign, in any case. The educational level of the population (both secondary and higher) does not contribute positively to wage gains. While work experience maintains the expected sign (positive) and proves also to be significant.
Estimates equation (2)
| Dependent variable: WRM | ||||||
|---|---|---|---|---|---|---|
| (1) | (2) | (3) | ||||
| DOLS | ||||||
| PRO | −0.33*** | −0.46*** | −0.16*** | −0.33*** | −0.21*** | −0.26*** |
| (−2.72) | (−3.64) | (−3.96) | (−6.57) | (−2.54) | (−3.05) | |
| EDS | −0.30*** | −0.31*** | −0.38 | |||
| (−2.93) | (−7.97) | (−1.17) | ||||
| EDT | −0.09 | −0.15*** | −0.11 | |||
| (−0.88) | (−4.29) | (−0.46) | ||||
| EPL | 0.54*** | 0.95*** | 0.41*** | 1.05*** | 0.18 | 0.65 |
| (2.65) | (2.93) | (5.81) | (8.10) | (0.55) | (1.21) | |
| FMOLS | ||||||
| (1) | (2) | (3) | ||||
| PRO | −0.28*** | −0.28*** | −0.44*** | −0.47*** | −0.22*** | −0.25*** |
| (−4.47) | (−4.22) | (−4.75) | (−5.07) | (−7.33) | (−8.35) | |
| EDS | −0.25*** | −0.21*** | −0.25*** | |||
| (−2.94) | (−16.58) | (−2.31) | ||||
| EDT | −0.13* | −0.11*** | −0.04 | |||
| (−1.49) | (−11.54) | (−0.49) | ||||
| EPL | 0.43*** | 0.86*** | 0.47*** | 0.78*** | 0.02 | 0.59*** |
| (2.42) | (3.06) | (33.99) | (48.55) | (0.16) | (2.35) | |
Note: See note in Table 2.
To try to explain the evolution of economic growth, measured as GDP growth (Table 5), the variables that capture productivity and the population with higher education are that contribute positively and significantly to growth, whatever the method of estimation.
Estimates equation (3)
| Dependent variable: CRP | ||||||
|---|---|---|---|---|---|---|
| (1) | (2) | (3) | ||||
| DOLS | ||||||
| PRO | 1.39*** | 1.31*** | 1.46*** | 1.39*** | 1.53*** | 1.68*** |
| (13.85) | (13.05) | (24.50) | (20.70) | (14.00) | (14.13) | |
| EDS | 0.03 | 0.01 | 0.09 | |||
| (0.34) | (0.18) | (0.35) | ||||
| EDT | 0.16*** | 0.10*** | 0.22*** | |||
| (3.04) | (2.91) | (3.39) | ||||
| FMOLS | ||||||
| PRO | 1.21*** | 1.23*** | 1.29*** | 1.09*** | 1.28*** | 1.33*** |
| (20.14) | (21.11) | (14.34) | (11.16) | (22.52) | (25.07) | |
| EDS | 0.08 | −0.13*** | 0.30** | |||
| (1.03) | (−10.21) | (1.84) | ||||
| EDT | 0.23*** | 0.23*** | 0.36*** | |||
| (4.73) | (23.11) | (7.74) | ||||
Note: See note Table 2.
And the results are equivalent (Table 6), when we choose GDP growth in per capita terms as a dependent variable.
Estimates equation (3)
| Dependent variable: CPC | ||||||
|---|---|---|---|---|---|---|
| (1) | (2) | (3) | ||||
| DOLS | ||||||
| PRO | 1.37*** | 1.28*** | 1.43*** | 1.37*** | 1.50*** | 1.66*** |
| (13.86) | (13.20) | (23.98) | (20.52) | (14.13) | (14.43) | |
| EDS | 0.03 | 0.02 | 0.09 | |||
| (0.33) | (0.73) | (0.36) | ||||
| EDT | 0.15*** | 0.10*** | 0.21*** | |||
| (2.98) | (3.06) | (3.48) | ||||
| FMOLS | ||||||
| PRO | 1.19*** | 1.22*** | 1.29*** | 1.07*** | 1.26*** | 1.31*** |
| (20.42) | (21.46) | (14.82) | (11.31) | (22.84) | (26.34) | |
| EDS | 0.07 | −0.12*** | 0.28 | |||
| (0.97) | (−9.39) | (1.81) | ||||
| EDT | 0.23*** | 0.22*** | 0.36*** | |||
| (4.81) | (24.89) | (7.92) | ||||
Note: See note in Table 2.
Regarding the effects of education and productivity on economic growth, our findings are quite similar irrespective of choosing CPC or CPR as dependent variable. Showing that productivity is the engine of growth, and that human capital development (proxied by population with tertiary education level and presumably leading to highly skilled workers) led to increases in output. Results are in line with those of the literature on economic growth.
5 Conclusions
In this article, we have presented a first approximation to the study of the effects of public expenditure on education on productivity, wages, and growth at the level of the EU. For this purpose, we have used the methodology of estimating DOLS and FMOLS cointegrated panel data, which solve the endogeneity problem and eliminate small sample bias.
Our first exploratory empirical analysis provides us with some basic results.
When we try to explain to what extent, public spending on education, R&D spending on education, and employment in high-tech sectors contribute to productivity the results are mixed. However, the variable that contributes positively and significantly in most cases is employment in sectors with high technological content.
When analysing the factors that may explain the evolution of average wage earnings (measured both in PPS units and using wage incomes as a percentage of GDP) work experience is the variable that best explains, with the expected sign and significantly, the evolution of such gains whatever the estimate made.
Finally, when trying to explain the evolution of economic growth (measured as growth of GDP or GDP per capita), productivity and population with higher education level are the variables that contribute positively and significantly, whatever the method of estimation.
Summarizing, and with the exception that this is an exploratory analysis, our results show that (i) despite finding mixed results, R&D spending on education and employment in sectors with high technological content are variables that contribute to explain productivity, (ii) work experience is the variable that best explains wage gains, and (iii) productivity and the population with higher education level are the variables that best explain economic growth.
From these results, it could be inferred that high skills favour employment in sectors with a high technological content, and this sector is that contributes most to productivity. From this conclusion could be also assumed, the importance of the productive structures for explaining the impact of productivity on growth. While work experience, which can be interpreted as a means of acquiring human capital, is relevant when explaining the evolution of wage earnings. Our results do not show a clear and direct relationship between public expenditure on education and productivity, but it could be inferred that there is an indirect relationship to the extent that public expenditure on education facilitates access to higher education and the acquisition of a higher level of human capital and technological skills.
Given that our approach focuses on analysis of the effects of education spending on productivity, and through productivity (as a channel of transmission) on wage gains and per capita growth, we have found the aforementioned results. But in addition to these findings, we must bear in mind the limitations of the present work, such as the sample size and the type of the variables used. The natural extension would be to explore other databases and consider the inclusion of different explanatory variables. Further research on this issue will allow us to explore the extent to which public expenditure on education, as an instrument of fiscal policy, can fulfil the distributive function reducing inequality. And to what extent public spending on education contributes to the acquisition of human capital guides possible future public policies on education and spending.
Acknowledgement
The authors would like to thank the editor and the reviewers for their useful comments and suggestions.
-
Funding information: This work comes from research funded by the Institute for Fiscal Studies in 2022. And the open access publication of this paper was supported by Universidad de Castilla-La Mancha [grant number 2023-GRIN-34135], co-funded with European Regional Development Funds (ERDF).
-
Author contributions: The authors confirm they have shared their contribution to the conceptualization, design, data collection, analysis, and interpretation of results of the study, as well as the manuscript draft, and the revision of the final version.
-
Conflict of interest: The authors state not conflict of interest.
-
Data availability statement: The data used in our study is publicly and freely available on Eurostat website.
-
Article note: As part of the open assessment, reviews and the original submission are available as supplementary files on our website.
Appendix Unit root tests
Unit root tests. Levels
| Test | PRO | GPE | GID | EST | ||||
|---|---|---|---|---|---|---|---|---|
| statistic | prob | statistic | prob | statistic | prob | statistic | prob | |
| Levin, Lin & Chu t* | −13.5494 | 0.0000 | −4.93589 | 0.0000 | −1.49851 | 0.0670 | −2.3435 | 0.9904 |
| Im. Pesaran and Shin W-stat | −10.5468 | 0.0000 | −2.19468 | 0.0141 | 0.15316 | 0.5609 | 4.74961 | 1.0000 |
| ADF - Fisher Chi-square | 204.418 | 0.0000 | 76.6515 | 0.0230 | 63.8583 | 0.1687 | 26.3016 | 0.9995 |
| PP - Fisher Chi-square | 224.014 | 0.0000 | 67.0539 | 0.1093 | 61.2117 | 0.2331 | 26.4352 | 0.9994 |
| Hadri Z-stat | 3.97974 | 0.0000 | 7.65014 | 0.0000 | 5.49039 | 0.0000 | 10.3576 | 0.0000 |
| Test | WEM | WRM | EDS | EDT | ||||
|---|---|---|---|---|---|---|---|---|
| statistic | prob | statistic | prob | statistic | prob | statistic | prob | |
| Levin. Lin & Chu t* | 5.11650 | 1.0000 | −1.05408 | 0.1436 | −1.65501 | 0.0490 | −2.78564 | 0.0027 |
| Im. Pesaran and Shin W-stat | 7.75660 | 1.0000 | 2.22340 | 0.9869 | 2.66472 | 0.9961 | 4.82473 | 1.0000 |
| ADF - Fisher Chi-square | 21.8757 | 1.0000 | 52.8348 | 0.5194 | 42.9783 | 0.8593 | 35.9883 | 0.9719 |
| PP - Fisher Chi-square | 39.1371 | 0.9360 | 47.1257 | 0.7346 | 37.6235 | 0.9559 | 71.3714 | 0.0568 |
| Hadri Z-stat | 11.6580 | 0.0000 | 8.12657 | 0.0000 | 10.8930 | 0.0000 | 11.7148 | 0.0000 |
| Test | EPL | CRP | CPC | |||
|---|---|---|---|---|---|---|
| statistic | prob | statistic | prob | statistic | prob | |
| Levin. Lin & Chu t* | −3.57285 | 0.0002 | −7.12497 | 0.0000 | −7.20265 | 0.0000 |
| Im. Pesaran and Shin W-stat | 2.56852 | 0.9949 | −7.73311 | 0.0000 | −7.84784 | 0.0000 |
| ADF - Fisher Chi-square | 50.2488 | 0.9963 | 154.963 | 0.0000 | 156.154 | 0.0000 |
| PP - Fisher Chi-square | 37.1690 | 0.9609 | 190.745 | 0.0000 | 192.119 | 0.0000 |
| Hadri Z-stat | 10.9594 | 0.0000 | 2.83170 | 0.0023 | 2.86898 | 0.0021 |
Unit root tests: first differences
| Test | GPE | GID | EST | WEM | ||||
|---|---|---|---|---|---|---|---|---|
| statistic | prob | statistic | prob | statistic | prob | statistic | prob | |
| Levin. Lin & Chu t* | −5.19980 | 0.0000 | −12.8953 | 0.0000 | −10.4036 | 0.0000 | −8.57854 | 0.0000 |
| Im. Pesaran and Shin W-stat | −3.55540 | 0.0002 | −8.26144 | 0.0000 | −6.71611 | 0.0000 | −5.822572 | 0.0000 |
| ADF - Fisher Chi-square | 99.0849 | 0.0002 | 106.447 | 0.0000 | 149.276 | 0.0000 | 125.721 | 0.0000 |
| PP - Fisher Chi-square | 101.784 | 0.0001 | 204.503 | 0.0000 | 180.780 | 0.0000 | 137.571 | 0.0000 |
| Hadri Z-stat | 4.32058 | 0.0000 | 1.75775 | 0.03494 | 3.33616 | 0.0004 | 3.24449 | 0.0006 |
| Test | WRM | EDS | EDT | EPL | ||||
|---|---|---|---|---|---|---|---|---|
| statistic | prob | statistic | prob | statistic | prob | statistic | prob | |
| Levin. Lin & Chu t* | −7.47987 | 0.0000 | −11.1223 | 0.0000 | −8.62199 | 0.0000 | −9.61989 | 0.0000 |
| Im. Pesaran and Shin W-stat | −3.98628 | 0.0000 | −6.79076 | 0.0000 | −5.57190 | 0.0000 | −6.45665 | 0.0000 |
| ADF - Fisher Chi-square | 114.778 | 0.0000 | 140.005 | 0.0000 | 129.272 | 0.0000 | 135.999 | 0.0000 |
| PP - Fisher Chi-square | 131.199 | 0.0000 | 181.759 | 0.0000 | 128.205 | 0.0000 | 149.902 | 0.0000 |
| Hadri Z-stat | 7.54657 | 0.000 | 3.39857 | 0.0003 | −0.47853 | 0.6839 | 2.2378 | 0.0126 |
Cointegration tests
First Equation
Cointegration tests. Equation (1)
| Pedroni | Statistic | Probability |
| Panel v-Statistic | 3.131368 | 0.0009 |
| Panel rho-Statistic | 0.871316 | 0.8082 |
| Panel PP-Statistic | −6.490570 | 0.0000 |
| Panel ADF-Statistic | −1.808749 | 0.0352 |
| Group rho-Statistic | 3.160868 | 0.9992 |
| Group PP-Statistic | −8.673286 | 0.0000 |
| Group ADF-Statistic | −1.537623 | 0.0621 |
| Kao | Statistic | Probability |
| ADF | −2.867762 | 0.0021 |
Second Equation
Cointegration tests. Equation (2). WE and EDS
| Pedroni | Statistic | Probability |
| Panel v-Statistic | −2.396966 | 0.9917 |
| Panel rho-Statistic | 3.668544 | 0.9999 |
| Panel PP-Statistic | 0.073952 | 0.5295 |
| Panel ADF-Statistic | 2.214258 | 0.9866 |
| Group rho-Statistic | 4.800013 | 1.0000 |
| Group PP-Statistic | −5.899732 | 0.0000 |
| Group ADF-Statistic | 0.225995 | 0.5894 |
| Kao | Statistic | Probability |
| ADF | −2.996990 | 0.0014 |
Cointegration tests. Equation (2). WE and EDT
| Pedroni | Statistic | Probability |
| Panel v-Statistic | −0.761583 | 0.7768 |
| Panel rho-Statistic | 2.843756 | 0.9978 |
| Panel PP-Statistic | −0.886397 | 0.1877 |
| Panel ADF-Statistic | −0.317722 | 0.3753 |
| Group rho-Statistic | 5.090050 | 1.0000 |
| Group PP-Statistic | −5.247920 | 0.0000 |
| Group ADF-Statistic | −1.509324 | 0.0656 |
| Kao | Statistic | Probability |
| ADF | −1.602389 | 0.0545 |
Cointegration tests. Equation (2). WR and EDS
| Pedroni | Statistic | Probability |
| Panel v-Statistic | −0.210344 | 0.5833 |
| Panel rho-Statistic | 2.671524 | 0.9962 |
| Panel PP-Statistic | −1.308203 | 0.0954 |
| Panel ADF-Statistic | 3.646410 | 0.9999 |
| Group rho-Statistic | 5.506665 | 1.0000 |
| Group PP-Statistic | −3.404236 | 0.0003 |
| Group ADF-Statistic | −2.013258 | 0.0220 |
| Kao | Statistic | Probability |
| ADF | 1.005218 | 0.1574 |
Cointegration tests. Equation (2). WR and EDT
| Pedroni | Statistic | Probability |
| Panel v-Statistic | 1.285316 | 0.0993 |
| Panel rho-Statistic | 2.230989 | 0.9872 |
| Panel PP-Statistic | 0.089112 | 0.5355 |
| Panel ADF-Statistic | 2.099559 | 0.9821 |
| Group rho-Statistic | 5.666022 | 1.0000 |
| Group PP-Statistic | −1.686493 | 0.0459 |
| Group ADF-Statistic | −2.194800 | 0.0141 |
| Kao | Statistic | Probability |
| ADF | 1.281603 | 0.1000 |
Third Equation
Cointegration tests. Equation (3). CR and EDS
| Pedroni | Statistic | Probability |
| Panel v-Statistic | 0.630916 | 0.2640 |
| Panel rho-Statistic | 0.649648 | 0.7420 |
| Panel PP-Statistic | −3.644789 | 0.0001 |
| Panel ADF-Statistic | −0.396568 | 0.3458 |
| Group rho-Statistic | 2.687258 | 0.9964 |
| Group PP-Statistic | −3.879998 | 0.0001 |
| Group ADF-Statistic | −1.911703 | 0.0280 |
| Kao | Statistic | Probability |
| ADF | −5.283646 | 0.0000 |
Cointegration tests. Equation (3). CR and EDT
| Pedroni | Statistic | Probability |
| Panel v-Statistic | 2.047229 | 0.0203 |
| Panel rho-Statistic | −0.400620 | 0.3443 |
| Panel PP-Statistic | −4.940357 | 0.0000 |
| Panel ADF-Statistic | −1.415315 | 0.0785 |
| Group rho-Statistic | 2.788729 | 0.9974 |
| Group PP-Statistic | −3.610698 | 0.0002 |
| Group ADF-Statistic | −1.955540 | 0.0253 |
| Kao | Statistic | Probability |
| ADF | −4.966559 | 0.0000 |
Cointegration tests. Equation (3). CPC and EDS
| Pedroni | Statistic | Probability |
| Panel v-Statistic | 0.593191 | 0.2765 |
| Panel rho-Statistic | 0.565516 | 0.7141 |
| Panel PP-Statistic | −3.825929 | 0.0001 |
| Panel ADF-Statistic | −0.371375 | 0.3552 |
| Group rho-Statistic | 2.701800 | 0.9966 |
| Group PP-Statistic | −3.546909 | 0.0002 |
| Group ADF-Statistic | −1.550191 | 0.0605 |
| Kao | Statistic | Probability |
| ADF | −5.182386 | 0.0000 |
Cointegration tests. Equation (3). CPC and EDT
| Pedroni | Statistic | Probability |
| Panel v-Statistic | 2.250644 | 0.0122 |
| Panel rho-Statistic | −0.512476 | 0.3042 |
| Panel PP-Statistic | −5.176772 | 0.0000 |
| Panel ADF-Statistic | −1.417918 | 0.0781 |
| Group rho-Statistic | 2.647017 | 0.9959 |
| Group PP-Statistic | −3.539758 | 0.0002 |
| Group ADF-Statistic | −1.457869 | 0.0724 |
| Kao | Statistic | Probability |
| ADF | −4.897017 | 0.0000 |
References
Affandi, Y., Anugrah, D. F., & Bary, P. (2019). Human capital and economic growth across regions: A case study in Indonesia. Eurasian Economic Review, 9(3), 331–347.10.1007/s40822-018-0114-4Search in Google Scholar
Agasisti, T. (2014). The efficiency of public spending on education: An empirical comparison of EU countries. European Journal of Education, 49(4), 543–557.10.1111/ejed.12069Search in Google Scholar
Albert, C., & Davia, M. A. (2005). Education, wages, and job satisfaction. In Epunet Conference.Search in Google Scholar
Angrist, J. D., & Krueger, A. B. (1991). Does compulsory school attendance affect schooling and earnings? The Quarterly Journal of Economics, 106(4), 979–1014.10.2307/2937954Search in Google Scholar
Annabi, N., Harvey, S., & Lan, Y. (2011). Public expenditures on education, human capital and growth in Canada: An OLG model analysis. Journal of Policy Modeling, 33, 852–865.10.1016/j.jpolmod.2011.08.020Search in Google Scholar
Baltagi, B. H., (2008). Econometric analysis of panel data. John Wiley & Sons Ltd., Chichester.Search in Google Scholar
Barro, R. J. (2001). Human capital and growth. American Economic Review, 91(2), 12–17.10.1257/aer.91.2.12Search in Google Scholar
Barro, R. J., & Lee, J. W. (2013). A new data set of educational attainment in the world, 1950–2010. Journal of Development Economics, 104, 184–198.10.1016/j.jdeveco.2012.10.001Search in Google Scholar
Barro, R. J. (2002). Education as a determinant of economic growth. In E. P. Lazear (Ed.), Education in the Twenty-First Century. Stanford: Hoover Institution Press.Search in Google Scholar
Bassani, A., & Scarpetta, S. (2001). Links between policy and growth: Evidence from OECD countries. OECD Economics Department Working Papers.Search in Google Scholar
Becker, G. S. (1962). Investment in human capital: A theoretical analysis. Journal of Political Economy, 70(5), 9–49.10.1086/258724Search in Google Scholar
Becker, G. S. (1964). Human capital: A theoretical and empirical analysis, with special reference to education (1st ed.). New York: National Bureau of Economic Research.Search in Google Scholar
Benabou, R. (1996). Equity and efficiency in human capital investment: The local connection. The Review of Economic Studies, 63(2), 237–264.10.2307/2297851Search in Google Scholar
Benhabib, J., & Spiegel, M.M. (1994). The role of human capital in economic development: Evidence from aggregate cross-country data. Journal of Monetary Economics, 34(2), 143–173.10.1016/0304-3932(94)90047-7Search in Google Scholar
Benos, N., & Karagiannis, S. (2016). Do education quality and spillovers matter? Evidence on human capital and productivity in Greece. Economic Modelling, 54, 563–573.10.1016/j.econmod.2016.01.015Search in Google Scholar
Biasi, B., Deming, D. J., & Moser, P. (2021). Education and Innovation NBER Working Paper No. 28544. NBER Working Paper Series.10.3386/w28544Search in Google Scholar
Blankenau, W. (2005). Public schooling, college subsidies and growth. Journal of Economic Dynamics and Control, 29(3), 487–507.10.1016/j.jedc.2004.04.001Search in Google Scholar
Blankenau, W., & Camera, G. (2009). Public spending on education and the incentives for student achievement. Economica, 76, 505–52710.1111/j.1468-0335.2008.00687.xSearch in Google Scholar
Blankenau, W. F., & Simpson, N. B. (2004). Public education expenditures and growth. Journal of Development Economics, 73(2), 583–605.10.1016/j.jdeveco.2003.05.004Search in Google Scholar
Bowlus, A. J., & Robinson, C. (2012). Human capital prices, productivity, and growth. American Economic Review, 102(7), 3483–3515.10.1257/aer.102.7.3483Search in Google Scholar
Bronzini, R., & Piselli, P. (2009). Determinants of long-run regional productivity with geographical spillovers: The role of R&D, human capital and public infrastructure. Regional Science and Urban Economics, 39(2), 187–199.10.1016/j.regsciurbeco.2008.07.002Search in Google Scholar
Canton, E., Thum-Thysen, A., & Voigt, P. (2018). Economists’ musings on human capital investment: How efficient is public spending on education in EU member states?. Discussion Paper 081, European Commission. Directorate-General for Economic and Financial Affairs.Search in Google Scholar
Card, D. (2001). Estimating the return to schooling: Progress on some persistent econometric problems. Econometrica, 69(5), 1127–1160.10.1111/1468-0262.00237Search in Google Scholar
Castelló, A., & Doménech, R. (2008). Human capital inequality, life expectancy and economic growth. The Economic Journal, 118(528), 653–677.10.1111/j.1468-0297.2008.02136.xSearch in Google Scholar
Castelló, A., & Doménech, R. (2014). Human capital and income inequality: Some facts and some puzzles. Retrieved from BBVA Research.Search in Google Scholar
Castriota, S. (2006). Education and happiness: A further explanation to the Easterlin Paradox. Unpublished Paper.Search in Google Scholar
Chani, M. I., Jan, S. A., Pervaiz, Z., & Chaudhary, A. R. (2014). Human capital inequality and income inequality: Testing for causality. Quality & Quantity, 48(1), 149–156.10.1007/s11135-012-9755-7Search in Google Scholar
Chansarn, S. (2010). Labor productivity growth, education, health, and technological progress: A cross country analysis. Economic Analysis and Policy, 40(2), 249–242.10.1016/S0313-5926(10)50027-4Search in Google Scholar
Checchi, D. (2006). The economics of education: Human capital, family background and inequality. Cambridge University Press.10.1017/CBO9780511492280Search in Google Scholar
Chevalier, A., Harmon, C., Walker, I., & Zhu, Y. (2004). Does education raise productivity, or just reflect it?. The Economic Journal, 114, 499–517.10.1111/j.1468-0297.2004.00256.xSearch in Google Scholar
Choi, I. (2001). Unit root test for panel data. Journal of International Money and Finance, 20, 249–272.10.1016/S0261-5606(00)00048-6Search in Google Scholar
Churchill, S. A., Yew, S. L., & Ugur, M. (2015). Effects of government education and health expenditures on economic growth: A Meta-analysis. Greenwich Papers in Political Economy, 14072, University of Greenwich, Greenwich Political Economy Research Centre.Search in Google Scholar
Cinnirella, F., & Streb, J. (2017). The role of human capital and innovation in economic development: Evidence from post-Malthusian Prussia. Journal of Economic Growth, 22, 193–227.10.1007/s10887-017-9141-3Search in Google Scholar
Coady, M. D., & Gupta, M. S. (2012). Income inequality and fiscal policy. INTERNATIONAL Monetary Fund.10.5089/9781475504828.006Search in Google Scholar
Davia, M. A. (2005). Job mobility and wage mobility at the beginning of the working career: A comparative view across Europe (No. 2005-03). ISER Working Paper Series.Search in Google Scholar
De la Fuente, A. (2011). Human capital and productivity. Nordic Economic Policy Review, 2(2), 103–132.Search in Google Scholar
De la Fuente, A., & Doménech, R. (2006). Human capital in growth regressions: How much difference does data quality make? Journal of the European Economic Association, 4(1), 1–36.10.1162/jeea.2006.4.1.1Search in Google Scholar
Denison, E. F. (1985). Trends in American economic growth, 1929–1982. Washington, D.C.: The Brookings Institution.Search in Google Scholar
Dias, J., & Tebaldi, E. (2012). Institutions, human capital, and growth: The institutional mechanism. Structural Change and Economic Dynamics, 23(3), 300–312.10.1016/j.strueco.2012.04.003Search in Google Scholar
Dickson, M. (2013). The causal effect of education on wages revisited. Oxford Bulletin of Economics and Statistics, 75(4), 477–498.10.1111/j.1468-0084.2012.00708.xSearch in Google Scholar
Dissou, Y., Didic, S., & Yakautsava, D. (2016). Government spending on education, human capital accumulation, and growth. Economic Modelling 58, 9–2110.1016/j.econmod.2016.04.015Search in Google Scholar
Dreger, C., & Reimers, H.E. (2005). Panel seasonal unit root test: Further simulation results and an application to unemployment data. AStA Advances in Statistical Analysis, Springer: German Statistical Society 89(3), 321–337.10.1007/s10182-005-0207-8Search in Google Scholar
Englander, S. & A. Gurney (1994). Medium-term determinants of OECD productivity. OECD Economic Studies, 22, 49–109.Search in Google Scholar
Fershtman, C., Murphy, K. M., & Weiss, Y. (1996). Social status, education, and growth. Journal of Political Economy, 104(1), 108–132.10.1086/262019Search in Google Scholar
Fleisher, B., Li, H., & Zhao, M. Q. (2010). Human capital, economic growth, and regional inequality in China. Journal of Development Economics, 92(2), 215–231.10.1016/j.jdeveco.2009.01.010Search in Google Scholar
Fournier, J. M., & Johansson, Å. (2016). The effect of the size and the mix of public spending on growth and inequality. OECD Economic Department Working Papers, 1344.Search in Google Scholar
Frank, A. G. (1960). Human capital and economic growth. Economic Development and Cultural Change, 8(2), 170–173.10.1086/449834Search in Google Scholar
Fredriksen, K. B. (2012). Income inequality in the European Union (No. 952). OECD Publishing.Search in Google Scholar
Funke, M., & Strulik, H. (2000). On endogenous growth with physical capital, human capital and product variety. European Economic Review, 44(3), 491–515.10.1016/S0014-2921(98)00072-5Search in Google Scholar
Galor, O., & Tsiddon, D. (1997). The distribution of human capital and economic growth. Journal of Economic Growth, 2(1), 93–124.10.1023/A:1009785714248Search in Google Scholar
Glomm, G., & Ravikumar, B. (1992). Public versus private investment in human capital: Endogenous growth and income inequality. Journal of Political Economy, 100(4), 818–834.10.1086/261841Search in Google Scholar
Gradstein, M. (2003). The political economy of public spending on education, inequality, and growth (No. 3162). World Bank Publications.10.1596/1813-9450-3162Search in Google Scholar
Griliches, Z. (1997). Education, human capital, and growth: A personal perspective. Journal of Labor Economics, 15(1), 330–344.10.1086/209865Search in Google Scholar
Hansen, A. T., Hvidman, U., & Sievertsen, H. H. (2021). Grades and employer learning. IZA Discussion Papers 14200. Institute of Labor Economics.Search in Google Scholar
Hanushek, E. A. (2013). Economic growth in developing countries: The role of human capital. Economics of Education Review, 37, 204–212.10.1016/j.econedurev.2013.04.005Search in Google Scholar
Hanushek, E. A., & Woessman, L. (2011). The economics of international differences in educational achievement. Chap. 2 In E. A. Hanushek, S. Machin, & L. Woessmann (Eds.), Handbooks in economics: Economics of education (Vol. 3, pp. 89–200). The Netherlands: North-Holland.10.1016/B978-0-444-53429-3.00002-8Search in Google Scholar
Heckman, J. J., & Mosso, S. (2014). The economics of human development and social mobility. Annual Review of Economics, 6(1), 689–733.10.1146/annurev-economics-080213-040753Search in Google Scholar
Hsiao, C. (2003). Analysis of panel data (Econometric society monographs). Cambridge: Cambridge University Press.10.1017/CBO9780511754203Search in Google Scholar
Hyman, J. (2017). Does money matter in the long run? Effects of school spending on educational attainment. American Economic Journal: Economic Policy, 9(4), 256–280.10.1257/pol.20150249Search in Google Scholar
Im, K., Pesaran, M., & Shin, Y. (2003). Testing for unit roots in heterogeneous panels. Journal of Econometrics, 115, 53–74.10.1016/S0304-4076(03)00092-7Search in Google Scholar
Jenkins, H. (1995). Education and production in the United Kingdom. Oxford: Nuffield College.Search in Google Scholar
Kampelmann, S., Rycx, F., Saks, Y., & Tojerov, I. (2018). Does education raise productivity and wages equally? The moderating role of age and gender. IZA Journal of Labor Economics, 7, 1.10.1186/s40172-017-0061-4Search in Google Scholar
Kao, C. (1999). Spurious regression and residual-based tests for cointegration in panel data. Journal of Econometrcis, 90, 1–44.10.1016/S0304-4076(98)00023-2Search in Google Scholar
Kao, C., & Chiang, M.H. (2000). On the estimation and inference of a cointegrated regression in panel data. In B. Baltagi (Ed.), Nonstationary panels, panel cointegration, and dynamic panels (Advances in econometrics) (pp. 161–178). Amsterdam: JAI Press.Search in Google Scholar
Kingdon, G. G., Little, A., Aslam, M., Rawal, S., Moe, T., Patrinos, H., & Sharma, S. K. (2014). A rigorous review of the political economy of education systems in developing countries. London: Department for International Development.Search in Google Scholar
Krueger, A. B. (1999). Measuring labor’s share. American Economic Review, 89(2), 45–51.10.1257/aer.89.2.45Search in Google Scholar
Krueger, A. B., & Lindahl, M. (2001). Education for growth: Why and for whom? Journal of Economic Literature, 39(4), 1101–1136.10.1257/jel.39.4.1101Search in Google Scholar
Kwiatkowski, D., Phillips, P. C., Schmidt, P., & Shin, Y. (1992). Testing the null hypothesis of stationarity against the alternative of a unit root: How sure are we that economic time series have a unit root?. Journal of Econometrics, 54, 159–178.10.1016/0304-4076(92)90104-YSearch in Google Scholar
Lathapipat, D. (2016). Inequality in education and wages. In P. Phongpaichit & C. Baker (Eds.), Unequal Thailand: Aspects of income, wealth, and power. (pp. 43–54). NUS Press.10.2307/j.ctv1xxzt4.9Search in Google Scholar
Lee, J. W., & Lee, H. (2018). Human capital and income inequality. Journal of the Asia Pacific Economy, 23(4), 554–583.10.1080/13547860.2018.1515002Search in Google Scholar
Le Grand, J. (2018). The strategy of equality: Redistribution and the social services. Routledge.10.4324/9780429486852Search in Google Scholar
Levin, A., Lin, C., & Chu, C. (2002). Unit root test in panel data: Asymptotic and finite sample properties. Journal of Econometrics, 108, 1–24.10.1016/S0304-4076(01)00098-7Search in Google Scholar
Lim, S. S., Updike, R. L., Kaldjian, A. S., Barber, R. M., Cowling, K., York, H., & Murray, C. J. (2018). Measuring human capital: A systematic analysis of 195 countries and territories, 1990–2016. The Lancet, 392(10154), 1217–1234.10.1016/S0140-6736(18)31941-XSearch in Google Scholar
Lucas, R. (1988). On the mechanics of economic development. Journal of Monetary Economics, 22(1), 3–4210.1016/0304-3932(88)90168-7Search in Google Scholar
Maddala, G., & Wu, S. (1999). A comparative study of unit root test with panel data y a new simple test. Oxford Bulletin of Economics y Statistics, 61, 631–652.10.1111/1468-0084.61.s1.13Search in Google Scholar
Mandl, U., Dierx, A., & Ilzkovitz, F. (2008). The effectiveness and efficiency of public spending. Economic Papers 301, European Economy, Directorate-General for Economic and Financial Affairs European Commission, Brussels.Search in Google Scholar
Mankiw, N. G., Romer, D., & Weil, D. N. (1992). A contribution to the empirics of economic growth. The Quarterly Journal of Economics, 107(2), 407–437.10.2307/2118477Search in Google Scholar
Mason, G., O’Leary, B., & Vecchi, M. (2012). Certified and uncertified skills and productivity growth performance: Cross-country evidence at industry level. Labour Economics, 19(3), 351–360.10.1016/j.labeco.2012.03.003Search in Google Scholar
Mincer, J. (1984). Human capital and economic growth. Economics of Education Review, 3(3), 195–205.10.1016/0272-7757(84)90032-3Search in Google Scholar
Moretti, E. (2004). Workers’ education, spillovers, and productivity: Evidence from plant-level production functions. American Economic Review, 94(3), 656–690.10.1257/0002828041464623Search in Google Scholar
Murphy, K. M., & Topel, R. H. (2016). Human capital investment, inequality, and economic growth. Journal of Labor Economics, 34(S2), S99–S127.10.1086/683779Search in Google Scholar
Nelson, R. R., & Phelps, E. S. (1966). Investment in humans, technological diffusion, and economic growth. The American Economic Review, 56(1/2), 69–75.Search in Google Scholar
Nissan, E., Galindo Martín, M. Á., & Méndez Picazo, M. T. (2011). Relationship between organizations, institutions, entrepreneurship and economic growth process. International Entrepreneurship and Management Journal, 7, 311–324.10.1007/s11365-011-0191-2Search in Google Scholar
OECD. (2002). Measuring the non-observed economy: A handbook. International Labour Office/International Monetary Fund/International Statistical Committee of the Commonwealth of Independent States, OECD Publishing.10.1787/9789264175358-enSearch in Google Scholar
Pedroni, P. (1999). Critical values for cointegration tests in heterogeneous panels with multiple regressors. Oxford Bulletin of Economics and Statistics, 61, 653–70.10.1111/1468-0084.61.s1.14Search in Google Scholar
Pedroni, P. (2000). Fully modified OLS for heterogeneous cointegrated panels. In H. B. Baltagi (Ed.), Nonstationary panels, panel cointegration and dynamic panels (Advances in Econometrics). (Vol. 15, pp. 93–130). Elsevier Science.10.1016/S0731-9053(00)15004-2Search in Google Scholar
Pedroni, P. (2001). Purchasing power parity tests in cointegrated panels. Review of Economics and Statistics, 83(4), 727–731.10.1162/003465301753237803Search in Google Scholar
Phillips, P., & Hansen, B. (1990). Statistical inference in instrumental variables regression with I (1) processes. Review of Economics Studies, 57, 99–125.10.2307/2297545Search in Google Scholar
Phillips, P., & Moon, H. R. (1999). Linear regression limit theory for nonstationary panel data. Econometrica, 67(5), 1057–1111.10.1111/1468-0262.00070Search in Google Scholar
Pissarides, C. A. (2000). Human capital and growth: A synthesis report (No. 168). OECD Publishing.Search in Google Scholar
Pritchett, L. (2001). Where has all the education gone?. The World Bank Economic Review, 15(3), 367–391.10.1093/wber/15.3.367Search in Google Scholar
Psacharopoulos, G., & Patrinos, H. A. (2004). Returns to investment in education: A further update. Education Economics, 12(2), 111–134.10.1080/0964529042000239140Search in Google Scholar
Qadri, F. S., & Waheed, A. (2013). Human capital and economic growth: Cross-country evidence from low-, middle-and high-income countries. Progress in Development Studies, 13(2), 89–104.10.1177/1464993412466503Search in Google Scholar
Rajkumar, A. S., & Swaroop, V. (2008). Public spending and outcomes: Does governance matter? Journal of Development Economics, 86, 96–111.10.1016/j.jdeveco.2007.08.003Search in Google Scholar
Ramos, R., Surinach, J., & Artís, M. (2012). Regional economic growth and human capital: The role of over-education. Regional Studies, 46(10), 1389–1400.10.1080/00343404.2012.675140Search in Google Scholar
Romer, P. M. (1986). Increasing returns and long-run growth. Journal of Political Economy, 94(5), 1002–1037.10.1086/261420Search in Google Scholar
Romer, P. M. (1989). What determines the rate of growth and technological change? (Vol. 279). World Bank Publications.10.3386/w3210Search in Google Scholar
Sawicka, J., & Stolarczyk, P. (2018). Changes in human capital resources in the labour market in Poland from the perspective of the European Union and other countries. Acta Scientiarum Polonorum. Oeconomia, 17(4), 133–140.10.22630/ASPE.2018.17.4.60Search in Google Scholar
Schofer, E., & Meyer, J. W. (2005). The worldwide expansion of higher education in the twentieth century. American Sociological Review, 70(6), 898–920.10.1177/000312240507000602Search in Google Scholar
Schultz, T. W. (1961). Investment in human capital. The American Economic Review, 51(1), 1–17.Search in Google Scholar
Sibiano, P., & Agasisti, T. (2013). Efficiency and heterogeneity of public spending in education among Italian regions. Journal of Public Affairs, 13(1), 12–22.10.1002/pa.1404Search in Google Scholar
Spence, M. (1973). Job market signaling. The Quarterly Journal of Economics, 87(39), 355–374.10.2307/1882010Search in Google Scholar
St. Aubyn, M., Pina, A., Garcia, F., & Pais, J. (2009). Study on the efficiency and effectiveness of public spending on tertiary education. Economic Papers 390, European Economy, Directorate-General for Economic and Financial Affairs European Commission, Brussels.Search in Google Scholar
Stock, J. H., & Watson, M. W. (1993). A simple estimator of cointegrating vectors in higher order integrated systems. Econometrica, 61(4), 783–820.10.2307/2951763Search in Google Scholar
Stokey, N. L. (1991). Human capital, product quality, and growth. The Quarterly Journal of Economics, 106(2), 587–616.10.2307/2937948Search in Google Scholar
Sutherland, D., Price, R., Joumard, I., & Nicq, C. (2007). Performance indicators for public spending efficiency in primary and secondary education. OECD Economics Department Working Papers, No. 546, OCDE Publishing, Paris.10.2139/ssrn.967656Search in Google Scholar
Sylwester, K. (2000). Income inequality, education expenditures, and growth. Journal of Development Economics, 63(2), 379–398.10.1016/S0304-3878(00)00113-9Search in Google Scholar
Taylor, L. L. (1994). An economy at risk? The social costs of school inefficiency. Economic Review, 3, 1–13.Search in Google Scholar
Teixeira, A. A., & Queirós, A. S. (2016). Economic growth, human capital and structural change: A dynamic panel data analysis. Research Policy, 45(8), 1636–1648.10.1016/j.respol.2016.04.006Search in Google Scholar
Tsai, C. L., Hung, M. C., & Harriott, K. (2010). Human capital composition and economic growth. Social Indicators Research, 99, 41–59.10.1007/s11205-009-9565-zSearch in Google Scholar
Vandenbussche, J., Aghion, P., & Meghir, C. (2006). Growth, distance to frontier and composition of human capital. Journal of Economic Growth, 11, 97–127.10.1007/s10887-006-9002-ySearch in Google Scholar
Viaene, J. M., & Zilcha, I. (2003). Human capital formation, income inequality, and growth. Cambridge MA: MIT Press.10.7551/mitpress/3750.003.0008Search in Google Scholar
Weisbrod, B. A. (1962). Education and investment in human capital. Journal of Political Economy, 70(5), 106–123.10.1086/258728Search in Google Scholar
West, A., & Nikolai, R. (2013). Welfare regimes and education regimes: Equality of opportunity and expenditure in the EU (and US). Journal of Social Policy, 42(3), 469–493.10.1017/S0047279412001043Search in Google Scholar
Wolff, E. N. (2015). Educational expenditures and student performance among OECD countries. Structural Change and Economic Dynamics, 33, 37–57.10.1016/j.strueco.2015.02.003Search in Google Scholar
© 2024 the author(s), published by De Gruyter
This work is licensed under the Creative Commons Attribution 4.0 International License.
Articles in the same Issue
- Regular Articles
- Political Turnover and Public Health Provision in Brazilian Municipalities
- Examining the Effects of Trade Liberalisation Using a Gravity Model Approach
- Operating Efficiency in the Capital-Intensive Semiconductor Industry: A Nonparametric Frontier Approach
- Does Health Insurance Boost Subjective Well-being? Examining the Link in China through a National Survey
- An Intelligent Approach for Predicting Stock Market Movements in Emerging Markets Using Optimized Technical Indicators and Neural Networks
- Analysis of the Effect of Digital Financial Inclusion in Promoting Inclusive Growth: Mechanism and Statistical Verification
- Effective Tax Rates and Firm Size under Turnover Tax: Evidence from a Natural Experiment on SMEs
- Re-investigating the Impact of Economic Growth, Energy Consumption, Financial Development, Institutional Quality, and Globalization on Environmental Degradation in OECD Countries
- A Compliance Return Method to Evaluate Different Approaches to Implementing Regulations: The Example of Food Hygiene Standards
- Panel Technical Efficiency of Korean Companies in the Energy Sector based on Digital Capabilities
- Time-varying Investment Dynamics in the USA
- Preferences, Institutions, and Policy Makers: The Case of the New Institutionalization of Science, Technology, and Innovation Governance in Colombia
- The Impact of Geographic Factors on Credit Risk: A Study of Chinese Commercial Banks
- The Heterogeneous Effect and Transmission Paths of Air Pollution on Housing Prices: Evidence from 30 Large- and Medium-Sized Cities in China
- Analysis of Demographic Variables Affecting Digital Citizenship in Turkey
- Green Finance, Environmental Regulations, and Green Technologies in China: Implications for Achieving Green Economic Recovery
- Coupled and Coordinated Development of Economic Growth and Green Sustainability in a Manufacturing Enterprise under the Context of Dual Carbon Goals: Carbon Peaking and Carbon Neutrality
- Revealing the New Nexus in Urban Unemployment Dynamics: The Relationship between Institutional Variables and Long-Term Unemployment in Colombia
- The Roles of the Terms of Trade and the Real Exchange Rate in the Current Account Balance
- Cleaner Production: Analysis of the Role and Path of Green Finance in Controlling Agricultural Nonpoint Source Pollution
- The Research on the Impact of Regional Trade Network Relationships on Value Chain Resilience in China’s Service Industry
- Social Support and Suicidal Ideation among Children of Cross-Border Married Couples
- Asymmetrical Monetary Relations and Involuntary Unemployment in a General Equilibrium Model
- Job Crafting among Airport Security: The Role of Organizational Support, Work Engagement and Social Courage
- Does the Adjustment of Industrial Structure Restrain the Income Gap between Urban and Rural Areas
- Optimizing Emergency Logistics Centre Locations: A Multi-Objective Robust Model
- Geopolitical Risks and Stock Market Volatility in the SAARC Region
- Trade Globalization, Overseas Investment, and Tax Revenue Growth in Sub-Saharan Africa
- Can Government Expenditure Improve the Efficiency of Institutional Elderly-Care Service? – Take Wuhan as an Example
- Media Tone and Earnings Management before the Earnings Announcement: Evidence from China
- Review Articles
- Economic Growth in the Age of Ubiquitous Threats: How Global Risks are Reshaping Growth Theory
- Efficiency Measurement in Healthcare: The Foundations, Variables, and Models – A Narrative Literature Review
- Rethinking the Theoretical Foundation of Economics I: The Multilevel Paradigm
- Financial Literacy as Part of Empowerment Education for Later Life: A Spectrum of Perspectives, Challenges and Implications for Individuals, Educators and Policymakers in the Modern Digital Economy
- Special Issue: Economic Implications of Management and Entrepreneurship - Part II
- Ethnic Entrepreneurship: A Qualitative Study on Entrepreneurial Tendency of Meskhetian Turks Living in the USA in the Context of the Interactive Model
- Bridging Brand Parity with Insights Regarding Consumer Behavior
- The Effect of Green Human Resources Management Practices on Corporate Sustainability from the Perspective of Employees
- Special Issue: Shapes of Performance Evaluation in Economics and Management Decision - Part II
- High-Quality Development of Sports Competition Performance Industry in Chengdu-Chongqing Region Based on Performance Evaluation Theory
- Analysis of Multi-Factor Dynamic Coupling and Government Intervention Level for Urbanization in China: Evidence from the Yangtze River Economic Belt
- The Impact of Environmental Regulation on Technological Innovation of Enterprises: Based on Empirical Evidences of the Implementation of Pollution Charges in China
- Environmental Social Responsibility, Local Environmental Protection Strategy, and Corporate Financial Performance – Empirical Evidence from Heavy Pollution Industry
- The Relationship Between Stock Performance and Money Supply Based on VAR Model in the Context of E-commerce
- A Novel Approach for the Assessment of Logistics Performance Index of EU Countries
- The Decision Behaviour Evaluation of Interrelationships among Personality, Transformational Leadership, Leadership Self-Efficacy, and Commitment for E-Commerce Administrative Managers
- Role of Cultural Factors on Entrepreneurship Across the Diverse Economic Stages: Insights from GEM and GLOBE Data
- Performance Evaluation of Economic Relocation Effect for Environmental Non-Governmental Organizations: Evidence from China
- Functional Analysis of English Carriers and Related Resources of Cultural Communication in Internet Media
- The Influences of Multi-Level Environmental Regulations on Firm Performance in China
- Exploring the Ethnic Cultural Integration Path of Immigrant Communities Based on Ethnic Inter-Embedding
- Analysis of a New Model of Economic Growth in Renewable Energy for Green Computing
- An Empirical Examination of Aging’s Ramifications on Large-scale Agriculture: China’s Perspective
- The Impact of Firm Digital Transformation on Environmental, Social, and Governance Performance: Evidence from China
- Accounting Comparability and Labor Productivity: Evidence from China’s A-Share Listed Firms
- An Empirical Study on the Impact of Tariff Reduction on China’s Textile Industry under the Background of RCEP
- Top Executives’ Overseas Background on Corporate Green Innovation Output: The Mediating Role of Risk Preference
- Neutrosophic Inventory Management: A Cost-Effective Approach
- Mechanism Analysis and Response of Digital Financial Inclusion to Labor Economy based on ANN and Contribution Analysis
- Asset Pricing and Portfolio Investment Management Using Machine Learning: Research Trend Analysis Using Scientometrics
- User-centric Smart City Services for People with Disabilities and the Elderly: A UN SDG Framework Approach
- Research on the Problems and Institutional Optimization Strategies of Rural Collective Economic Organization Governance
- The Impact of the Global Minimum Tax Reform on China and Its Countermeasures
- Sustainable Development of Low-Carbon Supply Chain Economy based on the Internet of Things and Environmental Responsibility
- Measurement of Higher Education Competitiveness Level and Regional Disparities in China from the Perspective of Sustainable Development
- Payment Clearing and Regional Economy Development Based on Panel Data of Sichuan Province
- Coordinated Regional Economic Development: A Study of the Relationship Between Regional Policies and Business Performance
- A Novel Perspective on Prioritizing Investment Projects under Future Uncertainty: Integrating Robustness Analysis with the Net Present Value Model
- Research on Measurement of Manufacturing Industry Chain Resilience Based on Index Contribution Model Driven by Digital Economy
- Special Issue: AEEFI 2023
- Portfolio Allocation, Risk Aversion, and Digital Literacy Among the European Elderly
- Exploring the Heterogeneous Impact of Trade Agreements on Trade: Depth Matters
- Import, Productivity, and Export Performances
- Government Expenditure, Education, and Productivity in the European Union: Effects on Economic Growth
- Replication Study
- Carbon Taxes and CO2 Emissions: A Replication of Andersson (American Economic Journal: Economic Policy, 2019)