The Impact of Environmental Regulation on Technological Innovation of Enterprises: Based on Empirical Evidences of the Implementation of Pollution Charges in China
-
 ,
,

Abstract
Environmental protection is closely related to high-quality economic developments. Based on the matching of micro-databases from 2000 to 2008, this study used the “Regulations on the Collection and Use of Pollution Fees” policy implemented in China in 2003 as the exogenous impact to construct the intensity Difference in Differences model in order to investigate the effects of pollutant discharge fee on technological innovation of enterprises and the underlying mechanisms. The results showed that governmental environmental regulations significantly improved the level of technological innovation of enterprises, and the conclusion was still valid after a series of robustness tests. The results of the parallel trend verified the rationality of the differential setting and the dynamic effects showed that the pollutant discharge fees had a continuous promoting effect on the technological innovation of enterprises. The results of the placebo tests rejected the original hypothesis of the mistaken model. The mechanism verifications revealed that the strengthening of environmental regulation by the government acted on the innovation level of enterprises through the two mechanisms, i.e., the promotion of enterprises’ fixed asset investments and government subsidies, and finally improved the enterprises’ technological innovation levels.
1 Introduction
The report of the Party’s 20th National Congress proposed “promoting green development and promoting harmonious coexistence between human and nature,” which highlighted the need to further promote the prevention of environmental pollution, to carry out the treatments of new pollutants, and to promote the improvements of urban and rural living environments. As we can see, promoting economic development also needs to promote the green and healthy development of society and the ecological environments. As the saying goes, “lucid waters and lush mountains are invaluable assets.” We should stick to the path of green development and jointly build a foundation for ecological civilization. In China, the will of the government plays a major role in environmental regulations. On the one hand, the government as the designer of environmental regulations restricts the behaviors of market players. On the other hand, the central government will also send environmental inspection teams to supervise and inspect the implementations of central environmental policies by local governments. As a very important part of society, the main purpose of enterprises is to make profits. Environmental regulatory policies can affect their costs and profits, thus having a significant impact on them. In 2003, the Chinese government implemented the Regulations on the Management of the Collection and Use of Pollutant Discharge Fees. Notably, as the first related policy on the national level, the environmental regulations provide us with a good opportunity for quasi-natural experiments to identify the impact on micro market players and help us to identify the impact on enterprise technological innovations by using Difference in Differences (DID) method.
According to traditional economic theories, increasing investments in environmental protection will increase the operating costs and social values, and reduce the overall competitiveness of enterprises, which may hinder their further development (Wang & Wan, 2011). However, Porter’s hypothesis (Porter & van der Linde, 1995) believes that enterprises’ compliance with the government’s environmental regulations not only does not increase their operating costs but also promotes their technological innovation and brings greater benefits, thus occupying a competitive position for enterprises in the international market. Can the environmental regulations formulated by the Chinese government promote the innovation of enterprise? What is the impact of environmental regulation on micro-market players? These are the questions to be answered in this study. We took the pollutant discharge fee implemented by the Chinese government in 2003 as a quasi-natural experiment and used the relevant data of the industrial enterprise database, the pollution database, and the enterprise innovation database of China to study the impact of environmental protection rules on enterprise technological innovation, which might help to put forward relevant policy suggestions based on our study.
This study identifies the causal effects of environmental protection tax from three aspects: research perspective, research method, and action mechanism. To identify the causal effects, we took the promulgation of the Regulations on the Administration of the Collection and Use of Pollutant Discharge Fee (hereinafter referred to as “Pollutant Discharge Fee”) in 2003 as a quasi-natural experiment and used policy evaluations to get the impact on enterprise innovation. In terms of research methods, we used the DID method to analyze the enterprise micro database, avoided the endogeneity and missing variable bias, and thus obtained a robust consistent estimator. In terms of the mechanisms, we explored the mechanism of enterprise investment and government subsidy, and then explored the impact on innovation from the perspective of enterprise operation decisions, which are important marginal contributions of this study.
The following contents of this manuscript are the institutional background and literature review (Section 2), the mechanism analysis (Section 3), the data processing and model setting (Section 4), the basic regression and robustness tests (Section 5), the heterogeneity analysis (Section 6), the mechanism verifications (Section 7), and the conclusions and policy recommendations (Section 8).
2 Institutional Background and Literature Review
2.1 Institutional Background
Since the twenty-first century, the awareness of environmental protection has been deeply rooted in various fields such as economy, culture, and politics. As early as 1979, China promulgated the “Environmental Protection Law of the People’s Republic of China (Trial)” for the first time and began to collect a certain amount of pollution discharge fees, but this is only implemented in local areas and regions and has not been really carried out throughout China. In 1982, the Interim Measures for Collecting Pollutant Discharge Fees were subsequently promulgated, which were not well implemented due to various subjective and objective limitations. Until the party’s 16 national Congress, a new generation of central leadership proposed “harmonious development of human and nature,” and paid great attention to ecological protection, and implemented the “Regulations on the collection and use of pollution fees” in 2003, which was a milestone in the field of environmental protection, marking the beginning of the nationwide environmental regulation implementation. As it was issued by the State Council, the implementation was mandatory and rigid throughout China, and the punishment for pollution emission of enterprises was very severe stipulating one–three times fines and forced suspension of production. This is the first time that legislation has been used to regulate environmental pollution and bring out remarkable outcomes in China. The JiangSu Provincial Department of Environmental Protection has formulated the “Jiangsu Province Measures for the Issuance and Management of Pollutant Discharge Permits (Trial)” to standardize the behavior of pollutant discharge permits and strengthen the management of pollutant discharge permits. Through the implementation of policies, the innovation level of enterprises in the region has been significantly improved.
We collected data related to pollution discharge from 2001 to 2008 from the official website of the Ministry of Ecological and Environmental Protection of China. Figures 1 and 2 show the content of heavy metals, and the emission of sulfur dioxide and industrial dust in wastewater discharge, respectively. It can be seen from the figure that before the introduction of government environmental regulation in 2003, the emission of pollutants was on the rise. However, after the government imposed the discharge fee in 2003, the discharge of pollutants such as wastewater, waste gas, and industrial dust decreased significantly, indicating that enterprises significantly reduced the discharge of pollutants after the government imposed the discharge fee, and the discharge regulations played a significant role in reducing pollution and protecting the environment. After the implementation of the Chinese government’s environmental protection policies in 2003, the pollutant emissions of enterprises significantly decreased. However, this undoubtedly increased the cost burden on enterprises. So what impact does this have on their technological innovation.

Heavy metals in wastewater discharge from 2001 to 2008 in China.
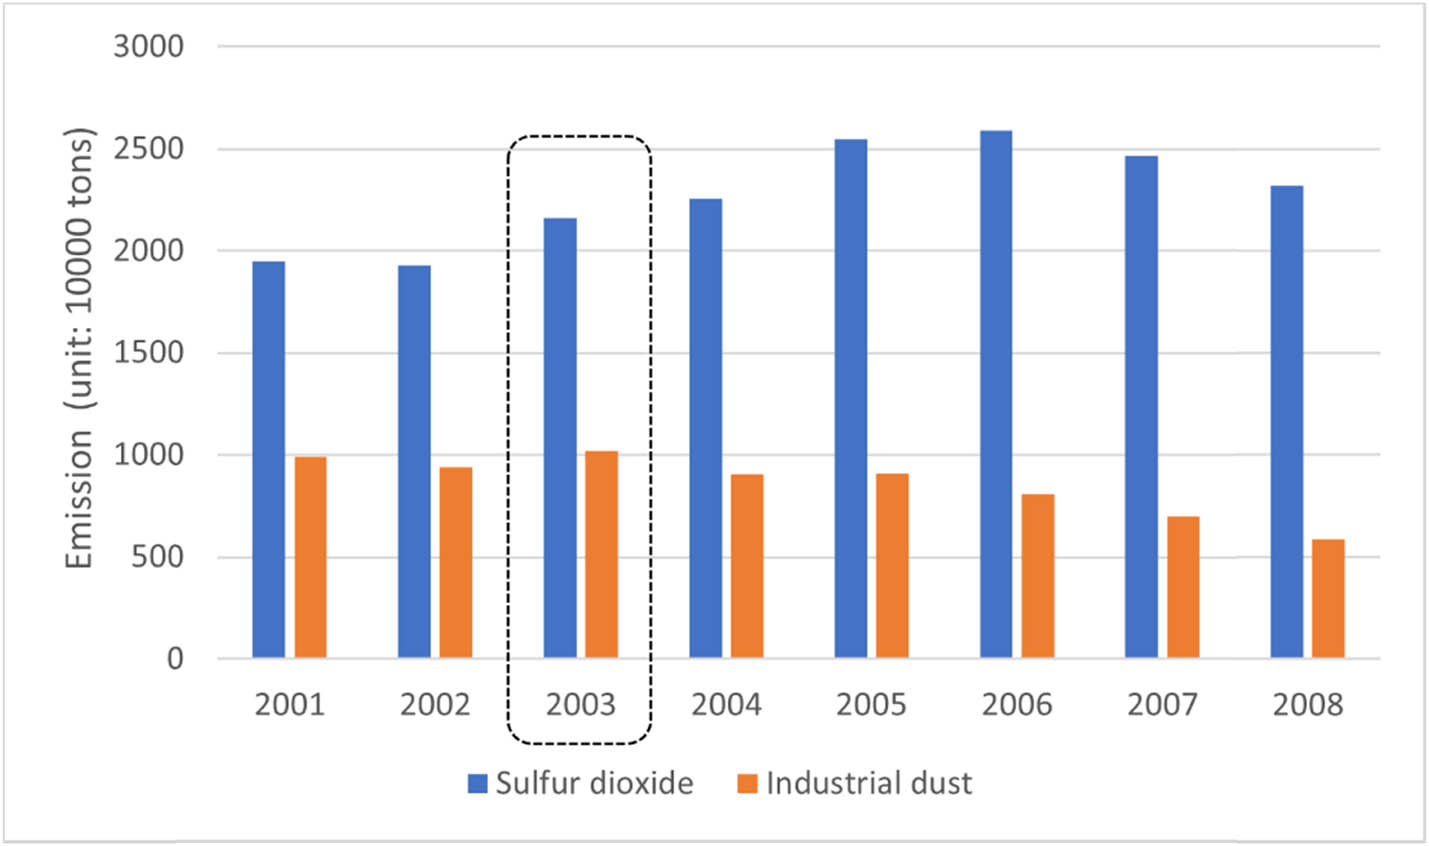
The emission of sulfur dioxide and industrial dust from 2001 to 2008 in China.
2.2 Literature Review
2.2.1 The Impact of Environmental Regulation on the Performance of Enterprises
Optimizing the business environments of enterprises has a great impact on enterprise performance, while the impact of environmental regulation on enterprise performance remains unclear. Current research results are mainly categorized into the following two aspects. First, the implementation of environmental regulations by the government will increase the production cost of enterprises, which has a negative impact on the performance of enterprises. Jie et al. (2014) found that government environmental regulation would increase the cost of production and operation of enterprises, thus having a negative impact on enterprise performance. Second, government environmental regulation has a positive impact on enterprise performance by promoting technological innovations and increasing enterprise production efficiencies. Ma et al. (2012) found that the positive effect of environmental regulation through technological innovation exceeded the negative effect caused by increased cost, which finally led to the increase of industrial performance. Yang and Peng (2021) found that environmental regulations have a positive impact on corporate performance. Similarly, Liu Xuezhi et al. (Liu & Duan, 2021) used the DID model to verify the positive impact of environmental regulations in the current period on enterprise performance in the following period. Javeed et al. (2020) studied the manufacturing industry in Pakistan and found that after considering the degree of product market competition, the promoting effect of environmental regulations on corporate performance is strengthened; Li et al. (2020) found that after considering the impact of organizational redundancy, it strengthened the effect of voluntary regulation on promoting green innovation.
2.2.2 The Impact of Environmental Regulation on the Innovations of Enterprises
Technological innovations are the major content and the core driving force of the development of enterprise. Due to its high investment, long time cycle, etc., enterprise technology innovation level is greatly influenced by internal resource allocation, external social financial support, and local environmental policies. Therefore, the changes in the intensity of regional environmental regulation will have a great impact on the production cost and financing constraints of enterprises, which might further affect the technological innovation level of enterprises. Reportedly, environmental regulation might reduce the capital flow and increase the financing constraints by increasing the production costs of enterprises, thus inhibiting the technological innovation of enterprises (Bi & Li, 2020; Liu & Ran, 2016).
Domestic and foreign scholars have made rich achievements in the research on the impact of environmental regulation policies on enterprise innovations, but there is no unified opinion. Some scholars admitted that environmental regulations such as emission tax and pollution permit have a positive impact on promoting the technological innovation of enterprises (Villegas-Palacio & Coria, 2010). Langpap and Shimshack (2010) took water pollution treatment in the United States as the research object and found that public participation regulation tools played a crucial role in preventing water pollution. However, some other scholars hold opposite views on this issue. On the one hand, the imposition of pollution tax and the improvement of emission standards both reduce the expected returns of enterprises’ research and development, which makes enterprises have to reduce their investment in research and development. Therefore, strict environmental regulation will reduce enterprises’ technological innovations (Antweiler et al., 2001). On the other hand, environmental regulation is equivalent to imposing new constraints on the production decision-making of enterprises, which will hinder the technological progress of enterprises (Becker, 2011; Lanoie et al., 2011). Other scholars believe that the impact of environmental regulation on technological innovation depends on the game of different forces. According to Porter’s hypothesis, the impact of environmental regulation on enterprise innovation depends on the game between “innovation compensation effect” and “compliance cost effect.” Appropriate environmental regulation policies can reduce the uncertainty of enterprises’ future expectations through strict policies, and force enterprises backward to carry out technological innovations. In this case, the production capacity of enterprises can also be improved. Specifically, Calel and Dechezlepretre (2011) took the Emissions Trading System of the European Union as the research object and found that the technological innovation level of enterprises regulated by environmental regulations had been improved.
Some scholars are concerned that the intensity of environmental regulations will change in stages with different time (Tong & Zhang, 2012). Specifically, although the cost of enterprises will increase in the short term along with the increases of the intensity of environmental regulations (Miao & Su, 2019; Zhao et al., 2019), the enterprises will be forced to improve their industrial structures and technological innovation levels in the long term (Den & Wang, 2021; Lv & Huang, 2021). Therefore, scholars have conducted relevant studies on the nonlinear relationship between environmental regulation intensity and enterprise innovation and found that the relationship shows a significant U-shaped curve (Feng & Jia, 2021; Fan et al., 2021; Wang et al., 2021), while other scholars found that the relationship between environmental regulation and enterprise technological innovation presents an inverted “U” shaped curve and an inverted “N” shaped curve (Wang & Liu, 2014; Yu et al., 2019; You & Li, 2022). Kesidou et al. argue that manufacturing enterprises located in regions with stricter environmental regulations have stronger technological innovation effects and can generate more green patents. Sun et al. conducted a study using data from 132 companies in 16 highly polluting industries in China and found that environmental regulations have a promoting effect on green technology progress, and companies pay more attention to research and development investment in environmental protection; Lanoie et al. studied enterprises in seven OECD countries and found that strict regulations can promote innovation (Kesidou & Wu, 2020; Lanoie et al., 2011; Sun et al., 2019).
Presently, there are many types of environmental regulations implemented in China, and different types of environmental regulations have significant heterogeneity on the innovation level of enterprises. Among them, the number of environmental legislation and the amount of pollutant discharge charges have a significant effect on the improvement of enterprises’ green technology innovation (Hua & Li, 2022; Jin et al., 2022; Zhang et al., 2021). In addition, the implementation of environmental regulations is greatly influenced by the government’s financial policies in China. The financial system in China is a combined system of political centralization and economic decentralization, which is influenced by the pressure of “promotion tournaments” of various regions. Local governments should not only maintain the growth of local economies but also protect local environments. Therefore, the impact of environmental regulation on the level of technological innovation of enterprises is closely related to the financial policies of local governments (Wu & You, 2019).
Collectively, there is no unified conclusion yet about the relationship between environmental protection regulation and enterprise technological innovation based on current studies, and the content of causal inference was not involved in relevant discussions, which has a strong endogeneity problem. In terms of the mechanisms, the current studies have not explored the impact on enterprise technological innovation from the perspective of enterprise operation decisions. (Griffith & Reenen, 2021; Guo & Liang, 2022).
3 Mechanisms Analysis
In order to pursue more profits, enterprises will constantly update technologies and improve the level of innovation. Generally speaking, government environmental regulations affect the export behaviors of enterprises mainly by encouraging enterprise innovation and promoting the increase of enterprise intermediate product input, so as to promote enterprises to increase the added values of export products and thus improve the quality of export products (Figure 3).

Mechanisms of environmental regulation on the level of enterprise innovation.
3.1 Enterprise Investment Mechanism
The nationwide environmental regulations are equivalent to strong constraints on companies, which force companies to make relative reactions under such conditions. On the one hand, the overall costs of enterprises will increase according to government’s strict environmental regulations. Briefly, enterprises have to increase investments in sewage equipment and improve production efficiencies in order to reduce production costs, which results in the increase of the fixed assets of enterprises in the book as the fixed assets investments. On the other hand, enterprises will pay more attention to the efficiencies of capital use, especially the efficiencies of investments. Briefly, enterprises would use limited resources intensively in the production fields, reduce the unit energy consumption and emissions of products, increase the unit investment efficiencies of products, and use the least resources to create the maximum value. In this chain, the government’s environmental regulations will increase the investment in fixed assets of enterprises. The increase of fixed assets improves the book value of enterprises and is conducive to promoting unit product investment efficiencies, improving the innovation degree and technological content of enterprises, and finally promoting the improvement of enterprise technological innovations.
3.2 Government Subsidy Mechanism
Notably, the Interim Measures for Collecting Pollution Charges issued in China in 2003 provided incentives for enterprises that complied with environmental protection emission standards or voluntarily reduced pollution emissions. Moreover, the purchase of energy-saving and emission-reduction equipment can be deducted from the input tax. All these have greatly reduced the production costs of enterprises. On the one hand, the government’s subsidized policies and subsidies for enterprises’ environmental protection reduced the cost of enterprises, increased the proportion of factor input, improved the production efficiencies of enterprises, and promoted the enthusiasm of enterprises to invest in the field of technological innovations. On the other hand, the funds available to enterprises have actually increased, and more funds can be used in the field of technology investment and research studies. Under such conditions, enterprises can be encouraged to improve the level of technological innovation.
4 Data Processing and Empirical Model
4.1 Data Sources
In this study, the China Industrial Enterprise Database, China Enterprise Pollution Database, and China Enterprise Innovation Database from 2000 to 2008 were used including a total of 32,035 observed values. Briefly, the database of Chinese industrial enterprises contains the basic information of state-owned enterprises and private enterprises above the designated size, including financial indicators, registration information, year of establishment, sales information, and cost information, which provides detailed data for our study of micro-enterprises. The Chinese Enterprise Pollution Database contains detailed data on pollution emission indicators of micro-enterprises, including exhaust gas, wastewater, industrial dust, and other pollution indicators. The enterprise innovation database contains the innovation indicators of micro-enterprises, including the number of patents granted and the number of patent applications.
4.2 Model of Measurement
In this study, the DID method is adopted to study the impact of the pollutant discharge fee implemented in 2003 on enterprise innovations, which is conducive to alleviating the possible endogeneity and missing variable bias. Because the pollutant discharge fee in 2003 was rolled out all at once without a pilot, we could not distinguish the treatment group and the control group according to the ordinary DID method. To solve this problem, we grouped the enterprises according to the median emission intensity of pollutants and then distinguished the treatment group and the control group. For this purpose, we established the DID model of intensity as follows:
Specifically, lnnova ict represents the innovation level of the ith enterprise of city c in the year t. treat is the divided intensity based on the median amount of pollution discharge, i.e., those that are greater than or equal to the median amount belonged to the treatment group, and those that are less than the median amount belonged to the control group. post is the virtual group when the pollution discharge fee is promulgated, i.e., those that are greater than or equal to 2003 were marked as 1, and those that are less than 2003 were marked as 0. X ict represents a series of control variables at the city level and the enterprise level. δ i represents the fixed effects of individual enterprises. σ c represents the fixed effects at the city level. θ t represents the fixed effects at the control time level. ε it is the random disturbance term. α 1 is the regression coefficient of DID that we were interested in.
4.3 Explained Variable
In this study, the logarithm of the number of patents and the logarithm of R&D expenditure were used as the explained variables. Specifically, the logarithm of the number of patents was used as the result of baseline regression, and the logarithm of R&D expenditure was used as the control index of robustness test.
4.4 Core Explanatory Variable
In this study, the pollution emission intensity of enterprises was established as the core explanatory variable. After the standardization of wastewater, waste gas, solid pollutants, and sulfur dioxide, the overall pollution emission index was synthesized by weighting. Then, the data of pollution emission indexes were arranged, i.e., those that are greater than or equal to the median amount belonged to the treatment group, and those that are less than the median amount belonged to the control group. The relevant variable names and statistical descriptions are shown in Table 1.
Variable names and statistical descriptions
| Variable name | Observations | Mean | Standard deviation | Min | Max |
|---|---|---|---|---|---|
| lnyf | 32,035 | 0.5963 | 2.079 | 0 | 14.3 |
| lnzl | 32,035 | 0.1949 | 0.6339 | 0 | 7.724 |
| did | 32,035 | 0.29 | 0.4539 | 0 | 1 |
| size | 31,995 | 11.6477 | 1.498 | 0 | 18.96 |
| lnL | 27,960 | 6.185 | 1.1838 | 0 | 11.3122 |
| lev | 31,995 | 0.5737 | 0.2913 | −0.2824 | 9.844 |
| finance | 31,947 | 0.036636 | 1.649 | −287.25 | 62.428 |
| age | 32,004 | 16.07 | 30.598 | 0 | 2008 |
| lnwage | 25,769 | 2.616 | 0.6998 | −5.2 | 7.529 |
| sub | 26,237 | 0.0032 | 0.0628 | −0.18 | 7.59 |
| lnkl | 27,909 | 4.313 | 1.26 | −3.4 | 10.9 |
| profit | 31,995 | 0.1977 | 27.954 | −2.37 | 5,000 |
| kc | 28,405 | 3.3 | 449.872 | 0 | 75,820 |
5 Main Results
5.1 Baseline Results
This study adopted the Chinese industrial enterprise database, pollution database, and enterprise innovation data from 2000 to 2008, including 32,035 observed values to identify the DID model. The estimated results are shown in Table 2. Specifically, the explained variable is the innovation level of the enterprise, and (1) is the logarithm of R&D expense as the regression result of the explained variable, and (2) is the regression result of control variables at the enterprise level added on the basis of (1), and (3) is the regression result of patent logarithm as the explained variable.
Regression results of basic variables
| Variable | (1) | (2) | (3) | (4) |
|---|---|---|---|---|
| R&D expenses | Add control variable | Number of patents | Add control variable | |
| lnyf | lnyf | lnzl | lnzl | |
| did | 0.506*** | 1.172*** | 0.089*** | 0.112*** |
| (0.049) | (0.110) | (0.014) | (0.019) | |
| size | 0.698*** | 0.113*** | ||
| (0.089) | (0.016) | |||
| lnL | 0.075 | 0.037** | ||
| (0.091) | (0.016) | |||
| lev | 0.374*** | −0.015 | ||
| (0.134) | (0.024) | |||
| finance | 0.034 | 0.003 | ||
| (0.021) | (0.004) | |||
| age | −0.000 | −0.000 | ||
| (0.001) | (0.000) | |||
| lnwage | 0.086* | 0.015 | ||
| (0.047) | (0.009) | |||
| sub | −0.073 | 0.030* | ||
| (0.106) | (0.017) | |||
| lnkl | 0.022 | 0.006 | ||
| (0.062) | (0.011) | |||
| profit | 0.189* | 0.016 | ||
| (0.113) | (0.021) | |||
| kc | −0.008 | −0.003 | ||
| (0.012) | (0.002) | |||
| Constant | 0.473*** | −8.449*** | 0.173*** | −1.432*** |
| (0.015) | (0.889) | (0.004) | (0.172) | |
| Observations | 30,462 | 20,145 | 30,462 | 20,145 |
| R-squared | 0.476 | 0.592 | 0.669 | 0.681 |
Notes: *, **, and *** indicate statistical significance at the 10, 5, and 1% levels, respectively.
Results of the basic regression showed that the coefficients were significantly positive, and all passed the 1% level test. In addition, when controlling variables at the enterprise level such as asset-liability ratio, enterprise size, enterprise life, and enterprise profit rate were added, there was no significant change in the results, and the coefficient was still significantly positive, indicating the robustness of the conclusion. Collectively, we concluded that the environmental regulation of pollutant discharge fees introduced by the Chinese government in 2003 had significantly improved the innovation level of enterprises.
5.2 Dynamic Effect and Parallel Trend Test
The premise of applying the DID method is that the treatment group and the control group have the same development trend before the policy shock. This study used the Event Study method reported by Jacobson et al. (1993) to verify the parallel trend of the DID model and further discussed the dynamic effects of policy shocks on this basis. The specific estimation is as follows:
Specifically, treat
it
is the pollution emission of the ith enterprise in the year t.
Figure 4 shows the test results of the parallel trend from 2001 to 2006. The point in the graph represents the β k estimate, and the dotted line passing through the point and perpendicular to the X-axis represents the 95% horizontal confidence interval. The X-axis represents the estimated value of β k from 2001 to 2006, and the policy occurred at the year 2003. As shown in Figure 4, the estimated value of β k at the year 2001 and 2002 fluctuates around 0, and the width of the corresponding 95% level confidence interval is wide and crosses 0, and the difference between the treatment group and the control group has not changed significantly. Collectively, the above results indicated that the parallel trend test has been passed.
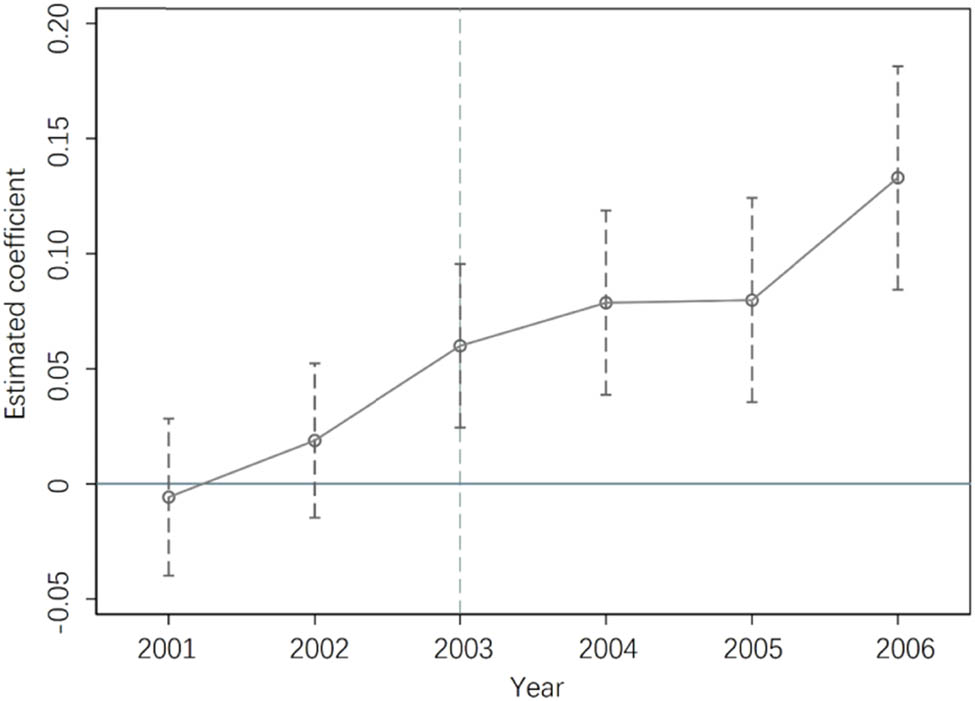
Parallel trend test chart from 2001 to 2006. Notes: The solid line plots the point estimation coefficient, and the dashed lines denote the 95% confidence interval.
From 2003 to 2006, the enterprises in the treatment group and the control group started to open a gap after the promulgation of the Regulations on the Collection and Use of Pollution Discharge Fees, indicating that the effects were brought about by the impact of the policy. In addition, Figure 4 also reflects the impact of the promulgation of the Regulations on the Collection and Use of Pollution Discharge Fees in 2003 on the level of technological innovation of enterprises. Currently, the estimated value of β k from 2003 to 2006 are all significantly positive, indicating that the promulgation of the pollution charge policy has promoted the innovation level of enterprises.
5.3 Robustness Test
Although the previous parallel trend test and DID results showed that environmental regulations have significantly improved the level of technological innovation of enterprises, it is still impossible to completely eliminate the endogenous problems caused by measurement errors and enterprise self-selection. In order to determine the reliability of the research results, we conducted a series of robustness tests.
5.3.1 Placebo Test
All the enterprises in 2003 from the overall panel data were selected with randomly selected 50% of them and matching them with the overall panel data. The 50% of the enterprises selected were used as the experimental group, and the rest were used as the control group. On this basis, DID processing was performed, and the processes were repeated for 200 times. The final results with the results of 200 random processes are shown in Figure 5. The X-axis represents the size of the estimated coefficient of the “pseudo policy dummy variable,” and the Y-axis represents the size of the density value and p value. The curve is the kernel density distribution of the estimated coefficient, the dot is the p value corresponding to the estimated coefficient, the vertical dotted line indicates the real estimated value (i.e., 0.112) of the DID model, and the horizontal dotted line is the significance level (i.e., 0.1). The estimation coefficients are mostly concentrated near zero, and most of the p statistics are greater than 0.1. The true estimates of the DID model belong to obvious outliers, indicating that our regression results passed the placebo test.

Placebo test.
5.3.2 Robustness Test of the Explained Variable
The first method is to shrink the tail of the explained variable. We shrank the tail of the explained variable by 1%. Column (1) is the result of shrinking the tail of the enterprise’s R&D expense data, and Column (2) is the result of shrinking the number of enterprise patents. Results showed that the regression results of the explained tail shrinking treatment were significantly positive, which were consistent with the benchmark regression results and further proved the robustness of the regression results.
5.3.3 Exclude Bankrupt Enterprise Data
The second method is to exclude bankrupt enterprise data. To further explore the impact of the environmental regulation policies of the National Regulations on the Collection and Use of Pollution Discharge Fees in 2003 on the level of enterprise technological innovation, we replaced the sample with enterprises that only retain sustainable operation and removed the R&D expenses and enterprise patent data of bankrupt enterprises from the sample data during the entire sample period because sustainable developments are worthwhile goals of enterprises. Columns (3) and (4) of Table 3 are the regression results after excluding the bankrupt enterprises in the sample period. It can be found that the results are significantly positive and consistent with the benchmark regression results, further proving the robustness of the regression results.
Robustness tests excluding bankrupt enterprise data
| Variable | (1) | (2) | (3) | (4) |
|---|---|---|---|---|
| Robustness test of the explained variable | Exclude bankrupt enterprise data | |||
| new_lnyf | new_lnzl | lnyf | lnzl | |
| did | 1.122*** | 0.108*** | 1.167*** | 0.119*** |
| (0.128) | (0.021) | (0.132) | (0.024) | |
| size | 0.641*** | 0.094*** | 0.662*** | 0.100*** |
| (0.103) | (0.018) | (0.106) | (0.019) | |
| lnL | 0.002 | 0.017 | 0.026 | 0.027 |
| (0.104) | (0.017) | (0.109) | (0.019) | |
| lev | 0.363** | −0.026 | 0.382** | −0.027 |
| (0.159) | (0.025) | (0.162) | (0.026) | |
| finance | 0.014 | 0.003 | 0.015 | 0.003 |
| (0.020) | (0.004) | (0.020) | (0.004) | |
| age | 0.000 | −0.000 | 0.000 | −0.000 |
| (0.000) | (0.000) | (0.000) | (0.000) | |
| lnwage | 0.101* | 0.007 | 0.114** | 0.010 |
| (0.052) | (0.009) | (0.054) | (0.010) | |
| sub | −0.038 | 0.004 | -0.033 | 0.007 |
| (0.116) | (0.009) | (0.117) | (0.008) | |
| lnkl | −0.026 | 0.001 | −0.023 | 0.001 |
| (0.072) | (0.012) | (0.075) | (0.013) | |
| profit | 0.076 | 0.014 | 0.079 | 0.014 |
| (0.107) | (0.020) | (0.109) | (0.021) | |
| kc | −0.002 | −0.001 | −0.003 | −0.002 |
| (0.007) | (0.001) | (0.008) | (0.002) | |
| Constant | −7.194*** | −1.054*** | −7.644*** | −1.187*** |
| (1.045) | (0.183) | (1.088) | (0.198) | |
| Observations | 14,748 | 14,748 | 14,748 | 14,748 |
| R-squared | 0.611 | 0.675 | 0.613 | 0.705 |
Notes: *, **, and *** indicate statistical significance at the 10, 5, and 1% levels, respectively.
5.4 Analysis of Heterogeneity
5.4.1 Heterogeneity of Enterprise Ownerships (State-Owned Enterprises vs Private Enterprises)
In China, whether the effect of environmental regulations on enterprise technological innovation is different among enterprises of different ownerships (i.e., state-owned enterprises and private enterprises) remains unclear. Generally speaking, state-owned enterprises are more closely connected with the government with quite different management structures, operation modes and the degrees of government intervention compared with private enterprises. After the implementation of the environmental regulation policies, state-owned enterprises shoulder greater social responsibilities, face higher social supervision pressures, and have to improve R&D investments. Comparatively, private enterprises will generally adopt the strategy of technology upgrading to integrate enterprise development with environmental protection and improve their innovation abilities after the implementation of environmental regulation policies because private enterprises are more subject to market competition pressures.
In this study, the enterprise samples were divided into state-owned enterprises and private enterprises, and the results of the heterogeneity of enterprise characteristics are shown in Table 4. Briefly, columns (1) and (3) are the regression results of private enterprises, and columns (2) and (4) are the regression results of state-owned enterprises. Results showed that the regression coefficient of R&D expenditure of enterprises is significantly positive regardless of state-owned enterprises or private enterprises. However, in terms of the number of enterprise patents, only private enterprises are significantly positive, which indicated that environmental regulation can increase the number of patents of private enterprises probably because private enterprises face greater pressure from market competition and need to improve their technological innovation level to gain market competitive advantages.
Heterogeneity of enterprise ownerships (state-owned enterprises vs private enterprises)
| Variable | (1) | (2) | (3) | (4) |
|---|---|---|---|---|
| Private enterprise | State-ownedenterprise | Private enterprise | State-ownedenterprise | |
| lnyf | lnyf | lnzl | lnzl | |
| did | 0.493*** | 1.370*** | 0.066*** | 0.076 |
| (0.109) | (0.375) | (0.019) | (0.068) | |
| size | 0.591*** | 1.740*** | 0.080*** | 0.311*** |
| (0.087) | (0.289) | (0.015) | (0.070) | |
| lnL | 0.233*** | 0.499* | 0.039*** | 0.065 |
| (0.087) | (0.283) | (0.015) | (0.070) | |
| lev | 0.064 | 0.693* | −0.030 | 0.024 |
| (0.141) | (0.355) | (0.025) | (0.078) | |
| finance | −0.001 | −0.301 | −0.002 | −0.216* |
| (0.020) | (0.297) | (0.004) | (0.126) | |
| age | −0.001 | 0.002** | 0.000 | 0.000 |
| (0.001) | (0.001) | (0.000) | (0.000) | |
| lnwage | 0.108** | 0.259** | 0.011 | 0.003 |
| (0.049) | (0.130) | (0.010) | (0.031) | |
| sub | 0.024 | −1.945 | 0.014** | 0.503 |
| (0.150) | (1.658) | (0.006) | (0.382) | |
| lnkl | 0.028 | −0.061 | 0.010 | −0.041 |
| (0.064) | (0.200) | (0.011) | (0.046) | |
| profit | −0.008 | 0.652 | -0.011 | 0.260 |
| (0.106) | (0.938) | (0.020) | (0.222) | |
| kc | −0.058 | −0.000 | −0.008 | −0.002 |
| (0.045) | (0.004) | (0.008) | (0.001) | |
| Constant | −7.873*** | −25.065*** | −1.069*** | −3.860*** |
| (0.886) | (2.706) | (0.171) | (0.659) | |
| Observations | 15,516 | 4,160 | 15,516 | 4,160 |
| R-squared | 0.585 | 0.781 | 0.693 | 0.708 |
Notes: *, **, and *** indicate statistical significance at the 10, 5, and 1% levels, respectively.
5.4.2 Heterogeneity of Different Regions in China (Coastal Enterprises vs Inland Enterprises)
The regional imbalance of economic and social development is obvious in China. Different geographical locations have different resources and technological elements, and the role of environmental regulation may also be different. According to the classification standard of HYT094-2006 Classification and Code of Coastal Administrative Regions (issued by the State Oceanic Administration in 2006), the enterprise samples were categorized into coastal enterprises and inland enterprises, and regressions were conducted respectively. The results are shown in Table 5. Briefly, columns (1) and (3) are inland enterprises, and Columns (2) and (4) are the regression results of coastal enterprises. Results showed that the regression coefficient of enterprise R&D cost and the number of patents is significantly positive, both for inland enterprises and for coastal enterprises, and has passed the 1% robustness test. In terms of R&D cost, coastal enterprises play a stronger role in promoting the number of patents. In terms of the number of patents, the number of patents of inland enterprises is higher than that of coastal enterprises due to the larger size of scientific research institutions such as research institutes in inland areas.
Heterogeneity of different regions in China (coastal enterprises vs inland enterprises)
| Variable | (1) | (2) | (3) | (4) |
|---|---|---|---|---|
| Inland enterprises | Coastal enterprises | Inland enterprises | Coastal enterprises | |
| lnyf | lnyf | lnzl | lnzl | |
| did | 0.997*** | 1.030*** | 0.117*** | 0.089*** |
| (0.197) | (0.138) | (0.034) | (0.023) | |
| size | 0.983*** | 0.548*** | 0.148*** | 0.092*** |
| (0.171) | (0.105) | (0.031) | (0.019) | |
| lnL | −0.225 | 0.252** | 0.043 | 0.035* |
| (0.168) | (0.109) | (0.032) | (0.018) | |
| lev | 0.613** | 0.288* | −0.007 | −0.015 |
| (0.245) | (0.155) | (0.044) | (0.030) | |
| finance | −0.001 | −0.016 | −0.001 | 0.009 |
| (0.015) | (0.055) | (0.002) | (0.010) | |
| age | 0.000 | −0.006 | −0.000 | −0.000 |
| (0.000) | (0.006) | (0.000) | (0.001) | |
| lnwage | 0.051 | 0.069 | 0.016 | 0.011 |
| (0.084) | (0.057) | (0.017) | (0.011) | |
| sub | −0.004 | 0.241 | 0.026*** | 0.283 |
| (0.049) | (1.927) | (0.010) | (0.197) | |
| lnkl | −0.152 | 0.095 | −0.011 | 0.013 |
| (0.113) | (0.075) | (0.021) | (0.013) | |
| profit | 1.295** | −0.079 | −0.016 | 0.048 |
| (0.548) | (0.285) | (0.114) | (0.050) | |
| kc | −0.080*** | −0.004 | −0.011** | −0.003 |
| (0.030) | (0.010) | (0.005) | (0.002) | |
| Constant | −9.210*** | −7.885*** | −1.831*** | −1.191*** |
| (1.598) | (1.068) | (0.324) | (0.197) | |
| Observations | 7,432 | 12,709 | 7,432 | 12,709 |
| R-squared | 0.626 | 0.569 | 0.662 | 0.696 |
Notes: *, **, and *** indicate statistical significance at the 10, 5, and 1% levels, respectively.
5.4.3 Heterogeneity of Whether it is an Export Enterprise (Export Enterprises vs Nonexport Enterprises)
The differences between export enterprise and nonexport enterprise have always been the discussion subjects and research topics in the field of microeconomics. Therefore, enterprise samples were categorized into export enterprises and nonexport enterprises and regressions were conducted respectively. The results are shown in Table 6. Briefly, columns (1) and (3) are the regression results of nonexport enterprises, and columns (2) and (4) are the regression results of export enterprises. Results showed that the regression coefficients of export enterprises and nonexport enterprises are significantly positive in terms of R&D costs, while the nonexport enterprises are not significant in terms of the number of exclusive interests. Compared with nonexport enterprises, environmental regulation policies have a greater impact on export enterprises probably because the implementation of environmental regulation policies has a greater impact on China’s export enterprises’ technological innovation activities through the “reverse force effect of green trade barriers,” “export learning effects,” and “competition effects.”
Heterogeneity of whether it is an export enterprise (nonexport enterprises vs export enterprises)
| Variable | (1) | (2) | (3) | (4) |
|---|---|---|---|---|
| Nonexport enterprises | Export enterprises | Nonexport enterprises | Export enterprises | |
| lnyf | lnyf | lnzl | lnzl | |
| did | 0.755** | 1.268*** | 0.020 | 0.119*** |
| (0.364) | (0.120) | (0.065) | (0.021) | |
| size | 0.598** | 0.717*** | 0.025 | 0.126*** |
| (0.285) | (0.101) | (0.053) | (0.019) | |
| lnL | 0.130 | 0.130 | 0.084 | 0.038** |
| (0.283) | (0.102) | (0.052) | (0.018) | |
| lev | 0.684* | 0.374** | −0.009 | −0.012 |
| (0.402) | (0.148) | (0.098) | (0.025) | |
| finance | 0.605 | 0.048** | 0.024 | 0.003 |
| (0.698) | (0.022) | (0.057) | (0.004) | |
| age | −0.010 | −0.000 | 0.003 | −0.000 |
| (0.014) | (0.001) | (0.002) | (0.000) | |
| lnwage | 0.083 | 0.115** | 0.015 | 0.015 |
| (0.153) | (0.054) | (0.031) | (0.011) | |
| sub | 2.879 | −0.079 | 0.071 | 0.029** |
| (6.590) | (0.104) | (0.929) | (0.013) | |
| lnkl | −0.124 | 0.097 | 0.038 | 0.010 |
| (0.155) | (0.073) | (0.031) | (0.013) | |
| profit | −0.582 | 0.263** | −0.342* | 0.017 |
| (0.747) | (0.120) | (0.196) | (0.021) | |
| kc | 0.009*** | −0.085 | −0.001*** | −0.015 |
| (0.001) | (0.052) | (0.000) | (0.009) | |
| Constant | −7.273** | −9.351*** | −0.842* | −1.611*** |
| (2.960) | (1.005) | (0.482) | (0.201) | |
| Observations | 1,656 | 17,497 | 1,656 | 17,497 |
| R-squared | 0.636 | 0.608 | 0.702 | 0.691 |
Notes: *, **, and *** indicate statistical significance at the 10%, 5%, and 1% levels, respectively.
6 Underlying Mechanisms
This study explored the impact of the environmental regulation policies of “Regulations on the Collection and Use of Pollution Discharge Fees” promulgated in China in 2003 on the level of technological innovation of enterprises through rich identification tests and a series of robustness analyses. Next, we continued to investigate the specific transmission mechanism how the introduction of environmental regulation policies on pollution charges affects enterprise innovation.
6.1 Enterprise Investment Incentives
In order to investigate the underlying mechanisms, this study uses the logarithm of the enterprise’s fixed assets as the explained variable and regresses the interaction item treat* post. The model is as follows:
Specifically, lninvt ict represents the logarithm of fixed assets of the ith enterprise of city c in the year t. Other indicators are consistent with the benchmark regression model. The corresponding regression results are shown in columns (1) and (2) of Table 7. Results showed that the enterprise fixed assets were the explained variable in the regression, and the regression coefficient of the interaction item treat * post was positive and passed the 1% significance test. After the government issued the environmental regulation policy of Pollution Discharge Fee, enterprises were subject to strict restrictions on the discharge of wastewater, waste gas, and solid waste, and had to increase their investment in pollution control equipment, so as to improve the technological innovation level of enterprises through the increase of their fixed assets.
Regression results of government subsidy incentive
| Variable | (1) | (2) | (3) | (4) |
|---|---|---|---|---|
| Enterprise investment | Government funds | |||
| did | 6.266*** | 7.455*** | 0.083*** | 0.114*** |
| (1.376) | (1.756) | (0.030) | (0.041) | |
| size | 4.497*** | 0.056** | ||
| (1.258) | (0.026) | |||
| lnL | 12.063*** | 0.025 | ||
| (1.360) | (0.032) | |||
| lev | 5.155*** | 0.057* | ||
| (1.532) | (0.033) | |||
| finance | 0.753** | 0.009 | ||
| (0.350) | (0.009) | |||
| age | −0.012 | −0.000 | ||
| (0.011) | (0.000) | |||
| lnwage | 0.797 | −0.010 | ||
| (0.551) | (0.011) | |||
| sub | 1.020** | 11.324*** | ||
| (0.440) | (0.234) | |||
| lnkl | 10.711*** | 0.036 | ||
| (1.361) | (0.022) | |||
| profit | 3.674** | 0.049 | ||
| (1.804) | (0.049) | |||
| kc | 0.294 | −0.006 | ||
| (0.208) | (0.005) | |||
| Constant | 15.267*** | −163.377*** | 0.058*** | −0.934*** |
| (0.420) | (20.903) | (0.009) | (0.252) | |
| Observations | 30,462 | 20,145 | 28,265 | 20,145 |
| R-squared | 0.888 | 0.930 | 0.376 | 0.618 |
Notes: *, **, and *** indicate statistical significance at the 10%, 5%, and 1% levels, respectively.
6.2 Government Subsidy Incentive
The R&D activities of enterprises will be affected by government policy incentives. The Pollution Discharge Fee policy is essentially a punitive measure for enterprises with high pollution, and there are preferential policies and corresponding subsidy policies for enterprises with low pollution and enterprises taking the initiative to reduce emissions. In order to investigate the mechanism of government subsidies, we used the logarithm of the amount of government subsidies as the explanatory variable to regress the interaction term. The constructed model is as follows:
Specifically, Fund refers to the logarithm of government subsidies, while the ith enterprise in city c has the logarithm of government subsidies in year t. Other indicators are consistent with the benchmark regression model. The corresponding regression results are shown in columns (1) and (2) of Table 7. Results showed that the regression coefficient of the interactive term TRP is positive in the regression with government subsidies as the explained variable, and it has passed the 1% significance test. It can be concluded that environmental regulation promotes the level of enterprise innovation through policy subsidies.
7 Conclusion
Since the Chinese government proposed that “lucid waters and lush mountains are invaluable assets,” the ecological environment has received unprecedented attention. Development is the basis and key to solving all problems in China. It is undoubtedly of great significance to discuss the impact of environmental regulation on enterprises’ exports in such a developing country in the period of economic transition. This study finds that government environmental regulation has significantly improved the level of technological innovation of enterprises, and the conclusion is still valid after a series of robustness tests. The results of the parallel trend verify the rationality of the dual difference setting, and the dynamic effect shows that the pollution charge has a continuous role in promoting the technological innovation of enterprises. The results of the placebo test rejected the original assumptions of the model. Heterogeneity analysis showed that there was significant heterogeneity between state-owned enterprises and private enterprises, coastal enterprises and inland enterprises, export enterprises, and nonexport enterprises. Further mechanism verification revealed that the strengthening of environmental regulation by Chinese governments promoted the enterprise’s technological innovation by promoting the enterprise’s fixed asset investments and government subsidies.
According to the research conclusions of this study, Environmental policy can have a positive impact on technological innovation. By forcing enterprises to reduce the emission limits of waste and pollutants, the environmental policy requires enterprises to adopt environmental protection technologies in new construction and renovation projects, and encourages enterprises to develop environmental protection, energy saving, and resource recycling industries. The driving role of this policy leads to the development direction of green environmental protection and a low-carbon economy, which leads to technological transformation and technological innovation of enterprises. The policy implications are as follows: (1) environmental regulation can significantly promote the level of technological innovation of enterprises and improve the investment in fixed assets of enterprises. At the same time, if enterprises need to purchase pollutant treatment equipment and machinery for pollution control, according to China’s environmental regulation policy, they have the opportunity to obtain corresponding government subsidies. This situation shows that government environmental regulation can achieve a “win–win” effect with enterprises to a certain extent. To this end, the government should continue to improve environmental regulation. In the process of environmental regulation and governance of the government in the future, taxation and the use based on the benefit principle should be considered. Under the principle of reasonableness and moderation, the government regulation of environmental protection should be further improved. On the basis of meeting the government’s benefits and the ecological environment, the rights and interests of enterprises should be protected. (2) The role of environmental regulation on the level of technological innovation of enterprises shows obvious heterogeneity in enterprises of different ownership (state-owned enterprises vs private enterprises) and different locations (coastal enterprises vs inland enterprises). On the one hand, environmental regulation should be adapted to local conditions, allowing and encouraging local governments to formulate environmental regulations suitable for the development of their own regions. On the other hand, we should break down administrative barriers and regional barriers, promote the free flow of factor resources across regions, accelerate the integration of domestic factor markets and intermediate products into the market, adopt policies and systems that treat state-owned enterprises and private enterprises equally so as to form a good market environment, and provide maximum convenience for exports. (3) The government’s environmental regulation involves both the interests of the government and the interests of enterprises. Fundamentally, it is the transformation of the economic development structures. Therefore, we should fully respect the status of the market subject, widely publicize environmental regulation, improve the understanding level of the market subject, actively guide the market subject to abide by environmental regulation, take advantages of environmental regulation in promoting enterprise innovation, and promote the high-quality developments of enterprises. (4) Another crucial aspect of the role of government regulation in innovation is the impact of competition between enterprises on innovation rate and speed. Changes in government regulation can also affect the innovation level of enterprises due to market competition. (5) The drawbacks are also obvious. Excessive environmental regulation can lead to high investment costs for enterprises in pollution control, which is not conducive to their long-term development. In the future, reasonable environmental supervision measures should be formulated based on the implementation situation in the region.
-
Funding information: This research received no external funding.
-
Author contributions: Conceptualization, software, visualization and writing – original draft, Y.W.; project administration, W.Y.; validation, Y.W.; formal analysis and methodology, Y.W. and B.W.; data curation, Y.W.; investigation, B.W.; resources, Y.W. and W.Y.; supervision, Y.W. and W.Y.; writing – review and editing, Y.W., W.Y., B.W. All authors have read and agreed to the published version of the manuscript.
-
Conflict of interest: The authors declare no conflict of interest.
-
Article note: As part of the open assessment, reviews and the original submission are available as supplementary files on our website.
-
Data availability statement: The data sets generated during and/or analyzed during the current study are available from the corresponding author on reasonable request.
Appendix A. Variable Descriptions
Variable descriptions
| Variable name | Data descriptions |
|---|---|
| lnyf | Logarithm of research and development costs |
| lnzl | Logarithm of enterprise patents |
| did | Core variable of DID model(treat*post) |
| size | Logarithm of total assets |
| lnL | Logarithm of the number of employees |
| lev | Total corporate liabilities/total corporate assets |
| finance | Interest expense/fixed assets |
| age | Current year minus year of business opening |
| lnwage | Logarithm of (Total wages payable/number of employees) |
| sub | Government subsidies/total sales |
| lnkl | Logarithm of (Total fixed assets/number of employees) |
| profit | Total profit/total corporate assets |
| kc | Fixed assets/Gross industrial output value |
References
Antweiler, W., Copeland, B. R., & Taylor, M. S. (2001). Is free trade good for the environment?. The American Economic Review, 91(4), 877–908.10.1257/aer.91.4.877Search in Google Scholar
Becker, R. A. (2011). Local environmental regulation and plant-level productivity. Ecology Economics, 70(12), 2516–2522.10.1016/j.ecolecon.2011.08.019Search in Google Scholar
Bi, P., & Li P. P. (2020). Environmental regulation, government support and enterprise innovation output. Enterprise Economy, 39(6), 70–79.Search in Google Scholar
Calel, R., & Dechezlepretre, A. (2011). Environmental policy and directed technological change: Evidence from the European carbon market. Climate Change and Sustainable Development, 98(1), 173–191.10.1162/REST_a_00470Search in Google Scholar
Den, Y. P., & Wang, L. (2021). Does environmental regulation promote green innovation capability – Empirical evidence from China. Statistical Research, 38(7), 76–86.Search in Google Scholar
Fan, J., Hu, J., & Jiang, W. M. (2021). Research on the correlation between environmental regulation and technological innovation – A test of the “Porter Hypothesis”. Journal of Industrial Technological Economics, 40(5), 75–81.Search in Google Scholar
Feng, Z. X., & Jia, N. T. (2021). Environmental regulation and technological innovation of heterogeneous enterprises – based on the research of listed companies in industrial industry. Research on Economics and Management, 42(3), 20–34.Search in Google Scholar
Griffith, R., & Reenen, J. V. (2021). Product market competition, creative destruction and innovation. IFS Working Papers.Search in Google Scholar
Guo, R., & Liang, Y. (2022). Environmental regulation, fiscal decentralization and high-quality economic growth. Journal of Dalian University of Technology (Social Sciences), 43(3), 51–61.Search in Google Scholar
Hua, S. M., & Li, J. Z. (2022). Whether environmental regulation tools can achieve “quality improvement increment” of green technological innovation of enterprises under the digital economy [J/OL]. Science & Technology Progress and Policy, 40(8), 141–150.Search in Google Scholar
Jacobson, L. S., Lalonde, R. J., & Sullivan, D. G. (1993). Earnings losses of displaced workers. American Economic Review, 83, 685–709.10.17848/wp92-11Search in Google Scholar
Javeed, S. A., Latief, R., & Lefen, L. (2020). An analysis of relationship between environmental regulations and firm performance with moderating effects of product market competition: Empirical evidence from Pakistan. Journal of Cleaner Production, 254, 120197.10.1016/j.jclepro.2020.120197Search in Google Scholar
Jie, M. H., Wang, J., & Liu, D. M. (2014). Environmental regulation, technological innovation and business performance. Nankai Business Review, 17(6), 106–113.Search in Google Scholar
Jin, X., Guan, H. X., & Chen, S. (2022). How do environmental regulation tools affect green technology innovation of enterprises – Heterogeneity effect research based on dual perspectives. Frontiers of Science and Technology of Engineering Management, 41(4), 62–68.Search in Google Scholar
Kesidou, E, & Wu, L. (2020). Stringency of environmental regulation and eco-innovation: Evidence from the eleventh Five-Year Plan and green patents. Economics Letters, 190(c), 109090.10.1016/j.econlet.2020.109090Search in Google Scholar
Lanoie, P., Laurent-Lucchetti, J., Johnstone, N., & Ambec, S. (2011). Environmental policy, innovation and performance: New insights on the Porter hypothesis. Journal of Economics & Management Strategy, 20(3), 803–842.10.1111/j.1530-9134.2011.00301.xSearch in Google Scholar
Langpap, C., & Shimshack, J. (2010). Private citizen suits and public enforcement: Substitutes or Complements. Environmental Economics and Management, 59(3), 235–249.10.1016/j.jeem.2010.01.001Search in Google Scholar
Li, D., Tang, F., & Zhang, L. (2020). Differential effects of voluntary environmental programs and mandatory regulations on corporate green innovation. Natural Hazards, 103, 3437–3456.10.1007/s11069-020-04137-ySearch in Google Scholar
Liu, C. L., & Ran, M. S. (2016). The impact of environmental regulation on enterprise technological innovation under financing constraints. Systems Engineering, 34(12), 62–69.Search in Google Scholar
Liu, X. Z, & Duan, D. D. (2021). Environmental regulation, technological innovation and enterprise performance: A quasi natural experiment based on VOCs pollution charge policy in petrochemical industry. Chinese Journal of Environmental Management, 13(2), 94–101 + 133.Search in Google Scholar
Lv, P., & Huang, S. Q. (2021). Will the pressure of environmental regulation promote the transformation and upgrading of enterprises. Nankai Business Review, 24(4), 116–129.Search in Google Scholar
Ma, H. L., Huang, D. C, & Yao, H. Z. (2012). Technological innovation, industrial performance and environmental regulation: An empirical analysis based on the Yangtze River Delta. Soft Science, 26(1), 1–5.Search in Google Scholar
Miao, M., & Su, Y. D. (2019). The impact of environmental regulation on enterprise technological innovation – A test of intermediary effect based on financing constraints. Soft Science, 33(12), 100–107.Search in Google Scholar
Porter, M. E., & van der Linde, C. (1995). Toward a new conception of the environment-competitiveness relationship. Journal of Economic Perspectives, 9(4), 97–118.10.1257/jep.9.4.97Search in Google Scholar
Sun, Y, Du, J, & Wang, S. (2019). Environmental regulations, enterprise productivity, and green technological progress: Large-scale data analysis in China. Annals of Operations Research, 290, 369–384.10.1007/s10479-019-03249-4Search in Google Scholar
Tong, W, & Zhang, J. M. (2012). Can environmental regulation promote technological innovation -- A reexamination based on the data of Chinese manufacturing enterprises. Finance & Economics, 11, 66–74.Search in Google Scholar
Villegas-Palacio, C., & Coria, J. (2010). On the interaction between imperfect compliance and technology adoption: Taxes versus tradable emissions permits. Journal of Regulatory Economics, 38(3), 274–291.10.1007/s11149-010-9125-0Search in Google Scholar
Wang, J., & Liu, B. (2014). Environmental regulation and total factor productivity of enterprises: Empirical analysis based on data of Chinese industrial enterprises. China Industrial Economics, 3, 44–56.Search in Google Scholar
Wang, G. Y., & Wan, D. (2011). Porter hypothesis, environmental regulation and technological innovation of enterprises: A comparative analysis of the Middle East. China Soft Science, 1(1), 100–112.Search in Google Scholar
Wang, Z. Y., Cao, Y., & Lin, S. L. (2021). Characteristics and heterogeneity of environmental regulation’s impact on green technology innovation of enterprises – based on green patent data of Chinese listed companies. Studies in Science of Science, 39(5), 909–919+929.Search in Google Scholar
Wu, G. Z., & You, M. D. (2019). The impact mechanism of environmental regulation on technological innovation and green total factor productivity: The regulatory role based on fiscal decentralization. Journal of Industrial Engineering and Engineering Management, 33(1), 37–50.Search in Google Scholar
Yang, R, & Peng, A. (2021). Environmental regulation, technological innovation and performance of heavily polluting enterprises. Journal of East China Normal University(Humanities and Social Sciences), 53(1), 129–141 + 173–174.Search in Google Scholar
Yu, K. X., Hu, X. Q., & Song, Z. (2019). Environmental regulation, government support and green technology innovation – An empirical study based on resource-based enterprises. Journal of Yunnan University of Finance and Economics, 35(4), 100–112.Search in Google Scholar
You, M. D., & Li, L. N. (2022). Environmental regulation intensity, frontier technology gap and enterprise green technology innovation. Soft Science, 36(8), 108–114.Search in Google Scholar
Zhang, G. X., Feng, W. C., & Wang, A. L. (2021). Research on the heterogeneity effect of different types of environmental regulations on technological innovation of industrial enterprises. Management Review, 33(1), 92–102.Search in Google Scholar
Zhao, L., Xue, Y, & Hu, Y. Q. (2019). Environmental regulation intensity and technological innovation: An empirical study from pollution intensive manufacturing industry. Science & Technology Progress and Policy, 36(10), 59–65.Search in Google Scholar
© 2024 the author(s), published by De Gruyter
This work is licensed under the Creative Commons Attribution 4.0 International License.
Articles in the same Issue
- Regular Articles
- Political Turnover and Public Health Provision in Brazilian Municipalities
- Examining the Effects of Trade Liberalisation Using a Gravity Model Approach
- Operating Efficiency in the Capital-Intensive Semiconductor Industry: A Nonparametric Frontier Approach
- Does Health Insurance Boost Subjective Well-being? Examining the Link in China through a National Survey
- An Intelligent Approach for Predicting Stock Market Movements in Emerging Markets Using Optimized Technical Indicators and Neural Networks
- Analysis of the Effect of Digital Financial Inclusion in Promoting Inclusive Growth: Mechanism and Statistical Verification
- Effective Tax Rates and Firm Size under Turnover Tax: Evidence from a Natural Experiment on SMEs
- Re-investigating the Impact of Economic Growth, Energy Consumption, Financial Development, Institutional Quality, and Globalization on Environmental Degradation in OECD Countries
- A Compliance Return Method to Evaluate Different Approaches to Implementing Regulations: The Example of Food Hygiene Standards
- Panel Technical Efficiency of Korean Companies in the Energy Sector based on Digital Capabilities
- Time-varying Investment Dynamics in the USA
- Preferences, Institutions, and Policy Makers: The Case of the New Institutionalization of Science, Technology, and Innovation Governance in Colombia
- The Impact of Geographic Factors on Credit Risk: A Study of Chinese Commercial Banks
- The Heterogeneous Effect and Transmission Paths of Air Pollution on Housing Prices: Evidence from 30 Large- and Medium-Sized Cities in China
- Analysis of Demographic Variables Affecting Digital Citizenship in Turkey
- Green Finance, Environmental Regulations, and Green Technologies in China: Implications for Achieving Green Economic Recovery
- Coupled and Coordinated Development of Economic Growth and Green Sustainability in a Manufacturing Enterprise under the Context of Dual Carbon Goals: Carbon Peaking and Carbon Neutrality
- Revealing the New Nexus in Urban Unemployment Dynamics: The Relationship between Institutional Variables and Long-Term Unemployment in Colombia
- The Roles of the Terms of Trade and the Real Exchange Rate in the Current Account Balance
- Cleaner Production: Analysis of the Role and Path of Green Finance in Controlling Agricultural Nonpoint Source Pollution
- The Research on the Impact of Regional Trade Network Relationships on Value Chain Resilience in China’s Service Industry
- Social Support and Suicidal Ideation among Children of Cross-Border Married Couples
- Asymmetrical Monetary Relations and Involuntary Unemployment in a General Equilibrium Model
- Job Crafting among Airport Security: The Role of Organizational Support, Work Engagement and Social Courage
- Does the Adjustment of Industrial Structure Restrain the Income Gap between Urban and Rural Areas
- Optimizing Emergency Logistics Centre Locations: A Multi-Objective Robust Model
- Geopolitical Risks and Stock Market Volatility in the SAARC Region
- Trade Globalization, Overseas Investment, and Tax Revenue Growth in Sub-Saharan Africa
- Can Government Expenditure Improve the Efficiency of Institutional Elderly-Care Service? – Take Wuhan as an Example
- Media Tone and Earnings Management before the Earnings Announcement: Evidence from China
- Review Articles
- Economic Growth in the Age of Ubiquitous Threats: How Global Risks are Reshaping Growth Theory
- Efficiency Measurement in Healthcare: The Foundations, Variables, and Models – A Narrative Literature Review
- Rethinking the Theoretical Foundation of Economics I: The Multilevel Paradigm
- Financial Literacy as Part of Empowerment Education for Later Life: A Spectrum of Perspectives, Challenges and Implications for Individuals, Educators and Policymakers in the Modern Digital Economy
- Special Issue: Economic Implications of Management and Entrepreneurship - Part II
- Ethnic Entrepreneurship: A Qualitative Study on Entrepreneurial Tendency of Meskhetian Turks Living in the USA in the Context of the Interactive Model
- Bridging Brand Parity with Insights Regarding Consumer Behavior
- The Effect of Green Human Resources Management Practices on Corporate Sustainability from the Perspective of Employees
- Special Issue: Shapes of Performance Evaluation in Economics and Management Decision - Part II
- High-Quality Development of Sports Competition Performance Industry in Chengdu-Chongqing Region Based on Performance Evaluation Theory
- Analysis of Multi-Factor Dynamic Coupling and Government Intervention Level for Urbanization in China: Evidence from the Yangtze River Economic Belt
- The Impact of Environmental Regulation on Technological Innovation of Enterprises: Based on Empirical Evidences of the Implementation of Pollution Charges in China
- Environmental Social Responsibility, Local Environmental Protection Strategy, and Corporate Financial Performance – Empirical Evidence from Heavy Pollution Industry
- The Relationship Between Stock Performance and Money Supply Based on VAR Model in the Context of E-commerce
- A Novel Approach for the Assessment of Logistics Performance Index of EU Countries
- The Decision Behaviour Evaluation of Interrelationships among Personality, Transformational Leadership, Leadership Self-Efficacy, and Commitment for E-Commerce Administrative Managers
- Role of Cultural Factors on Entrepreneurship Across the Diverse Economic Stages: Insights from GEM and GLOBE Data
- Performance Evaluation of Economic Relocation Effect for Environmental Non-Governmental Organizations: Evidence from China
- Functional Analysis of English Carriers and Related Resources of Cultural Communication in Internet Media
- The Influences of Multi-Level Environmental Regulations on Firm Performance in China
- Exploring the Ethnic Cultural Integration Path of Immigrant Communities Based on Ethnic Inter-Embedding
- Analysis of a New Model of Economic Growth in Renewable Energy for Green Computing
- An Empirical Examination of Aging’s Ramifications on Large-scale Agriculture: China’s Perspective
- The Impact of Firm Digital Transformation on Environmental, Social, and Governance Performance: Evidence from China
- Accounting Comparability and Labor Productivity: Evidence from China’s A-Share Listed Firms
- An Empirical Study on the Impact of Tariff Reduction on China’s Textile Industry under the Background of RCEP
- Top Executives’ Overseas Background on Corporate Green Innovation Output: The Mediating Role of Risk Preference
- Neutrosophic Inventory Management: A Cost-Effective Approach
- Mechanism Analysis and Response of Digital Financial Inclusion to Labor Economy based on ANN and Contribution Analysis
- Asset Pricing and Portfolio Investment Management Using Machine Learning: Research Trend Analysis Using Scientometrics
- User-centric Smart City Services for People with Disabilities and the Elderly: A UN SDG Framework Approach
- Research on the Problems and Institutional Optimization Strategies of Rural Collective Economic Organization Governance
- The Impact of the Global Minimum Tax Reform on China and Its Countermeasures
- Sustainable Development of Low-Carbon Supply Chain Economy based on the Internet of Things and Environmental Responsibility
- Measurement of Higher Education Competitiveness Level and Regional Disparities in China from the Perspective of Sustainable Development
- Payment Clearing and Regional Economy Development Based on Panel Data of Sichuan Province
- Coordinated Regional Economic Development: A Study of the Relationship Between Regional Policies and Business Performance
- A Novel Perspective on Prioritizing Investment Projects under Future Uncertainty: Integrating Robustness Analysis with the Net Present Value Model
- Research on Measurement of Manufacturing Industry Chain Resilience Based on Index Contribution Model Driven by Digital Economy
- Special Issue: AEEFI 2023
- Portfolio Allocation, Risk Aversion, and Digital Literacy Among the European Elderly
- Exploring the Heterogeneous Impact of Trade Agreements on Trade: Depth Matters
- Import, Productivity, and Export Performances
- Government Expenditure, Education, and Productivity in the European Union: Effects on Economic Growth
- Replication Study
- Carbon Taxes and CO2 Emissions: A Replication of Andersson (American Economic Journal: Economic Policy, 2019)