Top Executives’ Overseas Background on Corporate Green Innovation Output: The Mediating Role of Risk Preference
-
Luansong Cui
 and
Pan Hu
and
Pan Hu

Abstract
This study employs balanced panel data encompassing Shanghai and Shenzhen A-share listed companies in China spanning the period from 2014 to 2021 as a research dataset, employing a mixed OLS regression model and Bootstrap methods, to investigate the influence mechanism of the overseas background and risk preference tendencies of top executives on the corporate green innovation output. The results show that the top executives’ overseas experience has a substantial influence on corporate green innovation, while top executives’ risk preference level plays a mediating role. In addition, the educational background of top executives is identified as a moderating element in this mechanism. Thus, the conclusions of this article extend prior research by identifying a new connection between top executives’ overseas backgrounds and corporate green innovation and by offering a new perspective to advance and improve the green economy.
1 Introduction
There has been a global intensification of focus on economic and environmental sustainability in response to growing social and environmental apprehensions. China, being the largest developing nation globally, is contending with substantial environmental challenges and resource limitations. Accordingly, Chinese listed companies, particularly industrial firms, are attracting public scrutiny and are prompted to implement “green” innovations (Chen et al., 2018; Pan et al., 2023; Sun et al., 2023). The Organization for Economic Cooperation and Development (OECD) defines green innovation as the creation and implementation of products and services, marketing methods, production processes, organizational structures, and institutional arrangements that can enhance the environment (Wan et al., 2022). Previous studies discovered that corporate governance plays a crucial role as the primary input component in driving green innovation, ultimately ascertaining its level and quality (Amore & Bennedsen, 2016; Xia et al., 2022), and the top management team plays a vital role in corporate governance (Chen et al., 2015; Huang et al., 2021). Moreover, top executives who possess overseas experience are considered to be more risk-taking (Farag & Mallin, 2018; Zhang & Ye, 2021a; Zheng et al., 2023). In addition, they demonstrate an elevated level of innovation and foresight (Chen et al., 2023; Li et al., 2023; Zheng et al., 2023). Hence, the overseas background of top executives will impact their decision-making capabilities and willingness to confront risks, subsequently shaping the green innovation endeavors of firms.
In the current realm of research, numerous scholars have undertaken discussions concerning the influence of top executives’ characteristics on corporate green innovation. Nevertheless, it is essential to recognize that some limitations and deficiencies persist within these existing studies. First, only a limited number of studies examine the impact of top executives’ overseas background on corporate green innovation, but they ignore the mediating effect of the top executives’ risk preference and the moderating effect of top executives’ education level (Chen et al., 2023; Hao et al., 2019; Quan et al., 2023). Second, the existing studies merely take the linear relationship between the top executives’ risk preference and firm innovation into consideration (Farag & Mallin, 2018; Giaccone & Magnusson, 2022; Zhang & Ye, 2021a,b), while there are very few studies considering the linear and nonlinear relationship between the top executives’ risk preference and the corporate green innovation. Third, the extant studies failed to consider the correlation between green patent quality and the top executives’ overseas background.
This article makes several contributions to the current studies. First, the article uses the OLS regression model to examine the mediating effect of the top executives’ risk preference and form a complete influencing path of the top executives’ overseas background, risk preference, as well as corporate green innovation. Subsequently, the moderating effect of top executives’ educational background is assessed, thereby augmenting the entire influence mechanism. This study likewise discovered an inverse U-shaped relationship between the risk preference of top executives and corporate green innovation, which can be employed as a guide to assist corporates in controlling the risk preference tendency more appropriately. Moreover, this article has discovered a substantial correlation between the top executives’ overseas backgrounds and the number of green patent citations obtained by firms, which indicates that enhancing the presence of executives with overseas backgrounds can potentially enhance the quality of green innovation within businesses. In this way, we aim to enhance the existing research on top executive characteristics and corporate green innovation. We offer valuable recommendations for advancing China’s “innovation-driven” strategy and achieving the “dual-carbon” goal. In addition, we provide both theoretical support and practical guidance for green innovation strategies of Chinese listed firms.
The remainder of this article proceeds as follows. Section 2 reviews the theoretical background, Section 3 puts forward the hypothesis, and Section 4 describes the sample selection, defines the variables, and introduces the empirical model. Subsequently, Section 5 reports the empirical results, and Section 6 reports the discussion and implications. Finally, Section 7 presents the conclusions of this article.
2 Literature Review
2.1 Top Executives’ Overseas Background
Two streams of literature are relevant to this research. First are the studies related to the impact of top executives’ overseas background on corporate behavior. Ever since Hambrick introduced the “upper echelons perspective” theory, scholarly research into the correlation between the characteristics of top executives and business strategy, actions, and performance has gained considerable prominence. According to the “upper echelons perspective” theory, the personal characteristics of top executives, including gender, age, cognitive ability, values, and special experience, will impact their behavioral patterns and cognitive processes. This, in turn, is anticipated to shape their decision-making and implementation of business strategies, ultimately manifesting in the overall performance and outcomes of the businesses they lead. Moreover, based on the resource-based theory, an enterprise can maintain its competitive advantage because it owns scarce and unique resources (Wernerfelt, 1984). In recent years, as a growing amount of overseas expertise has returned to China and engaged firm’s top management teams, scholars have redirected their research focus toward the overseas background of top executives. Current studies have demonstrated that the overseas experience of top executives positively impacts corporate performance. This is because top executives with overseas experience have an advantage in expanding the business network of enterprises (Dai & Liu, 2009), providing professional knowledge based on overseas entrepreneurial orientation (Dai & Liu, 2009; Filatotchev et al., 2011, 2011; Liu et al., 2010), and guiding the export orientation of the firms (Filatotchev et al., 2009). In addition, top executives who have overseas experience have a substantial impact on technological advancement and significantly advance corporate innovation (Liu et al., 2021; Xiang & Yi, 2022; Yuan & Wen, 2018).
2.2 Corporate Green Innovation
The other strand of closely related literature focuses on the factors that drive corporate green innovation. Corporate green innovation is becoming more and more prominent among scholars and is crucial for fostering high-quality economic development. Green innovation puts a stronger emphasis on environmental preservation and sustainability than general technological innovation, preserving resources and minimizing pollution (Liu et al., 2021; Saunila et al., 2018). Some scholars analyze the relationship between corporate governance and firms’ green innovation and find that worse-governed firms generate fewer green patents. It has also been discovered that pressure from distinct stakeholders including consumers (Chen et al., 2012), suppliers (Zhao et al., 2021), and competitors (Wan et al., 2022) are determinant factors for firms’ green innovation decisions. Several studies investigate various executive characteristic factors influencing corporate green innovation, including CEO turnover (Zhang et al., 2022), CEO gender (He & Jiang, 2019), CEO hometown identity(Ren et al., 2021), CEOs’ early-life experience (He et al., 2024; Jin & Ye, 2024; Tang et al., 2024), executives’ overconfidence (Wang, 2021), executives’ environmental protection background (Bai & Lyu, 2023), executives’ vertical concurrent (Lv and Chen, 2023), and executives’ ESG cognition (Wang et al., 2022). There are also a few scholars who direct their attention to top executives’ overseas background and analyze the impact of managerial foreign experience on firm green innovation. However, a previous study preliminarily explored the relationship between top executives’ overseas background and corporate innovation (Chen et al., 2023; Hao et al., 2019; Zheng et al., 2023). An examination of the current studies indicates a lack of research investigating the mediating and moderating factors between top executives’ overseas experience and corporate green innovation. Consequently, further investigation is necessary to address this gap in the literature.
3 Hypothesis
In accordance with the imprinting theory, environmental imprinting will have an enduring effect on individuals during a specific sensitive period. On the condition of studying or working abroad, top executives must navigate diverse cultural backgrounds, uncertain work environments, and high-risk challenges, as well as psychological pressure. During this critical period, the exposure of top executives to a foreign environment can imbue them with a nuanced set of cognitive abilities and skills. This, in turn, enables them to make forward-thinking and bold decisions regarding long-term green innovation.
Based on the knowledge spillover effect, acquiring knowledge and experience from outside the organization is an essential method for firms to increase their innovation efficiency. Besides, the top management team with extensive overseas background possesses explicit knowledge acquired through language, books, databases, etc., as well as implicit knowledge acquired through long-term practice, which can furnish organizations with an extensive reservoir of knowledge and valuable expertise derived from a global standpoint, and produce a significant knowledge spillover effect. Consequently, top executives with overseas backgrounds can effectively enhance the green innovation efficiency of local enterprises.
The “upper echelons perspective” theory claims that the top executives of an enterprise cannot completely comprehend the environment’s complexity, and yet instead observe and make decisions selectively. Throughout this process, the manager’s values and cognitive framework dictate their mode of reasoning, observational outlook, and decision-making. Top managers’ demographic characteristics and prior experience will affect their cognitive ability, logic of thought, and value orientation, which will subsequently determine the strategic decision-making and innovation activities of businesses. As an illustration, the top management team’s international background will affect the firm’s innovation decisions and activities, with both foreign study experience and foreign work experience having significant impacts on firm innovation (Yuan & Wen, 2018). Returnee executives tend to achieve sustainable development through green innovation (Hao et al., 2019; Quan et al., 2023). Therefore, top executives’ overseas background has a significantly positive impact on corporate green innovation (Chen et al., 2023; Zheng et al., 2023). Drawing on the preceding perspectives, this article puts forward Hypothesis 1.
Hypothesis 1: The overseas background of top executives promotes corporate green innovation.
Behavioral finance theory states that managers are influenced by personal psychological factors, social environmental factors, and various uncertainties when making decisions, which leads to their behavior patterns and attitude toward risk deviating from the optimal model established by economics. In accordance with behavioral finance theory, diverse executive teams are prone to make disparate decisions when faced with analogous circumstances. The key concept of behavioral finance theory is expectancy theory, which emphasizes that the majority of managers are not entirely rational and frequently expose themselves to greater risks in pursuit of greater returns. Moreover, as the decision-maker for corporate green innovation activities, the top executives will be impacted by subjective factors including risk preference, contributing to variations in the output of enterprise innovation.
Consequently, according to behavioral finance theory, in addition to objective factors including the demographic characteristics and prior experience of the top executives, subjective factors including the risk preference of the top management team can also impact corporate innovation activities. Enterprises guided by leaders with international expertise exhibit increased investment activities, partake in more mergers and acquisitions, maintain elevated debt-to-equity ratios, and possess a greater proportion of short-term debt (Yang & Wang, 2023). Top executives with international experience have higher risk tolerance and are able to make more independent judgments and decisions (Farag & Mallin, 2018; Kreiser et al., 2010). Therefore, there is a considerable positive correlation between the top executives’ overseas background and their risk preferences. In addition, numerous scholars indicated that risk-taking has a substantial positive correlation with innovation performance (Giaccone & Magnusson, 2022; Li et al., 2021; Yan et al., 2021; Zhang & Ye, 2021a,b). Moreover, top executives’ overseas experiences shape their ability to control the risks in green innovation (Chen et al., 2023). Top executives with overseas backgrounds are more willing to take risks and are willing to carry out green innovation activities with higher uncertainty (Zheng et al., 2023). Therefore, top executives with overseas experience are more likely to have a higher risk preference in decision-making and a stronger sense of green innovation. On the basis of preceding discussion, we posit the subsequent hypotheses:
Hypothesis 2: The richer the overseas background of the top management team, the stronger the risk preference tendency.
Hypothesis 3: Risk preference has a mediating effect between the top executives’ overseas background and the corporate green innovation output.
On the condition that examining the mechanism of the effect of the overseas background of the executive team on the innovation output of businesses, previous scholars analyzed the mediating variables, including the risk preference of the executive team as well as considered additional personal attributes of the senior executives. Regarding individual CEO characteristics, some researchers stated that younger CEOs, those with shorter tenures, and those with advanced degrees are more inclined to contemplate and undertake decisions associated with higher risk (Farag & Mallin, 2018). In addition, the CEO’s education level, professional background, and political connections are positively associated with the enterprise’s innovation efforts (Lin et al., 2011). Returnee executives have a higher level of education than local executives in general, and their education exerts a noteworthy positive impact on various facets of venture performance (Li et al., 2012). Moreover, when compared with low-educated top management team, the academic experience of high-educated top management has a more positive impact (He et al., 2021). In conclusion, among the samples of top executives with distinct educational backgrounds, the overseas background of top executives has diverse influences on the average risk preference level. Accordingly, this article proposes hypothesis 4.
Hypothesis 4: The lower the average education level of the top executives, the stronger the promoting effect of top executives’ overseas background on their risk preference level.
Existing literature typically employs the number of patent citations to measure the quality of the innovation output (Bhattacharya et al., 2017; Hirshleifer et al., 2012; Rahko, 2015). Green patents with high technical levels, significant economic importance, and great importance have high citations (Wang et al., 2022; Zhang et al., 2022). Moreover, CEOs with international experience exhibit a higher propensity for green innovations and achieve a superior level of quality (Quan et al., 2023). Consequently, this article proposes hypothesis 5.
Hypothesis 5: The overseas background of top executives promotes the quality of the corporate green innovation output. The richer the overseas background of the top management team, the more green patents are cited.
Previous studies determined that corporate risk-taking plays a role in mediating the impact of corporate strategy on innovation performance (Li et al., 2021). Previous studies also discovered an inverted U-shaped relationship between top executives’ risk preferences and firm innovation (Zhang & Ye, 2021a). Moreover, on the condition that there are more risk-averse members in the top management team, the firm tends to forego input projects with extra income and shareholder benefits, and it also reduces its innovation activities, i.e., it is hesitant to allocate excessive resources to R&D and the exploration of new markets (Zhang & Ye, 2021b). Relevant literature has enriched the mechanism of the impact of enterprise risk awareness on innovation activities. Hence, enhancing the comprehensiveness and persuasiveness of the conclusion. Building upon the preceding perspectives, we put forth hypothesis 6.
Hypothesis 6: There is an inverted U-shaped relationship between the top executives’ risk preference and the corporate green innovation output. Risk-averse and risk-seeking executive teams are less conducive to corporate green innovation output level than top management teams with moderate risk preference.
4 Methodology
4.1 Data Collection
We chose all A-share listed firms in the Shanghai and Shenzhen stock exchanges from 2014 to 2021 as the initial sample. First, data for green patent applications and citations are gathered from the Chinese Research Data Service (CNRDS) platform. The original data on top executives’ characteristics and enterprise-related data were obtained from the China Stock Market Accounting Research Database (CSMAR). Furthermore, the specific data samples selection process: (i) excluded listed insurance and finance companies; (ii) excluded special treatment (ST) sample companies that had abnormal financial indicators; (iii) excluded sample companies listed less than one year; (iv) eliminated the missing samples; and (v) obtained a total of 19,976 observations, corresponding to 2,497 listed firms. The continuous variables in this article are subjected to a 1% level Winsorize. Considering the potential lag effect of green innovation, the empirical regressions in this article consider a 1-year lag.
4.2 Measurement of Variables
4.2.1 Dependent Variables
This study utilized green patents as a measure of corporate green innovation, taking into account previous research on green innovation and the availability of Chinese data (Amore & Bennedsen, 2016; Bai & Lyu, 2023; Lv & Chen, 2023; Quan et al., 2023). First, the alternative indicators for green innovation, such as research and development (R&D) expenditure, represented actual output efficiency (Wang et al., 2022). Second, this study measured green innovation by examining the number of green patent applications made by Chinese listed companies. Green patents have the potential to create positive externalities for environmental protection and emission control in the long run, which contributes to sustainable growth (Bai & Lyu, 2023). The study specifically focused on matching the patent classification numbers of green invention, design, and utility patents of listed companies, using patent data obtained from the China Research Data Platform (CNRDS). The classification numbers were based on the “Green List of International Patent Classification” issued by the World Intellectual Property Organization (WIPO) in 2010. Therefore, the dependent variable is the natural logarithm of one plus the total number of independent and joint green patent applications filed by a firm in a year of the company (Patent). In addition, we take advantage of the number of green patent citations to represent the quality of corporate green innovation output (Patentquote).
4.2.2 Independent Variables
According to the previous studies, the top executives are specifically defined as the pertinent members disclosed in the annual report of a listed company, including the general manager, deputy general manager, chief executive officer, chief financial officer, secretary of the board of directors, and other members participating in the company’s major decisions (Hao et al., 2019; Liu et al., 2021; Lee & Park, 2008; Yang & Wang, 2023). Concerning the definition of overseas background, the majority of Chinese scholars defined overseas background as having gained work experience or received education in regions and countries beyond mainland China (Li et al., 2023; Liu et al., 2021; Quan et al., 2023; Xiang & Yi, 2022; Yuan & Wen, 2018). In consideration of research needs and data availability, as well as the substantial institutional distinctions between Hong Kong, Macao, Taiwan, and mainland China, in this article, top executives with professional or educational experience in regions or countries outside mainland China are classified as possessing an overseas background. Therefore, this article constructs the ratio of top executives’ overseas background to measure the overseas experience of the top management team, specifically defined as the ratio of the number of top executives with overseas background in the total top executives (Chen et al., 2023; Li et al., 2023; Zheng et al., 2023). Moreover, the overseas background of the top management team is divided into three categories: overseas working experience (Overseas W), overseas study experience (Overseas E), and double overseas experience (Overseas B), each of these dimensions is assessed by determining the proportion of top management team members possessing the respective experience in relation to the total number of individuals (Yuan & Wen, 2018).
4.2.3 Mediating Variable
This study’s mediator variable is the top executives’ risk preference index (RPI). The risk preference of top managers is their attitude toward risk. This relatively stable subjective characteristic exerts a substantial influence on decisions related to risk management. The utility curve classifies risk preference into three distinct categories: risk neutral, risk aversion, as well as risk-seeking. This article employs the ratio of enterprise risk assets to total assets to assess the risk preference of the top management team (Zhang & Ye, 2021a,b). As shown in Appendix 1, risk assets include trading financial assets, receivables, available-for-sale financial assets, held-to-maturity investments, and investment real estate. Moreover, the greater the proportion of risk assets in a company, the higher the likelihood that the top executive team will lean toward embracing risk. In addition, the risk preference index (RPI) is subdivided for observational purposes into short-term risk preference (SRPI) and long-term risk preference (LRPI). Short-term risk preference is short-term risk assets (trading financial assets and receivables) divided by current assets. Long-term risk preference is long-term risk assets (available-for-sale financial assets, held-to-maturity investments, and investment real estate) divided by noncurrent assets.
4.2.4 Moderating Variables
The educational background of the top executives was measured by the ratio of the number of individuals with master’s degrees or above to the total number of top management team members, and the moderating impact of the top management team’s educational background on the links between overseas background and risk preference was examined.
4.2.5 Control Variables
Based on the existing most relevant studies, variables in this study were controlled from two perspectives: firm characteristics and top management team characteristics. First, we control for a vector of firm characteristics that have been shown to affect corporate green innovation activities (Chen et al., 2023; Yuan & Wen, 2018; Zheng et al., 2023), which include firm size (Size), asset-liability ratio (Lev), firm Growth (Growth), return on assets (ROA), and firm establishment years (Fage). Furthermore, we controlled for top executives’ average age and tenure because previous studies have indicated that the age and tenure of top executives may have an impact on corporate innovation activities (Hao et al., 2019; Lin et al., 2014). Appendix 1 provides definitions of all variables used in our studies and our study also controlled for year and firm-fixed effects.
4.3 Empirical Models
To test the impact of the top executives’ overseas background on the corporate green innovation output (hypothesis 1), the subsequent OLS regression model was formulated.
where i represents the listed company, t indicates the year, β i symbolizes regression coefficients, and ε signifies the error term. Besides, the dependent variable patent is our proxy for corporate green innovation, while overseas is the independent variable, which measures the percentage of top executives with overseas backgrounds in firms.
To assess the impact of the top executives’ overseas background on the top executives’ risk preference level (hypothesis 2), this article establishes an OLS regression model (2).
RPI is the mediating variable that represents the top executives’ risk preferences.
To assess whether the risk preference of top executives acts as a mediator in the relationship between their overseas experience and corporate green innovation output (hypothesis 3). Based on models (1) and (2), this article establishes the OLS regression model (3).
This study constructs an OLS regression model (4) to investigate the potential moderating effect of the educational background of top executives on the relationship between their overseas background and risk preference level (hypothesis 4). If the statistical significance of the regression coefficient for the interaction term between the overseas background and educational background of the top management team is negative, it indicates that the impact of the top executives’ overseas background on corporate green innovation output is more pronounced in teams characterized by lower educational backgrounds.
This article establishes OLS regression model (5) to test whether there is a correlation between the top executives’ overseas background and the corporate green innovation quality (hypothesis 5).
To test the nonlinear relationship between the top executives’ risk preference and the corporate green innovation output (hypothesis 6), this article establishes the OLS regression models (6a)–(6c). If β 1 > 0 and β 2 < 0 in the model (6c), it can be proved that there is an inverted U-shaped relationship between the top executives’ risk preference and the corporate green innovation output, which can serve as evidence supporting the validity of hypothesis 6.
5 Empirical Results
5.1 Descriptive Statistics
Table 1 denotes the descriptive statistical results for all continuous variables following Winsorize treatment at the 1% level. Throughout the study period, the mean number of green patent applications per year stood at 1.85, with a minimum of 0, a maximum of 5.45, and a standard deviation of the total number of patent applications at 1.2. Furthermore, the mean annual number of citations for green patents (Patentquote) is 2.39, with a minimum of 0, a maximum of 6.36, and a standard deviation of 1.62. Regarding the Overseas background of the firm’s top management team, the average number of top executives with an overseas background accounts for merely 0.8% of the firm’s top management team. Particularly, 3.8% of the average top executives have overseas working experience (Overseas W). Moreover, 0.9% of top executives have a background in overseas study (Overseas E), whereas 2.4% of top executives have a dual background in work and study (Overseas B). In some enterprises, the number of top executives with overseas backgrounds exceeds one-third, whereas a substantial number of businesses lack top executives with overseas backgrounds, and the diversity of overseas experience among top executives is unequal. In addition, the average level of risk preference (RPI) among the top management teams is 0.114, demonstrating that the company’s risk assets account for approximately 11.4% of total assets. Ultimately, the average number of executives with a master’s degree or higher was 63.6%, and this suggests that the average educational attainment of top executives is relatively elevated.
Descriptive statistics of the variables
| Variable | N | Mean | SD | Min | Max |
|---|---|---|---|---|---|
| Patent | 19841.000 | 1.852 | 1.197 | 0.000 | 5.446 |
| Patent quote | 19841.000 | 2.391 | 1.620 | 0.000 | 6.363 |
| Overseas | 19976.000 | 0.058 | 0.114 | 0.000 | 0.500 |
| Overseas W | 19976.000 | 0.038 | 0.094 | 0.000 | 0.500 |
| Overseas E | 19976.000 | 0.009 | 0.040 | 0.000 | 0.250 |
| Overseas B | 19976.000 | 0.024 | 0.061 | 0.000 | 0.333 |
| RPI | 19976.000 | 0.114 | 0.086 | 0.002 | 0.406 |
| Education | 18831.000 | 0.636 | 0.275 | 0.125 | 1.000 |
| Size | 19976.000 | 22.443 | 1.333 | 19.540 | 26.382 |
| Lev | 19925.000 | 0.452 | 0.211 | 0.062 | 0.971 |
| Growth | 16322.000 | −0.765 | 9.427 | −65.517 | 30.406 |
| ROA | 19796.000 | 0.023 | 0.239 | −1.661 | 0.347 |
| Fage | 19925.000 | 2.937 | 0.305 | 1.946 | 3.497 |
| Age | 19970.000 | 3.862 | 0.081 | 3.624 | 4.025 |
| Tenure | 16949.000 | 1.358 | 0.555 | 0.000 | 2.451 |
Note: This table reports descriptive statistics for the main variables of the article. The sample period is from 2014 to 2021, continuous variables in this paper are subjected to a 1% level Winsorize, and all variables are defined in Table 1.
To better understand the differences in corporate green innovation between top executives with overseas backgrounds and top executives without overseas backgrounds, this study presents the univariate mean analysis, which is displayed in Table 2. Table 2 reveals that top executives with overseas backgrounds have an average of 2.408 green patent applications (Patent) and an average of 3.097 green patent citations (Patentquote). The average number of green patent applications (Patent) among top executives without overseas backgrounds was 1.663, whereas the average number of green patent citations (Patentquote) was 2.151. Therefore, the presence of top executives with overseas backgrounds has a significant impact on the number of green patent applications and citations. The difference in these numbers is 0.744 and 0.946, respectively, both statistically significant at the 1% level. This suggests that the presence of top executives with overseas backgrounds is an important factor driving corporate green innovation. These findings provide preliminary support for hypotheses 1 and 5.
Univariate analysis of top executives’ overseas background
| Variable name | Top executives with overseas background | Top executives without overseas background | Differential analysis | ||||
|---|---|---|---|---|---|---|---|
| Sample size | Proportion(%) | Mean value | Sample size | Proportion(%) | Mean value | Mean variance | |
| Patent | 5,029 | 25.35 | 2.408 | 14,812 | 74. 65 | 1.663 | 0.744*** |
| Patentquote | 5,029 | 25.35 | 3.097 | 14,812 | 74. 65 | 2.151 | 0.946*** |
Note: *** indicates the significant level of 1%.
5.2 Hypothesis Test
5.2.1 Top Executives’ Overseas Background, Risk Preference, and Corporate Green Innovation
The regression results for model (1) are illustrated in column (1) of Table 3. Based on the results from the regression analysis depicted in column (1), it is observed that the regression coefficient β 1 associated with the overseas background of the top management team exhibits a statistically substantial positive relationship at the 1% significance level, which suggests that an increase in the corporate green innovation output is associated with the richness of the top executives’ overseas backgrounds. Consequently, hypothesis 1 has been confirmed. Moreover, based on the examination of firm level, it is evident that the coefficient of firm size (Size) exhibits a statistically significant positive relationship at a significance level of 1%. Larger firms possess greater capacity to engage in innovation activities, leading to elevated levels of innovation productivity. The regression coefficient for the company’s asset-liability ratio (Lev) exhibits a statistically substantial negative relationship at a significance level of 1%, which illustrates that there is a negative association between the asset-liability ratio and green innovation output, illustrating that lower levels of leverage are associated with higher levels of green innovation. Moreover, the coefficient of firm age (Fage) demonstrates a notable adverse correlation at a 5% significance level. This finding suggests that firms with a longer history of establishment are less inclined to participate in the development of green innovations.
| (1) | (2) | (3) | (4) | (5) | |
|---|---|---|---|---|---|
| Model (1) | Model (2) | Model (3) | Model (4) | Model (5) | |
| Patent | RPI | Patent | RPI | Patent quote | |
| Overseas | 1.516*** | 0.210*** | 1.466*** | 0.269*** | 1.846*** |
| (12.042) | (15.507) | (11.409) | (9.190) | (11.339) | |
| Size | 0.274*** | −0.008*** | 0.276*** | −0.009*** | 0.386*** |
| (10.318) | (−3.001) | (10.359) | (−3.058) | (10.632) | |
| Lev | −0.314*** | 0.015 | −0.318*** | 0.018* | −0.439*** |
| (−3.465) | (1.527) | (−3.504) | (1.780) | (−3.580) | |
| Growth | −0.001 | 0.000 | −0.001 | 0.000 | −0.001 |
| (−0.784) | (0.516) | (−0.795) | (0.258) | (−0.851) | |
| ROA | 0.088 | −0.010 | 0.091 | −0.010 | 0.131 |
| (1.162) | (−1.392) | (1.194) | (−1.331) | (1.267) | |
| Fage | −0.430** | 0.005 | −0.431** | 0.003 | −0.351 |
| (−2.188) | (0.289) | (−2.195) | (0.183) | (−1.330) | |
| Age | 0.259 | −0.008 | 0.261 | −0.009 | 0.294 |
| (1.579) | (−0.484) | (1.591) | (−0.534) | (1.286) | |
| Tenure | −0.006 | 0.000 | −0.006 | 0.000 | −0.010 |
| (−0.474) | (0.398) | (−0.484) | (0.422) | (−0.562) | |
| RPI | 0.238* | ||||
| (1.815) | |||||
| Education | 0.012** | ||||
| (2.412) | |||||
| OE | −0.099** | ||||
| (−2.551) | |||||
| _cons | −3.944*** | 0.299*** | −4.016*** | 0.314*** | −6.228*** |
| (−3.904) | (2.976) | (−3.975) | (3.001) | (−4.488) | |
| ID | Yes | Yes | Yes | Yes | Yes |
| Year | Yes | Yes | Yes | Yes | Yes |
| N | 13,585 | 13,641 | 13,585 | 12,899 | 13,585 |
| R 2 | 0.753 | 0.650 | 0.753 | 0.662 | 0.734 |
Note: This table reports the OLS regression result of models (1)–(5). The research models were all controlled for the variables of year and firm, and the standard errors of the regression results were modified by clustering at the level of the firm. All variables are identified in Appendix 1. *, **, and *** indicate the significant level of 10, 5, and 1%, respectively, and the standard error SE in brackets.
The regression results for model (2) are illustrated in column (2) of Table 3. Based on the regression results indicated in column (2), it is observed that the regression coefficient β 1 about the overseas background of the top management team exhibits a statistically significant positive relationship at the 1% significance level, which reveals that as the top management team possesses a more extensive overseas background, they exhibit a tendency towards a higher risk preference. Consequently, hypothesis 2 is confirmed, and the regression coefficient of the control variable, firm size (size), exhibits a statistically significant negative relationship at the 1% level. This discovery contradicts the inference made from the model (1), indicating that larger enterprises do not necessarily maintain a stable market advantage and are inclined to adopt more cautious strategies in the face of uncertain risks.
The test results for hypothesis 3 are collectively indicated in columns (1)–(3) of Table 3. Column (3) demonstrates the result of the combined influence of overseas background and risk preference (RPI) of the top executives on corporate green innovation. The regression coefficients, β 1 representing overseas background and β 2 representing risk preference, both exhibit statistically significant positive values, thus confirming hypothesis 3. Furthermore, it is observed that the regression coefficient of the top executives’ overseas background in model (3) is comparatively smaller than the corresponding coefficient in model (1) (1.466 < 1.516). This finding further affirms the notion that the risk preference of the top management team functions as a partial mediator between the top executives’ overseas background and corporate green innovation. Particularly, the overseas background of the top management team can augment the team’s inclination toward risk preference, consequently boosting the corporate green innovation output.
5.2.2 Moderating Effect: The Educational Background of the Top Executives
This research additionally substantiates the moderating influence of top executives’ overseas background, risk preference, and corporate green innovation. The empirical results derived from the examination of columns (4) in Table 3 offer support for the idea that the educational background of the top management team serves as a moderating factor on the observed outcomes. Specifically, the educational background of the top management team has a reverse moderating effect on the impact of its overseas background on risk preference.
Column (4) in Table 3 indicates the findings of hypothesis 4. It reveals that the regression coefficient of the interaction term (OE) between the overseas background and the educational background of the top executives is statistically significant and negative at a significance level of 5%. This outcome affirms that the educational background of the top management team exerts a counteractive moderating impact on the association between their overseas background and risk preference. The findings indicate that within a top management team characterized by a low average education level, the presence of top executives with an overseas background substantially affects the team’s inclination towards risk. Particularly, the experience of studying or working overseas among top executives compensates to some degree for the top management team’s lack of educational level and consequently enhances their courage to confront unfamiliar risks. As demonstrated in Figure 1, hypothesis 4 is validated.
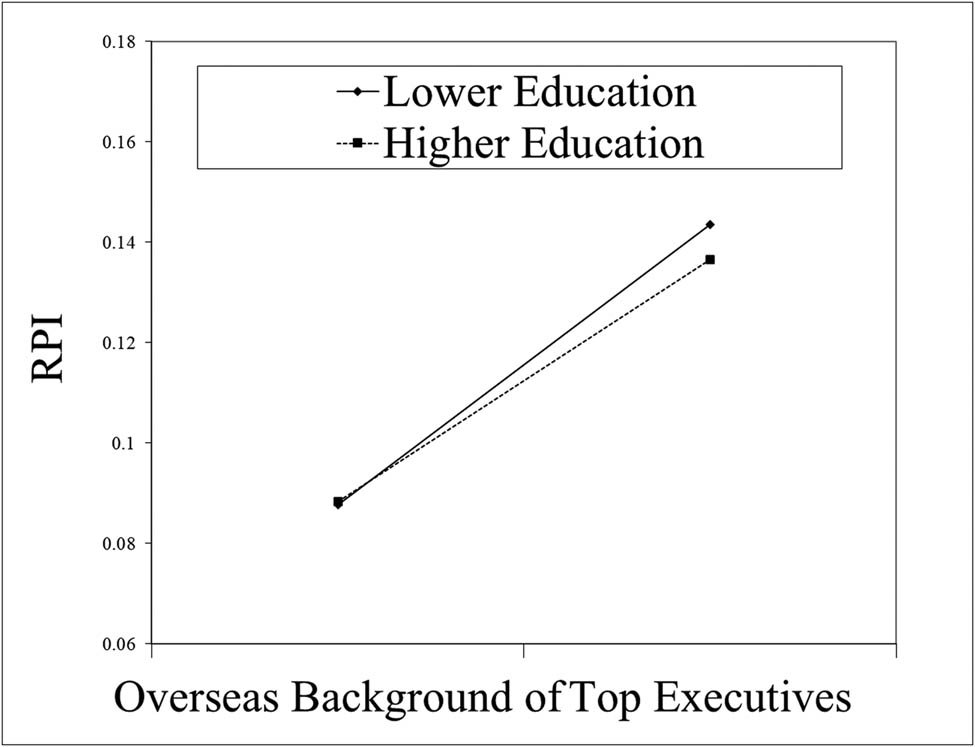
The moderating effect of top executives’ education background.
5.2.3 Top Executives’ Overseas Background and Corporate Green Innovation Quality
The findings in column (5) of Table 3 indicate the empirical results of hypothesis 5. Based on the data presented in column (5), it is noted that the regression coefficient β 1 in association with the overseas background of the top executives exhibits a statistically remarkable positive relationship at the 1% significance level, which suggests that an increase in the number of green innovation patent citations is associated with the richness of the top executives’ overseas backgrounds. Thus, hypothesis 5 is verified. Moreover, the overseas background of top executives promotes the quality of the corporate green innovation output.
5.2.4 Testing the Nonlinear Relationship Between Top Executives’ Risk Preference and Corporate Green Innovation
This study investigates the nonlinear relationship between top executives’ risk preference and the output of corporate green innovation. Columns (1)–(3) in Table 4 reveal the test results of models 6(a)–6(c). As can be observed from the regression outcomes in column (3), the primary term coefficient β 1 of top executives’ risk preference (RPI) is significantly positive at 1% level, and the secondary term coefficient β 2 of top executives’ risk preference (RPI2) is significantly negative at 1% level. Besides, the results indicate that there is an inverted U-shaped curve association between the risk preference of the top management team and the corporate green innovation output (refer to Figure 2). As a result, the findings provide support for hypothesis 6, which implies that enterprises led by risk-averse and risk-seeking top management teams exhibit lower levels of innovation output on the condition when in comparison to those led by risk-neutral top management teams.
| (1) | (2) | (3) | (4) | (5) | (6) | |
|---|---|---|---|---|---|---|
| Patent | Patent | Patent | Patent | Patent | Patent | |
| RPI | 0.676*** | 1.247*** | −2.258 | 0.457** | 0.009 | |
| (5.146) | (5.297) | (−0.324) | (2.397) | (0.015) | ||
| RPI2 | −1.829*** | |||||
| (−2.827) | ||||||
| Size | 0.302*** | 0.305*** | 0.304*** | 0.241* | 0.329*** | 0.409*** |
| (11.191) | (11.306) | (11.280) | (1.864) | (10.373) | (4.320) | |
| Lev | −0.316*** | −0.326*** | −0.322*** | −0.268 | −0.380*** | −0.051 |
| (−3.493) | (−3.595) | (−3.558) | (−0.894) | (−3.509) | (−0.132) | |
| Growth | −0.001 | −0.001 | −0.001 | 0.002 | −0.001 | 0.000 |
| (−1.162) | (−1.159) | (−1.132) | (0.701) | (−1.374) | (0.102) | |
| ROA | 0.103 | 0.109 | 0.108 | −0.620 | 0.106 | 0.126 |
| (1.331) | (1.411) | (1.402) | (−1.492) | (1.119) | (0.782) | |
| Fage | −0.404** | −0.410** | −0.408** | −1.599 | −0.562** | −0.221 |
| (−1.994) | (−2.030) | (−2.023) | (−1.264) | (−2.494) | (−0.308) | |
| Age | 0.246 | 0.254 | 0.256 | 0.050 | 0.115 | 0.495 |
| (1.480) | (1.524) | (1.544) | (0.080) | (0.609) | (0.839) | |
| Tenure | −0.006 | −0.006 | −0.006 | 0.050 | −0.013 | −0.028 |
| (−0.443) | (−0.472) | (−0.489) | (0.967) | (−0.916) | (−0.655) | |
| _cons | −4.526*** | −4.676*** | −4.691*** | 0.714 | −4.154*** | −8.164** |
| (−4.391) | (−4.541) | (−4.560) | (0.156) | (−3.524) | (−2.282) | |
| ID | Yes | Yes | Yes | Yes | Yes | Yes |
| Year | Yes | Yes | Yes | Yes | Yes | Yes |
| N | 13,585 | 13,585 | 13,585 | 979 | 10,765 | 1,130 |
| R 2 | 0.746 | 0.747 | 0.747 | 0.783 | 0.744 | 0.873 |
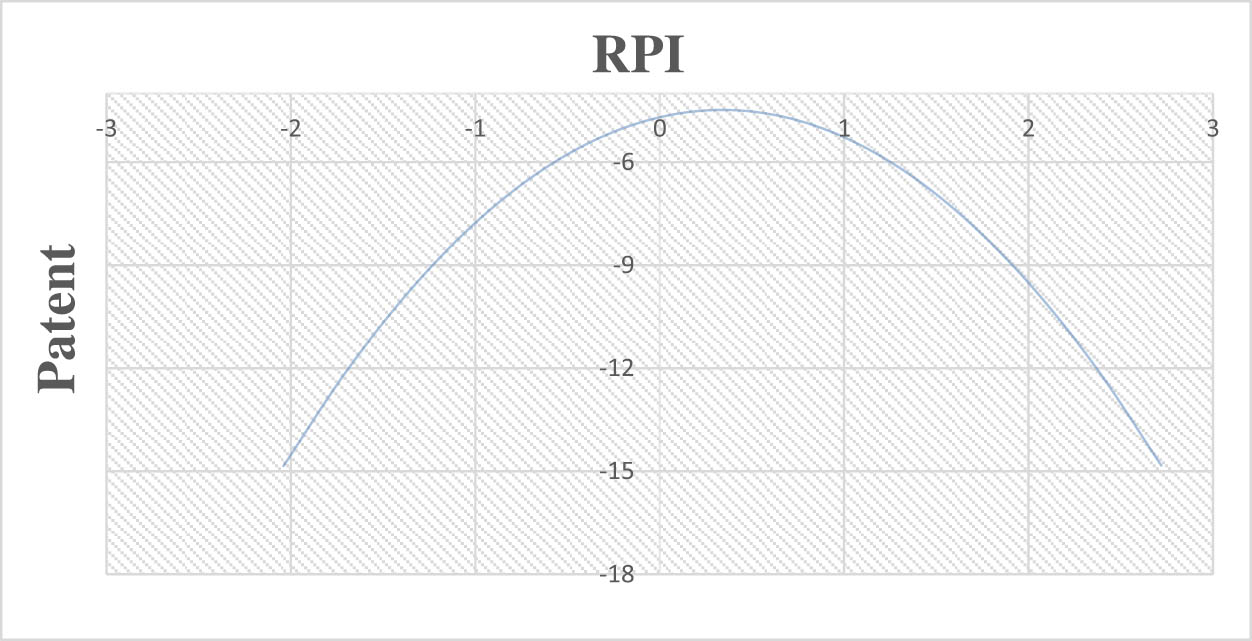
The U-shaped curve relationship between the risk preference of the top management team (RPI) and the corporate green innovation (Patent).
For the purpose of further verifying the inverted U-shaped relationship between the top management team’s risk preference and the corporate green innovation output, this study takes the 10% quantile (RPI = 0.018) and 90% quantile (RPI = 0.22) of the risk preference index of the top management team as nodes. The entire sample was categorized into three groups: a risk-averse top management team (RPI ≤ 0.018), risk-neutral top management team (0.018 < RPI < 0.22), and risk-loving top management team (RPI ≥ 0.22). Moreover, the three groups of samples were substituted into model 6(b) for linear regression analysis, and the results were indicated in columns (4)–(6) of Table 4. Furthermore, in the sample of risk-averse top management teams (RPI ≤ 0.018), the regression coefficient β 1 of top executives’ risk preference is not statistically significant; thus, it cannot be demonstrated that top executives’ risk preference affects the innovation output of the firm. In the sample of risk-neutral top management teams (0.018 < RPI < 0.22), the regression coefficient β 1 of top executives’ risk preference is significantly positive at the level of 5%, which aligns with the overall sample, revealing that the stronger the risk preference tendency of the top executives, the higher the innovation output level of the enterprise managed by the executive team. Nonetheless, in the sample of the risk-seeking top management team (RPI ≥ 0.22), the lack of statistical significance in the regression coefficient β 1 associated with the risk preference of top executives suggests that within firms led by risk-seeking top management teams, a heightened level of risk preference does not contribute significantly to the promotion of the firm’s innovation output. In addition, the research concludes that neither risk-averse nor risk-seeking executive teams are conducive to the formation of innovation output, whereas in risk-neutral executive teams (risk preference tends to constitute 10–90% of the overall level), as the risk preference tendency of top executives increases, so does the level of green innovation output. The conclusion once again confirms the verified mediation effect path, namely, that the overseas background of the top management team can enhance the firm’s green innovation output by elevating the risk preference level of the top management team.
In conclusion, extreme risk aversion or risk seeking is not conducive to the production of innovative output. Managing the risk preference level of top executives within a reasonable range, as determined by the company’s leadership, is a suitable approach to enhance innovation output.
5.3 Robust Tests
5.3.1 Mediating Effect Test: Bootstrap Method
Due to the nonlinear distribution characteristics of the top management team’s risk preference as a mediator variable, the Bootstrap method was employed in this study to mitigate the estimation bias, as well as the mediating effect of the top management team’s risk preference tendency between the top management team’s overseas background and the corporate green innovation output was examined once again. Table 5 illustrates the results of a 500-sample Bootstrap test, the coefficient of direct effect is 2, and the confidence interval at the 95% level is [1.834–2.169], excluding 0, demonstrating that the direct effect of the overseas background of the top executives on corporate green innovation is significant. Once again, hypothesis 1 has been validated. Subsequent investigations unveil that the mediator effect coefficient of the top executives’ overseas background – top executives’ risk preference – corporate green innovation mechanism is 2.31, with a 95% confidence interval of [2.15–2.47], excluding 0. This signifies that augmenting the top executives’ risk preference tendency is a crucial mechanism for elevating the corporate green innovation output level associated with the top executives’ overseas background, thus supporting hypothesis 3.
Bootstrap test results
| Observed coefficient | Bootstrap std. err. | z | P > z | Normal-based [95% conf. interval] | ||
|---|---|---|---|---|---|---|
| Direct effect | 2.0017*** | 0.0855 | 23.42 | 0.000 | 1.8342 | 2.1692 |
| Mediating effect | 2.3121*** | 0.0811 | 28.50 | 0.000 | 2.1531 | 2.4711 |
Note: This table reports the results of the mediating effect of the top management team’s risk preference (RPI) between the top management team’s overseas background (Overseas) and the corporate green innovation output (Patent). *** indicates the significant level of 1%.
5.3.2 Endogeneity Test: Propensity Score Matching (PSM) Method
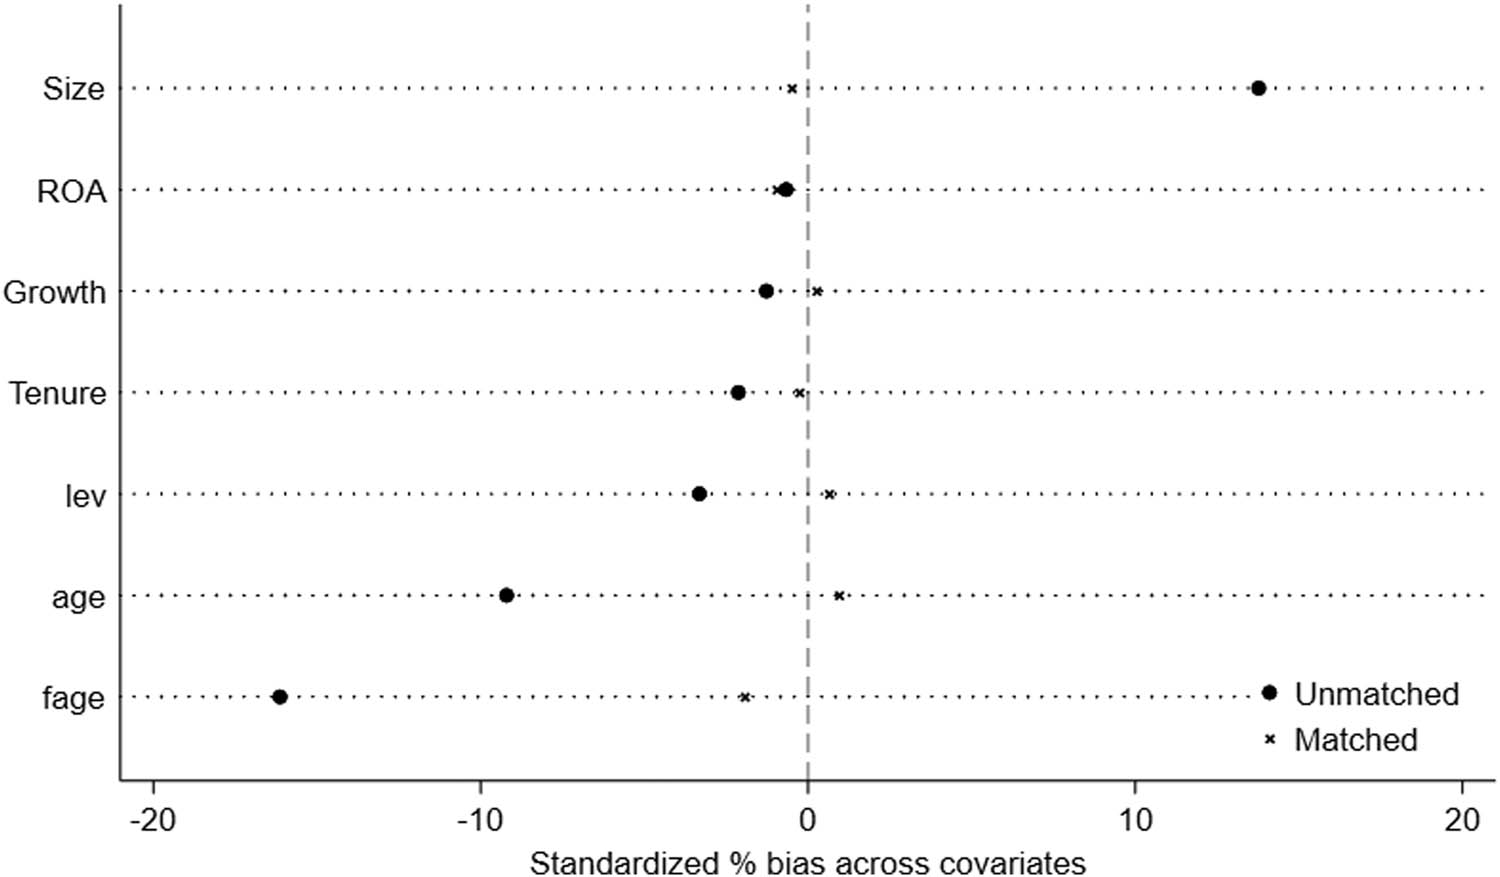
The PSM propensity score matching method was utilized in this study to test the samples to strengthen the authenticity and validity of the research conclusions and mitigate the probability of endogenous issues in the empirical study, as there might be a “screening effect” in the enterprises of the top executives with an overseas background. In this study, all samples were categorized into two groups based on the mean proportion of overseas executives in the top management team (0.058): the treated group (Overseas > 0.058) and the control group (Overseas < 0.058). Besides, the propensity score was estimated utilizing seven control variables, including firm Size (Size), asset-liability ratio (Lev), firm growth (Growth), return on assets (ROA), firm establishment years (Fage), top executives’ age (Age), and tenure (Tenure). The nearest neighbor matching method was employed, and samples with comparable propensity scores were matched in a 1:1 ratio. To ensure that all samples from the treatment group can be matched with samples from the control group, the study employs the sampling procedure with replacement, and the results of the balance test illustrate that the deviation of most of the variables is less than 5%, indicating that sample matching is effective, and 13,087 observed samples were obtained after matching. This article utilizes matched samples for regression analysis. Table 6 (1) assesses the influence of the overseas background of the top management team on the firm’s innovation output. Moreover, Table 6 (2) displays the results of an experiment examining the effect of the overseas background of the top management team on the team’s risk preference. In addition, the regression coefficient of the overseas background of top executives is substantially positive at 1% in both models, demonstrating that following eliminating the endogenous problem, the greater the overseas background of top executives, the stronger the risk preference tendency of the top management team and the greater firm’s innovation output level. Consequently, hypothesis 1, hypothesis 2, and hypothesis 3 remain valid (Figure 3).
Propensity score matching (PSM) test results
| (1) | (2) | |
|---|---|---|
| Patent | RPI | |
| Overseas | 1.359*** | 0.183*** |
| (9.903) | (13.052) | |
| Size | 0.266*** | −0.016*** |
| (8.359) | (−4.217) | |
| Lev | −0.284** | 0.029** |
| (−2.437) | (2.379) | |
| Growth | 0.001 | 0.000 |
| (0.649) | (1.489) | |
| ROA | −0.051 | −0.005 |
| (−0.554) | (−0.561) | |
| Fage | −0.120 | 0.022 |
| (−0.507) | (1.026) | |
| Age | 0.224 | −0.006 |
| (1.122) | (−0.298) | |
| Tenure | −0.007 | 0.000 |
| (−0.467) | (0.060) | |
| _cons | −4.464*** | 0.414*** |
| (−3.667) | (3.184) | |
| ID | Yes | Yes |
| Year | Yes | Yes |
| N | 13,087 | 13,143 |
| R 2 | 0.794 | 0.725 |
Note: This table reports the PSM test results, all samples were divided into two categories based on the mean proportion of overseas executives in the top management team (0.058): the treated group (Overseas > 0.058) and the control group (Overseas < 0.058). ** and *** indicate the significant level of 5 and 1% respectively.
Propensity score matching (PSM) balance test results.
5.3.3 Alternative Test: Alternative Examination Method
In this study, the mediating variable is subsequently replaced with the short-term risk preference (SRPI) of the top management team, which has a more direct impact on the firm’s latest innovation decision. Accordingly, the proportion of short-term risk assets instead of the proportion of long-term risk assets is employed to measure the top management team’s risk preference. Model (1) was repeated to model (6), and the regression results are shown in Table 7. Moreover, the regression coefficients of the main variables in models (1)–(3) are significantly positive at the 1% significance level, which verifies that the short-term risk preference of the top management team serves as a mediating factor between the overseas background of the top management team and the firm’s innovation output, hypotheses 1–3 are verified. In model (4), the interaction term coefficient between the overseas background and the educational background of the top management team is substantially negative, indicating that the educational background of the executive team regulates the relationship between the overseas background of top executives and their risk preference in the opposite direction, and hypothesis 4 has been validated. In model (5), the regression coefficients of the main variables are significantly positive at the 1% significance level, which verifies hypothesis 5. In addition, the short-term risk preference of the top management team acts as a mediator between the top executives’ overseas background and the quality of the green innovation output. The regression coefficients of the primary variables in the model (6) are all significant, which verifies that there is an inverted U-shaped relationship between the top executives’ short-term risk preference and the firm’s innovation output level, and supporting hypothesis 6.
Alternative test results
| (1) | (2) | (3) | (4) | (5) | (6) | (7) | (8) | |
|---|---|---|---|---|---|---|---|---|
| Patent | SRPI | Patent | SRPI | Patent quote | Patent | Patent | Patent | |
| Overseas | 1.516*** | 0.246*** | 1.459*** | 0.337*** | 1.767*** | |||
| (12.042) | (11.780) | (11.527) | (7.192) | (10.772) | ||||
| SRPI | 0.232*** | 0.323*** | 0.437*** | 1.388*** | ||||
| (2.826) | (2.861) | (5.297) | (9.428) | |||||
| SRPI2 | −2.437*** | |||||||
| (−7.931) | ||||||||
| Education | 0.027*** | |||||||
| (3.464) | ||||||||
| OE | −0.153** | |||||||
| (−2.544) | ||||||||
| Size | 0.274*** | −0.004 | 0.275*** | −0.006 | 0.387*** | 0.302*** | 0.302*** | 0.300*** |
| (10.318) | (−1.131) | (10.363) | (−1.552) | (10.676) | (11.191) | (11.227) | (11.292) | |
| Lev | −0.314*** | 0.021 | −0.319*** | 0.023 | −0.446*** | −0.316*** | −0.325*** | −0.323*** |
| (−3.465) | (1.458) | (−3.516) | (1.509) | (−3.632) | (−3.493) | (−3.583) | (−3.591) | |
| Growth | −0.001 | 0.000 | −0.001 | 0.000 | −0.001 | −0.001 | −0.001 | −0.001 |
| (−0.784) | (0.552) | (−0.805) | (0.484) | (−0.872) | (−1.162) | (−1.175) | (−1.191) | |
| ROA | 0.088 | −0.012 | 0.091 | −0.010 | 0.135 | 0.103 | 0.108 | 0.104 |
| (1.162) | (−1.088) | (1.197) | (−0.914) | (1.302) | (1.331) | (1.383) | (1.340) | |
| Fage | −0.430** | −0.026 | −0.424** | −0.030 | −0.342 | −0.404** | −0.395* | −0.395** |
| (−2.188) | (−0.868) | (−2.156) | (−0.953) | (−1.297) | (−1.994) | (−1.951) | (−1.973) | |
| Age | 0.259 | 0.004 | 0.259 | 0.007 | 0.293 | 0.246 | 0.246 | 0.253 |
| (1.579) | (0.156) | (1.573) | (0.288) | (1.282) | (1.480) | (1.479) | (1.531) | |
| Tenure | −0.006 | 0.001 | −0.006 | 0.001 | −0.010 | −0.006 | −0.006 | −0.005 |
| (−0.474) | (0.622) | (−0.497) | (0.339) | (−0.585) | (−0.443) | (−0.488) | (−0.371) | |
| _cons | −3.944*** | 0.324** | −4.019*** | 0.347** | −6.332*** | −4.526*** | −4.626*** | −4.669*** |
| (−3.904) | (2.151) | (−3.979) | (2.212) | (−4.562) | (−4.391) | (−4.499) | (−4.583) | |
| ID | Yes | Yes | Yes | Yes | Yes | Yes | Yes | Yes |
| Year | Yes | Yes | Yes | Yes | Yes | Yes | Yes | Yes |
| N | 13,585 | 13,641 | 13,585 | 12,899 | 13,585 | 13,585 | 13,585 | 13,585 |
| R 2 | 0.753 | 0.622 | 0.753 | 0.631 | 0.734 | 0.746 | 0.747 | 0.749 |
Note: This table reports the alternative test results, the previous mediating variable RPI is replaced with the short-term risk preference (SRPI) of the top management team, and short-term risk assets instead of the proportion of long-term risk assets is employed to measure the top management team’s risk preference. *, **, and *** indicate the significant level of 10, 5, and 1%, respectively.
5.4 Further Analysis
5.4.1 Types of Top Executives’ Overseas Background, Risk Preference, and Corporate Green Innovation
This article examines three categories of overseas experience among top executives: overseas working experience (Overseas W), overseas studying experience (Overseas E), and overseas both working and studying experience (Overseas B). To further investigate whether there are distinctions in the impact of distinct types of overseas backgrounds of top executives on the level of corporate green innovation output and risk preference of top executives, the aforementioned three types of variables are substituted as independent variables in models (1) and (2) for regression analysis, respectively. The results of the model’s regression are demonstrated in Table 8, and the results of overseas background and innovation output for three categories of top executives are displayed in columns (2)–(4), whereas the results of overseas background and risk preference for three types of top executives are displayed in columns (6)–(8). Moreover, the regression results indicate that the regression coefficients of the overseas background of the three types of top executives are all significantly positive at the 1% level, indicating that both the overseas working background of top executives and the overseas studying background of top executives exert a notable positive impact on the corporate green innovation output under their leadership and the team’s risk preference tendency. In addition, the regression coefficients for the three categories of overseas background indicators, namely, dual overseas background, overseas working background, and overseas studying the background of top executives, display a descending order in their correlation with corporate green innovation output, which indicates that the dual overseas background of top executives exerts the most substantial positive influence on the green innovation output level of firms.
Test results of distinct types of overseas background
| (1) | (2) | (3) | (4) | (5) | (6) | (7) | (8) | |
|---|---|---|---|---|---|---|---|---|
| Patent | Patent | Patent | Patent | RPI | RPI | RPI | RPI | |
| Overseas | 1.516*** | 0.210*** | ||||||
| (12.042) | (15.507) | |||||||
| Overseas W | 1.450*** | 0.181*** | ||||||
| (9.098) | (10.541) | |||||||
| Overseas E | 1.317*** | 0.171*** | ||||||
| (4.007) | (4.661) | |||||||
| Overseas B | 2.084*** | 0.262*** | ||||||
| (8.519) | (9.832) | |||||||
| Size | 0.274*** | 0.283*** | 0.296*** | 0.282*** | −0.008*** | −0.007** | −0.005* | −0.007** |
| (10.318) | (10.575) | (11.105) | (10.615) | (−3.001) | (−2.403) | (−1.830) | (−2.420) | |
| Lev | −0.314*** | −0.305*** | −0.309*** | −0.302*** | 0.015 | 0.016 | 0.016 | 0.016* |
| (−3.465) | (−3.386) | (−3.433) | (−3.350) | (1.527) | (1.614) | (1.564) | (1.656) | |
| Growth | −0.001 | −0.001 | −0.001 | −0.001 | 0.000 | 0.000 | −0.000 | 0.000 |
| (−0.784) | (−1.045) | (−1.156) | (−1.079) | (0.516) | (0.082) | (−0.080) | (0.035) | |
| ROA | 0.088 | 0.098 | 0.105 | 0.101 | −0.010 | −0.009 | −0.008 | −0.009 |
| (1.162) | (1.244) | (1.344) | (1.276) | (−1.392) | (−1.149) | (−1.044) | (−1.123) | |
| Fage | −0.430** | −0.408** | −0.420** | −0.421** | 0.005 | 0.009 | 0.007 | 0.007 |
| (−2.188) | (−2.060) | (−2.076) | (−2.112) | (0.289) | (0.443) | (0.361) | (0.368) | |
| Age | 0.259 | 0.142 | 0.220 | 0.148 | −0.008 | −0.023 | −0.013 | −0.022 |
| (1.579) | (0.859) | (1.325) | (0.895) | (−0.484) | (−1.314) | (−0.761) | (−1.285) | |
| Tenure | −0.006 | −0.005 | −0.005 | −0.006 | 0.000 | 0.000 | 0.001 | 0.000 |
| (−0.474) | (−0.429) | (−0.412) | (−0.435) | (0.398) | (0.446) | (0.456) | (0.429) | |
| _cons | −3.944*** | −3.740*** | −4.244*** | −3.709*** | 0.299*** | 0.316*** | 0.254** | 0.320*** |
| (−3.904) | (−3.666) | (−4.138) | (−3.634) | (2.976) | (3.079) | (2.480) | (3.128) | |
| ID | Yes | Yes | Yes | Yes | Yes | Yes | Yes | Yes |
| Year | Yes | Yes | Yes | Yes | Yes | Yes | Yes | Yes |
| N | 13,585 | 13,585 | 13,585 | 13,585 | 13,641 | 13,641 | 13,641 | 13,641 |
| R 2 | 0.753 | 0.750 | 0.747 | 0.750 | 0.650 | 0.638 | 0.628 | 0.636 |
Note: This table reports the result that overseas working experience (Overseas W), overseas studying experience (Overseas E), and overseas both working and studying experience (Overseas B) were substituted for Overseas experience (Overseas) as independent variables for regression analysis in models (1) and (2). *, **, and *** indicate the significant level of 10, 5, and 1%, respectively.
6 Discussion and Implications
6.1 Discussion
In this study, we mainly examine the impact of top executives’ overseas background on corporate green innovation. Using a sample of Chinese public companies from 2014 to 2021 and top executives’ characteristics data, we find that the regression coefficient associated with the top management team’s overseas background(Overseas) and firm green innovation(Patent) exhibits a statistically substantial positive relationship. This finding indicates that top executives’ overseas backgrounds could promote corporate green innovation. Furthermore, the regression coefficient associated with the top executives’ overseas background (Overseas) and risk preference (RPI) exhibits a statistically significant positive relationship, which reveals that as the top management team possesses a more extensive overseas background, they tend toward a higher risk preference. In model (3), the regression coefficients β 1 representing overseas background and β 2 representing risk preference, both exhibit statistically significant positive values (β 1 = 1.466, β 2 = 0.238). In addition, it is observed that the regression coefficient of the top executives’ overseas background in model (3) is comparatively smaller than the corresponding coefficient in model (1) (1.466 < 1.516). This finding illustrates that top executives’ risk preference mediates the relationship between the overseas background of the top management team and the firm green innovation, and we further use the bootstrap method to verify this mediating effect. As for the moderating effect, the regression coefficient of the interaction term (OE) between the overseas background and the top executives’ educational background is statistically significant and negative. This outcome affirms that the top executives’ educational background acts as a moderating factor in the mechanism: the overseas background of the top management team can effectively compensate for its educational deficiencies. The lower the average education level of the top management team, the more pronounced the promotional impact of their overseas background on their risk preference level. Except for that, the regression coefficient associated with the top executives’ overseas background (overseas) and the number of firm green innovation citations (Patentquote) exhibits a statistically significant positive relationship, which suggests that an increase in the number of green innovation patent citations is associated with the richness of the top executives’ overseas backgrounds. Therefore, the top executives’ overseas background could promote the quality of the corporate green innovation output. In model (6), the primary term coefficient β 1 of top executives’ risk preference (RPI) is significantly positive, and the secondary term coefficient β 2 of top executives’ risk preference (RPI2) is significantly negative (β 1 = 1.247, β 2 = 1.829). The result indicates that there is an inverted U-shaped curve association between the risk preference of the top management team and the corporate green innovation output. Neither the risk-averse nor the risk-seeking top management team is conducive to the firm green innovation output, it can only be augmented by elevating the risk preference tendency within an appropriate range. Finally, in further study, we also find that in comparison to only working overseas or studying overseas, the dual overseas background of top executives exerts the most significant positive impact on corporate green innovation.
6.2 Theoretical and Practical Implications
Our article contributes to the literature on the consequences of top executives’ overseas backgrounds and to the literature on the determinants of green innovation. The specific theoretical contributions are as follows: first, the current research focuses primarily on the direct effect of the top executive’s characteristics on corporate green innovation activities, and few scholars have systematically investigated its indirect influence mechanism. This article introduces the mediating variable “risk preference of the top executives” and takes into account the moderating effects of the top executives’ educational background on the pathway. The research results have a certain reference value to enrich the influence mechanism of the top executive characteristics on corporate green innovation. Besides, the second finding of this study is that there is an inverted U-shaped relationship between the risk preference tendency of top executives and the corporate green innovation output level. This research challenges the hypothesis suggesting that the two variables exhibit solely a linear relationship as proposed in previous studies, thus contributing to the enrichment of relevant literature on the influence mechanism of the top management team’s risk preference. Moreover, the practical significance and practical value of this study are as follows: in the first place, from the micro-perspective of firm management, this article identifies that the top executives’ overseas background holds significant importance in fostering the corporate green innovation output, and the research results offer an empirical foundation for improving the selection and training of high-level talents in Chinese enterprises. Second, this article identifies and analyzes the micro-factors that influence corporate green innovation, which assists firms in enhancing their green innovation level and green innovation quality through recruiting overseas high-level talent and moderately increasing their risk preference, thereby motivating firms to advance new technologies and attain sustainable, green development. This study concludes that both risk-averse and risk-seeking top management teams are not conducive to corporate green innovation and that innovation can only be stimulated by a moderate elevation in risk preference. This conclusion holds practical significance for firms to control their risk preference level, standardize their corporate governance system, enhance their supervision and restriction mechanisms, as well as foster stable and environmentally conscious economic and social growth.
6.3 Policy Recommendations
To promote corporate green innovation and the high-quality development of the economy and society, this article offers recommendations from three perspectives: government, enterprise, as well as individual. From the government’s perspective, this article proposes comprehensive training, introducing, as well as utilizing talent, continuing the preferential policy for overseas students and workers returning to China, and enhancing the implementation of the high-level returnee talent introduction plan. From the enterprise’s perspective, this article proposes that a firm’s talent evaluation index system should consider a candidate’s overseas experience when selecting high-level talent, to provide overseas-experienced candidates with more opportunities for advancement. In addition, there should be an increase in opportunities for international training and exchange programs for the top executives of qualified businesses. In the process of corporate green innovation decision-making, it is recommended that the top management team should neither excessively prefer nor avoid risk, but instead, increase the risk preference tendency within a reasonable range to aid businesses in generating higher-quality green innovation outputs. From the individual’s perspective, this study advocates for talents to fully seize the opportunities of studying and working overseas, enrich their knowledge and broaden their horizons, and actively return to China to participate in the research and development of new technologies and new products, being bold in innovation and embracing challenges. At the same time, those with advanced degrees should forge ahead, be more inclined to embrace risk, and generate higher-quality green innovation outputs.
6.4 Limitations and Future Research
As a result of limited data, this article solely examines the influence of top executives’ overseas background on corporate green innovation, without particularly identifying the place of origin of their overseas background. However, a more effective expansion of this study would involve meticulously discerning whether top executives had work or study experiences in countries that encourage environmental protection. Hence, future research could investigate whether top executives’ exposure to studying or working in countries with contrasting environmental ideologies will have varying effects on the green innovation of the firms under their management.
7 Conclusion
Past research has suggested an important link between top executives’ overseas background and corporate green innovation. However, these studies have not investigated the role of top executives’ risk preference as a mediating factor. This article utilizes the imprinting theory, upper echelons perspective theory, knowledge spillover effect, and behavioral finance theory to examine how the overseas background and risk preference tendencies of top executives impact corporate green innovation output. The study employs a mixed OLS regression model and Bootstrap methods to analyze the influence mechanism. The findings indicate that the overseas background of top executives has a significant impact on corporate green innovation, with their risk preference acting as a mediator. Furthermore, the educational background of top executives is recognized as a moderating factor in this process. Therefore, this article’s findings add to the existing literature by providing a fresh viewpoint on the green economy and a novel link between the top executives’ overseas background and corporate green innovation.
-
Funding information: We acknowledge the financial support of the Philosophy and Social Science Planning Project in Heilongjiang Province, China (Grant No. 23JYB262).
-
Author contributions: All authors have accepted responsibility for the entire content of this manuscript and consented to its submission to the journal, reviewed all the results and approved the final version of the manuscript. LC: formal analysis; JZ: methodology; LZ: investigation; PH: supervision.
-
Conflict of interest: Authors state no conflicts of interest.
-
Data availability statement: The datasets used and/or analyzed during the current study available from the corresponding author on reasonable request.
-
Article note: As part of the open assessment, reviews and the original submission are available as supplementary files on our website.
Appendix 1
Variable Definitions
| Variable | Tab | Measurement |
|---|---|---|
| Green innovation output | Patent | The natural logarithm of one plus firm’s all independent & joint green patents applications, including invention patents, design patents, and utility model patents |
| Patentquote | The natural logarithm of one plus the number of citations of all green patents | |
| Top executives’ overseas background | Overseas | Number of top executives with overseas background/total number of top executives |
| OverseasW | Overseas working background: number of top executives with overseas working background/total number of top executives | |
| OverseasE | Overseas studying background: number of top executives with overseas studying background/total number of top executives | |
| OverseasB | Dual overseas background: number of top executives with both overseas background/total number of top executives | |
| Top executives’ risk preference index | RPI | Risk asset/total asset = (Trading financial assets + receivables + available-for-sale financial assets + held-to-maturity investments + investment real estate)/Total assets. |
| SRPI | Short-term risk preference: the proportion of short-term risk assets = (trading financial assets + receivables)/current assets. | |
| LRPI | Long-term risk preference: the proportion of long-term risk assets = (available-for-sale financial assets + held-to-maturity investments + investment real estate)/non-current assets. | |
| Top executives’ education level | Education | Number of top executives with master’s degree or above/total number of top executives |
| Firm size | Size | Ln (firm’s total assets) |
| Financial leverage ratio | Lev | Total liabilities/total assets |
| Sale growth rate | Growth | The firm’s net profit growth rate |
| Return on asset | ROA | Net income/average assets |
| Firm’s age | Fage | Ln(fiscal year t minus the year the firm was established) |
| Top executives’ age | Age | Ln(Average age of the top executives) |
| Top executives’ tenure | Tenure | Ln(Average tenure of the top executives) |
| Year | Year | The sample period is from 2014 to 2021. |
| Industry | Industry | According to China Securities Regulatory Commission (CSRC) industry classification standard |
References
Amore, M. D., & Bennedsen, M. (2016). Corporate governance and green innovation. Journal of Environmental Economics and Management, 75, 54–72. doi: 10.1016/j.jeem.2015.11.003.Search in Google Scholar
Bai, X., & Lyu, C. (2023). Executive’s environmental protection background and corporate green innovation: Evidence from China. Sustainability, 15, 4154. doi: 10.3390/su15054154.Search in Google Scholar
Bhattacharya, U., Hsu, P.-H., Tian, X., & Xu, Y. (2017). What affects innovation more: Policy or policy uncertainty? Journal of Financial and Quantitative Analysis, 52, 1869–1901. doi: 10.1017/S0022109017000540.Search in Google Scholar
Chen, S., Bu, M., Wu, S., & Liang, X. (2015). How does TMT attention to innovation of Chinese firms influence firm innovation activities? A study on the moderating role of corporate governance. Journal of Business Research, 68, 1127–1135. doi: 10.1016/j.jbusres.2014.11.002.Search in Google Scholar
Chen, W., Zhu, Y., & Wang, C. (2023). Executives’ overseas background and corporate green innovation. Corporate Social Responsibility and Environmental Management, 30, 165–179. doi: 10.1002/csr.2345.Search in Google Scholar
Chen, X., Yi, N., Zhang, L., & Li, D. (2018). Does institutional pressure foster corporate green innovation? Evidence from China’s Top 100 companies. Journal of Cleaner Production, 188, 304–311. doi: 10.1016/j.jclepro.2018.03.257.Search in Google Scholar
Chen, Y., Chang, C., & Wu, F. (2012). Origins of green innovations: The differences between proactive and reactive green innovations. Management Decision, 50, 368–398. doi: 10.1108/00251741211216197.Search in Google Scholar
Dai, O., & Liu, X. (2009). Returnee entrepreneurs and firm performance in Chinese high-technology industries. International Business Review, 18, 373–386. doi: 10.1016/j.ibusrev.2009.03.004.Search in Google Scholar
Farag, H., & Mallin, C. (2018). The influence of CEO demographic characteristics on corporate risk-taking: Evidence from Chinese IPOs. The European Journal of Finance, 24, 1528–1551. doi: 10.1080/1351847X.2016.1151454.Search in Google Scholar
Filatotchev, I., Liu, X., Buck, T., & Wright, M. (2009). The export orientation and export performance of high-technology SMEs in emerging markets: The effects of knowledge transfer by returnee entrepreneurs. Journal of International Business Studies, 40, 1005–1021. doi: 10.1057/jibs.2008.105.Search in Google Scholar
Filatotchev, I., Liu, X., Lu, J., & Wright, M. (2011). Knowledge spillovers through human mobility across national borders: Evidence from Zhongguancun Science Park in China. Research Policy, 40, 453–462. doi: 10.1016/j.respol.2011.01.003.Search in Google Scholar
Giaccone, S. C., & Magnusson, M. (2022). Unveiling the role of risk‐taking in innovation: Antecedents and effects. R&D Management, 52, 93–107. doi: 10.1111/radm.12477.Search in Google Scholar
Hao, Y., Fan, C., Long, Y., & Pan, J. (2019). The role of returnee executives in improving green innovation performance of Chinese manufacturing enterprises: Implications for sustainable development strategy. Business Strategy and the Environment, 28, 804–818. doi: 10.1002/bse.2282.Search in Google Scholar
He, K., Chen, W., & Zhang, L. (2021). Senior management’s academic experience and corporate green innovation. Technological Forecasting and Social Change, 166, 120664. doi: 10.1016/j.techfore.2021.120664.Search in Google Scholar
He, N., Yang, J., & Ren, J. (2024). Pollution and green innovation: Evidence from CEOs’ early-life experience. International Review of Economics & Finance, 93, 65–79. doi: 10.1016/j.iref.2024.03.015.Search in Google Scholar
He, X., & Jiang, S. (2019). Does gender diversity matter for green innovation? Business Strategy and the Environment, 28, 1341–1356. doi: 10.1002/bse.2319.Search in Google Scholar
Hirshleifer, D., Low, A., & Teoh, S. H. (2012). Are overconfident CEOs better innovators? The Journal of Finance, 67, 1457–1498. doi: 10.1111/j.1540-6261.2012.01753.x.Search in Google Scholar
Huang, M., Li, M., & Liao, Z. (2021). Do politically connected CEOs promote Chinese listed industrial firms’ green innovation? The mediating role of external governance environments. Journal of Cleaner Production, 278, 123634. doi: 10.1016/j.jclepro.2020.123634.Search in Google Scholar
Jin, Y., & Ye, G. (2024). How does CEOs’ early-life experience of China’s great famine impact corporate green innovation? Journal of Behavioral and Experimental Finance, 42, 100932. doi: 10.1016/j.jbef.2024.100932.Search in Google Scholar
Kreiser, P. M., Marino, L. D., Dickson, P., & Weaver, K. M. (2010). Cultural influences on entrepreneurial orientation: The impact of national culture on risk taking and proactiveness in SMEs. Entrepreneurship Theory and Practice, 34, 959–984. doi: 10.1111/j.1540-6520.2010.00396.x.Search in Google Scholar
Lee, H.-U., & Park, J.-H. (2008). The influence of top management team international exposure on international alliance formation. Journal of Management Studies, 45, 961–981. doi: 10.1111/j.1467-6486.2008.00772.x.Search in Google Scholar
Li, H., Zhang, Y., Li, Y., Zhou, L. A., & Zhang, W. (2012). Returnees versus locals: Who perform better in China’s technology entrepreneurship? John Wiley Sons Ltd. doi: 10.1002/SEJ.1139.Search in Google Scholar
Li, R., Cui, Y., & Zheng, Y. (2021). The impact of corporate strategy on enterprise innovation based on the mediating effect of corporate risk-taking. Sustainability, 13, 1023. doi: 10.3390/su13031023.Search in Google Scholar
Li, W., Jiang, M., Zhang, X., Wang, Y., & Qu, X. (2023). Does foreign experience of top management affect corporate environmental responsibility? Evidence from China. Economic Modelling, 122, 106242. doi: 10.1016/j.econmod.2023.106242.Search in Google Scholar
Lin, C., Lin, P., Song, F. M., & Li, C. (2011). Managerial incentives, CEO characteristics and corporate innovation in China’s private sector. Journal of Comparative Economics, 39, 176–190. doi: 10.1016/j.jce.2009.12.001.Search in Google Scholar
Lin, D., Lu, J., Liu, X., & Choi, S. J. (2014). Returnee CEO and innovation in Chinese high-tech SMEs. International Journal of Technology Management, 65, 151–171. doi: 10.1504/IJTM.2014.060947.Search in Google Scholar
Liu, B., Ju, T., Bai, M., & Yu, C.-F. (Jeffrey). (2021). Imitative innovation and financial distress risk: The moderating role of executive foreign experience. International Review of Economics & Finance, 71, 526–548. doi: 10.1016/j.iref.2020.09.021.Search in Google Scholar
Liu, X., Lu, J., Filatotchev, I., Buck, T., & Wright, M. (2010). Returnee entrepreneurs, knowledge spillovers and innovation in high-tech firms in emerging economies. International Review of Economics & Finance, 41, 1183–1197. doi: 10.1057/jibs.2009.50.Search in Google Scholar
Liu, Y., Wang, A., & Wu, Y. (2021). Environmental regulation and green innovation: Evidence from China’s new environmental protection law. Journal of Cleaner Production, 297, 126698. doi: 10.1016/j.jclepro.2021.126698.Search in Google Scholar
Lv, Y., & Chen, X. (2023). Executive vertical concurrently to enterprise green innovation. Frontiers in Business, Economics and Management, 8, 134–138. doi: 10.54097/fbem.v8i3.7825.Search in Google Scholar
Pan, W., Cao, H., & Liu, Y. (2023). “Green” innovation, privacy regulation and environmental policy. Renewable Energy, 203, 245–254. doi: 10.1016/j.renene.2022.12.025.Search in Google Scholar
Quan, X., Ke, Y., Qian, Y., & Zhang, Y. (2023). CEO foreign experience and green innovation: Evidence from China. Journal of Business Ethics: JBE, 182, 535–557. doi: 10.1007/s10551-021-04977-z.Search in Google Scholar
Rahko, J. (2015). Internationalization of corporate R&D activities and innovation performance. Industrial and Corporate Change, 25(6), 1019–1038. doi: 10.1093/icc/dtw012.Search in Google Scholar
Ren, S., Wang, Y., Hu, Y., & Yan, J. (2021). CEO hometown identity and firm green innovation. Business Strategy and the Environment, 30, 756–774. doi: 10.1002/bse.2652.Search in Google Scholar
Saunila, M., Ukko, J., & Rantala, T. (2018). Sustainability as a driver of green innovation investment and exploitation. Journal of Cleaner Production, 179, 631–641. doi: 10.1016/j.jclepro.2017.11.211.Search in Google Scholar
Sun, Y., Zhao, L., & Lin, C. (2023). The impacts of executive equity on green corporate innovation. Sustainability, 15, 9887. doi: 10.3390/su15139887.Search in Google Scholar
Tang, L., Guo, Y., Zha, J., & Zheng, W. (2024). Acquiescence or redemption: CEO’s early-life experience of environmental pollution and corporate green innovation. Journal of Business Research, 173, 114479. doi: 10.1016/j.jbusres.2023.114479.Search in Google Scholar
Wan, X., Wang, Y., Qiu, L., Zhang, K., & Zuo, J. (2022). Executive green investment vision, stakeholders’ green innovation concerns and enterprise green innovation performance. Frontiers in Environmental Science, 10, 997865. doi: 10.3389/fenvs.2022.997865.Search in Google Scholar
Wang, D. (2021). Executive overconfidence and green innovation. E3S Web of Conferences, 275, 02053. doi: 10.1051/e3sconf/202127502053.Search in Google Scholar
Wang, D., Luo, Y., Hu, S., & Yang, Q. (2022). Executives’ ESG cognition and enterprise green innovation: Evidence based on executives’ personal microblogs. Frontiers in Psychology, 13, 1053105. doi: 10.3389/fpsyg.2022.1053105.Search in Google Scholar
Wang, H., Qi, S., Zhou, C., Zhou, J., & Huang, X. (2022). Green credit policy, government behavior and green innovation quality of enterprises. Journal of Cleaner Production, 331, 129834. doi: 10.1016/j.jclepro.2021.129834.Search in Google Scholar
Wernerfelt, B. (1984). A resource-based view of the firm. Strategic Management Journal, 5, 171–180. doi: 10.1002/smj.4250050207.Search in Google Scholar
Xia, L., Gao, S., Wei, J., & Ding, Q. (2022). Government subsidy and corporate green innovation - Does board governance play a role? Energy Policy, 161, 112720. doi: 10.1016/j.enpol.2021.112720.Search in Google Scholar
Xiang, X., & Yi, B. (2022). Directors’ foreign experience and firm innovation. Emerging Markets Finance and Trade, 58, 3248–3264. doi: 10.1080/1540496X.2022.2037417.Search in Google Scholar
Yan, X., Zhang, Y., & Pei, L.-L. (2021). The impact of risk-taking level on green technology innovation: Evidence from energy-intensive listed companies in China. Journal of Cleaner Production, 281, 124685. doi: 10.1016/j.jclepro.2020.124685.Search in Google Scholar
Yang, M., & Wang, H. (2023). The decision of investment and financial influenced by executives with overseas values: Based on individualism-overconfidence. Applied Economics, 56(40), 4808–4826. doi: 10.1080/00036846.2023.2216441.Search in Google Scholar
Yuan, R., & Wen, W. (2018). Managerial foreign experience and corporate innovation. Journal of Corporate Finance, 48, 752–770. doi: 10.1016/j.jcorpfin.2017.12.015.Search in Google Scholar
Zhang, Y., Liu, H., & Li, M. (2022). Does chief executive officer turnover affect green innovation quality and quantity? Evidence from China’s manufacturing enterprises. Environmental Science and Pollution Research, 30, 81760–81782. doi: 10.1007/s11356-022-20365-0.Search in Google Scholar
Zhang, Y., & Ye, J. (2021a). Risk preference of top management team and the failure of technological innovation in firms–based on principal component analysis and probit regression. Journal of Intelligent & Fuzzy Systems, 40, 1161–1173. doi: 10.3233/JIFS-201516.Search in Google Scholar
Zhang, Y., & Ye, J. (2021b). The impact of risk preference of top management team on re-innovation behavior after innovation failure. Journal of Intelligent & Fuzzy Systems, 40, 11051–11061. doi: 10.3233/JIFS-202186.Search in Google Scholar
Zhao, W., Feng, T., Xin, X., & Hao, G. (2021). How to respond to competitors’ green success for improving performance: The moderating role of organizational ambidexterity. Business Strategy and the Environment, 30, 489–506. doi: 10.1002/bse.2633.Search in Google Scholar
Zheng, Y., Li, J., & Zhang, X. (2023). Executives with overseas background and green innovation. Finance Research Letters, 58, 104616. doi: 10.1016/j.frl.2023.104616.Search in Google Scholar
© 2024 the author(s), published by De Gruyter
This work is licensed under the Creative Commons Attribution 4.0 International License.
Articles in the same Issue
- Regular Articles
- Political Turnover and Public Health Provision in Brazilian Municipalities
- Examining the Effects of Trade Liberalisation Using a Gravity Model Approach
- Operating Efficiency in the Capital-Intensive Semiconductor Industry: A Nonparametric Frontier Approach
- Does Health Insurance Boost Subjective Well-being? Examining the Link in China through a National Survey
- An Intelligent Approach for Predicting Stock Market Movements in Emerging Markets Using Optimized Technical Indicators and Neural Networks
- Analysis of the Effect of Digital Financial Inclusion in Promoting Inclusive Growth: Mechanism and Statistical Verification
- Effective Tax Rates and Firm Size under Turnover Tax: Evidence from a Natural Experiment on SMEs
- Re-investigating the Impact of Economic Growth, Energy Consumption, Financial Development, Institutional Quality, and Globalization on Environmental Degradation in OECD Countries
- A Compliance Return Method to Evaluate Different Approaches to Implementing Regulations: The Example of Food Hygiene Standards
- Panel Technical Efficiency of Korean Companies in the Energy Sector based on Digital Capabilities
- Time-varying Investment Dynamics in the USA
- Preferences, Institutions, and Policy Makers: The Case of the New Institutionalization of Science, Technology, and Innovation Governance in Colombia
- The Impact of Geographic Factors on Credit Risk: A Study of Chinese Commercial Banks
- The Heterogeneous Effect and Transmission Paths of Air Pollution on Housing Prices: Evidence from 30 Large- and Medium-Sized Cities in China
- Analysis of Demographic Variables Affecting Digital Citizenship in Turkey
- Green Finance, Environmental Regulations, and Green Technologies in China: Implications for Achieving Green Economic Recovery
- Coupled and Coordinated Development of Economic Growth and Green Sustainability in a Manufacturing Enterprise under the Context of Dual Carbon Goals: Carbon Peaking and Carbon Neutrality
- Revealing the New Nexus in Urban Unemployment Dynamics: The Relationship between Institutional Variables and Long-Term Unemployment in Colombia
- The Roles of the Terms of Trade and the Real Exchange Rate in the Current Account Balance
- Cleaner Production: Analysis of the Role and Path of Green Finance in Controlling Agricultural Nonpoint Source Pollution
- The Research on the Impact of Regional Trade Network Relationships on Value Chain Resilience in China’s Service Industry
- Social Support and Suicidal Ideation among Children of Cross-Border Married Couples
- Asymmetrical Monetary Relations and Involuntary Unemployment in a General Equilibrium Model
- Job Crafting among Airport Security: The Role of Organizational Support, Work Engagement and Social Courage
- Does the Adjustment of Industrial Structure Restrain the Income Gap between Urban and Rural Areas
- Optimizing Emergency Logistics Centre Locations: A Multi-Objective Robust Model
- Geopolitical Risks and Stock Market Volatility in the SAARC Region
- Trade Globalization, Overseas Investment, and Tax Revenue Growth in Sub-Saharan Africa
- Can Government Expenditure Improve the Efficiency of Institutional Elderly-Care Service? – Take Wuhan as an Example
- Media Tone and Earnings Management before the Earnings Announcement: Evidence from China
- Review Articles
- Economic Growth in the Age of Ubiquitous Threats: How Global Risks are Reshaping Growth Theory
- Efficiency Measurement in Healthcare: The Foundations, Variables, and Models – A Narrative Literature Review
- Rethinking the Theoretical Foundation of Economics I: The Multilevel Paradigm
- Financial Literacy as Part of Empowerment Education for Later Life: A Spectrum of Perspectives, Challenges and Implications for Individuals, Educators and Policymakers in the Modern Digital Economy
- Special Issue: Economic Implications of Management and Entrepreneurship - Part II
- Ethnic Entrepreneurship: A Qualitative Study on Entrepreneurial Tendency of Meskhetian Turks Living in the USA in the Context of the Interactive Model
- Bridging Brand Parity with Insights Regarding Consumer Behavior
- The Effect of Green Human Resources Management Practices on Corporate Sustainability from the Perspective of Employees
- Special Issue: Shapes of Performance Evaluation in Economics and Management Decision - Part II
- High-Quality Development of Sports Competition Performance Industry in Chengdu-Chongqing Region Based on Performance Evaluation Theory
- Analysis of Multi-Factor Dynamic Coupling and Government Intervention Level for Urbanization in China: Evidence from the Yangtze River Economic Belt
- The Impact of Environmental Regulation on Technological Innovation of Enterprises: Based on Empirical Evidences of the Implementation of Pollution Charges in China
- Environmental Social Responsibility, Local Environmental Protection Strategy, and Corporate Financial Performance – Empirical Evidence from Heavy Pollution Industry
- The Relationship Between Stock Performance and Money Supply Based on VAR Model in the Context of E-commerce
- A Novel Approach for the Assessment of Logistics Performance Index of EU Countries
- The Decision Behaviour Evaluation of Interrelationships among Personality, Transformational Leadership, Leadership Self-Efficacy, and Commitment for E-Commerce Administrative Managers
- Role of Cultural Factors on Entrepreneurship Across the Diverse Economic Stages: Insights from GEM and GLOBE Data
- Performance Evaluation of Economic Relocation Effect for Environmental Non-Governmental Organizations: Evidence from China
- Functional Analysis of English Carriers and Related Resources of Cultural Communication in Internet Media
- The Influences of Multi-Level Environmental Regulations on Firm Performance in China
- Exploring the Ethnic Cultural Integration Path of Immigrant Communities Based on Ethnic Inter-Embedding
- Analysis of a New Model of Economic Growth in Renewable Energy for Green Computing
- An Empirical Examination of Aging’s Ramifications on Large-scale Agriculture: China’s Perspective
- The Impact of Firm Digital Transformation on Environmental, Social, and Governance Performance: Evidence from China
- Accounting Comparability and Labor Productivity: Evidence from China’s A-Share Listed Firms
- An Empirical Study on the Impact of Tariff Reduction on China’s Textile Industry under the Background of RCEP
- Top Executives’ Overseas Background on Corporate Green Innovation Output: The Mediating Role of Risk Preference
- Neutrosophic Inventory Management: A Cost-Effective Approach
- Mechanism Analysis and Response of Digital Financial Inclusion to Labor Economy based on ANN and Contribution Analysis
- Asset Pricing and Portfolio Investment Management Using Machine Learning: Research Trend Analysis Using Scientometrics
- User-centric Smart City Services for People with Disabilities and the Elderly: A UN SDG Framework Approach
- Research on the Problems and Institutional Optimization Strategies of Rural Collective Economic Organization Governance
- The Impact of the Global Minimum Tax Reform on China and Its Countermeasures
- Sustainable Development of Low-Carbon Supply Chain Economy based on the Internet of Things and Environmental Responsibility
- Measurement of Higher Education Competitiveness Level and Regional Disparities in China from the Perspective of Sustainable Development
- Payment Clearing and Regional Economy Development Based on Panel Data of Sichuan Province
- Coordinated Regional Economic Development: A Study of the Relationship Between Regional Policies and Business Performance
- A Novel Perspective on Prioritizing Investment Projects under Future Uncertainty: Integrating Robustness Analysis with the Net Present Value Model
- Research on Measurement of Manufacturing Industry Chain Resilience Based on Index Contribution Model Driven by Digital Economy
- Special Issue: AEEFI 2023
- Portfolio Allocation, Risk Aversion, and Digital Literacy Among the European Elderly
- Exploring the Heterogeneous Impact of Trade Agreements on Trade: Depth Matters
- Import, Productivity, and Export Performances
- Government Expenditure, Education, and Productivity in the European Union: Effects on Economic Growth
- Replication Study
- Carbon Taxes and CO2 Emissions: A Replication of Andersson (American Economic Journal: Economic Policy, 2019)