Role of Cultural Factors on Entrepreneurship Across the Diverse Economic Stages: Insights from GEM and GLOBE Data
-
Yue-e Chen
 and
Bilal Iftikhar Makki
and
Bilal Iftikhar Makki

Abstract
This article conducts an exploration of culture’s roles on entrepreneurial activities among countries at different economic stages. Culture factors from the GLOBE are converted into motivation culture and hygiene culture. The framework of this research is derived from Herzberg’s motivation hygiene theory. Total entrepreneurial activity (TEA) and the ratio of opportunity-driven to necessity-driven entrepreneurship (OPP/NEC) from global entrepreneurship monitor (GEM) are taken as measures for both the quantity and quality of entrepreneurial behavior. Panel regression with fixed effects is employed to test both direct and interaction effects. The direct relations show that the improvement of economic conditions discourages the TEA, while promotes the OPP/NEC; motivation culture significantly promotes OPP/NEC, while makes no difference in TEA; and hygiene culture significantly promotes TEA, while reduces OPP/NEC. In terms of interactive effects, motivation culture reduces the containment of economic development on TEA, yet hygiene culture hurts its promotion on OPP/NEC; motivation culture mitigates hygiene culture’s stimulation of TEA, while hygiene culture damages motivation culture’s fostering of OPP/NEC. Finally, a global culture map of quadrant distribution diagram is visually drawn with the corresponding culture scores. Notably, countries or regions in quadrant IV with high motivation culture and low hygiene culture demonstrate the most favorable entrepreneurial quality as well as high economic development.
1 Introduction
In the post-COVID-19 era, the global economic landscape has been marked by severe and conspicuous downturns in many countries, which prompts both researchers and policymakers to engage in thinking: What means can generate more employment opportunities and catalyze sustained economic growth? Doubtlessly, their attention has converged upon entrepreneurship. Entrepreneurship, as a fundamental contributor to economic growth, bolsters employment, innovation and yields positive welfare effects (Acs et al., 2012; Ratten, 2021; Stoica et al., 2020; Wennekers & Thurik, 1999; Wennekers et al., 2005; Yarovaya et al., 2022). In general, these business activities are categorized into two distinct types: opportunity driven and necessity driven, as per the motivations of entrepreneurship outlined in the global entrepreneurship monitor (GEM). Entrepreneurial activities, led by innovative entrepreneurs, play a self-evident role in enhancing competition and, subsequently, economic growth (Ben Youssef et al., 2021; Popescu & Crenicean, 2012; Wang et al., 2023; Wennekers & Thurik, 1999).
According to the OECD, entrepreneurship is shaped by a combination of framework conditions, government programs, and cultural attitudes. Culture assumes a pivotal role in shaping the contours of entrepreneurial activity within a society. In this regard, researchers have contended that the social and cultural milieu exerts influence on the entrepreneurial behavior of individuals, especially in the context of initiating new businesses. Consequently, some cultures are more conducive to promoting entrepreneurship (Gurel et al., 2010; Mueller & Thomas, 2001; Reynolds et al., 2002). However, without taking the economic conditions into consideration, viewing culture as a psychological or institutional factor for entrepreneurship is too simple. Moreover, culture is a multifaceted concept encompassing various dimensions and measurements. Therefore, its impact on entrepreneurial activities can be intricate and subject to controversy (Sarooghi et al., 2015; Zhao et al., 2012).
This research tries to contribute to the existing literature in several ways. Theoretically, Herzberg’s motivation hygiene theory (MHT) is employed to justify the roles of culture and economy on entrepreneurship. Based on MHT, cultural factors are converted into motivation culture and hygiene culture. Empirically, both interactive and direct relations between cultures, economy, and entrepreneurship are investigated. Statistically, panel regression with fixed effects is employed. Practically, some policy implications are provided to help policymakers with entrepreneurial policies in line with culture and economy.
The subsequent sections of this article are organized as follows: Section 2 reviews existing research on the relations between culture, economy, and entrepreneurship. Section 3 presents hypotheses within the MHT framework. Section 4 covers data sources, variable definitions, and empirical analysis methods. Section 5 presents the results. Sections 6 and 7 present the conclusion, policy implications, and study limitations.
2 Literature Review
2.1 Empirical Literature on Culture and Entrepreneurship
For the study of culture, the initial classification distinguishes between individualist and collectivist cultures (Hofstede, 1980, 1994, 2011; Schwartz, 1999). Hofstede (1980) defines culture as “the collective programming of the mind distinguishing members of a group or category of people from others” (Hofstede, 1980). In this context, culture’s outer layers typically encompass rituals, heroes, and symbols, while its core lies in its values (Hofstede & McCrae, 2004). The literature on culture’s influence on entrepreneurship can be broadly categorized into two streams: psychological and institutional (Davidsson, 1995).
In the psychological perspective, social and cultural contexts significantly shape individual psychology and behavior. Culture acts as a potent guide within specific cultural settings (Afsar et al., 2021; Hofstede, 1980), influencing the values and behaviors of individuals in one country. Entrepreneurship-friendly cultures encourage greater exploration of entrepreneurial potentials and promote increased entrepreneurial activities (Ben Youssef et al., 2021; McGrath et al., 1992; Mueller & Thomas, 2001).
In the institutional perspective, culture is considered an informal institution in line with the institutional economic theory proposed by North (2005). This framework provides a valid basis for studying the environmental factors influencing new business creation (Díaz-Casero et al., 2012). A supportive culture contributes to social legitimation, increasing the value and recognition of entrepreneurial careers, thus fostering a favorable institutional environment. Moreover, various institutional conditions, such as a competitive market, private property protection, and an effective educational system, facilitate entrepreneurial activities.
2.2 Empirical Literature on Economy and Entrepreneurship
Entrepreneurship is the driving force of the economy, characterized by the pursuit of profits through problem solving in uncertain situations. It also fuels innovation by introducing new products and processes (Acs & Audretsch, 1990, 2003). Entrepreneurship’s contribution to economic growth lies in its job creation, competitive stimulation, knowledge dissemination, and diversification of businesses (Angulo-Guerrero et al., 2017; Wennekers & Thurik, 1999).
It is widely recognized that macroeconomic variables are interconnected, indicating complex relationships and interdependencies among them. Thereafter, the relation between the economy and entrepreneurship is not simply linear. In the early or middle stages of economic development, entrepreneurial activity may be negatively correlated with economic improvement, as individuals transition from self-employment to wage employment (Nikolaev et al., 2018; Pinillos & Reyes, 2011). Conversely, increased income can foster more startup activities (Acs, 2006). This often leads to a U-shaped relationship between economic activity and entrepreneurship in the global economy (Carree et al., 2002, 2007; Sternberg & Wennekers, 2005).
However, it is apparent that countries with similar economic development exhibit substantial variations in their entrepreneurial activity dynamics and patterns (Pinillos & Reyes, 2011; van Stel et al., 2005). The impact of different types of entrepreneurship on economic growth is also hugely different (Angulo-Guerrero et al., 2017; Wennekers & Thurik, 1999), all of which complicate their relationship.
2.3 Entrepreneurial Activities: Opportunity vs Necessity
Regarding entrepreneurial motivation, the GEM distinguishes between two types of entrepreneurship: opportunity-driven entrepreneurial activity and necessity-driven entrepreneurial activity (Reynolds et al., 2002). Opportunity entrepreneurs initiate businesses to pursue market opportunities or just self-actualization, while necessity entrepreneurs are compelled to start businesses due to factors such as unemployment or dissatisfaction with their prior employment.
Opportunity entrepreneurs are typically more proactive and motivated to start businesses in their areas of expertise, while necessity entrepreneurs often start businesses out of necessity rather than choice. This distinction is significant because entrepreneurs driven by opportunity tend to make more substantial economic contributions, including longer business survival, greater growth, and stronger aspirations. The ratio of opportunity-driven to necessity-driven entrepreneurship (OPP/NEC) is an ideal indicator of entrepreneurship quality and contribution (Acs, 2006; Angulo-Guerrero et al., 2017; Nikolaev et al., 2018). In this study, we aim to shed light on these differences by the number of entrepreneurship (total entrepreneurial activity (TEA)) and the composition of entrepreneurial activities (OPP/NEC).
In essence, explaining these different entrepreneurial motivations goes beyond economic factors alone (Frederking, 2004). Previous research has linked variations in entrepreneurial activity to economic stages and cultural values but often overlooked the interaction between them (Morales et al., 2019). To better understand the motivation of entrepreneurship, cultures, economy, and in particular their interaction effects are investigated in the current study.
3 Theoretical Background and Hypotheses Development
3.1 Theoretical Background
In this study, we adopt a psychological perspective to conceptualize culture as a collection of behaviors and customs embraced collectively by specific groups, setting them apart from other populations. These cultural practices play a significant role in shaping individuals’ behaviors, particularly in the context of entrepreneurship, through their psychological and motivational effects. In line with this perspective, we employ the MHT, also known as Herzberg’s two-factor theory (Herzberg, 1966), to investigate the influence of cultural factors on the entrepreneurial activities across different economic stages. The MHT posits that job satisfaction is influenced by two distinct categories of factors: motivation factors and hygiene factors.
Motivation factors are linked to an individual’s desire for self-growth and self-actualization, leading to job satisfaction, while hygiene factors are primarily concerned with the need to avoid unpleasantness (Herzberg, 1976, 2017; Hur, 2018). At the core of the MHT lies the distinction between these two types of factors: motivation and hygiene. Herzberg characterized motivation factors as intrinsic to the job itself, while hygiene factors are extrinsic to the job environment (Alshmemri et al., 2017). Accordingly, motivation factors solely serve to enhance job satisfaction. When fulfilled, they inspire satisfaction, while their absence does not lead to dissatisfaction. Conversely, hygiene factors exclusively work to diminish job dissatisfaction. When met, they prevent dissatisfaction, but their presence does not bring forward satisfaction (Alshmemri et al., 2017; Kotni & Karumuri, 2018). Importantly, these two factors run parallel to each other rather than representing opposite ends of a single dimension.
3.2 Hypotheses Development
The literature on the culture, economy, and entrepreneurship (Cressy, 2000; Kan & Tsai, 2006; Pinillos & Reyes, 2011; Zhao et al., 2012) reveals that cultural factors affect entrepreneurial motivations differently.
Aligned with the MHT, the motivation culture emphasizes intrinsic factors, making entrepreneurship a means for seizing opportunities. Individuals are motivated to explore more entrepreneurial opportunities, prioritize self-actualization over short-term profit, and place a greater emphasis on future interests. Moreover, people tend to manage their time conscientiously, striving for greater task efficiency while prioritizing the future (Bortolotti et al., 2015). While this intrinsic motivation may not necessarily result in a higher quantity of nascent entrepreneurship, it is expected to stimulate opportunity-driven entrepreneurship. This, in turn, should lead to greater entrepreneurship satisfaction and enhance the quality of entrepreneurial endeavors. Accordingly, we formulate the following hypothesis:
Hypothesis 1a
Countries featured with high motivation culture exhibit low TEA and high ratio of OPP/NEC.
For countries characterized by high hygiene culture, these values such as obedience to authority, power structures, gender inequality, loyalty to collective interests, and the importance of traditional family and parent–child bonds are prioritized and interpersonal relationships take precedence (Zhao et al., 2012). On the one hand, individuals are more attuned to external conditions and social networks. Their interpersonal relationships are often built within stable, established social structures and networks. When necessarily starting new businesses, they can draw significant social and emotional support from extended family structures. On the other hand, for the avoidance of dissatisfaction, people tend to conform to established norms and seek stability in both their work and personal lives, and are reluctant to change the status quo or seize the new-found opportunities. These hygiene factors are expected to promote the number, while worsen the quality of entrepreneurial activities. Accordingly, we formulate the following hypothesis:
Hypothesis 1b
Countries with high hygiene culture are high in TEA and low in OPP/NEC.
In less-developed economies, entrepreneurs often start businesses out of necessity, driven by factors such as the need for income generation and employment opportunities (Fernández-Serrano et al., 2018; Naude et al., 2008; Nikolaev et al., 2018; Wennekers et al., 2005). These individuals may face limited job prospects in the formal sector, leading them to create their own businesses for survival. With higher economic stages, there tends to be a shift in entrepreneurial motivations. Necessity-driven entrepreneurship may decline as formal employment opportunities increase. In more developed economies, entrepreneurs may be more driven by improvement-related motives, such as a desire for innovation, growth, and market success. These individuals may have more opportunities to pursue entrepreneurial ventures as a choice rather than a necessity. Therefore, we formulate the following hypotheses:
Hypothesis 2a
Economic development negatively affects TEA. Lower economic stages lead to a greater need for self-employment due to survival and employment challenges, resulting in increased TEA.
Hypothesis 2b
Economic development positively promotes OPP/NEC. Improved economic conditions provide potential entrepreneurs with more opportunities and greater resources to promote quality entrepreneurial activities, leading to the increased OPP/NEC ratio.
Given that both culture and economy significantly influence entrepreneurial activities, the interdependence between them has been documented (Fernández-Serrano et al., 2018; Mueller et al., 2002). Therefore, the current study tests the interaction effects of cultures and economy on entrepreneurial activities.
In the circumstance of motivation culture with the developed economy, the desires for high performance, future orientation, and market success correspond to factors like the nature of the work, achievement, recognition, and responsibility. Entrepreneurs in these settings are likely to be motivated by the intrinsic rewards associated with the work itself and self-improvement or self-actualization in more developed economies. On the other hand, as economies develop, basic survival factors like stable employment and adequate income become less of a concern. Dissatisfaction of entrepreneurship derived from power distance and collectivism in hygiene cultures makes people more cautious and less risk-taking, which hinders the pursuit of starting business. Accordingly, entrepreneurship is a choice rather than a necessity. On this basis, we formulate the following hypothesis:
Hypothesis 3a
The containment of economy development on the number of entrepreneurship (TEA) can be mitigated by motivation culture, while its promotion on the quality of entrepreneurship (OPP/NEC) can be improved.
Hypothesis 3b
The containment of economy development on the number of entrepreneurship (TEA) can be worsened by hygiene culture, while its promotion on the quality of entrepreneurship (OPP/NEC) can be reduced.
Both motivation culture and hygiene culture concurrently influence the performance of entrepreneurial activities, operating within specific social contexts. Furthermore, there may exist an interaction effect between them on entrepreneurial activities. This interaction can either foster or hinder economic development.
Hypothesis 4
Interaction effects between motivation culture and hygiene culture significantly impact entrepreneurial activities.
To expound the causal relationship between economic development and entrepreneurship, we employ panel data analysis incorporating gross domestic product (GDP) data with a one-period lag. This method allows us to explore the temporal dynamics and discern the influence of prior economic conditions on the subsequent entrepreneurial landscape, enhancing the understanding of the interplay between economic development and entrepreneurial activities over time.
Hypothesis 5
Economic development with one-period lag consistently demonstrates its containing effect on TEA and promoting effect on OPP/NEC.
Specific combinations of cultural factors can resonate with one another, exerting a pronounced impact on entrepreneurial activities, while other combinations may dampen each other’s influence, limiting their mutual effects. The intricate relationship between specific combinations of cultural factors and their impact on entrepreneurship, subsequently affecting economic development and leading to distinguishable economic outcomes among countries. On the basis of this assessment, we formulate the following hypothesis:
Hypothesis 6
Four different combinations between motivation culture and hygiene culture have different entrepreneurial activities, consequently shaping their national economic development.
4 Data and Methodology
4.1 Measurements of Cultural Factors
Within the framework of MHT, motivational factors encompass achievement, recognition, the nature of the work itself, responsibility, opportunities for advancement, and the potential for personal growth. In contrast, hygiene factors encompass aspects related to company policies and administration, relationships with supervisors, interpersonal relations among colleagues, working conditions, and salary (Castillo-Palacio et al., 2017; Herzberg, 2017).
In this study, we use data from the GLOBE project, which identifies nine cultural dimensions across 62 countries. GLOBE was designed to understand the relationship between national culture and leadership attributes and offers a substantial sample size. To ensure data consistency and balance with GEM entrepreneurship data, culture data from 54 countries are adopted.
Statistically, factor analysis is a commonly employed technique to eliminate redundant variables from survey data and reduce the number of variables into a smaller set of dimensions, especially when certain variables cannot be directly measured. Before conducting factor analysis, the Kaiser–Meyer–Olkin (KMO) test and Bartlett’s sphericity test are performed. The results indicate a KMO value of 0.678, which is larger than the acceptable threshold of 0.5, and the P-value is significantly smaller than 0.05. These results demonstrate that the data are structurally suitable for factor analysis (Table 1). Initially, the analysis involves combining the nine cultural practice variables from GLOBE and applying the principal component extraction method with varimax rotation. This process results in the extraction of three factors.
KMO and Bartlett’s test
| Kaiser–Meyer–Olkin measure of sampling adequacy | 0.678 | |
| Bartlett’s test of sphericity | Approx. Chi-square | 235.076 |
| Degree of freedom | 36 | |
| Significance | 0.000 | |
The dimension of institutional collectivism exhibits nearly equal loadings on two factors (Factor 1: 0.546; Factor 3: 0.588). This finding is consistent with much of the previous literature, which has also shown that its relationship with entrepreneurial performance is not significant (Hayton et al., 2002). As a result, it was excluded from further analyses. By using the remaining eight components, we extracted three factors with eigenvalues greater than one, collectively explaining 79.5% of the total variance (Table 2). We employed orthogonal rotation (Varimax) with Kaiser normalization, and the factor loadings are presented in Table 3. The rotation process successfully converged in five iterations, with the original order of responses rearranged to reflect the factor structure.
Total variance explained
| Component | Initial eigenvalues | Rotation sums of squared loadings | ||||
|---|---|---|---|---|---|---|
| Total | Variance | Cumulative (%) | Total | Variance | Cumulative (%) | |
| Future orientation | 3.105 | 38.813 | 38.813 | 2.705 | 33.818 | 33.818 |
| Performance orientation | 1.817 | 22.713 | 61.526 | 2.125 | 26.564 | 60.382 |
| Uncertainty avoidance | 1.438 | 17.976 | 79.502 | 1.530 | 19.119 | 79.502 |
| In-group collectivism | 0.499 | 6.240 | 85.742 | |||
| Gender egalitarianism | 0.472 | 5.894 | 91.636 | |||
| Power distance | 0.350 | 4.380 | 96.016 | |||
| Human orientation | 0.177 | 2.217 | 98.234 | |||
| Assertiveness | 0.141 | 1.766 | 100.000 | |||
Rotated component matrix
| Dimension | Components | ||
|---|---|---|---|
| Motivation | Hygiene | Humanity | |
| Future orientation | 0.894 | ||
| Performance orientation | 0.853 | ||
| Uncertainty avoidance | 0.822 | ||
| In-group collectivism | 0.805 | ||
| Gender egalitarianism | −0747 | ||
| Power distance | 0.735 | ||
| Human orientation | 0.848 | ||
| Assertiveness | −0.834 | ||
Extraction method: Principal component analysis. Rotation method: Varimax with Kaiser normalization. a. Rotation converged in five iterations.
Factor 1 includes future orientation, performance orientation, and uncertainty avoidance, which represent motivational factors related to achievement, advancement, future growth, and responsibility (Alshmemri et al., 2017).
Factor 2 includes in-group collectivism, gender egalitarianism (with a negative coefficient), and power distance, which are associated with hygiene factors in interpersonal relationships with supervisors, family, and opposite-sex interactions (Alshmemri et al., 2017).
Factor 3, labeled as humanity factor, includes human orientation and assertiveness (with a negative coefficient). Notably, no previous literature provides support for its relationship with entrepreneurship and the economy. Pearson correlation results also confirm the absence of correlations between the humanity factor, entrepreneurial activities, and economic stages (Table 6). Consequently, it is not included in the current study.
Similar to Gusfield’s perspective on tradition and modernity, we contend that motivation culture and hygiene culture are two separate factors that exist independently of each other, rather than being part of a single bipolar continuum (Dacin et al., 2019; Gusfield, 1967). In each country, both motivation and hygiene factors coexist at the national level, implying that the presence of one does not necessarily preclude the existence of the other, and vice versa.
4.2 Baseline Empirical Models
To estimate the regression results, we employ equation (1) to assess both the direct and the interaction effects of culture, economic development, and entrepreneurial activities. In addition, equation (2) is used to examine these relations by lagging one period of the GDP per capita. All variables are measured with “i” as the unit of observation in each country, “t” as the unit of observation in each year, and “t−1” as the unit of observation lagged one period.
4.3 Variables Description
4.3.1 Dependent Variables
GEM data are adopted to examine TEA within the working population, including two distinct categories of activities: one related to necessity and the other to opportunity entrepreneurship. The ratio of opportunity-to-necessity entrepreneurship (OPP/NEC) serves as an indicator of the share of opportunity-driven entrepreneurship compared to necessity-driven entrepreneurship (Acs, 2006). To maximize the number of available countries and the number of samples, the panel data of GEM are collected from 2011 to 2018, in alignment with the economic stages of countries derived from Global Competitiveness Report (GCR).
TEA: This measures the percentage of individuals aged 18–64 who are either nascent entrepreneurs (starting a venture or recently launched one within 3 months) or owner-managers of new businesses (managing a business for more than 3 months but less than 42 months). TEA includes both nascent entrepreneurs and young business owners.
OPP/NEC: This ratio indicates the proportion of opportunity-driven entrepreneurship to necessity-driven entrepreneurship. Opportunity-driven entrepreneurs start businesses because they see promising market opportunities and are motivated by innovation and growth. Necessity-driven entrepreneurs, on the other hand, start businesses out of economic necessity, often due to a lack of other employment options, and are primarily motivated by the need for income and employment. These categories help identify the different motivations behind entrepreneurial activities. The OPP/NEC ratio serves as an indicator of the quality and innovation of entrepreneurship (Acs, 2006).
4.3.2 Independent variables
As for the cultural variables, there are two explanatory factors – motivation culture and hygiene culture, which are extracted from the data in the GLOBE project:
Motivation culture: This is represented by the mean values of future orientation, performance orientation, and avoidance of uncertainty.
Hygiene culture: This is represented by the mean values of in-group collectivism, gender inequality (inverted egalitarianism), and power distance.
As for economic variables, there are two indicators: the economic stages cited from the GCR of global economic forum, and GDP per capita.
Economic stages: According to the GCR 2017–2018,[1] the GDP per capita level at market exchange rates and the driving force for its development, are used to allocate countries (or regions) into three economic stages and two transition states: stage 1 (factor driven), transition 1 from stage 1 to stage 2, stage 2 (efficiency driven), transition 2 from stage 2 to stage 3, and stage 3 (innovation driven). These are encoded as 1, 1.5, 2, 2.5, and 3 ordinally.
GDP per capita: The GDP per capita from the International Monetary Fund (IMF) represents the average economic output per person within a specific country or region. Purchasing power parity (PPP) calculations are adopted in this study, which take into account the relative cost of living and inflation rates in different countries. This allows for a more accurate comparison of the residents’ economic levels and reflects the true economic conditions in each country. To address skewness and heteroscedasticity issues in GDP data, the natural logarithm of GDP values was being used to better align with the assumptions of the following econometric models.
4.3.3 Control variables
To account for the impact of the entrepreneurial environment and institutional factors on potential entrepreneurs’ decisions to start a business, the entrepreneurial framework condition (EFC) variable from the GEM is included in the regression analysis. This addition aims to enhance the reliability of the research by controlling for these environmental and institutional influences on entrepreneurship.
Entrepreneurial framework: the conditions contain 12 subscales, financing for entrepreneurs, governmental support and policies, taxes and bureaucracy, governmental programs, basic school entrepreneurial education and training, post school entrepreneurial education and training, R&D transfer, commercial and professional infrastructure, internal market dynamics, internal market openness, physical and services Infrastructure, and other factors related to entrepreneurship. Same as for the dependent variables like TEA and OPP/NEC, the range of the data is extended from 2011 to 2018, and the values are averaged. The specific definitions of each subscale are described in the appendix (Table A1).
4.4 Data Analysis
To analyze the data, various statistical methods and tests were employed to analyze and interpret the data, helping to draw meaningful conclusions from the research findings. They are as follows:
One-way analysis of variance (ANOVA): Used to assess the significance of differences in culture, economy, and entrepreneurship across the five economic stages and four quadrant groups of culture combination.
Bivariate correlation: Conducted to identify the significance of relationships among the variables, which justify the necessity of following regression analysis.
Panel data regression: The panel data regression of fixed effect is applied to confirm the direct and interaction effects. To control the endogeneity between the economy and entrepreneurship, a fixed effects panel regression is adopted, with the individual effects of year and country controlled, with and without one-period lag on GDP per capita. To mitigate multicollinearity, relevant variables in the interaction models were standardized. To overcome the impact of autocorrelation, national level clustered standard errors are used.
Dummy variable regression: Employed as a robust test to verify the relations, and the dummy variable of high or low level of economy is included, which is rather persistent compared with yearly changing GDP per capita.
Visualization: Interaction effects were visualized using figures, following the methods of Dawson and Richter (2006)[2].
Culture Map: Created to demonstrate the distribution of countries (regions) in the quadrant distribution diagram.
5 Empirical Results
5.1 Comparative Analysis Across Economic Stages
Table 4 shows the descriptive statistics of all the variables. Table 5 shows the results of One-way ANOVA at different economic stages, indicating statistically significant differences in entrepreneurial framework, motivation culture, hygiene culture, and entrepreneurial activities across various economic stages. This suggests that different economic stages play a significant role in shaping these variables, highlighting the importance of considering economic context when studying the relation between culture and entrepreneurship.
The descriptive statistics of all variables
| Variable | Obs. | Mean | Std. Dev. | Min | Max | Median | Sources |
|---|---|---|---|---|---|---|---|
| TEA | 292 | 11.61 | 7.06 | 2.93 | 41.46 | 11.61 | GEM |
| OPP/NEC | 292 | 4.22 | 2.85 | 0.74 | 19.62 | 4.22 | GEM |
| Motivation | 292 | 3.99 | 0.43 | 3.05 | 5.09 | 4.00 | GLOBE |
| Hygiene | 292 | 2.30 | 0.43 | 0.99 | 2.94 | 2.37 | GLOBE |
| LnGDP | 292 | 10.12 | 0.72 | 8.11 | 11.46 | 10.12 | IMF |
| E-stages | 292 | 2.44 | 0.60 | 1.00 | 3.00 | 2.50 | GCR |
| Framework | 292 | 32.93 | 3.78 | 23.57 | 43.56 | 32.94 | GEM |
One-way ANOVA at different economic stages
| Economic stages | Stage 1 (factor driven) | Transition from stage 1 to stage 2 | Stage 2 (efficiency driven) | Transition from stage 2 to stage 3 | Stage 3 (innovation driven) | F-value | Significance |
|---|---|---|---|---|---|---|---|
| GDP per capita | 5205.24 | 11465.66 | 12463.46 | 23217.2 | 46562.82 | 21.60 | 0.00 |
| Framework | 33.63 | 31.57 | 31.37 | 32.25 | 34.68 | 3.11 | 0.02 |
| Motivation | 4.08 | 3.81 | 3.81 | 3.73 | 4.20 | 3.60 | 0.01 |
| Hygiene | 2.80 | 2.55 | 2.51 | 2.4 | 2.05 | 6.06 | 0.00 |
| TEA | 24.89 | 20.61 | 15.65 | 10.88 | 8.05 | 7.36 | 0.00 |
| OPP/NEC | 2.03 | 2.33 | 2.35 | 2.93 | 5.06 | 6.15 | 0.00 |
| No. of countries | 2 | 4 | 17 | 6 | 25 | — | — |
As economy advances, the number of TEA decrease from 24.89 in factor-driven economies to 8.05 in innovation-driven economies (F = 7.36, P ≤ 0.01). Conversely, the ratio of OPP/NEC significantly increases from 2.03 to 5.06 (F = 6.15, P ≤ 0.01). At the same time, motivation culture increases from 4.08 to 4.20 (F = 3.60, P ≤ 0.01), while hygiene culture drops from 2.80 to 2.05 (F = 6.06, P ≤ 0.01). In addition, a preliminary analysis of Pearson correlation between the variables is conducted.
5.2 Pearson Correlation
The Pearson correlation matrix in Table 6 reveals some significant relationships among the variables. Notably, there is a negative correlation (−0.225, P ≤ 0.05) between TEA and OPP/NEC, indicating that as the number of TEA worsen the ratio of OPP/NEC. TEA exhibits a negative correlation (−0.563, P ≤ 0.01) with the economy. Conversely, there is a positive correlation (0.542, P ≤ 0.01) between OPP/NEC and the economy. These results align with the previous research, which suggests that opportunity-driven entrepreneurship is more beneficial for economic growth due to its higher motivation and innovation, while necessity-driven entrepreneurship may be less conducive to economic development (Acs, 2006; Pinillos & Reyes, 2011). Is there a possibility that economic development contains the necessity-driven entrepreneurship, while promoting opportunity-driven entrepreneurship?
Pearson correlation matrix
| TEA | OPP/NEC | Frame | LnGDP | E_stages | Motivation | Hygiene | Humanity | |
|---|---|---|---|---|---|---|---|---|
| TEA | 1 | |||||||
| OPP/NEC | −0.225* | 1 | ||||||
| Framework | −0.176 | 0.448** | 1 | |||||
| LnGDP | −0.563** | 0.542** | 0.451** | 1 | ||||
| E_stages | −0.464** | 0.485** | 0.299* | 0.849** | 1 | |||
| Motivation | −0.126 | 0.453** | 0.633** | 0.365* | 0.235* | 1 | ||
| Hygiene | 0.359* | −0.578** | −0.421** | −0.689** | −0.571** | −0.456** | 1 | |
| Humanity | 0.097 | 0.203 | 0.362** | −0.172 | −0.141 | 0.365** | −0.074 | 1 |
*, ** represents the significance level at 5 and 1% respectively.
The correlation results indicate that motivation culture is positively correlated with OPP/NEC (0.453, P ≤ 0.01), economic stages (0.235, P ≤ 0.05), and economic development (0.365, P ≤ 0.05). However, there is no significant correlation between motivation culture and TEA (−0.126, P > 0.1). On the other hand, hygiene culture is positively correlated with TEA (0.359, P ≤ 0.05) but negatively correlated with almost all other variables, including a strong negative correlation with OPP/NEC (−0.578, P ≤ 0.01), economic stages (−0.571, P ≤ 0.01), and economic development (−0.689, P ≤ 0.01). This aligns with the ANOVA results, suggesting that hygiene culture may be associated with higher TEA but less favorable for opportunity-driven entrepreneurship (OPP/NEC) and other factors.
While the Pearson correlation analysis serves to ascertain the existence and strength of relationships between variables, it primarily captures associations rather than providing insights into causal effects. These data show that there are significant variations and close relations between entrepreneurial and cultural variables across different economic stages. However, to delineate and substantiate the causal relations among the variables, the need of regression models becomes imperative. Regression analysis enables a systematic examination of the causal relation by elucidating the impact of one or more independent variables on a dependent variable, thereby providing a more refined understanding of the intricate relationship within the studied variables.
Before that, one thing needs to be stated that the correlation matrix shows that there is no multicollinearity issue among the variables, as no single correlation value exceeds the threshold of + or −0.70. This indicates that the variables in the study are not highly correlated with each other, ensuring the robustness of the subsequent regression analyses. Moreover, taking the results of ANOVA and Pearson correlation, the entrepreneurial framework is also highly related to most variables, including TEA and OPP/NEC, thereby it should be controlled in the following regression models.
5.3 Panel Data Regression
To explore the interaction between culture, economy, and entrepreneurial activities, panel data regression was conducted. The results of the Hausman test indicated that the data met the assumptions necessary for employing fixed effects in the model, affirming the appropriateness for the panel data analysis. Since the economic stages from the GCR are an ordinal variable and not available as panel data, LnGDP per capita is used as a proxy for economic development. This adjustment allows for a quantitative representation of economic development levels, facilitating a more nuanced analysis within the given data constraints. While recognizing that national culture evolves over the long term, the cross-sectional culture data from GLOBE are employed in a panel regression analysis because the national culture remains comparatively stable in the short term. To be specific, national level clustered standard errors are used to overcome the impact of autocorrelation.
The results of panel regression analyses in Tables 7 and 8 show the relationships between cultural factors, economic development, and entrepreneurial activities. Notably: Model 1 to Model 10 in Table 7, TEA is the dependent variable, while from Model 11 to Model 20 in Table 8, OPP/NEC is the dependent variable.
The hierarchical regression results for TEA
| Model 1 | Model 2 | Model 3 | Model 4 | Model 5 | Model 6 | Model 7 | Model 8 | Model 9 | Model 10 | |
|---|---|---|---|---|---|---|---|---|---|---|
| TEA | TEA | TEA | TEA | TEA | TEA | TEA | TEA | TEA | TEA | |
| z_Framework | −0.176* | −0.077 | 0.098 | 0.065 | 0.034 | −0.073 | 0.058 | 0.012 | −0.003 | 0.022 |
| (−1.870) | (−0.734) | (0.930) | (0.569) | (0.339) | (−0.703) | (0.487) | (0.087) | (−0.032) | (0.171) | |
| Mot | 0.088 | 0.051 | −0.029 | 0.080 | 0.058 | −0.060 | 0.049 | |||
| (0.682) | (0.461) | (−0.265) | (0.634) | (0.490) | (−0.543) | (0.435) | ||||
| Hyg | 0.404*** | −0.025 | −0.001 | 0.482** | −0.084 | −0.091 | 0.223* | |||
| (2.817) | (−0.202) | (−0.003) | (2.671) | (−0.453) | (−0.470) | (1.819) | ||||
| z_LnGDP | −0.608*** | −0.627*** | −0.624*** | |||||||
| (−3.812) | (−3.837) | (−4.446) | ||||||||
| z_LnGDP*Mot | 0.237** | |||||||||
| (1.964) | ||||||||||
| z_LnGDP*Hyg | −0.087 | |||||||||
| (−0.942) | ||||||||||
| L.z_LnGDP*Mot | 0.362** | |||||||||
| (2.656) | ||||||||||
| L.z_LnGDP*Hyg | −0.044 | |||||||||
| (−0.202) | ||||||||||
| Mot*Hyg | −0.179** | −0.175* | ||||||||
| (−1.974) | (−1.744) | |||||||||
| L.z_LnGDP | −0.586*** | −0.640*** | −0.724*** | −0.622*** | ||||||
| (−3.287) | (−3.303) | (−4.309) | (−3.220) | |||||||
| Year | Control | Control | Control | Control | Control | Control | Control | Control | Control | Control |
| Country | Control | Control | Control | Control | Control | Control | Control | Control | Control | Control |
| _cons | −0.000 | 0.005 | −0.000 | −0.001 | −0.141 | −0.068 | 0.009 | 0.010 | −0.133 | −0.092 |
| (−0.000) | (0.040) | (−0.000) | (−0.013) | (−1.634) | (−0.583) | (0.082) | (0.090) | (−1.140) | (−0.784) | |
| N | 292.000 | 292.000 | 292.000 | 292.000 | 292.000 | 292.000 | 219.000 | 219.000 | 219.000 | 219.000 |
| R 2 | 0.031 | 0.134 | 0.325 | 0.327 | 0.374 | 0.147 | 0.305 | 0.310 | 0.398 | 0.332 |
t-Statistics in parentheses, * p < 0.10, ** p < 0.05, *** p < 0.01.
The hierarchical regression results for OPP/NEC
| Model 11 | Model 12 | Model 13 | Model 14 | Model 15 | Model 16 | Model 17 | Model 18 | Model 19 | Model 20 | |
|---|---|---|---|---|---|---|---|---|---|---|
| OPP/NEC | OPP/NEC | OPP/NEC | OPP/NEC | OPP/NEC | OPP/NEC | OPP/NEC | OPP/NEC | OPP/NEC | OPP/NEC | |
| z_Framework | 0.217*** | 0.077 | 0.095* | 0.026 | 0.010 | 0.107 | 0.160*** | 0.054 | 0.034 | 0.078 |
| (2.798) | (1.073) | (1.809) | (0.435) | (0.190) | (1.455) | (3.127) | (0.717) | (0.452) | (1.099) | |
| Mot | 0.246*** | 0.238*** | 0.137 | 0.205** | 0.186** | 0.117 | 0.167** | |||
| (3.170) | (3.276) | (1.579) | (2.503) | (2.204) | (1.256) | (1.982) | ||||
| Hyg | −0.460*** | −0.262 | −0.205 | −0.323*** | −0.308* | −0.261** | −0.198 | |||
| (−3.151) | (−1.493) | (−1.468) | (−2.838) | (−1.817) | (−2.038) | (−1.375) | ||||
| z_LnGDP | 0.510*** | 0.302*** | 0.413*** | |||||||
| (7.104) | (3.361) | (4.927) | ||||||||
| z_LnGDP*Mot | 0.071 | |||||||||
| (1.182) | ||||||||||
| z_LnGDP*Hyg | −0.276*** | |||||||||
| (−3.129) | ||||||||||
| L.z_LnGDP*Mot | 0.073 | |||||||||
| (0.991) | ||||||||||
| L.z_LnGDP*Hyg | −0.203** | |||||||||
| (−2.157) | ||||||||||
| Mot*Hyg | −0.351*** | −0.233** | ||||||||
| (−2.894) | (−2.120) | |||||||||
| L.z_LnGDP | 0.438*** | 0.240** | 0.317*** | 0.246*** | ||||||
| (5.775) | (2.509) | (3.205) | (2.637) | |||||||
| Year | Control | Control | Control | Control | Control | Control | Control | Control | Control | Control |
| Country | Control | Control | Control | Control | Control | Control | Control | Control | Control | Control |
| _cons | −0.034 | −0.042 | 0.014 | −0.013 | −0.214** | −0.174** | −0.003 | 0.003 | −0.143* | −0.089 |
| (−0.332) | (−0.541) | (0.166) | (−0.174) | (−2.257) | (−2.226) | (−0.033) | (0.048) | (−1.689) | (−1.164) | |
| N | 292.000 | 292.000 | 292.000 | 292.000 | 292.000 | 292.000 | 219.000 | 219.000 | 219.000 | 219.000 |
| R 2 | 0.128 | 0.128 | 0.150 | 0.158 | 0.216 | 0.216 | 0.168 | 0.168 | 0.244 | 0.244 |
t-Statistics in parentheses, * p < 0.10, ** p < 0.05, *** p < 0.01.
Entrepreneurial framework is taken as control variable in the current study, and Models 1 and 11 show that it makes a negative and significant impact (−0.176, P ≤ 0.1) on TEA, whereas it makes a positive impact (0.217, P ≤ 0.01) on OPP/NEC respectively, as expected.
In Model 2 (TEA) and Model 12 (OPP/NEC), introducing cultural factors alongside control variables reveals that hygiene culture significantly encourages TEA (0.404, P ≤ 0.01), while discouraging OPP/NEC (−0.460, P ≤ 0.1). Motivation culture positively influences OPP/NEC (0.246, P ≤ 0.01), while no impact on TEA. Since economy can explain the motivation of entrepreneurship, which may account for its variation. In Models 3–5, 13–15, economic development is introduced together with or without culture factors.
Economy has a negative and statistically significant impact on TEA (0.608, P ≤ 0.01) in Model 3, while they have a positive and statistically significant impact on OPP/NEC (0.510, P ≤ 0.01) in Model 13.
Model 4 reveals an intriguing shift: the significant promoting effect of hygiene factors on TEA, seen in Model 2, disappears when economic development is considered. Instead, economic development’s containing effect on TEA becomes more pronounced (from −0.608 to –0.627), overshadowing the influence of hygiene factors (from 0.404 to −0.025). In contrast, when explaining OPP/NEC in Model 14, the effects of motivation and hygiene factors remain consistent with that in Model 12 (from 0.246 to 0.238 and −0.460 to −0.262, respectively).
These results highlight the dynamic relationship between cultural factors, economic development, and entrepreneurial activities. Thereafter, their interaction effects are postulated that there are interaction of economy and two cultures, as well as interaction between two cultures themselves on entrepreneurship. Models 5 and 15 are applied to check the former, while Models 6 and 16 are applied to check the latter.
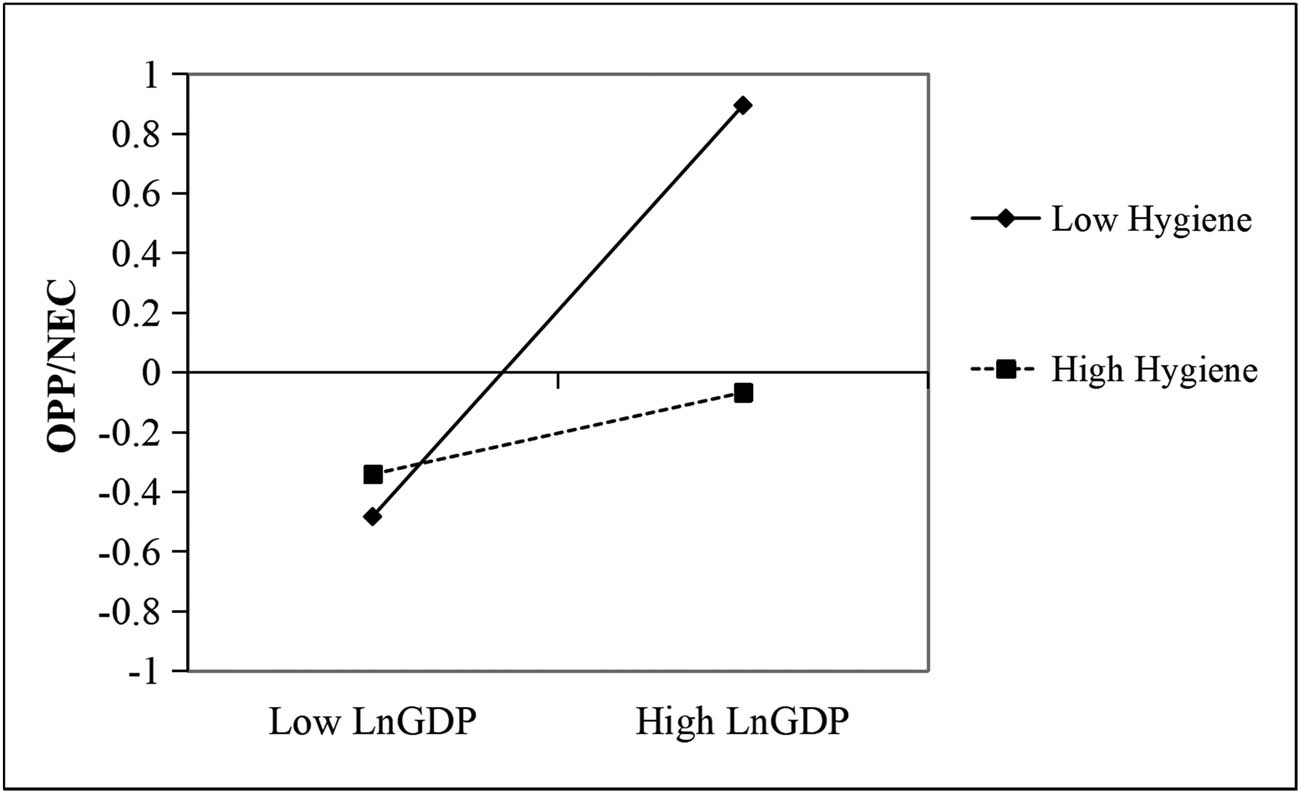
The positive interaction effect of motivation culture in Model 5 (0.237, P ≤ 0.05) shows its reduction of economic development’s containment on TEA, while hygiene culture does not. The interaction effect is visualized in Figure 1. On the contrary, the negative interaction effect of hygiene culture in Model 15 (−0.276, P ≤ 0.01) shows its offsetting effect on economic development’ s promotion on OPP/NEC, while motivation culture does not, as shown in Figure 2. In Model 6, the negative interaction effect of two cultures (−0.179, P ≤ 0.05) shows motivation culture’s reducing effect on hygiene culture’s encouragement on TEA. On the contrary, the negative interaction effect (−0.351, P ≤ 0.01) in Model 16 demonstrates the reducing effect of hygiene culture on the promotion of motivation culture on OPP/NEC. These interaction effects of cultures themselves are illustrated in Figures 3 and 4.

The interaction effect between motivation culture and economic development on TEA.
The interaction effect between hygiene culture and economic development on OPP/NEC.

The interaction effect between motivation culture and hygiene culture on TEA.

The interaction effect between motivation culture and hygiene culture on OPP/NEC.
In Models 7–10 and Models 17–20, the lagging of GDP per capita by one period is implemented to mitigate endogeneity concerns between the economy and entrepreneurship. This adjustment results in a reduction of the sample size from 292 to 219. The regression results have been checked, and it can be safely stated that there are no noticeable changes observed in the direction or relations between culture, economy, and entrepreneurship.
5.4 Robust Test
To establish more direct insights into the relationships among culture, economic level, and entrepreneurship, a robust examination was conducted, incorporating a dummy variable representing economic levels. In accordance with the GCR 2017–2018, countries or regions were categorized into three distinct economic stages – factor driven, efficiency driven, and innovation driven – along with two transitional states. This classification, based on both GDP and the driving force for development, exhibits greater stability compared to relying solely on annual GDP per capita. For our investigation, we designated countries or regions of stages 1 and 2 and the transitional state as low-level economies, coded as “0,” while those of stage 3 and its transitional state were categorized as high-level economies, coded as “1.” The results of the dummy variable regression analysis are presented in Table 9.
The dummy variable regression results of high or low level of economy
| Model 21 | Model 22 | Model 23 | Model 24 | Model 25 | Model 26 | |
|---|---|---|---|---|---|---|
| TEA | TEA | TEA | OPP/NEC | OPP/NEC | OPP/NEC | |
| z_Framework | 0.012 | 0.024 | 0.015 | 0.162** | 0.059 | 0.049 |
| (0.227) | (0.366) | (0.231) | (2.512) | (0.920) | (0.840) | |
| Mot | 0.024 | −0.016 | 0.243*** | −0.013 | ||
| (0.360) | (−0.151) | (3.566) | (−0.150) | |||
| Hyg | 0.124* | 0.443*** | −0.350** | −0.078 | ||
| (1.686) | (3.193) | (−2.150) | (−0.876) | |||
| E-levels (0/1) | −1.106*** | −1.007*** | −0.829*** | 0.864*** | 0.410** | 0.626*** |
| (−10.205) | (−8.066) | (−5.851) | (5.230) | (2.426) | (4.809) | |
| E-levels*Mot | 0.443*** | 0.338*** | ||||
| (2.709) | (2.964) | |||||
| E-level*Hyg | −0.015 | −0.310* | ||||
| (−0.123) | (−1.733) | |||||
| _cons | 0.674*** | 0.615*** | 0.397*** | −0.530*** | −0.278* | −0.528*** |
| (8.163) | (6.802) | (3.272) | (−6.000) | (−1.928) | (−5.163) | |
| N | 292.000 | 292.000 | 292.000 | 292.000 | 292.000 | 292.000 |
| R2 | 0.288 | 0.294 | 0.312 | 0.188 | 0.197 | 0.213 |
t-Statistics in parentheses. * p < 0.10, ** p < 0.05, *** p < 0.01.
The dummy regression results align with the panel data regression (5.3), demonstrating remarkable consistency, with one exception observed in Model 26. In this model, the interaction effects between motivation/hygiene culture and the economy level on OPP/NEC prove to be statistically significant (0.338, P ≤ 0.01; −0.310, P ≤ 0.1), while the corresponding interaction effect of motivation culture in Model 15 (0.071, P ≥ 0.1) is not significant. Nevertheless, this divergence does not compromise the overall robustness and reliability of the results obtained from the panel data regression.
5.5 Map of Culture Distribution
As mentioned previously, motivation culture and hygiene culture are two discrete dimensions that are independent of each other. Within each country, both motivation and hygiene factors coexist at the national level. To visually illustrate the cultural scores and their impact, countries are categorized culturally into four combinations using the medians of the motivational factor (4.00) and hygiene factor (2.37) as reference points. This classification results in a quadrant distribution diagram, which can visualize how countries fall within the motivation-hygiene framework, as displayed in Figure 5.
Countries in Quadrant I are featured with high motivation (mean = 4.20) and high hygiene culture (mean = 2.63), such as China, India, and Philippines. Countries or regions in Quadrant II are featured with low motivation (mean = 3.67) and high hygiene culture (mean = 2.62), such as Thailand, Spain, and Turkey. Countries in Quadrant III are featured with low motivation (mean = 3.60) and low hygiene culture (mean = 2.16), such as Qatar, Bolivia, and Namibia. Countries in Quadrant IV are featured with high motivation (mean = 4.43) and low hygiene (mean = 1.86), such as Denmark, the United States, and Switzerland.
ANOVA was conducted to examine the differences in variables among the four quadrant groups, particularly to assess the impact of different cultural combinations on economic development. The results, as shown in Table 10, demonstrate that the four groups exhibit significantly different performances in GDP per capita and reach different economic stages, with all P-values less than 0.05. Countries or regions in Quadrant IV tend to perform the best in terms of economic development.
One-way ANOVA among countries or regions in quadrant culture distribution
| Quadrant I | Quadrant II | Quadrant III | Quadrant IV | F-Value | Significance | |
|---|---|---|---|---|---|---|
| GDP per capita | 19135.58 | 16588.00 | 30957.70 | 46388.06 | 10.00 | 0.00 |
| Economic stages | 2.05 | 2.21 | 2.40 | 2.94 | 9.28 | 0.00 |
| Framework | 34.66 | 30.64 | 32.16 | 35.19 | 8.34 | 0.00 |
| Motivation | 4.20 | 3.67 | 3.60 | 4.43 | 42.27 | 0.00 |
| Hygiene | 2.63 | 2.62 | 2.16 | 1.86 | 32.38 | 0.00 |
| TEA | 14.26 | 15.26 | 12.50 | 8.10 | 2.86 | 0.05 |
| OPP/NEC | 2.94 | 2.45 | 2.94 | 5.69 | 10.08 | 0.00 |
| Number | 10 | 17 | 10 | 17 | — | — |
6 Discussion
6.1 Hypotheses of Direct Effects Tested
Taking the coeffects of Pearson correlation between motivation culture and TEA (−0.126, P ≥ 0.1), and OPP/NEC (0.453, P ≤ 0.01 ) in Table 6, and the regression results of Model 2 (0.088, P ≥ 0.01) and Model 12 (0.246, P ≤ 0.01) in Tables 7 and 8, countries with high motivation culture exhibits no difference in TEA, yet significantly high OPP/NEC. H1a is partially true.
This implies that the motivational influence exerted by motivation culture is particularly pronounced in fostering opportunities rather than necessitated entrepreneurial endeavors. As per the Herzberg theory stated that motivational factors are intrinsic to the job and entrepreneurial activities (Alshmemri et al., 2017; Galanakis & Peramatzis, 2022; Herzberg, 2005). In this study, motivation culture, assessed through performance, future orientation, and uncertainty avoidance reflects a cultural environment that promotes individual freedom, personal achievement, self-expression, subjective well-being, and self-actualization. These factors are conducive to entrepreneurship, particularly opportunity-driven entrepreneurship.
Taking the coeffects of Pearson correlation between hygiene culture and TEA (0.359, P ≤ 0.05), and OPP/NEC (−0.578, P ≤ 0.01), and the regression results of Model 2 (0.404, P ≤ 0.01) and Model 12 (−0.460, P ≤ 0.01), it can be safe to say that hygiene culture positively correlated with TEA, while negatively correlated with OPP/NEC. H1b is versified.
Hygiene factors, measured by in-group collectivism, gender egalitarianism, and power distance in the current study, are extrinsic to the job (Alshmemri et al., 2017; Galanakis & Peramatzis, 2022). Countries with high hygiene culture prioritize concepts like obedience to power, authority, and loyalty to collective interests. It is noted to say individuals in this culture can benefit from strong interpersonal relationships, often grounded in family kinship, providing substantial social and emotional support, when they start business. Conversely, opportunity-seeking entrepreneurial activities marked by elements of risk, the pursuit of opportunities, and alterations to individuals’ established status quo are inherently incongruent with the settings of hygiene culture. Such endeavors are perceived as discordant with the principles of hygiene culture, and perceived as unpleasant behavior, thus causing the decline of OPP/NEC.
Taken the results of one-way ANOVA in Table 5, it is found that the TEA falls with improving the economic conditions from 24.89 at stage 1 to 8.05 at stage 3, while OPP/NEC, which keeps increasing from 2.03 to 5.06. With the economic development, the number of TEA decreases from factor-driven economies to innovation-driven economies (F = 7.36, P ≤ 0.01), while motivation culture increases (F = 3.60, P ≤ 0.01). Pearson correlation coeffects of TEA with economic stages (−0.464, P ≤ 0.01), GPD per capita (−0.563, P ≤ 0.01) while OPP/NEC with economic stages (0.485, P ≤ 0.01), GPD per capita (0.542, P ≤ 0.01) show that economic development negatively affects TEA and positively promotes OPP/NEC. The regression results of Model 3 (−0.608, P ≤ 0.01) and Model 13 (0.510, P ≤ 0.01) further validate this relationship. Both H2a and H2b are confirmed.
It is shown that in less economically developed countries, self-employment and entrepreneurship, particularly necessity-driven entrepreneurship, play a significant role in job creation and market development. As economies progress toward innovation-driven stages, larger firms and stable wage employment opportunities become more prevalent, leading to a decrease in new business startups (TEA). Instead, individuals may engage in entrepreneurship for self-actualization and growth, facilitating the promotion of high-quality entrepreneurial endeavors and contributing to the rise of OPP/NEC.
6.2 Hypotheses of Interaction Effects Tested
The results from panel regression with fixed effects in Tables 7 and 8 provide insights into the interaction effects between cultural factors and economic stages on entrepreneurship. As the results in Model 5 show, the positive interaction effect of motivation culture in Model 5 (0.237, P ≤ 0.05) demonstrates its reduction of economic development’s containment on TEA. According to the results in Model 15, the interaction effect of motivation culture (0.071, P ≥ 0.1) does not exist. Thereafter, H3a that the containment of economy on TEA can be mitigated by motivation culture is proved, while its promotion of economy’s encouragement on OPP/NEC is not supported. Therefore, motivation culture should not be overstressed, because it may offset the reducing effects of economy on TEA, causing more people to start their own business blindly, while not promoting the quality of entrepreneurship. H3a is partially supported.
Interestingly, the results in Model 5 do not support the interaction effect of hygiene culture’s interaction effects with economy on TEA (−0.087, P ≥ 0.1). However, according to the results in Model 15, the worsening effect of hygiene culture with economy on OPP/NEC exists (−0.276, P ≤ 0.01). Thereafter, H3b that the containment of economy on TEA is not worsened by hygiene culture, while its promotion of economy on OPP/NEC is reduced by hygiene culture. Seemingly, with the development of economy, hygiene culture factors like in-group collectivism and power distance should not be encouraged, because they may offset the promoting effects of economy on OPP/NEC. H3b is partially supported.
The results concerning the interaction effects of motivation culture and hygiene culture are complex. Results of culture interaction effects shown in Models 6 and 16 are profound. Within Model 6, the negative interaction effect (−0.179, P ≤ 0.05) between cultures illustrates the mitigating impact of motivation culture on the stimulation of hygiene culture to TEA. Conversely, in Model 16, the observed negative interaction effect (−0.351, P ≤ 0.01) shows the bad influence of hygiene culture on motivation culture’s fostering effect on OPP/NEC; thus, H4 is confirmed. This phenomenon can be explained by the fact that motivation culture, characterized by a higher level of performance orientation and uncertainty avoidance, may create lower incentives for risky endeavors such as innovation and entrepreneurship, which is exacerbated in cultures with high power distance and strong emphasis on family boundaries (Achim et al., 2021).
The incorporation of a one-period lag on GDP per capita in the panel regression framework emerges as a widely used strategy for confronting and alleviating endogeneity concerns (Nathaniel et al., 2021; Sadorsky, 2010; Teles & Cesar Mussolini, 2014). This congruence of results between Models 7–10 and 17–20 with one-period lag on GDP per capita and Models 3–6 and 13–16 without lagging, per se, provides a compelling argument for the reliability and resilience of this method. While acknowledging that a one-period lag on GDP per capita may not comprehensively address all aspects of the endogeneity concerns associated with the economy and entrepreneurship, its utilization reaffirms the stability and coherence of the observed results. Economic development with one-period lag consistently demonstrates its containing effect on TEA, as in Models 7–10 (−0.586, P ≤ 0.01; −0.640, P ≤ 0.01; −0.724, P ≤ 0.01; −0.622, P ≤ 0.01) and promoting effect on OPP/NEC, as in Models 17–20 (0.438, P ≤ 0.01; 0.240, P ≤ 0.05; 0.317, P ≤ 0.01; 0.246, P ≤ 0.01). Therefore, H5 is substantiated.
The combined interactive effects of cultural factors are further illustrated by classifying 54 countries or regions into quadrant distribution based on motivation and hygiene scores, as shown in Figure 5. Analyzing the results of one-way ANOVA in Table 10 among countries in quadrant cultural distribution, we observe that countries in Quadrants I and IV share a high motivation culture. However, their corresponding OPP/NEC and TEA levels vary significantly. Similarly, countries in Quadrants I and II share a high hygiene culture, and their OPP/NEC and TEA levels follow similar patterns, with high TEA and low OPP/NEC. Regarding entrepreneurial activities, countries/regions in Quadrant IV exhibit the lowest TEA and the highest rate of OPP/NEC. In other words, countries or regions in Quadrant IV achieve the highest performance in both economic development and entrepreneurial quality. Therefore, H6, which pertains to the influence of cultural combinations on economic development and entrepreneurial activities, is supported. In essence, these findings pertaining to H6 also underscore the statistical rigor and consistency in the results of the panel regression analysis and one-way ANOVA.

Countries/regions in motivation-hygiene quadrant distribution diagram.
7 Contribution, Implications, and Limitations
7.1 Contribution
First, theoretically, the MHT is employed to examine the relations between culture, economy, and entrepreneurial activities, which fills the theoretical gap of clarifying the cultural roles in entrepreneurial activities.
Second, the culture data from GLOBE project (2007) are converted into motivation culture and hygiene culture. Five economic stages from GCR (2018) and the panel data of GDP per capita (2011–2018) are used to represent economic stages and development, respectively, which makes the present study more comprehensive and robust.
Third, from the perspective of statistic methods, apart from the bivariate correlation and one-way ANOVA, the panel data regression of fixed effect, with national-level clustered standard errors, are used to overcome the impact of autocorrelation. The dummy variable regression as a robust examination was conducted, by incorporating the dummy variable of high/low economy.
Finally, to demonstrate the interaction effects of economy, cultures, and different entrepreneurial activities, two-way interaction effects are plotted. Plus, a culture map is drawn according to the culture scores of 54 countries (regions) to demonstrate their distribution in the quadrant distribution diagram globally.
7.2 Policy Implication
Motivational factors and hygienic elements assume distinct roles throughout entrepreneurial endeavors, exhibiting varying significance across different economic stages. There are no universal rules of cultural practices and entrepreneurial activities for different countries to pursue. Hence, without specifying the economic stages, it would be too simplistic to draw the conclusion that the hygiene culture stimulates the necessity-driven entrepreneurship or motivation culture promotes opportunity-driven entrepreneurship. Similarly, even though the economic development’s confinement on TEA and encouragement of OPP/NEC have been testified, this relationship can be elucidated only within the contextual framework of two types of cultures.
Some findings of this research show the facts that, i.e., low economic stage countries, if featured by high hygiene culture, such as high in-group collectivism, and power distance can create many entrepreneurial activities, mostly necessity-driven ones. With the continual economic development, their entrepreneurial activities (TEA) decrease sequentially, while few of them can be transformed into opportunity driven if there is no high motivation culture, such as poor future orientation and poor performance. In contrast, high economic stage countries, if featured by high motivation culture and low hygiene culture, by stressing self-actualization, good performance, and uncertainty avoidance without caring about power distance and collective confinement, can bring about opportunity-driven entrepreneurship and enhance entrepreneurial quality, and more importantly, they make positive feedback on entrepreneurship and innovation, which brings forward the promotion of economy sequentially. However, Motivation Culture should not be overstressed in developed economy, because it may offset the reducing effects of economy on TEA, causing more unqualified people to make the decision of starting business.
7.3 Limitations and Future Research
This study has several limitations that should be acknowledged and considered for future research. First, the data of culture and entrepreneurial activities used in this study were obtained from two independent databases, which led to the collected data unbalanced. Even though the sample size in this study reaches 292, it is still relatively small for entrepreneurship study. Also, in view of the possible endogeneity between economy and entrepreneurship, one-period lag on GDP per capita was adopted in the panel regression to alleviate endogeneity concerns. However, there is still a risk of endogeneity due to simultaneous causality, which makes the generalization of the findings more cautious and further studies are needed.
Understanding these dynamics between culture, economy, and entrepreneurship is crucial for policymakers, researchers, and entrepreneurs themselves, as it emphasizes the need to consider both motivational and environmental factors when fostering entrepreneurial ecosystems. While Herzberg’s MHT has been extensively studied in the context of job satisfaction, its applications in culture and entrepreneurial motivation are quite novel. Future research is needed to justify and confirm this theoretical attempt in the related areas for a more comprehensive understanding.
This research attempts to shed some light on the effects of interaction between culture and economy on entrepreneurship. However, all of them are complex, multifaceted, and interrelated. Future research can delve into their relationships from new perspective, like the mediating effect of entrepreneurship on culture and economic development, with the hope of exploring more intriguing relationships among them.
Acknowledgments
Thanks to anonymous reviewers for valuable comments and constructive suggestions.
-
Funding information: The authors received support from the Anhui Provincial Department of Education (grant number: SK2020A0263) for the submitted work.
-
Conflict of interest: The authors declare that they have no conflicts of interest.
-
Data availability statement: The datasets generated during and/or analysed during the current study are available from the corresponding author on reasonable request.
-
Article note: As part of the open assessment, reviews and the original submission are available as supplementary files on our website.
Appendix
The definition of 12 sub-scales in EFCs
| Variable | Definition |
|---|---|
| Entrepreneurial finance | The availability of financial resources in the country |
| Governmental policies of support and relevance | The extent to which public policies support entrepreneurship |
| Government policies of taxes and bureaucracy | The extent to which public policies encourage entrepreneurship by taxes or regulations |
| Government entrepreneurship programs | The presence and quality of programs directly promoting business starting at all levels of government (national, regional, municipal) |
| Entrepreneurial education at school stage | The extent to which training in creating or managing businesses is incorporated within the education and training system at primary and secondary levels |
| Entrepreneurial education at post school stage | The extent to which training in creating or managing businesses is incorporated within the education and training system in higher education |
| R&D transfer | The extent to which national research and development will lead to new commercial opportunities |
| Commercial and legal infrastructure | The presence of property rights, commercial, accounting and other legal and assessment services and institutions that support or promote businesses |
| Internal market dynamics | The level of change in markets yearly |
| Internal market burdens or entry regulation | The extent to which new businesses are free to enter existing markets |
| Physical infrastructure | Ease of access to physical resources – communication, utilities, transportation, land or space |
| Social norms | The extent to which social norms encourage or allow actions leading to new business methods or activities |
References
Achim, M. V., Borlea, S. N., & Văidean, V. L. (2021). Culture, entrepreneurship and economic development. An empirical approach. Entrepreneurship Research Journal, 11(1), 20180091. doi: 10.1515/erj-2018-0091.Search in Google Scholar
Acs, Z. (2006). How is entrepreneurship good for economic growth? Innovations: Technology, Governance, Globalization, 1(1), 97–107.Search in Google Scholar
Acs, Z. J., & Audretsch, D. B. (1990). Innovation and small firms. MIT Press.Search in Google Scholar
Acs, Z. J., & Audretsch, D. B. (2003). Innovation and technological change. Handbook of entrepreneurship research (pp. 55–79). Springer.Search in Google Scholar
Acs, Z. J., Audretsch, D. B., Braunerhjelm, P., & Carlsson, B. (2012). Growth and entrepreneurship. Small Business Economics, 39(2), 289–300.Search in Google Scholar
Afsar, B., Al-Ghazali, B. M., Cheema, S., & Javed, F. (2021). Cultural intelligence and innovative work behavior: The role of work engagement and interpersonal trust. European Journal of Innovation Management, 24(4), 1082–1109. doi: 10.1108/EJIM-01-2020-0008.Search in Google Scholar
Alshmemri, M., Shahwan-Akl, L., & Maude, P. (2017). Herzberg’s two-factor theory. Life Science Journal, 14(5), 12–16.Search in Google Scholar
Angulo-Guerrero, M. J., Pérez-Moreno, S., & Abad-Guerrero, I. M. (2017). How economic freedom affects opportunity and necessity entrepreneurship in the OECD countries. Journal of Business Research, 73, 30–37. doi: 10.1016/j.jbusres.2016.11.017.Search in Google Scholar
Ben Youssef, A., Boubaker, S., Dedaj, B., & Carabregu-Vokshi, M. (2021). Digitalization of the economy and entrepreneurship intention. Technological Forecasting and Social Change, 164, 120043. doi: 10.1016/j.techfore.2020.120043.Search in Google Scholar
Bortolotti, T., Boscari, S., & Danese, P. (2015). Successful lean implementation: Organizational culture and soft lean practices. International Journal of Production Economics, 160, 182–201.Search in Google Scholar
Carree, M., van Stel, A., Thurik, R., & Wennekers, S. (2002). Economic development and business ownership: An analysis using data of 23 OECD countries in the period 1976–1996. Small Business Economics, 19(3), 271–290.Search in Google Scholar
Carree, M., van Stel, A., Thurik, R., & Wennekers, S. (2007). The relationship between economic development and business ownership revisited. Entrepreneurship & Regional Development, 19(3), 281–291.Search in Google Scholar
Castillo-Palacio, M., Batista-Canino, R. M., & Zúñiga Collazos, A. (2017). The relationship between culture and entrepreneurship: From cultural dimensions of GLOBE project. Espacios, 38(34), 12–26.Search in Google Scholar
Cressy, R. (2000). Credit rationing or entrepreneurial risk aversion? An alternative explanation for the Evans and Jovanovic finding. Economics Letters, 66(2), 235–240.Search in Google Scholar
Dacin, M. T., Dacin, P. A., & Kent, D. (2019). Tradition in organizations: A custodianship framework. Academy of Management Annals, 13(1), 342–373.Search in Google Scholar
Davidsson, P. (1995). Culture, structure and regional levels of entrepreneurship. Entrepreneurship & Regional Development, 7(1), 41–62.Search in Google Scholar
Díaz-Casero, J. C., Ferreira, J. J. M., Hernández Mogollón, R., & Barata Raposo, M. L. (2012). Influence of institutional environment on entrepreneurial intention: A comparative study of two countries university students. International Entrepreneurship and Management Journal, 8(1), 55–74.Search in Google Scholar
Fernández-Serrano, J., Berbegal, V., Velasco, F., & Expósito, A. (2018). Efficient entrepreneurial culture: A cross-country analysis of developed countries. International Entrepreneurship and Management Journal, 14(1), 105–127. doi: 10.1007/s11365-017-0440-0.Search in Google Scholar
Frederking, L. C. (2004). A cross-national study of culture, organization and entrepreneurship in three neighbourhoods. Entrepreneurship & Regional Development, 16(3), 197–215.Search in Google Scholar
Galanakis, M., & Peramatzis, G. (2022). Herzberg’s motivation theory in workplace. JPR, 12(12), 971–978. doi: 10.17265/2159-5542/2022.12.009.Search in Google Scholar
Gurel, E., Altinay, L., & Daniele, R. (2010). Tourism students’ entrepreneurial intentions. Annals of Tourism Research, 37(3), 646–669.Search in Google Scholar
Gusfield, J. R. (1967). Tradition and modernity: Misplaced polarities in the study of social change. American Journal of Sociology, 72(4), 351–362.Search in Google Scholar
Hayton, J. C., George, G., & Zahra, S. A. (2002). National culture and entrepreneurship: A review of behavioral research. Entrepreneurship Theory and Practice, 26(4), 33–52.Search in Google Scholar
Herzberg, F. (1976). One more time: How do you motivate employees? In M. M. Gruneberg (Ed.), Job satisfaction — A reader (pp. 17–32). London: Palgrave Macmillan UK.Search in Google Scholar
Herzberg, F. (2005). Motivation-hygiene theory. In J. B. Miner (Ed.), Organizational behavior one: Essential theories of motivation and leadership (Vol. 2, Issue 4, pp. 61–74). New York: ME Sharpe Inc.Search in Google Scholar
Herzberg, F. (2017). Motivation to work. Routledge.Search in Google Scholar
Herzberg, F. I. (1966). Work and the nature of man. Oxford, England: World (Work and the nature of man).Search in Google Scholar
Hofstede, G. (1980). Culture and organizations. International Studies of Management & Organization, 10(4), 15–41.Search in Google Scholar
Hofstede, G. (1994). The business of international business is culture. International Business Review, 3(1), 1–14.Search in Google Scholar
Hofstede, G. (2011). Dimensionalizing cultures: The Hofstede model in context. Online Readings in Psychology and Culture, 2(1), 2307-0919.Search in Google Scholar
Hofstede, G., & McCrae, R. R. (2004). Personality and culture revisited: Linking traits and dimensions of culture. Cross-Cultural Research, 38(1), 52–88.Search in Google Scholar
Hur, Y. (2018). Testing Herzberg’s two-factor theory of motivation in the public sector: Is it applicable to public managers? Public Organization Review, 18(3), 329–343. doi: 10.1007/s11115-017-0379-1.Search in Google Scholar
Kan, K., & Tsai, W. D. (2006). Entrepreneurship and risk aversion. Small Business Economics, 26(5), 465–474.Search in Google Scholar
Kotni, V. V. D. P., & Karumuri, V. (2018). Application of Herzberg two-factor theory model for motivating retail salesforce. IUP Journal of Organizational Behavior, 17(1), 24–42.Search in Google Scholar
McGrath, R. G., MacMillan, I. C., & Scheinberg, S. (1992). Elitists, risk-takers, and rugged individualists? An exploratory analysis of cultural differences between entrepreneurs and non-entrepreneurs. Journal of Business Venturing, 7(2), 115–135.Search in Google Scholar
Morales, C., Holtschlag, C., Masuda, A. D., & Marquina, P. (2019). In which cultural contexts do individual values explain entrepreneurship? An integrative values framework using Schwartz’s theories. International Small Business Journal, 37(3), 241–267. doi: 10.1177/0266242618811890.Search in Google Scholar
Mueller, S. L., & Thomas, A. S. (2001). Culture and entrepreneurial potential: A nine country study of locus of control and innovativeness. Journal of Business Venturing, 16(1), 51–75.Search in Google Scholar
Mueller, S. L., Thomas, A. S., & Jaeger, A. M. (2002). National entrepreneurial potential: The role of culture, economic development, and political history. Advances in Comparative International Management, 14, 221–257.Search in Google Scholar
Nathaniel, S., Barua, S., Hussain, H., & Adeleye, N. (2021). The determinants and interrelationship of carbon emissions and economic growth in African economies: Fresh insights from static and dynamic models. Journal of Public Affairs, 21(1), e2141. doi: 10.1002/pa.2141.Search in Google Scholar
Naude, W., Gries, T., Wood, E., & Meintjies, A. (2008). Regional determinants of entrepreneurial start-ups in a developing country. Entrepreneurship & Regional Development, 20(2), 111–124.Search in Google Scholar
Nikolaev, B. N., Boudreaux, C. J., & Palich, L. (2018). Cross-country determinants of early-stage necessity and opportunity-motivated entrepreneurship: accounting for model uncertainty. Journal of Small Business Management, 56, 243–280.Search in Google Scholar
North, D. C. (2005): The contribution of the new institutional economics to an understanding of the transition problem. Wider perspectives on global development (pp. 1–15). Springer.Search in Google Scholar
Pinillos, M. J., & Reyes, L. (2011). Relationship between individualist–collectivist culture and entrepreneurial activity: evidence from Global Entrepreneurship Monitor data. Small Business Economics, 37(1), 23–37.Search in Google Scholar
Popescu, M., & Crenicean, L. C. (2012). Innovation and Change in Education –Economic Growth Goal in Romania in the Context of Knowledge-Based Economy. Procedia-Social and Behavioral Sciences, 46, 3982–3988. doi: 10.1016/j.sbspro.2012.06.183.Search in Google Scholar
Ratten, V. (2021). Coronavirus (Covid-19) and entrepreneurship: Cultural, lifestyle and societal changes. Journal of Entrepreneurship in Emerging Economies, 13(4), 747–761. doi: 10.1108/JEEE-06-2020-0163.Search in Google Scholar
Reynolds, P. D., Camp, S. M., Bygrave, W. D., Autio, E., & Hay, M. (2002). Global entrepreneurship monitor gem 2001 summary report (pp. 61–77). London Business School and Babson College.Search in Google Scholar
Sadorsky, P. (2010). The impact of financial development on energy consumption in emerging economies. Energy Policy, 38(5), 2528–2535. doi: 10.1016/j.enpol.2009.12.048.Search in Google Scholar
Sarooghi, H., Libaers, D., & Burkemper, A. (2015). Examining the relationship between creativity and innovation: A meta-analysis of organizational, cultural, and environmental factors. Journal of Business Venturing, 30(5), 714–731. doi: 10.1016/j.jbusvent.2014.12.003.Search in Google Scholar
Schwartz, S. H. (1999): A theory of cultural values and some implications for work. Applied Psychology, 48(1), 23–47.Search in Google Scholar
Sternberg, R., & Wennekers, S. (2005). Determinants and effects of new business creation using global entrepreneurship monitor data. Small Business Economics, 24(3), 193–203.Search in Google Scholar
Stoica, O., Roman, A., & Rusu, V. D. (2020). The nexus between entrepreneurship and economic growth: A comparative analysis on groups of countries. Sustainability, 12(3), 1186. doi: 10.3390/su12031186.Search in Google Scholar
Teles, V. K., & Cesar Mussolini, C. (2014). Public debt and the limits of fiscal policy to increase economic growth. European Economic Review, 66, 1–15. doi: 10.1016/j.euroecorev.2013.11.003.Search in Google Scholar
van Stel, A., Carree, M., Thurik, R. (2005). The effect of entrepreneurial activity on national economic growth. Small Business Economics, 24(3), 311–321. doi: 10.1007/s11187-005-1996-6.Search in Google Scholar
Wang, W., He, T., & Li, Z. (2023). Digital inclusive finance, economic growth and innovative development. Kybernetes, 52(9), 3064–3084.Search in Google Scholar
Wennekers, S., & Thurik, R. (1999). Linking entrepreneurship and economic growth. Small Business Economics, 13(1), 27–56.Search in Google Scholar
Wennekers, S., Van Wennekers, A., Thurik, R., & Reynolds, P. (2005). Nascent entrepreneurship and the level of economic development. Small Business Economics, 24(3), 293–309.Search in Google Scholar
Yarovaya, L., Brzeszczyński, J., Goodell, J. W., Lucey, B., & Lau, C. K. M. (2022). Rethinking financial contagion: information transmission mechanism during the COVID-19 pandemic. Journal of International Financial Markets, Institutions and Money, 79, 101589.Search in Google Scholar
Zhao, X., Li, H., & Rauch, A. (2012). Cross-country differences in entrepreneurial activity: The role of cultural practice and national wealth. Frontiers of Business Research in China, 6(4), 447–474.Search in Google Scholar
© 2024 the author(s), published by De Gruyter
This work is licensed under the Creative Commons Attribution 4.0 International License.
Articles in the same Issue
- Regular Articles
- Political Turnover and Public Health Provision in Brazilian Municipalities
- Examining the Effects of Trade Liberalisation Using a Gravity Model Approach
- Operating Efficiency in the Capital-Intensive Semiconductor Industry: A Nonparametric Frontier Approach
- Does Health Insurance Boost Subjective Well-being? Examining the Link in China through a National Survey
- An Intelligent Approach for Predicting Stock Market Movements in Emerging Markets Using Optimized Technical Indicators and Neural Networks
- Analysis of the Effect of Digital Financial Inclusion in Promoting Inclusive Growth: Mechanism and Statistical Verification
- Effective Tax Rates and Firm Size under Turnover Tax: Evidence from a Natural Experiment on SMEs
- Re-investigating the Impact of Economic Growth, Energy Consumption, Financial Development, Institutional Quality, and Globalization on Environmental Degradation in OECD Countries
- A Compliance Return Method to Evaluate Different Approaches to Implementing Regulations: The Example of Food Hygiene Standards
- Panel Technical Efficiency of Korean Companies in the Energy Sector based on Digital Capabilities
- Time-varying Investment Dynamics in the USA
- Preferences, Institutions, and Policy Makers: The Case of the New Institutionalization of Science, Technology, and Innovation Governance in Colombia
- The Impact of Geographic Factors on Credit Risk: A Study of Chinese Commercial Banks
- The Heterogeneous Effect and Transmission Paths of Air Pollution on Housing Prices: Evidence from 30 Large- and Medium-Sized Cities in China
- Analysis of Demographic Variables Affecting Digital Citizenship in Turkey
- Green Finance, Environmental Regulations, and Green Technologies in China: Implications for Achieving Green Economic Recovery
- Coupled and Coordinated Development of Economic Growth and Green Sustainability in a Manufacturing Enterprise under the Context of Dual Carbon Goals: Carbon Peaking and Carbon Neutrality
- Revealing the New Nexus in Urban Unemployment Dynamics: The Relationship between Institutional Variables and Long-Term Unemployment in Colombia
- The Roles of the Terms of Trade and the Real Exchange Rate in the Current Account Balance
- Cleaner Production: Analysis of the Role and Path of Green Finance in Controlling Agricultural Nonpoint Source Pollution
- The Research on the Impact of Regional Trade Network Relationships on Value Chain Resilience in China’s Service Industry
- Social Support and Suicidal Ideation among Children of Cross-Border Married Couples
- Asymmetrical Monetary Relations and Involuntary Unemployment in a General Equilibrium Model
- Job Crafting among Airport Security: The Role of Organizational Support, Work Engagement and Social Courage
- Does the Adjustment of Industrial Structure Restrain the Income Gap between Urban and Rural Areas
- Optimizing Emergency Logistics Centre Locations: A Multi-Objective Robust Model
- Geopolitical Risks and Stock Market Volatility in the SAARC Region
- Trade Globalization, Overseas Investment, and Tax Revenue Growth in Sub-Saharan Africa
- Can Government Expenditure Improve the Efficiency of Institutional Elderly-Care Service? – Take Wuhan as an Example
- Media Tone and Earnings Management before the Earnings Announcement: Evidence from China
- Review Articles
- Economic Growth in the Age of Ubiquitous Threats: How Global Risks are Reshaping Growth Theory
- Efficiency Measurement in Healthcare: The Foundations, Variables, and Models – A Narrative Literature Review
- Rethinking the Theoretical Foundation of Economics I: The Multilevel Paradigm
- Financial Literacy as Part of Empowerment Education for Later Life: A Spectrum of Perspectives, Challenges and Implications for Individuals, Educators and Policymakers in the Modern Digital Economy
- Special Issue: Economic Implications of Management and Entrepreneurship - Part II
- Ethnic Entrepreneurship: A Qualitative Study on Entrepreneurial Tendency of Meskhetian Turks Living in the USA in the Context of the Interactive Model
- Bridging Brand Parity with Insights Regarding Consumer Behavior
- The Effect of Green Human Resources Management Practices on Corporate Sustainability from the Perspective of Employees
- Special Issue: Shapes of Performance Evaluation in Economics and Management Decision - Part II
- High-Quality Development of Sports Competition Performance Industry in Chengdu-Chongqing Region Based on Performance Evaluation Theory
- Analysis of Multi-Factor Dynamic Coupling and Government Intervention Level for Urbanization in China: Evidence from the Yangtze River Economic Belt
- The Impact of Environmental Regulation on Technological Innovation of Enterprises: Based on Empirical Evidences of the Implementation of Pollution Charges in China
- Environmental Social Responsibility, Local Environmental Protection Strategy, and Corporate Financial Performance – Empirical Evidence from Heavy Pollution Industry
- The Relationship Between Stock Performance and Money Supply Based on VAR Model in the Context of E-commerce
- A Novel Approach for the Assessment of Logistics Performance Index of EU Countries
- The Decision Behaviour Evaluation of Interrelationships among Personality, Transformational Leadership, Leadership Self-Efficacy, and Commitment for E-Commerce Administrative Managers
- Role of Cultural Factors on Entrepreneurship Across the Diverse Economic Stages: Insights from GEM and GLOBE Data
- Performance Evaluation of Economic Relocation Effect for Environmental Non-Governmental Organizations: Evidence from China
- Functional Analysis of English Carriers and Related Resources of Cultural Communication in Internet Media
- The Influences of Multi-Level Environmental Regulations on Firm Performance in China
- Exploring the Ethnic Cultural Integration Path of Immigrant Communities Based on Ethnic Inter-Embedding
- Analysis of a New Model of Economic Growth in Renewable Energy for Green Computing
- An Empirical Examination of Aging’s Ramifications on Large-scale Agriculture: China’s Perspective
- The Impact of Firm Digital Transformation on Environmental, Social, and Governance Performance: Evidence from China
- Accounting Comparability and Labor Productivity: Evidence from China’s A-Share Listed Firms
- An Empirical Study on the Impact of Tariff Reduction on China’s Textile Industry under the Background of RCEP
- Top Executives’ Overseas Background on Corporate Green Innovation Output: The Mediating Role of Risk Preference
- Neutrosophic Inventory Management: A Cost-Effective Approach
- Mechanism Analysis and Response of Digital Financial Inclusion to Labor Economy based on ANN and Contribution Analysis
- Asset Pricing and Portfolio Investment Management Using Machine Learning: Research Trend Analysis Using Scientometrics
- User-centric Smart City Services for People with Disabilities and the Elderly: A UN SDG Framework Approach
- Research on the Problems and Institutional Optimization Strategies of Rural Collective Economic Organization Governance
- The Impact of the Global Minimum Tax Reform on China and Its Countermeasures
- Sustainable Development of Low-Carbon Supply Chain Economy based on the Internet of Things and Environmental Responsibility
- Measurement of Higher Education Competitiveness Level and Regional Disparities in China from the Perspective of Sustainable Development
- Payment Clearing and Regional Economy Development Based on Panel Data of Sichuan Province
- Coordinated Regional Economic Development: A Study of the Relationship Between Regional Policies and Business Performance
- A Novel Perspective on Prioritizing Investment Projects under Future Uncertainty: Integrating Robustness Analysis with the Net Present Value Model
- Research on Measurement of Manufacturing Industry Chain Resilience Based on Index Contribution Model Driven by Digital Economy
- Special Issue: AEEFI 2023
- Portfolio Allocation, Risk Aversion, and Digital Literacy Among the European Elderly
- Exploring the Heterogeneous Impact of Trade Agreements on Trade: Depth Matters
- Import, Productivity, and Export Performances
- Government Expenditure, Education, and Productivity in the European Union: Effects on Economic Growth
- Replication Study
- Carbon Taxes and CO2 Emissions: A Replication of Andersson (American Economic Journal: Economic Policy, 2019)