Environmental Social Responsibility, Local Environmental Protection Strategy, and Corporate Financial Performance – Empirical Evidence from Heavy Pollution Industry
-
 ,
,

Abstract
This article empirically examines the “responsibility-performance” interaction in the process of environmental social responsibility decision-making by enterprises, using the listed companies in the heavy pollution industry as the research sample. We also use the evolutionary game theory to construct a system dynamics model for simulation analysis to explore the evolutionary qualities of the environmental responsibility behavior of heavily polluting enterprises and its relationship with financial performance under the influence of local government environmental regulation. It finds that for environmental social responsibility, a company's expected performance surplus is more likely to promote positive interaction between responsibility and performance than a gap; for regions with relatively negative environmental strategies, environmental social responsibility provides more efficient reputation transformation and motivates companies to invest in it; more competitive industries and enterprises with forward-looking environmental strategies tend to put performance feedback into the undertaking of environmental social responsibility. Therefore, the government and regulatory authorities should urge heavy polluting enterprises to implement environmental responsibility, so that they can fully realize that emission reduction and growth can be achieved at the same time and promote the financial performance of enterprises and environmental responsibility while forming a win–win situation at the ecological level and corporate social level.
1 Introduction
Since the twenty-first century, with the continuous improvement of people's living standards, ecological and environmental issues have become a major concern, and for the first time, China's social and economic development is facing the double constraints of emission reduction and growth. China's environmental pollution problem and ecological civilization construction have reached an unprecedented height, and the relevant construction advice has now been incorporated into the overall layout of the “five-in-one” socialist cause with Chinese characteristics. Enterprises, as micro subjects of the market economy, are important landing points of the overall layout of ecological civilization construction. While fully understanding the importance and urgency of ecological civilization construction, proactively carrying out environmental protection, implementing forward-looking environmental strategies, increasing environmental protection investment, carrying out green innovation and other environmental social responsibility behaviors are important measures for enterprises to respond to national policies and implement environmental strategies. However, the core goal of enterprises is to pursue profit maximization and steadily improve the value of enterprises. As a consumptive behavior, environmental social responsibility will increase the operating cost of enterprises and the uncertainty of future development. Then, can enterprises obtain stable financial performance compensation when they undertake environmental social responsibility? Can environmental social responsibility and corporate financial performance interact well? Is environmental social responsibility a positive “strategic innovation tool” or a selective “cover-up tool” for enterprises? The resolution of the above-mentioned issues is directly related to the initiative, effectiveness, and sustainability of the implementation of enterprise environmental strategies. This article will solve the above problems based on the following two aspects of work: first, empirically test whether expected performance feedback (EPF), the antecedent variable of environmental social responsibility, has a clear promoting effect on enterprises' undertaking environmental social responsibility and whether enterprises can get financial performance feedback in the lagging business cycle of undertaking environmental social responsibility? On the other hand, it is empirically examined whether the local government's environmental protection strategy and corporate social responsibility undertaking, as an important tool based on external market incentive-based and internal autonomous incentive-based, respectively, can realize the synergistic effect of incentives in the implementation process? How do they contribute to the realization of the positive interaction between environmental social responsibility and corporate financial performance?
The contributions of this article are mainly reflected in the following four aspects: first, in combination with the background of double constraints of emission reduction and growth, the relationship between corporate environmental social responsibility and EPF is explored pertinently, and the role and characteristics of environmental responsibility in corporate social responsibility research are further explained while enriching the research on social responsibility related scenarios; second, by investigating the cross period interaction between corporate environmental responsibility and EPF, we further deepen the understanding of the relationship between them and strive to obtain the theoretical support and empirical evidence of the enterprise internal circulation system of “expected performance feedback – environmental social responsibility – enterprise financial performance – expected performance feedback,” which helps to promote the development model of mutual promotion between environmental responsibility and financial performance, improve the feasibility of environmental protection policies of regulatory departments, and provide micro theoretical support for corresponding policy formulation; third, on the basis of the previous research on the relationship between the two, and to further enrich the research on the regulation mechanism, this article examines the regulatory role of local government environmental protection strategies (environmental protection attitudes, environmental regulation intensity), industry competitiveness, enterprise forward-looking environmental strategies, and the nature of property rights in the interactive intertemporal impact between corporate environmental responsibility and financial performance. It has certain practical and policy implications for the internal managers and external regulators of enterprises to realize the development mode of mutual promotion between enterprises' environmental responsibility and financial performance.
2 Literature Review and Theoretical Analysis
2.1 Environmental Social Responsibility and Corporate Financial Performance
The environmental social responsibility strategy of enterprises refers to a strategic choice that enterprises follow the requirements of government regulation or actively undertake social responsibility to protect the natural environment to reduce the adverse impact of enterprises' activities on the natural environment. In recent years, many enterprises have taken the initiative to assume environmental social responsibility in the process of operation and realized positive feedback on financial performance. Its internal transmission mechanism mainly involves the following aspects: (1) the assumption of environmental responsibility has a signal transmission mechanism. There is information asymmetry between enterprises and stakeholders. Enterprises' undertaking environmental social responsibility is a kind of continuous altruistic behavior. Compared with social responsibility activities such as charitable donations and the provision of jobs, it better reflects the consistency of corporate social responsibility, wins the trust and support of various stakeholders (Li et al., 2022b; Zhou et al., 2018), reduces the difficulty of raising resources, and lowers the cost of capital (Zhang & Wu, 2017); (2) undertaking environmental responsibility can help enterprises gain legitimacy. Undertaking environmental social responsibility by enterprises is an important response path to the government's environmental regulation, and it is also conducive to gaining the recognition and support of all stakeholders in the horizontal competition. It has become an important strategic resource of enterprises, helping enterprises to improve transaction efficiency, reduce transaction costs, and gain competitive advantages (Blackman, 2012; Osintsev & Khalilian, 2023; Zimmerman & Zeitz, 2002); (3) undertaking environmental responsibility by enterprises is a process of “strengthening internal strength” and an important way to achieve sustainable development strategy. Through the improvement of existing production techniques and equipment in the process of undertaking environmental responsibility, it is beneficial to save energy, turn waste into profit (Xu & Li, 2019), reduce the legal litigation risk of enterprises, improve brand reputation, expand production and sales, and finally improve the financial performance of enterprises (Imeni & Edalatpanah, 2023; Li, 2016; Tian et al., 2016; Xu & Hou, 2019).
The positive impact of corporate environmental responsibility on financial performance tends to have a certain lag in terms of the transmission process by which responsibility affects performance. The reasons for this involve two aspects: first, because the real market is not perfect, many irrational factors can make it difficult for various stakeholders to have timely and complete information related to the environmental responsibility of the company (Kunieda & Nishimura, 2019), and the information takes some time in the process of transmission and identification; on the other hand, both the establishment of green word of mouth and reputation, or the development and introduction of green technologies need to go through a certain process and spend a certain cost. Therefore, the impact of corporate environmental responsibility on financial performance feedback often has a certain lag.
Financial performance is an important indicator to backfeed the operating cash flow of an enterprise. Good performance acquisition ability means that an enterprise can expect stable cash flow and greater future development space. The theoretical support of financial performance for social responsibility mainly comes from the capital supply hypothesis. Good performance acquisition ability is the financial basis for enterprises to undertake social responsibility. Therefore, enterprises must have sufficient financial strength to undertake social responsibility on the basis of meeting their normal operation and development (Preston & O’Bannon, 1997). It is hard to imagine that a company struggling to maintain normal operations would be able to afford social responsibilities such as supporting the development of industry innovation, improving the community environment, enhancing employee welfare, and actively making charitable donations, not to mention environmental social responsibilities that are capital intensive, long-lasting, and may have technological spillover effects. Therefore, from the decision-making level, the feedback level of the expected performance of the enterprise as an antecedent motive will play an important role in the behavior of the enterprise in fulfilling the environmental social responsibility, and it is also an important decision-making reference for managers to carry out the environmental social responsibility undertaking.
To sum up, the following research assumptions are proposed in this article:
H1a: Environmental social responsibility can promote the improvement of enterprise financial performance.
H1b: Good financial performance can positively influence the EPF of enterprises, which in turn promotes the level of corporate environmental social responsibility. The above effects may have a lag, and the relationship between the two shows a cross-period mutual reinforcement effect.
2.2 Influence Mechanism of EPF
EPF is an important factor affecting the strategic decisions of enterprises. In a business cycle, when the actual financial performance of an enterprise is lower than the expected performance, the gap feedback of the expected performance will be generated. When the actual financial performance is higher than the expected performance, we call it the expected performance surplus feedback here. The conclusions of previous studies on the relationship between EPF and corporate social responsibility decision-making are relatively complex, and the research on the relationship between them also has inconsistent conclusions. One type of research shows that when there is a gap in performance expectation feedback, enterprise decision-makers will show higher risk tolerance and tend to respond to performance problems by adjusting enterprise strategies, such as increasing enterprises' investment in certain risk strategies (Shinkle, 2012). Another type of research believes that the behavior of the gap enterprises will be relatively conservative, and they tend to reduce the strategic investment of enterprises in order to avoid uncertain risk losses. The threat rigidity hypothesis also provides theoretical support for this kind of phenomenon. The performance expectation gap can be interpreted here as an organizational threat, which will cause psychological pressure and anxiety in decision-makers, and the business behavior of enterprises at this time will be relatively conservative (Duanmu et al., 2018; He et al., 2017; Staw et al., 1981).
On the other hand, when the expected performance of an enterprise has a surplus, it indicates that the current operating level of the enterprise exceeds the expectation and often shows a high level of social responsibility. The reason is that under the framework of the capital supply hypothesis, enterprises must have sufficient capital strength to undertake social responsibility based on meeting their normal operation and development (Preston & O’Bannon, 1997). Good business performance makes enterprises have stronger capital capacity to undertake social responsibility. More importantly, enterprises with good performance will often receive the attention of competitors in the same industry and government regulators, and bear greater public opinion pressure and social supervision. Empirical evidence shows that many leading enterprises rushed into the hot search due to their negative performance in social responsibility, resulting in a decline in enterprise valuation: for example, Vanke during the Wenchuan earthquake, because the donation of 2.2 million yuan was far below the expectations of the industry and the public, resulting in a short-term sell-off of its shares by investors and a drop of nearly 10% in two trading days. During the period of COVID-19, after Xiaomi donated only 300000 yuan of medical protective materials for the first time, its donation behavior was widely questioned on social platforms such as WeChat and Zhihu. To alleviate negative public opinion, Xiaomi made an additional donation of 10 million yuan.
Based on the analysis of the two situations of EPF, gap, and surplus, this article makes the following assumptions about the influence mechanism of EPF:
H2: When there is a gap in the expected performance of enterprises, it will encourage decision-makers to “burn the boat,” which is manifested in that the commitment to environmental social responsibility is at a high level, and the feedback of expected performance is negatively related to the commitment of environmental social responsibility. At the same time, the expected performance gap has a positive regulatory effect on the responsibility–performance relationship.
H3: When the enterprise has a surplus of expected performance, the decision-maker will take the initiative to assume social responsibility due to external pressure, which shows that the commitment to environmental social responsibility is at a high level, and the feedback of expected performance is positively related to the commitment of environmental social responsibility. At the same time, the expected performance surplus has a positive regulatory effect on the responsibility – performance relationship.
2.3 Adjustment Mechanism of Local Environmental Protection Strategies
The externality theory of environmental economics holds that in environmental governance, enterprises, as passive subjects, need the government to formulate environmental policies, integrate economic constraints or value constraints into the organizational structure and business activities of enterprises, change the motivation and decision preference of enterprises to engage in certain behaviors (such as environmental violations or environmental pollution behaviors), and ultimately maintain the consistency between enterprises and external systems to achieve the goal of improving the environment. Some scholars have incorporated social responsibility into the framework of institutional theory and found that economic level and corporate social responsibility behavior will be regulated by policies (John, 2007). Environmental policies will affect the performance of environmental social responsibility by enterprises and the investment of enterprises in environmental social responsibility (Li et al., 2011). In the relevant research on the absence of traditional social responsibility, scholars found that only through government environmental regulation can enterprises fulfill their social responsibility and achieve the effect of reducing resource waste and environmental pollution (Lin et al., 2007; Wei & Hu, 2021).
With the continuous strengthening of the concept of sustainable development, the consumer market, investment market, and government departments have also strengthened their supervision and support for enterprise environmental governance. The more active environmental protection strategy of the government is manifested in the continuous promotion of environmental protection concept and higher local environmental regulation levels. The above changes are conducive to the formation of good subjective initiatives of enterprises in the region in environmental protection. To enable enterprises to invest resources in the construction of environmental social responsibility to a greater extent and achieve strong support for local government environmental protection policies. The two-way interaction between the government and enterprises on environmental protection strategies has also become an internal and external incentive tool, creating the possibility for enterprises undertaking environmental social responsibility to obtain good economic benefits.
H4: Local governments' environmental strategies (environmental attitudes and regulations) have a positive moderating effect on enterprises' “performance–responsibility” relationship.
Other studies have shown that the government's high-intensity environmental regulation will increase the operating costs of enterprises, thereby inhibiting the technological innovation of enterprises (Conrad & Wastl, 1995; Greenstone et al., 2012). At the same time, it may also add new constraints to the production decisions of enterprises, resulting in increased difficulties in management, production, and sales, resulting in the decline of total factor productivity of enterprises (Christiansen & Haveman, 1981; Gray & Shadbegian, 1993). Therefore, the excessively high environmental protection requirements of local governments will make some enterprises tired of coping, and weaken enterprises' commitment to invest more funds in social responsibility to a certain extent, especially for the environmental social responsibility with a long investment cycle and large capital consumption, its inhibitory effect on technological innovation may also weaken the level of commitment to environmental social responsibility. Based on the above, we propose another hypothesis:
H5: Local governments' environmental strategies (environmental attitudes and regulations) have a negative moderating effect on enterprises' “performance–responsibility” relationship.
2.4 Other Adjustment Mechanisms of the Internal and External Environment of Enterprises
In examining the impact of EPF on environmental social responsibility, enterprises are affected by the competitive degree of their industry and will choose whether or not to enhance their competitive advantage by assuming environmental responsibility; enterprises that implement forward-looking environmental strategies to control environmental pollution are more willing to take the initiative to assume environmental responsibility (Zhang et al., 2020). Therefore, in addition to local environmental protection strategies, this article also pays attention to adjustment variables such as industry competitiveness, the forward-looking environmental strategy of enterprises, and the ownership nature of enterprises, which have been widely concerned in previous studies on social responsibility-related scenarios. In examining the impact of environmental social responsibility on financial performance, we take EPF as a regulating variable, and pay attention to the impact of the nature of enterprise ownership on the relationship between the two, to deeply explore the internal and external impact mechanisms of the two paths of “performance–responsibility” and “responsibility–performance.”
Based on the above assumptions, this article proposes the following impact mechanism diagram (Figure 1) and verifies it separately in the following text.
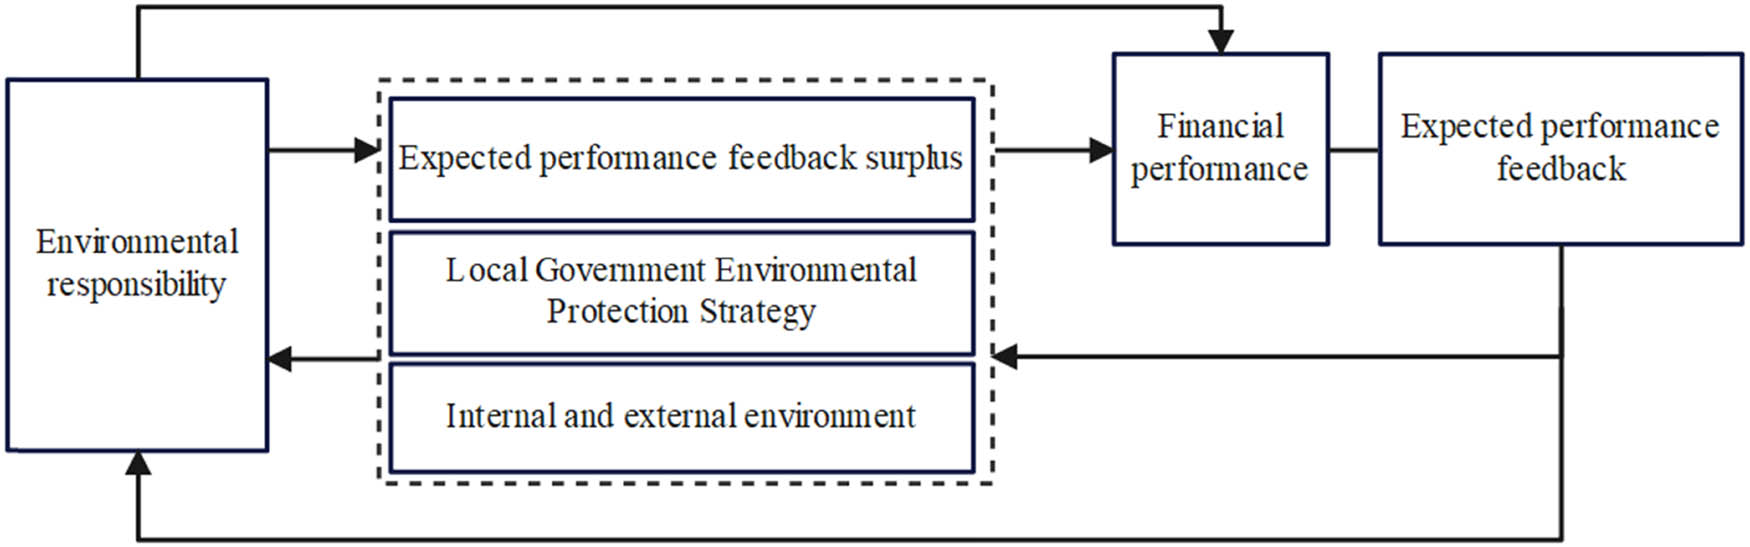
The interactive impact mechanism between corporate environmental responsibility and financial performance.
3 Research Design
3.1 Variable Definition
3.1.1 EPF
In the past, most scholars chose the net profit rate of total assets or the annual return on net assets as the proxy index when studying financial performance. Referring to the practice of Wu and Yuan (2020), this article adopts a more perceptible operating profit margin as the proxy variable of enterprise financial performance. According to the enterprise behavior theory and performance feedback theory, bounded rational decision-makers will set “satisfaction points” in advance rather than “maximum profit goals.” They regard the difference between actual performance and expected goals as an important indicator for enterprises to measure their own “good” and “bad” performance, and also a key factor affecting decision-making. Expectations can be divided into historical expectations and industry expectations. The former is compared with the previous performance of enterprises, and the latter is compared with the performance level of peers. Expected performance is a comprehensive index set based on the linear combination of the past historical performance of the enterprise and the expected performance of the industry. The calculation formula is as follows:
where SA it–1 is the average of the actual performance of all enterprises except the enterprise itself in the industry where the enterprise i is located in the t − 1 year; HA it−1 represents the historical expected performance of enterprise i in the t − 1 year, which is the actual performance measurement of enterprise i in the t − 1 year and α 1 represents the weight. Referring to the study of Wang et al. (2014), this study reports the regression results of α 1 equal to 0.5. When the EPF (P it –A it ) is greater than 0, that is, when the actual performance P it is greater than the expected performance A it , it is called the expected performance surplus. When the EPF (P it –A it ) is less than 0, that is, when the actual performance P it is less than the expected performance A it , it is called the expected performance gap.
3.1.2 Environmental Social Responsibility (CER)
This article uses the practices of Shen and Zhou (2017) and Zhang et al. (2019b) for reference and adopts the operating income pollution discharge rate as the proxy indicator of corporate environmental social responsibility. The reasons are as follows: first, the collection of pollutant discharge fees is intended to remind enterprises to reduce ecological damage and promote technological upgrading and environmental management within enterprises to reduce pollutant discharge, which is also a process of actively assuming environmental social responsibility. Second, the collection standard of sewage charges is divided according to the discharge of various types of pollutants, which can comprehensively reflect the overall sewage discharge situation of enterprises, and is comprehensive and scientific. Third, the sewage charge data are disclosed in the annual report details of each company, which can ensure the availability of data and the integrity of the overall sample. At the same time, this indicator is a reverse indicator. The smaller the value, the less the pollutant discharge fee the enterprise needs to pay for its operating income, and the higher the enterprise's commitment to environmental responsibility.
3.1.3 Financial Performance (UnEBIT)
In previous studies, most of them used the rate of return on total assets or the rate of return on net assets as the financial performance measurement indicators, ignoring the possible “earnings management noise,” which led to the deviation of their financial indicators from the reality and affected the reliability of the results. To reduce the interference of “earnings management noise” to the regression conclusion, the article selects the EBIT rate of total assets after excluding earnings management as the proxy variable of financial performance indicators. The specific steps are as follows: first, the normal accrued profit margin is estimated based on the Jones model (2); Then, the manipulated accrued profit rate DA is obtained by subtracting the normal accrued profit rate from the actual accrued profit rate, as shown in model (3); finally, through the difference between the EBIT rate of total assets and the accrued profit rate of manipulation, the EBIT rate of total assets excluding earnings management is obtained, as shown in model (4).
where TA represents the accrued profits; Assets means total assets; ΔSales represents the difference between the current year's sales revenue and the previous year's sales revenue; PPE refers to fixed assets such as equipment and plant; DA indicates the manipulated accrued profit margin; EBIT stands for the profit before interest and tax; UnEBIT represents the profit margin before interest and tax of total assets excluding earnings management.
3.1.4 Local Environmental Protection Strategy
In this article, the environmental protection strategy of local governments is represented by both guiding and mandatory indicators, that is, the attitude of local governments towards environmental protection in their jurisdictions and the level of governmental environmental regulation.
3.1.4.1 Environmental Attitude (EA)
In recent years, information extraction from a large number of unstructured texts through computer-aided text analysis (CATA) has become an important text quantitative means for many scholars to measure the environmental strategies and practices of governments and enterprises. This method can effectively make up for the limitations of the questionnaire survey, interview, and other methods, such as strong subjectivity, low response rate, and non-replication. This article refers to the research of Wang et al. (2018) and uses the CATA method to measure the environmental protection policies of local governments. Through the statistics of the proportion of environmental protection words in the reports of the prefecture-level municipal governments of each province, the government's attitude towards the environmental protection work in the jurisdiction is measured, that is, the government's environmental protection guidance strategies faced by enterprises.
3.1.4.2 Environmental Regulation (ER)
Refers to the practice of Ye et al. (2018) and calculates the comprehensive index ER of environmental regulation intensity by calculating the industrial wastewater discharge per unit output value, the industrial SO2 discharge per unit output value, and the industrial smoke and dust discharge per unit output value. The larger the ER, the more pollution emissions, the weaker the environmental regulation intensity. This index is a reverse index. The specific measurement methods of environmental regulation are as follows:
First, the industrial wastewater discharge per unit output value, the industrial SO2 discharge per unit output value, and the industrial smoke and dust discharge per unit output value of each province are standardized, as shown in formula (5).
where UE
ij
is the emission per unit of the output value of pollutant of category j in province i, and
Calculate the weights of each type of pollutant.
where
The composite index of environmental regulation for province i is
3.1.5 Industry Competition (Compete)
In previous studies, the reciprocal of the standard deviation of the profit margin of the main business or the number of enterprises in the same industry was mostly selected as the proxy indicators of industry competition. Compared with the two, the main business profit margin better reflects the degree of monopoly in the product market, so this article uses the inverse of the standard deviation of the main business profit margin to measure the degree of industry competition.
3.1.6 Forward-Looking Environmental Strategy (PES)
The source of this indicator data is highly consistent. Previous studies have judged whether an enterprise adopts a forward-looking environmental strategy by examining whether the enterprise has passed the ISO14001 environmental management system certification. Enterprises that have passed the certification indicate that the enterprise has adopted a forward-looking environmental strategy. The value of this variable is 1. Otherwise, the value is 0.
The definitions and measurement methods of each variable are detailed in Table 1.
Variable definition
| Variable type | Variable name | Variable symbols | Variable metrics |
|---|---|---|---|
| Investigation Variable | EPF | EPF | P it –A it |
| Environmental Social Responsibility | CER | Sewage charges/operating income | |
| Financial Performance | UnEBIT | EBIT margin after excluding earnings management behavior | |
| Regulating Variable | Nature of ownership | OWNER | State-owned or state-controlled enterprises take 1, otherwise take 0 |
| Environmental Protection Attitude | EA | The proportion of environmental protection words frequency in the reports of prefecture-level municipal governments | |
| Industry Competition | Compete | Reciprocal of the standard deviation of the profit margin of the enterprise's main business | |
| Environmental Regulation | ER | Comprehensive Index of Environmental Regulation | |
| Forward-looking Environmental Strategy | PES | ISO14001 certification takes the value of 1, otherwise, it is 0 | |
| Control Variables | Financial leverage | LEV | Total liabilities/total assets |
| Enterprise Growth | Growth | The growth rate of operating revenue | |
| Shareholding Concentration | TOP10 | The shareholding proportion of the top ten shareholders | |
| Board Size | Aboard | Natural logarithm of the number of directors | |
| Proportion of independent directors | IBD | Number of independent directors/total number of directors | |
| Two jobs in one | Duality | When the chairman of the company and the general manager are the same person, it is 1, otherwise it is 0 | |
| Enterprise Age | Age | Add 1 to the year of establishment of the company, and then take the natural logarithm | |
| Redundant Resources | Slack | The average value of current ratio, asset liability ratio and expense income ratio represents the degree of redundant resources of the company | |
| Return on total assets | ROA | Net profit/average total assets | |
| Enterprise Size | Size | Natural logarithm of total assets at the end of the year | |
| Total Assets | Assets | Total assets |
3.2 Descriptive Statistics of Data Sources and Variables
In this article, we select the listed companies in the heavy pollution industry in Shanghai and Shenzhen A-shares class with national key monitoring from 2010 to 2021 in China as the research sample, exclude the listed companies with missing data, and get the unbalanced panel data consisting of 1,271 observations from 203 companies in 12 years. The data of the enterprise's pollutant discharge fee are manually sorted out from the management fee details in the annual report of the enterprise. The data on industrial wastewater discharge, industrial SO2 discharge, and industrial smoke and dust discharge are from the China Urban Statistical Yearbook. Other data are directly or indirectly calculated and obtained through the CSMAR database and the annual report of the enterprise. In order to control the influence of extreme values on the conclusions, the article has been reduced-tailed for all continuous variables at the 1 and 99% quantiles of the sample, in addition to standardization in order to eliminate the influence of the differences in magnitude between the variables. The descriptive statistical results of each variable are shown in Table 2.
Descriptive statistics of variables
| Variable name | Mean | Standard deviation | Minimum | Maximum |
|---|---|---|---|---|
| EPF | 0.0151 | 0.2576 | −3.6829 | 4.1075 |
| UnEBIT | 0.0803 | 0.4246 | −1.6998 | 10.0887 |
| CER | 0.0018 | 0.0031 | −0.0016 | 0.0360 |
| OWNER | 0.7214 | 0.4485 | 0 | 1 |
| EA | 0.0036 | 0.0008 | 0.0014 | 0.0063 |
| ER | 0.7639 | 0.6232 | 0 | 2.5853 |
| Compete | 12.2570 | 6.8972 | 0.1714 | 70.4886 |
| Assets | 1.9677 × 10¹⁰ | 3.6710 × 10¹⁰ | 2.1755 × 10⁸ | 2.9135 × 10¹¹ |
| ROA | 0.0274 | 0.1175 | −0.7652 | 2.6772 |
| LEV | 0.5596 | 0.2482 | 0.0156 | 4.1137 |
| Growth | 1.1163 | 21.2804 | −0.9673 | 665.5401 |
| IBD | 0.3692 | 0.0526 | 0.2500 | 0.6000 |
| Size | 22.7824 | 1.3350 | 19.1979 | 26.3978 |
| TOP10 | 54.7677 | 15.8418 | 15.1000 | 93.4100 |
| Duality | 0.1668 | 0.3729 | 0 | 1 |
| Aboard | 2.2063 | 0.2082 | 1.3863 | 2.8904 |
| Slack | 0.6871 | 0.8207 | 0.2789 | 23.0155 |
| Age | 2.8961 | 0.2638 | 1.6094 | 3.7377 |
3.3 Model Setting
In order to test the interaction between “responsibility – performance,” this article builds model (8) and model (9) based on the research of Lioui and Sharma (2012) and Zhang et al. (2019a). Among them, UnEBIT represents the financial performance of the enterprise, CER represents the environmental social responsibility of the enterprise, and EPF represents the EPF. Controls i,t represents the set of control variables that affect financial performance and corporate environmental social responsibility. The specific model is as follows:
where subscripts i and t represent enterprise and time respectively, μ i is the individual fixed effect, and V t is the time fixed effect.
4 Analysis of Empirical Research Results
4.1 Group Test of Environmental Social Responsibility Influencing Factors and Analysis of Relevant Adjustment Mechanism
In the process of empirical research, in order to test the interaction mechanism between environmental social responsibility and corporate financial performance, this article chooses to use EPF as a test variable for influencing corporate environmental social responsibility, which is a better reflection of the impact of the degree of performance change on environmental social responsibility than financial performance. From the regression results in Tables 3 and 4, it can be obtained that the regression coefficients of EPF and the environmental social responsibility considering the lagged period are negatively significant, and environmental social responsibility is an inverse indicator, so a good level of EPF of enterprises can promote the assumption of environmental social responsibility, which supports H1b. Since the use of the cross-term adjustment mechanism test has largely limited the inspection of control variables, this article uses grouping regression to empirically analyze the possible relevant adjustment mechanism between the two, while reserving the possibility of further refining the control variables to investigate the relevant influencing factors of environmental social responsibility.
Regression results
| Variable | Full sample regression | EPF | Environmental protection attitude | Environmental regulation | |||
|---|---|---|---|---|---|---|---|
| Expected performance surplus | Expected performance gap | Positive | Negative | Strong | Weak | ||
| CER | CER | CER | CER | CER | CER | CER | |
| EPF t−1 | −0.0478* | −0.1204** | −0.0539 | −0.0068 | −0.1619*** | 0.0030 | −0.0635* |
| (0.0267) | (0.0545) | (0.0373) | (0.0328) | (0.0416) | (0.0446) | (0.0368) | |
| Growth | −0.9684** | 0.3976 | −0.9833** | −2.9490*** | −0.5270 | −1.3241 | −0.8087 |
| (0.4348) | (1.2470) | (0.4179) | (1.1035) | (0.4038) | (1.0495) | (0.4946) | |
| ROA | 0.0032 | 0.0871 | 0.0072 | −0.0517 | 0.0042 | 0.0272 | 0.0076 |
| (0.0190) | (0.0640) | (0.0190) | (0.0433) | (0.0197) | (0.0347) | (0.0245) | |
| Aboard | −0.0165 | −0.0130 | −0.0504 | 0.0069 | −0.0496 | −0.0789 | 0.0351 |
| (0.0447) | (0.1021) | (0.0480) | (0.0582) | (0.0689) | (0.0683) | (0.0672) | |
| Duality | −0.0178 | 0.2244 | −0.0292 | −0.0008 | −0.1148 | 0.0182 | −0.0730 |
| (0.0765) | (0.1864) | (0.0799) | (0.1131) | (0.1029) | (0.1168) | (0.1063) | |
| Slack | 0.0347* | 0.2451** | 0.0211 | 0.0205 | 0.2280* | 0.4632*** | 0.0205 |
| (0.0209) | (0.1219) | (0.0186) | (0.0201) | (0.1199) | (0.1190) | (0.0218) | |
| Age | −0.1463 | −0.8379* | 0.2117 | −0.1313 | −0.3714 | −0.1805 | 0.0950 |
| (0.1701) | (0.4343) | (0.1746) | (0.2161) | (0.2614) | (0.2211) | (0.2895) | |
| IBD | −0.0009 | 0.0923 | −0.0299 | −0.0189 | −0.0204 | −0.0153 | −0.0140 |
| (0.0317) | (0.0835) | (0.0313) | (0.0391) | (0.0463) | (0.0482) | (0.0453) | |
| cons | −0.0960 | −0.5074 | 0.1137 | −0.2088 | −0.1595 | −0.1846 | 0.1784 |
| (0.1415) | (0.3416) | (0.1503) | (0.2074) | (0.1890) | (0.2074) | (0.2181) | |
| N | 995 | 409 | 586 | 529 | 466 | 497 | 498 |
| r2 | 0.0654 | 0.1252 | 0.1172 | 0.0833 | 0.1885 | 0.1386 | 0.0888 |
| Individual effect | Yes | Yes | Yes | Yes | Yes | Yes | Yes |
| Year effect | Yes | Yes | Yes | Yes | Yes | Yes | Yes |
Note: standard error is in parentheses; *, **, *** are significant at 10, 5, and 1% levels, respectively.
Results of internal and external factors of the company to moderate financial performance affecting corporate environmental responsibility
| Variable | Industry competition | Environmental strategy | Nature of ownership | |||
|---|---|---|---|---|---|---|
| Strong | Weak | Forward looking | Non-forward-looking | State-owned enterprise | Non-state-owned enterprises | |
| CER | CER | CER | CER | CER | CER | |
| EPF t−1 | −0.0678** | −0.0783 | −0.1633*** | −0.0268 | 0.0143 | −0.0688 |
| (0.0338) | (0.0543) | (0.0535) | (0.0363) | (0.0342) | (0.0517) | |
| Growth | −4.1299*** | −0.5193 | −3.9267*** | −0.7598 | −0.9096** | 0.2171 |
| (1.2255) | (0.5085) | (1.4806) | (0.4852) | (0.4233) | (1.3884) | |
| ROA | 0.0128 | −0.0249 | 0.0795 | 0.0001 | −0.0787** | 0.0297 |
| (0.0206) | (0.0510) | (0.0751) | (0.0228) | (0.0381) | (0.0289) | |
| Aboard | 0.0143 | −0.0131 | 0.0564 | −0.0496 | 0.0128 | −0.1110 |
| (0.0623) | (0.0829) | (0.0916) | (0.0595) | (0.0434) | (0.1431) | |
| Duality | −0.0611 | −0.0320 | −0.0460 | −0.0640 | −0.0957 | 0.2834 |
| (0.1173) | (0.1269) | (0.1419) | (0.0975) | (0.0834) | (0.1737) | |
| Slack | 0.0231 | 0.0837 | 0.1924 | 0.0322 | 0.0192 | 0.4739*** |
| (0.0242) | (0.0533) | (0.2154) | (0.0223) | (0.0185) | (0.1641) | |
| Age | −0.5067 | 0.1045 | −0.5002 | −0.0568 | −0.1182 | −0.2761 |
| (0.3107) | (0.2363) | (0.3891) | (0.2128) | (0.1767) | (0.4191) | |
| IBD | 0.0280 | −0.0107 | −0.0268 | −0.0120 | −0.0117 | 0.0271 |
| (0.0457) | (0.0522) | (0.0731) | (0.0395) | (0.0330) | (0.0857) | |
| cons | −0.4883** | 0.1184 | −0.5004 | −0.0398 | −0.0612 | −0.3402 |
| (0.2371) | (0.2098) | (0.3389) | (0.1737) | (0.1392) | (0.4054) | |
| N | 526 | 469 | 269 | 726 | 718 | 273 |
| r2 | 0.0790 | 0.1049 | 0.1261 | 0.0825 | 0.0809 | 0.1314 |
| Individual effect | Yes | Yes | Yes | Yes | Yes | Yes |
| Year effect | Yes | Yes | Yes | Yes | Yes | Yes |
Note: standard error is in parentheses, *, **, *** are significant at 10, 5, and 1% levels respectively.
This article groups EPF, local environmental protection strategies (environmental protection attitudes, environmental regulations), and industrial competitiveness based on the median sample. EPF is divided into expected performance surplus and expected performance gap groups according to whether it is greater than or equal to 0 and less than 0. The aim is to further examine the impact of enterprises being in a performance surplus or deficit state on the level of corporate environmental social responsibility based on the benchmark regression. The property right nature and the enterprise environment strategy adopt 0–1 grouping. The regression results show that the regression coefficient of the expected performance surplus is negative. Considering that environmental social responsibility is a reverse indicator, it shows that the expected performance surplus can promote the environmental social responsibility of enterprises. Hypothesis 3 has been verified, which is different from the conclusions of existing studies. Studies including Shinkle (2012), Wu and Yuan (2020) suggest that enterprises are often more inclined to respond to the doubts of stakeholders about performance by adjusting their development strategies when facing the drop in performance expectations, such as increasing the investment of enterprises in certain risk strategies. However, its research samples mainly examine the overall level of corporate social responsibility. This study discusses the environmental social responsibility of enterprises, which is fundamentally different from small, short-term, one-time investments such as charitable donation responsibility, social employment responsibility, and information disclosure responsibility. Environmental social responsibility is a continuous investment that consumes more capital and lasts longer for enterprises. For example, the failure of research and development or the failure of achievement transformation in the process of technology investment in the upgrading of environmental protection equipment, and the sudden change of regulatory standards caused by changes in environmental protection policies will cause enterprises to suffer high sunk costs. Therefore, the sustainable cash flow brought by the expected performance surplus is decisive for the enterprise's commitment to environmental and social responsibility. Decision-makers will not think of change when they are poor because of the short-term business downturn. The ability to obtain good financial performance and the expected performance surplus are the key factors to ensure the level of environmental social responsibility commitment.
In terms of environmental protection strategies of local governments, environmental protection attitudes and environmental regulations have shown a negative regulatory effect on the performance responsibility relationship, and Hypothesis 5 has been verified. Specifically, in areas with more active environmental protection strategies, most enterprises in the jurisdiction respond to the government's call and avoid punishment for undertaking environmental social responsibility, which weakens the marginal contribution of corporate environmental responsibility investment. In areas with relatively negative environmental protection strategies, taking the initiative to assume environmental social responsibility will bring immediate effects to enterprises, which can enable enterprises to quickly establish a good image among local governments, investors, regulatory departments, and other social groups, more efficiently realize the transformation from responsibility to reputation, and make enterprises more willing to actively invest in environmental social responsibility with better financial performance.
In addition, the industry competitiveness in the regression results shows a positive regulatory effect on the relationship between the two. It shows that in the highly competitive industry, enterprises are more willing to make themselves go out of the group through social responsibility and gain the recognition of stakeholders through positive environmental social responsibility investment. The forward-looking environmental strategy of the enterprise has a significant positive regulatory effect on the relationship between them, which is consistent with the research conclusions of many scholars in the past. Enterprises implementing forward-looking environmental strategies will pay more active attention to environmental problems, take environmental protection measures, actively assume environmental responsibilities, and use financial resources for environmental protection to a greater extent (Aragón-Correa & Sharma, 2003; Zhang et al., 2020).
In addition, there is no moderating effect of the nature of property rights on the relationship between the two, and enterprises are bound by national environmental regulations and other uniform policies when they undertake environmental social responsibility, so the nature of property rights has little effect on the relationship between environmental social responsibility and financial performance. According to the regression results of the control variables, the growth of enterprises has a significant positive impact on environmental social responsibility undertaking, which is in line with our conventional expectations and economic logic.
4.2 The Influence of Corporate Environmental Social Responsibility on Financial Performance
Table 5 reports the empirical test results of corporate environmental social responsibility on financial performance considering the lag of one period. The regression results show that corporate environmental social responsibility can promote the improvement of financial performance, which is consistent with previous research conclusions and validates Hypothesis 1a proposed in this article. At the same time, in order to further investigate the regulatory effect of internal and external factors on the promotion of corporate financial performance by environmental social responsibility. This article uses EPF as a moderating variable to conduct group regression, focusing on the impact of EPF on the relationship between environmental social responsibility and corporate financial performance. It can be seen from the results that among the groups with expected performance surplus, the environmental social responsibility that lags for one period has obtained significant regression results, which shows that the surplus performance feedback of enterprises can effectively promote the positive impact of environmental social responsibility on financial performance. Combined with the empirical conclusions in Tables 3 and 4, we can conclude that the benign mutual promotion system of “expected performance feedback – environmental social responsibility – financial performance – expected performance feedback” is achievable. In addition, we also examined the regulatory effect of the nature of property rights on the responsibility–performance relationship. The results show that the relationship can be positively promoted in the group of non-state-owned enterprises. The reason is that compared with state-owned enterprises, non-state-owned enterprises need to improve their social reputation to obtain financing channels and development opportunities. Bearing social responsibility is an important means for them to obtain positive evaluation from stakeholders and obtain development resources. Therefore, non-state-owned enterprises can better improve their financial performance by assuming environmental social responsibility.
Regression results
| Variable | Full sample regression | EPF | Nature of ownership | ||
|---|---|---|---|---|---|
| Expected performance surplus | Expected performance gap | State-owned enterprises | Non-state-owned enterprises | ||
| UnEBIT | UnEBIT | UnEBIT | UnEBIT | UnEBIT | |
| CER t−1 | −0.0855* | −0.0822** | −0.0652 | −0.0638 | −0.0809* |
| (0.0498) | (0.0327) | (0.1137) | (0.0727) | (0.0411) | |
| LEV | 0.0987* | 0.0025 | 0.2305*** | 0.5906*** | 0.0591 |
| (0.0529) | (0.0663) | (0.0792) | (0.0873) | (0.0543) | |
| Size | −0.8042*** | 0.0227 | −1.5555*** | −1.3611*** | −0.4568*** |
| (0.1065) | (0.0856) | (0.1768) | (0.1392) | (0.1379) | |
| TOP10 | 0.2237*** | −0.1051** | 0.5095*** | 0.3435*** | 0.1389** |
| (0.0656) | (0.0492) | (0.1071) | (0.0845) | (0.0667) | |
| ROA | 0.1811*** | 0.1552*** | 0.2801*** | 0.8268*** | 0.0386** |
| (0.0285) | (0.0316) | (0.0452) | (0.0719) | (0.0185) | |
| Age | −0.1031 | −0.1172 | −0.1729 | −0.3887 | 0.1515 |
| (0.2557) | (0.2163) | (0.4085) | (0.3149) | (0.2737) | |
| Aboard | −0.0116 | 0.0955** | −0.0111 | −0.0094 | 0.0614 |
| (0.0554) | (0.0402) | (0.0908) | (0.0647) | (0.0750) | |
| Slack | −0.0246 | −0.0219 | 0.0178 | 0.0198 | −0.0219 |
| (0.0297) | (0.0491) | (0.0413) | (0.0317) | (0.0911) | |
| Assets | 0.2189** | 0.1506 | 0.3389** | 0.2797** | 2.5154*** |
| (0.1105) | (0.1125) | (0.1680) | (0.1200) | (0.4507) | |
| cons | −0.4146** | −0.3006* | −0.4985 | −0.6004** | 0.6072** |
| (0.2093) | (0.1671) | (0.3484) | (0.2493) | (0.2803) | |
| N | 1,054 | 433 | 621 | 762 | 288 |
| r2 | 0.1472 | 0.3411 | 0.2648 | 0.3025 | 0.2381 |
| Individual effect | Yes | Yes | Yes | Yes | Yes |
| Year effect | Yes | Yes | Yes | Yes | Yes |
Note: standard error is in parentheses; *, **, *** are significant at 10, 5, and 1% levels respectively.
In the regression results of the control variables, the return on total assets and financial leverage of the enterprise have a significant promoting effect on the financial performance of the enterprise, which is in line with our conventional expectations. In the regression results, the ownership concentration of enterprises is significantly positively correlated with financial performance as a whole. The reason is that enterprises with high ownership concentration can more centrally reflect the overall objectives of stakeholders, which is conducive to enterprises clarifying the development direction, implementing development strategies, and improving financial performance.
4.3 Robustness Testing
4.3.1 Replace Environmental Responsibility Variables
To verify the robustness of the research conclusion, this article retested the benchmark regression model by replacing the core variable, and the results are shown in Table 6. First, this article draws on the approach of Shan et al. (2021) and selects pollution discharge fees divided by total asset replacement pollution discharge fees divided by operating income as an indicator to measure environmental responsibility. The results show that corporate environmental responsibility can effectively promote the growth of financial performance, and good EPF can further promote corporate environmental responsibility, achieving a positive interaction between environmental responsibility and financial performance. The conclusion is consistent with the previous research.
Regression results
| (1) Replace environmental responsibility variables | (2) Replacing Financial Performance Variables | (3) Replace EPF variables | ||||||
|---|---|---|---|---|---|---|---|---|
| cera | UnEBIT | EBIT1 | CER (
|
CER (
|
||||
| EPF t−1 | −0.0582** | cera t−1 | −0.2130*** | CER t−1 | −0.0841** | epf t−1 | −0.0473* | |
| (0.0254) | (0.0507) | (0.0385) | (0.0282) | |||||
| Growth | −1.1695*** | LEV | 0.0732 | LEV | −0.3575*** | epf1 t−1 | −0.0406* | |
| (0.4137) | (0.0529) | (0.0401) | (0.0211) | |||||
| ROA | 0.0611*** | Size | −0.9035*** | Size | 0.0234 | Growth | −0.9697** | −0.9271** |
| (0.0181) | (0.1086) | (0.0813) | (0.4352) | (0.4332) | ||||
| Aboard | 0.0153 | TOP10 | 0.2144*** | TOP10 | −0.0167 | ROA | 0.0033 | 0.0036 |
| (0.0426) | (0.0650) | (0.0498) | (0.0190) | (0.0190) | ||||
| Duality | 0.0599 | ROA | 0.1852*** | ROA | 0.5646*** | Aboard | −0.0167 | −0.0154 |
| (0.0728) | (0.0283) | (0.0215) | (0.0447) | (0.0447) | ||||
| Slack | 0.0122 | Age | −0.1593 | Age | 0.0166 | Duality | −0.0183 | −0.0144 |
| (0.0199) | (0.2537) | (0.1970) | (0.0765) | (0.0765) | ||||
| Age | −0.0193 | Aboard | −0.0007 | Aboard | 0.0772* | Slack | 0.0348* | 0.0345* |
| (0.1619) | (0.0550) | (0.0425) | (0.0209) | (0.0209) | ||||
| IBD | 0.0086 | Slack | −0.0207 | Slack | −0.1090*** | Age | −0.1476 | −0.1441 |
| (0.0302) | (0.0295) | (0.0224) | (0.1702) | (0.1701) | ||||
| _cons | 0.0578 | Assets | 0.2576** | Assets | 0.0185 | IBD | −0.0010 | −0.0007 |
| (0.1346) | (0.1100) | (0.0931) | (0.0318) | (0.0317) | ||||
| N | 995 | _cons | −0.4412** | _cons | 0.1330 | _cons | −0.0973 | −0.0941 |
| r2 | 0.1017 | (0.2074) | (0.1605) | (0.1415) | (0.1415) | |||
| Individual effect | Yes | N | 1,054 | N | 1,019 | N | 995 | 995 |
| Year effect | Yes | r2 | 0.1615 | r2 | 0.5839 | r2 | 0.0650 | 0.0660 |
| Individual effect | Yes | Individual effect | Yes | Individual effect | Yes | Yes | ||
| Year effect | Yes | Year effect | Yes | Year effect | Yes | Yes | ||
Note: standard error is in parentheses; *, **, *** are significant at 10, 5, and 1% levels, respectively.
4.3.2 Replace Financial Performance Variables
This article selects the total assets before interest and tax profit margin as a replacement variable for corporate financial performance for retesting. The results are shown in Table 6 (2), verifying the positive impact of environmental responsibility on corporate financial performance and once again supporting the previous research conclusions.
4.3.3 Change the Measurement Method of EPF
This article refers to the research by Chen et al. (2018) and changes the calculation method of EPF by changing the assignment of
5 Mechanism Research Based on Evolutionary Game Theory
To further analyze the interactive relationship between environmental social responsibility and the financial performance of enterprises from the perspective of theoretical mechanisms, this article uses evolutionary game theory to explain the reasons why heavily polluting enterprises assume environmental responsibility and how to achieve the promotion of financial performance growth through environmental responsibility. The strategic choice of whether a company should bear environmental responsibility is often based on multiple factors, including the strength of local government environmental regulations, public attention to environmental protection, stakeholder recognition of the company's environmental responsibility, and the comparison of the company's own investment costs and expected benefits. Therefore, the initial strategic choice of a company is not deterministic. The behavior of enterprises based on environmental responsibility and the interaction between various parties is a game process.
Traditional game theory believes that participants are completely rational and make decisions under complete information. This is difficult to achieve in the real economic environment, as there are differences in the competitive environment and social relationships faced by all parties in the market, resulting in asymmetric information initially held by all parties. Information is often transformed into a resource to help the subject gain a competitive advantage. Incomplete information and limited human rationality are objective. Evolutionary game theory abandons the assumption that traditional games require complete rationality with limited rationality and learning ability. Limited rationality does not require players to master complete information. The information of players is gradually accumulated during each game process, and through continuous trial and error and imitation learning of higher yield strategies, strategic choices are made again, ultimately achieving dynamic equilibrium. At present, evolutionary game analysis is mainly used to analyze the causes and influencing factors of social behavior evolution and institutional norms. In previous research on environmental protection of heavily polluting enterprises, many scholars have adopted evolutionary game analysis.
Overall, corporate environmental social responsibility behavior is a multi-party evolutionary game process. This article aims to analyze the environmental responsibility taking strategies of enterprises, considering that the public's attention to environmental protection is increasing in the real environment, and the recognition of stakeholders for corporate environmental responsibility is also gradually increasing. Therefore, it is assumed that the strategic choices of the public and stakeholders to support environmental protection are certain, and we do not include them in the model of evolutionary game. An evolutionary game model was constructed between heavily polluting enterprises and local governments (hereinafter referred to as “governments”), attempting to explore the evolutionary stability strategy of enterprises assuming environmental responsibility and its impact on financial performance under the influence of government environmental regulatory decisions, and to conduct an evolutionary analysis of the relationship mechanism between the two.
5.1 Model Construction
5.1.1 Behavioral Strategy Assumptions and Parameter Definitions
The strategic choices of whether a company should bear environmental responsibility are mainly divided into two types: whether the company should bear environmental responsibility or not. From a practical perspective, not bearing environmental responsibility means that the company prefers economic performance and is unwilling to pay costs that cannot directly promote the increase of economic performance. Therefore, enterprise decision-making can be divided into two types: preference for environmental responsibility and preference for economic performance. The probability of enterprises favoring environmental responsibility is x(0
When a company prefers to take on environmental responsibility, the revenue obtained is R1, and the corresponding cost is C1. As it is a positive social responsibility taking behavior, the government will provide green subsidy B. When a company prefers economic performance, the revenue obtained is R2, and the cost is C2. At this time, the company will be fined F for violating government environmental regulations. The benefits that the government can obtain when enterprises prefer to assume environmental responsibility and prefer economic performance are R3 and R4, respectively. The cost of implementing strict environmental regulations by the government is C3. When the government implements loose environmental regulations, the intensity of environmental regulations is k (0

Decision tree of the game between enterprises and local governments.
This article analyzes the benefits and costs faced by enterprises and governments based on the actual situation, and fully considers the reputation impact of strategy selection when two groups engage in games. Although previous studies have considered the gain and loss of reputation, most of them only add parameters to a single entity under specific strategies. Compared with previous models, this article sets more comprehensive parameters for reputation and is more relevant to actual scenarios.
Benefits Matrix for Heavy Polluters and Local Governments
| Government imposes strict environmental regulations (y) | Government imposes lax environmental regulations (1−y) | |
|---|---|---|
| Companies prefer environmental responsibility (x) | R1 − C1 + B | R1 – C1 + k × B + P1 |
| R3 − C3 − B + P3 | R3 − k × C3 − k × B | |
| Companies prefer economic performance (1 − x) | R2 − C2 − F − P2 | R2 − C2 − k × F |
| R4 − C3 + F − G | R4 − k × C3 + k × F − G − P4 |
5.1.2 Constructing a Benefit Matrix between Heavy Polluters and Local Governments (Table 7)
5.1.3 Establish a Replication Dynamic Equation for Both Parties
5.1.3.1 Construction of Expected Return Function for Enterprises
Here, U x represents the expected return of a company's preference for environmental responsibility, while U 1−x represents the expected return of a company's preference for economic performance.
The average expected return U 1 of the enterprises is:
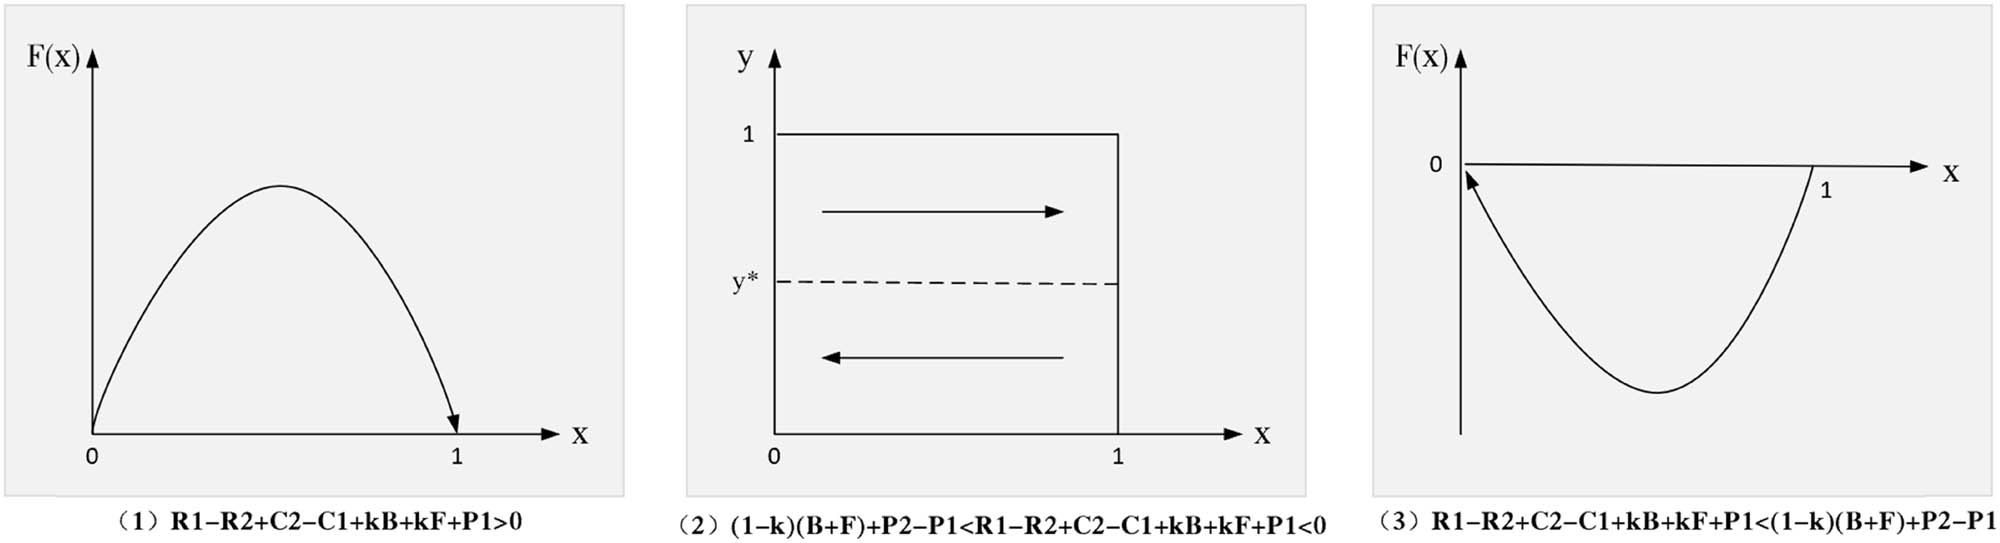
When
When
When 0 <
When
The dynamic evolution path of strategy selection for heavily polluting enterprises is shown in Figure 3.
Phase diagram of enterprise strategy evolution (Visio Self drawn).
5.1.3.2 Construction of the Government’s Expected Return Function
Here, U
y
denotes the expected return to the government for imposing strict environmental regulations, and
The average expected return to the government, U2, is:
When
(1) When
(2) When 0 <
(3) When
The dynamic evolutionary path of the government's strategy choices is shown in Figure 4.

Phase diagram of the evolution of government strategies (Visio self-drawn).
According to the replication dynamic equation, when
5.2 Stability Analysis of Local Equilibrium Points in the System
According to Friedman's analysis method, a Jacobian matrix is constructed by replicating the partial derivatives of the dynamic equation to determine the local stability of the equilibrium point of the evolutionary game system. If the determinant of the Jacobian matrix is greater than 0 and the trace is less than 0, then the replicating dynamic equation has an evolutionary stability strategy (ESS). The Jacobian matrix of the system is:
The determinant det(J) and trace tr(J) of the Jacobian matrix J are:
det(J) = |J|
Substitute five local equilibrium points into the equations of det(J) and tr(J), respectively. The results obtained are shown in Table 8.
Equilibrium point determinant and trace
| Local equilibrium point | det(J) | tr(J) |
|---|---|---|
| (0,0) | (C2 ‒ C1 + R1 ‒ R2 + kB + kF + P1)[(C3 ‒ F)(k ‒ 1) + P4] | C2 ‒ C1 + R1 ‒ R2 + kB + kF + P1 + [(C3 ‒ F)(k ‒ 1) + P4] |
| (0,1) | ‒(C2 ‒ C1 + R1 ‒ R2 + B + F + P2)[(C3 ‒ F)(k ‒ 1) + P4] | C2 ‒ C1 + R1 ‒ R2 + B + F + P2 ‒ [(C3 ‒ F)(k ‒ 1) + P4] |
| (1,0) | ‒(C2 ‒ C1 + R1 ‒ R2 + kB + kF + P1)[(k ‒ 1)(C3 + B) + P3] | ‒(C2 ‒ C1 + R1 ‒ R2 + kB + kF + P1) + [(k ‒ 1)(C3 + B) + P3] |
| (1,1) | (C2 ‒ C1 + R1 ‒ R2 + B + F + P2)[(k ‒ 1)(C3 + B) + P3] | ‒(C2 ‒ C1 + R1 ‒ R2 + B + F + P2) ‒ [(k ‒ 1)(C3 + B) + P3] |
| (x *,y *) |
|
0 |
Analyze the economic meaning of each expression in Table 8 based on parameter settings, and
When
When
When
When
After considering the conditions for local equilibrium points to become evolutionary stable strategies, we continue to determine the stability of each local equilibrium point in different situations through the range of values of x* and y*. The purpose of implementing strict environmental regulations by the government is to actively encourage enterprises to take on environmental social responsibility. In the short term, the investment in environmental responsibility costs cannot directly bring economic benefits to enterprises, but will actually lower their financial performance. The government considers that enterprises may not take on environmental responsibility for this reason, so it encourages enterprises to take on environmental responsibility by providing appropriate green subsidies. Corresponding economic penalties are imposed on enterprises that do not bear environmental responsibility. Therefore, generally speaking, when the government implements strict environmental regulations, most enterprises often face greater economic benefits from bearing environmental responsibility than from not bearing it, as well as potential reputation losses from not assuming. Therefore, they choose to bear environmental responsibility, and the government has also achieved the goal of strict supervision. It can be concluded that
Stability Analysis of Local Equilibrium Points in Different Scenarios
| Scenario | Equalization point | det(J) Symbol | tr(J) Symbol | Equalization result | Phase diagram | |
|---|---|---|---|---|---|---|
| Scenario 1 | 0 < x* < 1; 0 < y* < 1 | (0,0) | <0 | Indefinite | Saddle point | Figure 5(a) |
| (0,1) | <0 | Indefinite | Saddle point | |||
| (1,0) | <0 | Indefinite | Saddle point | |||
| (1,1) | <0 | Indefinite | Saddle point | |||
| (x*, y*) | >0 | 0 | Central point | |||
| Scenario 2 | x* > 1; 0 < y* < 1 | (0,0) | <0 | Indefinite | Saddle point | Figure 5(b) |
| (0,1) | <0 | Indefinite | Saddle point | |||
| (1,0) | >0 | >0 | instability | |||
| (1,1) | >0 | <0 | ESS | |||
| (x*, y*) | <0 | 0 | Saddle point | |||
| Scenario 3 | x* < 0; 0 < y*< 1 | (0,0) | >0 | <0 | ESS | Figure 5(c) |
| (0,1) | >0 | >0 | instability | |||
| (1,0) | <0 | Indefinite | Saddle point | |||
| (1,1) | <0 | Indefinite | Saddle point | |||
| (x*, y*) | <0 | 0 | Saddle point | |||
| Scenario 4 | 0 < x* < 1; y* < 0 | (0,0) | >0 | >0 | instability | Figure 5(d) |
| (0,1) | <0 | Indefinite | Saddle point | |||
| (1,0) | >0 | <0 | ESS | |||
| (1,1) | <0 | Indefinite | Saddle point | |||
| (x*, y*) | <0 | 0 | Saddle point | |||
| Scenario 5 | x* > 1; y* < 0 | (0,0) | >0 | >0 | instability | Figure 5(e) |
| (0,1) | <0 | Indefinite | Saddle point | |||
| (1,0) | <0 | Indefinite | Saddle point | |||
| (1,1) | >0 | <0 | ESS | |||
| (x*, y*) | >0 | 0 | Central point | |||
| Scenario 6 | x* < 0; y* < 0 | (0,0) | <0 | Indefinite | Saddle point | Figure 5(f) |
| (0,1) | >0 | >0 | instability | |||
| (1,0) | >0 | <0 | ESS | |||
| (1,1) | <0 | Indefinite | Saddle point | |||
| (x*, y*) | >0 | 0 | Central point | |||

Evolution phase diagram under different scenarios (represented by (a)–(f), drawn using Visio).
5.3 Simulation Analysis Based on System Dynamics
To further validate the evolutionary stability strategy, this article will use numerical simulation to analyze the evolutionary equilibrium state of the game system. Use Vensim PLE software to dynamically analyze system behavior and construct a system dynamics model between heavily polluting enterprises and local governments, as shown in Figure 6. Before conducting the simulation, external parameters were assigned values. In order to ensure the scientific and accurate simulation results, this study comprehensively referred to Li et al. (2022a) and Zhang et al. (2022) in their research on the setting of parameters such as environmental regulation intensity, cost, benefits, reputation loss, green subsidies, and combined with the actual situation of the study, relevant parameters were assigned values, and simulation analysis was conducted through numerical experiments. The initial conditions for setting the model are INITIAL TIME = 0, FINAL TIME = 10, TIME STEP = 0.03125, Units for Time = Year.
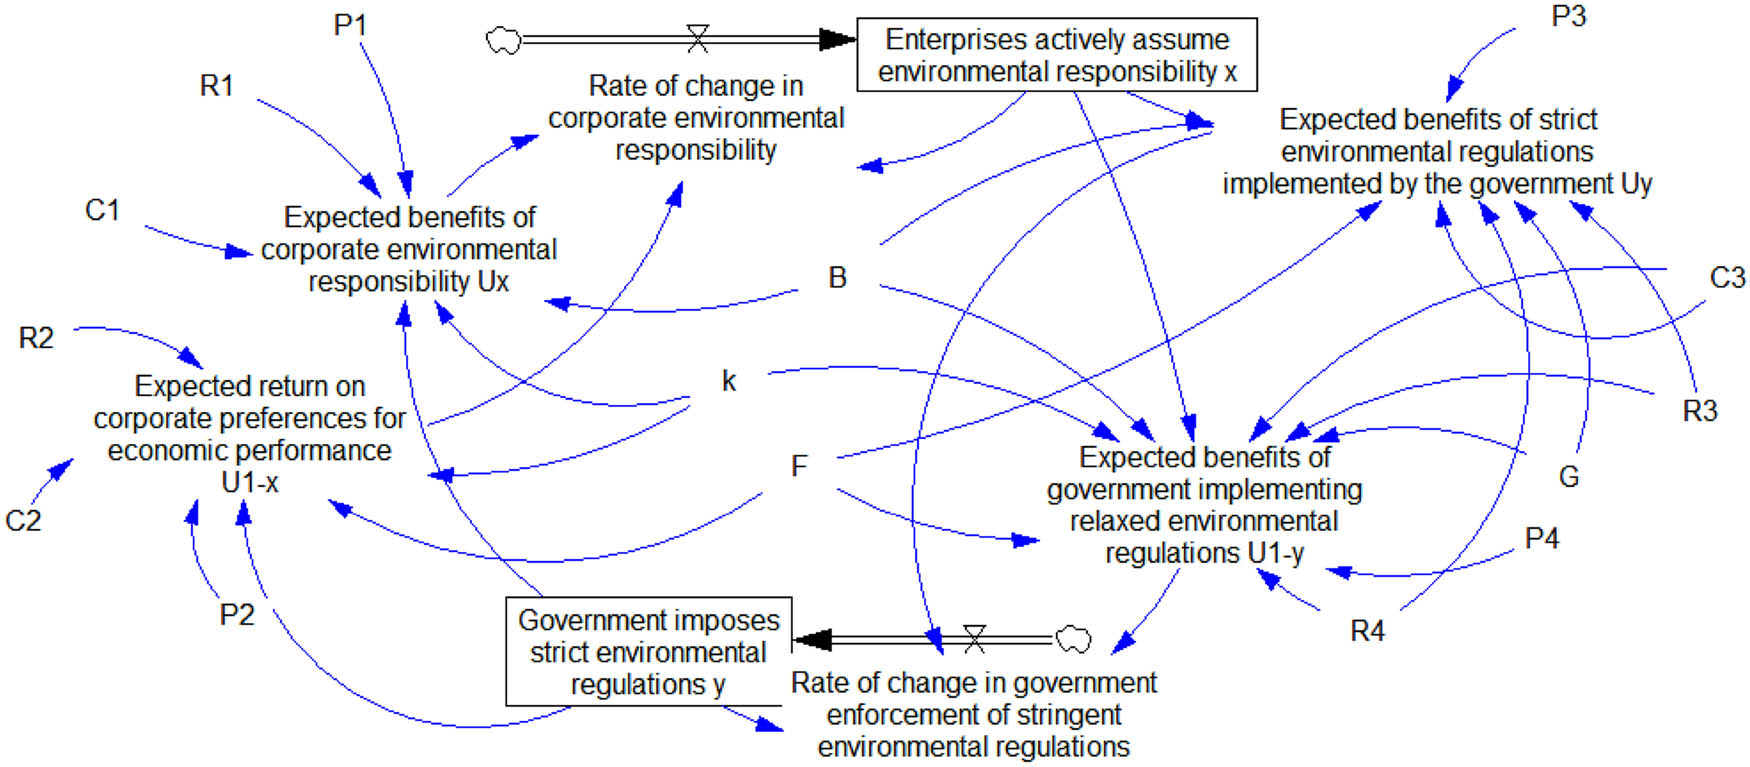
System dynamics simulation model of the evolutionary game between heavy polluting enterprises and local governments.
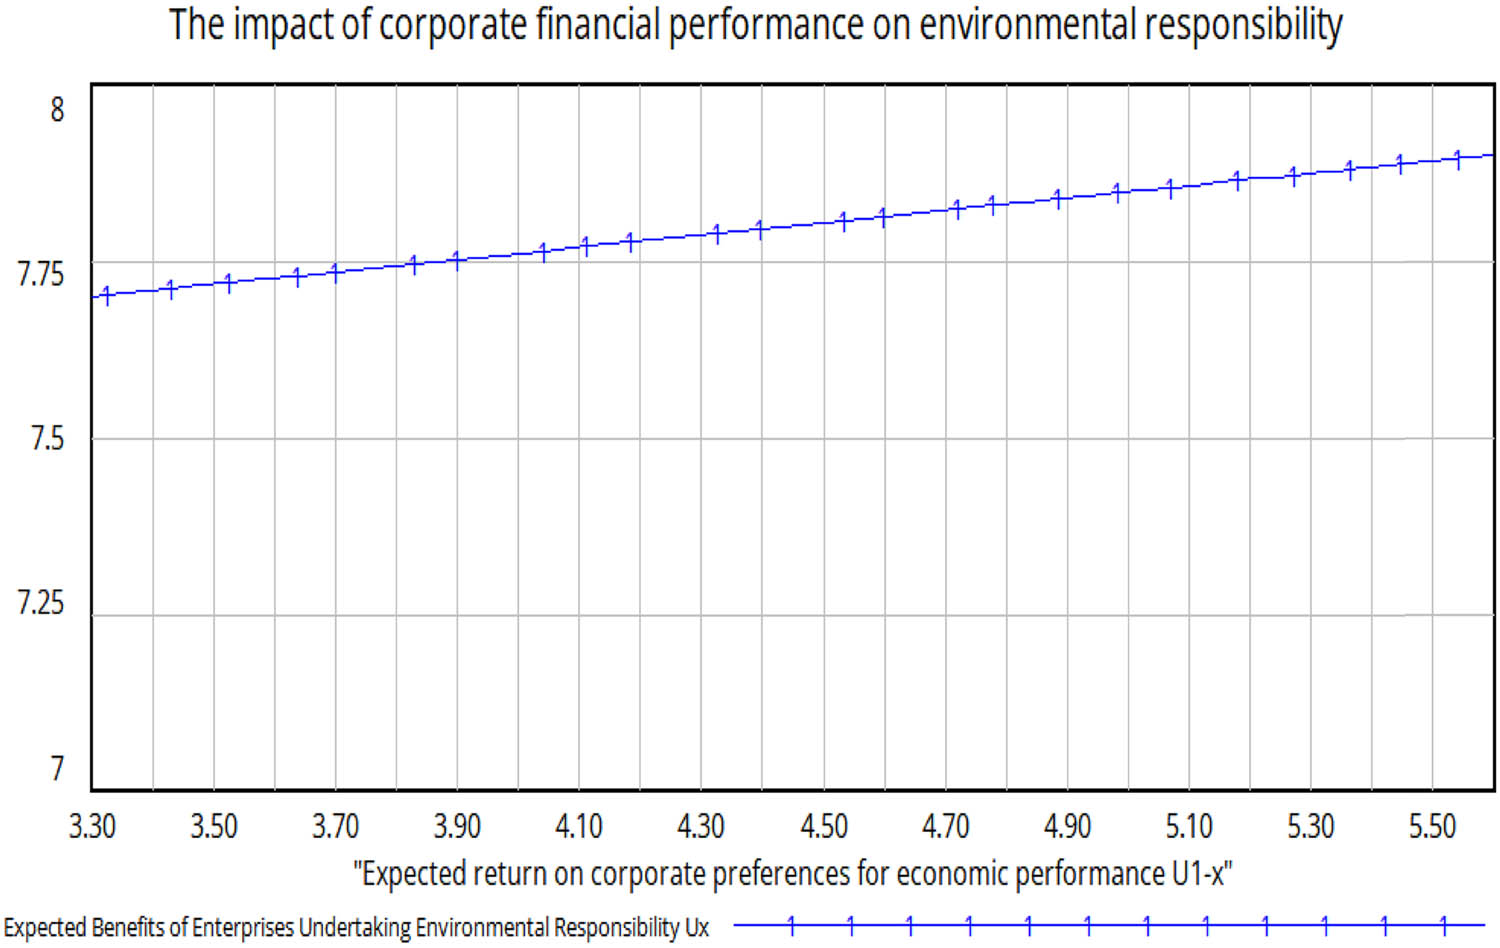
This study takes the following parameter values: R1 = 10, R2 = 8, R3 = 6, R4 = 5, C1 = 4.5, C2 = 2, C3 = 4, B = 2, k = 0.2, G = 1.5, F = 2, P1 = 2, P2 = 3, P3 = 2, and P4 = 3. First, by taking different values for x and y, we can observe the dynamic evolution process of enterprises and governments under different initial strategy choices in (Figure 7). It can be seen that under different strategies, the evolutionary game will ultimately stabilize in a state of (1,0), where enterprises actively assume environmental responsibility and governments implement loose environmental regulations. For the convenience of further simulation analysis, this article sets the probability of enterprises actively assuming environmental responsibility x = 0.5, and the probability of government implementing strict environmental regulations y = 0.5. Studying the specific evolution path, Figure 8 shows that heavily polluting enterprises gradually evolve to 1, government strategies gradually evolve to 0, and the time point when the government evolves to stable strategies is significantly later than that of heavily polluting enterprises. When the group of heavily polluting enterprises gradually assumes environmental responsibility, the government's goal of implementing strict environmental regulations is achieved, and as a result, the government can gradually relax its regulatory efforts and implement relaxed environmental regulations. Figure 9 shows that the expected returns of enterprises choosing to assume environmental responsibility show a clear growth trend, but the growth of expected returns of environmental responsibility cannot be infinite and will remain at this level after reaching the maximum expected returns. Figures 10 and 11 analyze the relationship between environmental responsibility and financial performance of heavily polluting enterprises. It can be seen that actively assuming environmental responsibility helps to improve corporate financial performance, and financial performance can promote corporate environmental social responsibility.

Dynamic evolution process of corporate and local government strategies
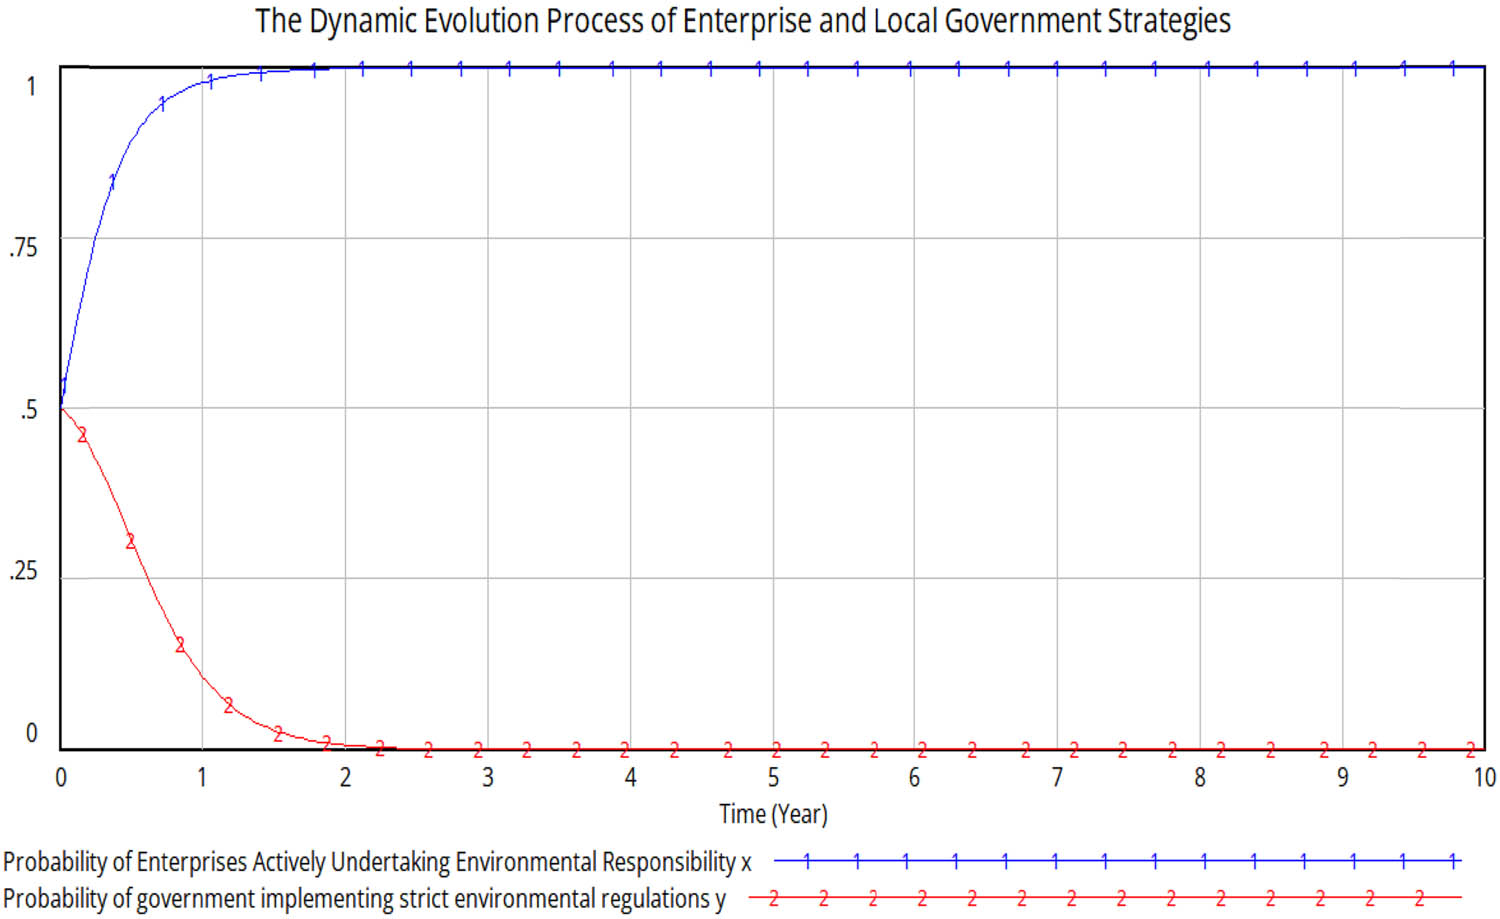
Dynamic evolutionary processes of corporate and local government strategies at specific values.

Expected benefits of enterprises undertaking environmental responsibility.

The impact of environmental responsibility on financial performance of heavily polluting enterprises.
Impact of financial performance of heavily polluting enterprises on environmental responsibility.
In the context of promoting low-carbon environmental protection today, a positive image of taking on environmental responsibility can bring more resource inflows to enterprises, help improve competitiveness, achieve economic goals, and promote financial performance growth. On the other hand, sufficient financial support can also promote enterprises to further assume environmental social responsibility, verifying the existence of a benign mutual promotion mechanism between corporate environmental responsibility and financial performance, However, the operation of this mutual promotion mechanism requires the use of the government's “invisible hand” to implement strict regulation. The government uses green subsidy policies and economic penalties to guide enterprises to assume environmental responsibility, achieving a two-way development of environmental responsibility and enterprise economy. After seeing the favorable side of achieving economic goals, enterprises shift from passive to active environmental responsibility. At the same time, the government has achieved the goal of strict environmental regulation, gradually shifting to implementing loose environmental regulation policies and reducing investment costs related to environmental protection. The evolution path of strategic choices between heavily polluting enterprises and local governments will ultimately form a win–win situation between enterprises and the social environment.
6 Conclusions and Policy Recommendations
This article takes the listed companies in the heavy pollution industry in Shanghai and Shenzhen A-shares from 2010 to 2021 in China as the research samples and uses the two-way fixed effect model to empirically test the “responsibility–performance” interaction in the process of enterprises' decision-making on environmental social responsibility, taking into account the local government's environmental protection strategy and EPF. Second, a system dynamics model is constructed based on the evolutionary game theory for simulation analysis to explore the evolutionary behavior of heavy polluting enterprises’ environmental responsibility and its relationship with their financial performance under the influence of local government's environmental regulation. The research finds that: (1) for environmental social responsibility, the stable cash flow brought by the expected performance surplus of enterprises is an important guarantee to promote the virtuous cycle of environmental social responsibility and financial performance, and the expected performance gap is not enough to stimulate the willingness of decision-makers to take risks in the undertaking of environmental social responsibility. (2) The environmental protection strategies of local governments have a negative regulatory effect on the “performance–responsibility” relationship. In areas with relatively negative environmental protection strategies, environmental social responsibility can more efficiently achieve reputation transformation and promote enterprises to invest in environmental social responsibility. (3) Industries with more fierce competition and enterprises with forward-looking environmental strategies are more inclined to put performance feedback into the undertaking of environmental social responsibility. It is easier for non-state-owned enterprises to improve their financial performance by assuming environmental social responsibility. (4) The implementation of strict environmental regulations by the government and the use of green subsidy policies and economic penalties to urge enterprises to assume environmental responsibility are important driving forces for achieving the benign mutual promotion mechanism of “responsibility - performance” among enterprises.
Based on this study, the following theoretical enlightenment and policy recommendations can be obtained: first, enterprise decision makers should make full use of the potential interaction mechanism between environmental social responsibility and financial performance, promote the improvement of financial performance by actively undertaking environmental social responsibility, and drive the long-term stable development of enterprises and the growth of social public interests. Second, actively guiding and promoting enterprises with expected performance gaps to improve their environmental responsibility undertaking through government policies, including the provision of green subsidies, green credits and strict environmental regulatory policies, etc., and guiding enterprises to choose to undertake environmental responsibility under a clear reward and punishment mechanism, so as to promote the operation of the mechanism of mutual reinforcement between environmental social responsibility and corporate financial performance. Third, in areas with relatively backward awareness of environmental protection, the government and regulatory departments should urge heavily polluting enterprises to implement their environmental responsibilities. Through publicity and guidance, enterprises can fully realize that emission reduction and growth can be achieved simultaneously and promote more enterprises to seek their own development while protecting the ecological environment. Fourth, heavily polluting enterprises should be encouraged to implement forward-looking environmental strategies, realize the coordinated development of government environmental protection strategies and enterprise environmental strategies, promote the mutual promotion of corporate financial performance and environmental responsibility, and form a win–win situation at the ecological level and the corporate social level.
There are still individual issues to be further explored in the research of this article: this article has conducted an empirical analysis for the heavily polluting industries, but the applicability of the findings to other industries is still to be tested. In future research, a series of works on this issue will continue to be carried out to expand the scope of the study, promote society as a whole to assume responsibility for the environment, and accelerate the construction of the ecological environment.
-
Funding information: The research was supported by the National key R&D program “Multi value chain collaborative data space management engine and management system architecture design and verification (2020YFB1707804),” The Humanities and Social Sciences Research Project of Jilin Provincial Department of Education “Research on the Collaborative Mechanism and Implementation Path of Green Innovation Development in Jilin Province from the Perspective of Active Behavior (JJKH20240114SK).”
-
Conflict of interest: The author(s) declared no potential conflicts of interest with respect to the research, authorship, and/or publication of this article.
-
Article note: As part of the open assessment, reviews and the original submission are available as supplementary files on our website.
-
Data availability statement: The datasets used and/or analyzed during the current study are available from the corresponding author on reasonable request.
References
Aragón-Correa, J., & Sharma, S. (2003). A contingent resources-based view of proactive corporate environmental strategy. Academy of Management Review, 28(1), 71–88.10.5465/amr.2003.8925233Search in Google Scholar
Blackman, A. (2012). Does eco-certification boost regulatory compliance in developing countries? ISO 14001 in Mexico. Journal of Regulatory Economics, 42(3), 242–263.10.1007/s11149-012-9199-ySearch in Google Scholar
Chen, W. H., Zhong, X., & Song, T. B. (2018). Gap in business expectations, board characteristics, and strategic change. Soft Science, 32(2), 76–79.Search in Google Scholar
Christiansen, G. B., & Haveman, R. H. (1981). The contribution of environmental regulations to the slowdown in productivity growth. Jounal of Environmental Economics and Management, 8(4), 381–390.10.1016/0095-0696(81)90048-6Search in Google Scholar
Conrad, K., & Wastl, D. (1995). The impact of environmental regulation on productivity in German industries. Empirical Economics, 20(4), 615–633.10.1007/BF01206060Search in Google Scholar
Duanmu, J. L., Bu, M., & Pittman, R. (2018). Does market competition dampen environmental performance? Evidence from China. Strategic Management Journal (John Wiley & Sons, Inc), 39(11), 3006–3030.10.1002/smj.2948Search in Google Scholar
Gray, W. B., & Shadbegian, R. (1993). Environmental regulation a and manufacturing productivity at the plant level. NBER Working Paper.10.3386/w4321Search in Google Scholar
Greenstone, M., List, J. A., & Syverson, C. (2012). The effects of environmental regulation on the competitiveness of U.S. manufacturing. NEBR Working Paper.10.3386/w18392Search in Google Scholar
He, X. G., Deng, H., & LV, F. F. (2017). Dynamic relationship between negative attainment discrepancy and R & D investments: Moderating effect of organizational slack and competitive threat. Journal of Management Sciences in China, 20(5), 13–34.Search in Google Scholar
Imeni, M., & Edalatpanah, S. A. (2023). Resilience: Business sustainability based on risk management. In H. Garg (Ed.), Advances in Reliability, Failure and Risk Analysis. Industrial and Applied Mathematics. Singapore: Springer.10.1007/978-981-19-9909-3_9Search in Google Scholar
John, L. C. (2007). Why would corporations behave in socially responsible ways? An institutional theory of corporate social responsibility. The Academy of Management Review, 32(3), 946–967.10.5465/amr.2007.25275684Search in Google Scholar
Kunieda, T., & Nishimura, K. (2019). Endogenous business cycles in a perpetual youth model with financial market imperfections. International Journal of Economic Theory, 15(3), 231–248.10.1111/ijet.12233Search in Google Scholar
Li, B., Gu, H. M., & Gao, W. (2011). An empirical study on the effect of institutional pressures on corporate social responsibility of tourism enterprises. Nankai Business Review, 14(6), 67–75.Search in Google Scholar
Li, C. (2016). Research on enterprise environmental strategy and its relationship with enterprise competitiveness. Modern Economic Research, (3), 57–61.Search in Google Scholar
Li, C. F., Qiu, R., & Wang, Y. H. (2022a). Tripartite evolutionary game and stability control strategy for green transformation supervision and regulation of resource-based enterprises. Soft Science, 36(3), 99–109.Search in Google Scholar
Li, Q., Xu, J. M., Xiong, J., & Liu, H. X. (2022b). Impacts of corporate social responsibility consistency on financial performance. Chinese Journal of Management, 19(2), 245–253.Search in Google Scholar
Lin, H. C., Wang, L., & Wang, F. M. (2007). Environmental performance, corporate responsibility, and product value reengineering. Management World, (5), 155–157.Search in Google Scholar
Lioui, A., & Sharma, Z. (2012). Environmental corporate social responsibility and financial performance: Disentangling direct and indirect effects. Ecological Economics (pp. 100–111, Vol. 78). Elsevier.10.1016/j.ecolecon.2012.04.004Search in Google Scholar
Osintsev, N., & Khalilian, B. (2023). Does organizational performance increase with innovation and strategic planning? J. Oper. Strateg Anal., 1(1), 25–33.10.56578/josa010104Search in Google Scholar
Preston, L. E., & O’Bannon, D. P. (1997). The corporate social-financial performance relationship: A typology and analysis. Business and Society, 36(4), 419–429.10.1177/000765039703600406Search in Google Scholar
Shan, L. B., Li, F. S., & Ding, Y. Y. (2021). Can enterprises assume environmental responsibility to achieve a win–win situation in terms of environmental and economic benefits – Based on the perspective of equity capital cost. Investment Research, 40(2), 71–91.Search in Google Scholar
Shen, H. T., & Zhou, Y. K. (2017). Supervision of environmental policy enforcement and firm environmental performance: Evidence from a Quasi-natural experiment. Nankai Business Review, 20(6), 73–82.Search in Google Scholar
Shinkle, G. A. (2012). Organizational aspirations, reference points, and goals: Building on the past and aiming for the future. Journal of Management, 38(1), 415–455.10.1177/0149206311419856Search in Google Scholar
Staw, B. M., Sandelands, L. E., & Dutton, J. E. (1981). Threat rigidity effects in organizational behavior: A multilevel analysis. Administrative Science Quarterly, 26(4), 501–524.10.2307/2392337Search in Google Scholar
Tian, X. L., Guo, Q. G., & Han, C. (2016). Different extent of environmental information disclosure across Chinese cities: Contributing factors and correlation with local pollution. Global Environmental Change, 39, 244–257.10.1016/j.gloenvcha.2016.05.014Search in Google Scholar
Wang, J., Cheng, B., & Sun, Y. X. (2014). The effect of expected performance feedback on corporate R&D and charitable donation. Management World, (8), 115–133.Search in Google Scholar
Wang, R., Wijen, F., & Heugens, P. P. (2018). Government’ s green grip: Multifaceted state influence on corporate environmental actions in China. Strategic Management Journal, 39(2), 403–428.10.1002/smj.2714Search in Google Scholar
Wei, Y. Y., & Hu, C. (2021). Research on the relationship between environmental policy, corporate social responsibility, and corporate performance: An empirical analysis based on environmental violation enterprises in heavy pollution industries. Journal of East China University of Science and Technology (Social Science Edition), 36(3), 125–133.Search in Google Scholar
Wu, J. Z., & Yuan, H. C. (2020). The inverted U-shaped relationship between performance below the aspiration level and corporate environmental strategy. Chinese Journal of Management, 17(10), 1453–1460.Search in Google Scholar
Xu, Z. C., & Hou, J. C. (2019). Innovation investment,competitive strategy and enterprise performance level – An empirical analysis based on Chinese manufacturing listed companies. Modern Finance and Economics-Journal of Tianjin University of Finance and Economics, 39(9), 56–68.Search in Google Scholar
Xu, Z. W., & Li, R. H. (2019). “Polluters’ survival pathway: An investigation and rethink on “too polluted to fail”.” Journal of Finance and Economics, 45(7), 84–96+153.Search in Google Scholar
Ye, Q., Zeng, G., & Dai, S. Q. (2018). Research on the effects of different policy tools on China’s emissions reduction innovation: Based on the panel data of 285 prefectural-level municipalities. China Population, Resources and Environment, 28(2), 115–122.Search in Google Scholar
Zhang, C., & Wu, S. X. (2017). Environmental responsibility undertaking and corporate performance: Theory and evidence. Journal of Industrial Technological and Economics, 36(5), 67–75.Search in Google Scholar
Zhang, C., Zhang, Z. G., & Bao, L. L. (2020). A study on the interactive and intertemporal influence and mechanism of corporate environmental responsibility and financial performance. Management Review, 32(2), 76–89.Search in Google Scholar
Zhang, Q., Chen, W. Y., & Geng, J. X. (2022). Research on the relationship between environmental performance and financial performance of heavy polluted enterprises: Theoretical analysis based on evolutionary game theory, Finance and Accounting Communication, (20), 97–103.Search in Google Scholar
Zhang, Y. K., Liu, S. X., Zeng, Y. T., & Li, B. (2019a). Smog pollution, business performance and corporate environmental social responsibility. Chinese Journal of Environmental Management, 11(4), 39–45.Search in Google Scholar
Zhang, Z. G., Zhang, C., & Cao, D. T. (2019b). Is environmental management system certification of the enterprise effective. Nankai Business Review, 22(4), 123–134.Search in Google Scholar
Zhou, H., Zhou, C., & Lin, W. F. (2018). Corporate governance and credit spreads on corporate bonds – An empirical study of China’s corporate bonds from 2008 to 2016. Accounting Research, (5), 59–66.Search in Google Scholar
Zimmerman, M. A., & Zeitz, G. J. (2002). Beyond survival: Achieving new venture growth by building legitimacy. Academy of Management Review, 27(3), 414–431.10.5465/amr.2002.7389921Search in Google Scholar
© 2024 the author(s), published by De Gruyter
This work is licensed under the Creative Commons Attribution 4.0 International License.
Articles in the same Issue
- Regular Articles
- Political Turnover and Public Health Provision in Brazilian Municipalities
- Examining the Effects of Trade Liberalisation Using a Gravity Model Approach
- Operating Efficiency in the Capital-Intensive Semiconductor Industry: A Nonparametric Frontier Approach
- Does Health Insurance Boost Subjective Well-being? Examining the Link in China through a National Survey
- An Intelligent Approach for Predicting Stock Market Movements in Emerging Markets Using Optimized Technical Indicators and Neural Networks
- Analysis of the Effect of Digital Financial Inclusion in Promoting Inclusive Growth: Mechanism and Statistical Verification
- Effective Tax Rates and Firm Size under Turnover Tax: Evidence from a Natural Experiment on SMEs
- Re-investigating the Impact of Economic Growth, Energy Consumption, Financial Development, Institutional Quality, and Globalization on Environmental Degradation in OECD Countries
- A Compliance Return Method to Evaluate Different Approaches to Implementing Regulations: The Example of Food Hygiene Standards
- Panel Technical Efficiency of Korean Companies in the Energy Sector based on Digital Capabilities
- Time-varying Investment Dynamics in the USA
- Preferences, Institutions, and Policy Makers: The Case of the New Institutionalization of Science, Technology, and Innovation Governance in Colombia
- The Impact of Geographic Factors on Credit Risk: A Study of Chinese Commercial Banks
- The Heterogeneous Effect and Transmission Paths of Air Pollution on Housing Prices: Evidence from 30 Large- and Medium-Sized Cities in China
- Analysis of Demographic Variables Affecting Digital Citizenship in Turkey
- Green Finance, Environmental Regulations, and Green Technologies in China: Implications for Achieving Green Economic Recovery
- Coupled and Coordinated Development of Economic Growth and Green Sustainability in a Manufacturing Enterprise under the Context of Dual Carbon Goals: Carbon Peaking and Carbon Neutrality
- Revealing the New Nexus in Urban Unemployment Dynamics: The Relationship between Institutional Variables and Long-Term Unemployment in Colombia
- The Roles of the Terms of Trade and the Real Exchange Rate in the Current Account Balance
- Cleaner Production: Analysis of the Role and Path of Green Finance in Controlling Agricultural Nonpoint Source Pollution
- The Research on the Impact of Regional Trade Network Relationships on Value Chain Resilience in China’s Service Industry
- Social Support and Suicidal Ideation among Children of Cross-Border Married Couples
- Asymmetrical Monetary Relations and Involuntary Unemployment in a General Equilibrium Model
- Job Crafting among Airport Security: The Role of Organizational Support, Work Engagement and Social Courage
- Does the Adjustment of Industrial Structure Restrain the Income Gap between Urban and Rural Areas
- Optimizing Emergency Logistics Centre Locations: A Multi-Objective Robust Model
- Geopolitical Risks and Stock Market Volatility in the SAARC Region
- Trade Globalization, Overseas Investment, and Tax Revenue Growth in Sub-Saharan Africa
- Can Government Expenditure Improve the Efficiency of Institutional Elderly-Care Service? – Take Wuhan as an Example
- Media Tone and Earnings Management before the Earnings Announcement: Evidence from China
- Review Articles
- Economic Growth in the Age of Ubiquitous Threats: How Global Risks are Reshaping Growth Theory
- Efficiency Measurement in Healthcare: The Foundations, Variables, and Models – A Narrative Literature Review
- Rethinking the Theoretical Foundation of Economics I: The Multilevel Paradigm
- Financial Literacy as Part of Empowerment Education for Later Life: A Spectrum of Perspectives, Challenges and Implications for Individuals, Educators and Policymakers in the Modern Digital Economy
- Special Issue: Economic Implications of Management and Entrepreneurship - Part II
- Ethnic Entrepreneurship: A Qualitative Study on Entrepreneurial Tendency of Meskhetian Turks Living in the USA in the Context of the Interactive Model
- Bridging Brand Parity with Insights Regarding Consumer Behavior
- The Effect of Green Human Resources Management Practices on Corporate Sustainability from the Perspective of Employees
- Special Issue: Shapes of Performance Evaluation in Economics and Management Decision - Part II
- High-Quality Development of Sports Competition Performance Industry in Chengdu-Chongqing Region Based on Performance Evaluation Theory
- Analysis of Multi-Factor Dynamic Coupling and Government Intervention Level for Urbanization in China: Evidence from the Yangtze River Economic Belt
- The Impact of Environmental Regulation on Technological Innovation of Enterprises: Based on Empirical Evidences of the Implementation of Pollution Charges in China
- Environmental Social Responsibility, Local Environmental Protection Strategy, and Corporate Financial Performance – Empirical Evidence from Heavy Pollution Industry
- The Relationship Between Stock Performance and Money Supply Based on VAR Model in the Context of E-commerce
- A Novel Approach for the Assessment of Logistics Performance Index of EU Countries
- The Decision Behaviour Evaluation of Interrelationships among Personality, Transformational Leadership, Leadership Self-Efficacy, and Commitment for E-Commerce Administrative Managers
- Role of Cultural Factors on Entrepreneurship Across the Diverse Economic Stages: Insights from GEM and GLOBE Data
- Performance Evaluation of Economic Relocation Effect for Environmental Non-Governmental Organizations: Evidence from China
- Functional Analysis of English Carriers and Related Resources of Cultural Communication in Internet Media
- The Influences of Multi-Level Environmental Regulations on Firm Performance in China
- Exploring the Ethnic Cultural Integration Path of Immigrant Communities Based on Ethnic Inter-Embedding
- Analysis of a New Model of Economic Growth in Renewable Energy for Green Computing
- An Empirical Examination of Aging’s Ramifications on Large-scale Agriculture: China’s Perspective
- The Impact of Firm Digital Transformation on Environmental, Social, and Governance Performance: Evidence from China
- Accounting Comparability and Labor Productivity: Evidence from China’s A-Share Listed Firms
- An Empirical Study on the Impact of Tariff Reduction on China’s Textile Industry under the Background of RCEP
- Top Executives’ Overseas Background on Corporate Green Innovation Output: The Mediating Role of Risk Preference
- Neutrosophic Inventory Management: A Cost-Effective Approach
- Mechanism Analysis and Response of Digital Financial Inclusion to Labor Economy based on ANN and Contribution Analysis
- Asset Pricing and Portfolio Investment Management Using Machine Learning: Research Trend Analysis Using Scientometrics
- User-centric Smart City Services for People with Disabilities and the Elderly: A UN SDG Framework Approach
- Research on the Problems and Institutional Optimization Strategies of Rural Collective Economic Organization Governance
- The Impact of the Global Minimum Tax Reform on China and Its Countermeasures
- Sustainable Development of Low-Carbon Supply Chain Economy based on the Internet of Things and Environmental Responsibility
- Measurement of Higher Education Competitiveness Level and Regional Disparities in China from the Perspective of Sustainable Development
- Payment Clearing and Regional Economy Development Based on Panel Data of Sichuan Province
- Coordinated Regional Economic Development: A Study of the Relationship Between Regional Policies and Business Performance
- A Novel Perspective on Prioritizing Investment Projects under Future Uncertainty: Integrating Robustness Analysis with the Net Present Value Model
- Research on Measurement of Manufacturing Industry Chain Resilience Based on Index Contribution Model Driven by Digital Economy
- Special Issue: AEEFI 2023
- Portfolio Allocation, Risk Aversion, and Digital Literacy Among the European Elderly
- Exploring the Heterogeneous Impact of Trade Agreements on Trade: Depth Matters
- Import, Productivity, and Export Performances
- Government Expenditure, Education, and Productivity in the European Union: Effects on Economic Growth
- Replication Study
- Carbon Taxes and CO2 Emissions: A Replication of Andersson (American Economic Journal: Economic Policy, 2019)