Early age temperature effect of cemented sand and gravel based on random aggregate model
-
Lixia Guo


Abstract
This study investigates the risk of early-age cracking in cemented sand gravel by modeling it as a two-phase material (aggregate and mortar) from a mesoscopic perspective. A mathematical model incorporating mesoscopic components was developed to simulate the temperature stress field under different heat dissipation conditions. Key findings include: (1) Early-age heat release occurs primarily in the mortar, leading to uneven temperature distribution (low in aggregate, high in mortar), which becomes uniform as hydration ends. Stress concentration is observed at aggregate–mortar interfaces. (2) Mesoscopic component consideration reveals local stress concentration, unlike models ignoring meso-components. (3) External heat dissipation conditions significantly affect temperature effects. Under adiabatic conditions, larger deformations occur at mortar–aggregate intersections and increase over time. In heat dissipation states, deformation is higher at boundaries, unevenly distributed, and decreases over time. This research highlights the importance of mesoscopic considerations in understanding and mitigating early-age cracking risks in cemented sand gravel.
1 Introduction
Cemented sand and gravel (CSG) [1,2,3,4,5] uses less cementitious materials, unscreened aggregates, and small hydration reaction compared to ordinary concrete, so the on-site temperature control measures are not as strict as those for concrete dams. However, its ability to resist deformation is poor. With the progress of hydration reaction, more and more heat is accumulated inside the structure, resulting in an internal thermal expansion effect. Under the constraint of boundary conditions, temperature stress is formed. It is precisely because of the heterogeneity, nonlinearity, and anisotropy of CSG. Therefore, the temperature gradient is different everywhere in the structure, and the temperature stress is also different. The dam body produces temperature cracks on the surface or inside, which will reduce its durability. Therefore, it is important to explore the development law of temperature stress inside the structure, so that it is within the controllable range, to prevent the generation and development of temperature cracks [6,7] in the early-age cemented gravel dam structure, and to prolong the service life of the dam structure.
There are few existing studies on temperature stress and temperature control of cemented gravel dams, Wu et al. [8], combined with Shoukoubu cemented gravel dam test data, numerically simulated the temperature stress change rule of the dam body under different working conditions. Liu et al. [9] analyzed the temperature stress field of the Shoukoubu cemented gravel dam. Liu [10] studied the temperature stress field of a rubberized gravel dam. Wu et al. [11] used a three-dimensional finite-element simulation method to analyze the temperature stress of a 100-m dam. Xu [12] investigated the effects of factors such as air temperature, dam height, and pouring interval on the temperature stress of cemented gravel dams. Fu [13] performed a numerical simulation of the temperature stress field for the Shoukoubao cemented gravel dam and found that there was a significant temperature effect on the dam during the construction period. Zhao and He [14] proposed a temperature field calculation method applicable to cemented gravel materials by considering the thermal–mechanical properties and seepage characteristics of cemented gravel materials. Cai et al. [15] investigated the creep temperature stresses of different adhesive columns. Chen and Zheng [16] studied the structural damage of cemented gravel materials under the conditions of freezing and thawing based on the freeze and thawing damage law. Jiang et al. [17] conducted an adiabatic temperature rise test. Numerical simulation is essential for capturing the mesoscale thermal–mechanical behavior of CSG, as demonstrated by advanced approaches like CT-image-driven modeling [18,19], which validate the critical role of a mesostructure in heterogeneous material analysis.
In this article, the temperature effect of early-age CSG is studied. From a mesoscopic perspective, it is regarded as a two-phase material of aggregate and mortar. A random aggregate model is constructed, and the mesoscopic parameters are inverted through laboratory tests. The temperature stress field under different heat dissipation conditions considering and not considering the mesoscopic components is compared and analyzed. It is found that the heat release of early-age mortar leads to the temperature difference between aggregate and mortar, and the interface is prone to stress concentration, and the mesoscopic model will show local stress concentration. Different heat dissipation conditions will make the temperature stress distribution and deformation law different. The research provides a theoretical basis for the early crack control of CSG dams.
2 Numerical simulation methods
2.1 Stochastic aggregate modeling for cemented gravels
CSG is made of naturally graded sand and gravel material or excavated abandoned riverbed sand and gravel material. In principle, it is not screened. According to Feng et al. [20], the study shows that the sand layer and gravel layer are alternately distributed, and the grading distribution is uneven. Figure 1 shows the 12 groups of sand and gravel material gradation and fuller gradation curve in the project site.
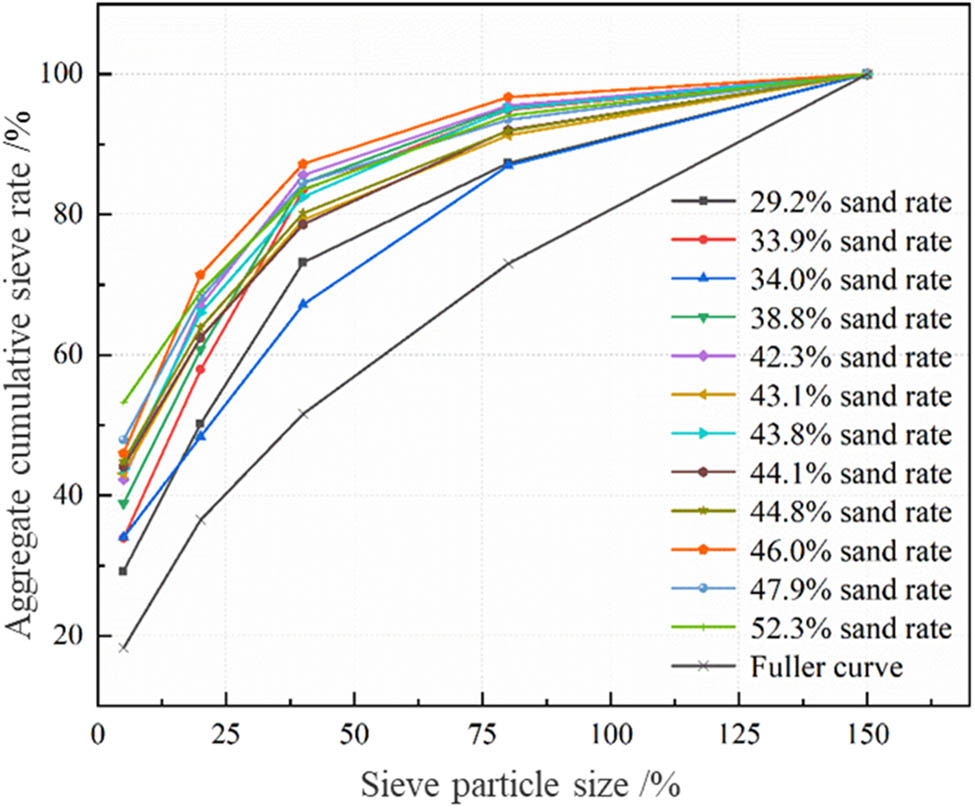
Gravel gradation and Fuller gradation curve.
Based on the aggregate characteristics of CSG, three-dimensional aggregate is randomly generated to determine the distribution of aggregate according to the three-dimensional grading curve of CSG in the field. The plane is randomly intercepted in the three-dimensional model, and the total area of aggregate in each particle size interval is calculated on the plane, so as to obtain the cumulative distribution function of the two-dimensional aggregate mass and ultimately generate the number of two-dimensional aggregate particles to meet the specific grading. The specific process is shown in Figure 2.
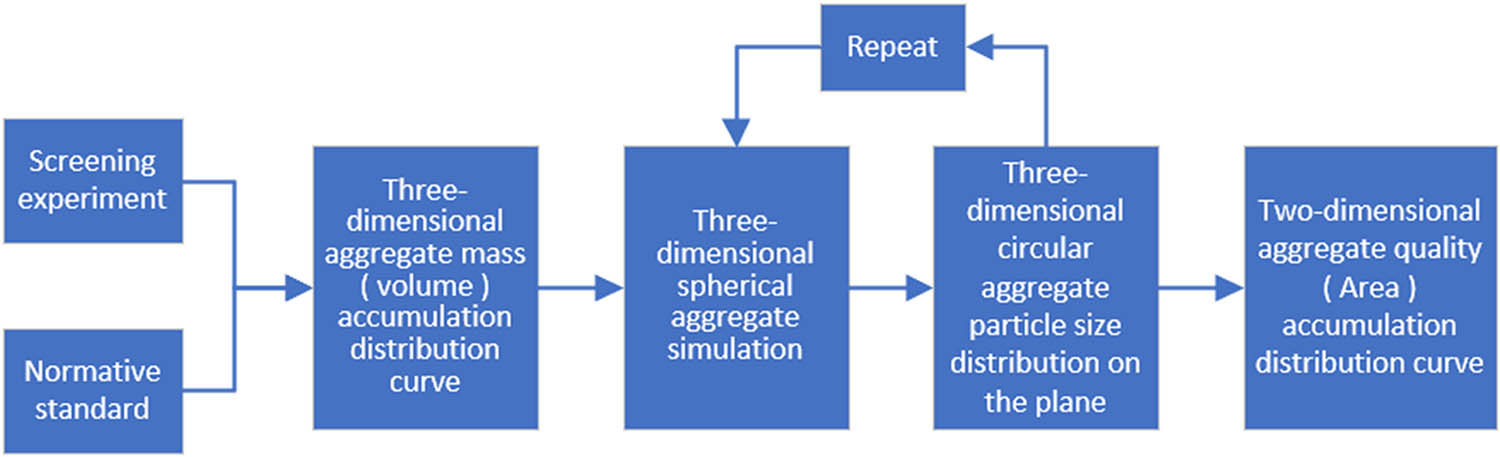
Method for determining the mass cumulative distribution function of two-dimensional aggregates of any gradation.
The number of aggregates in each particle size interval was then calculated by
where
The morphology and distribution of the coarse aggregate of the cemented gravel specimen have randomness, and random variables are needed in the finite-element analysis. The Monte Carlo method is used to set up the random variables for the coarse aggregate placement. The common forms of distribution of the random variables are uniform, logarithmic, and normal, etc., among which the most basic form of distribution is the uniform distribution, which assumes that there is a set of uniform, independent random variables distributed in the interval [0, 1]. The probability density function of X can be expressed as
A subsample sequence [X n ] is generated by randomly drawing from the random variable X. In this article, by generating the aggregate random circle and the bond belt boundary random circle, dividing the quadrants within the inner and outer circles, determining the number of corner points in each quadrant, generating the coordinates of the corner points, and finally connecting the corner points to generate the polygon [21,22].
2.2 Inverse analysis of fine-scale parameters
Because the fine material parameters are difficult to measure directly by indoor tests, these parameters are obtained by inverting the indoor adiabatic temperature rise test. The test uses a Φ400 × 400 mm three-dimensional cylinder of CSG, and the aggregate is a secondary distribution. In this article, the design of the mix ratio of the adiabatic temperature rise test of CSG is based on the mix ratio of the CSG dam of the Shanxi Shoukoubao Reservoir. The water–binder ratio of the adiabatic temperature rise test is 1.58, the sand ratio is 0.418, the cement is 50 kg/m3, the fly ash is 40 kg/m3, the coarse aggregate is 1,233 kg/m3, and the medium coarse sand is 885 kg/m3 records the temperature change curve after pouring. On this basis, numerical simulation of the above test was carried out, and its fine view parameters were obtained by inversion. Because of more thermal parameters, this article mainly focuses on the inversion of sensitive adiabatic temperature rise and thermal conductivity coefficient, in which the model of adiabatic temperature rise adopts the composite exponential model [23,24,25].
The adiabatic temperature rise test uses a BY-ATC/B-type concrete thermophysical parameter tester to track and measure the temperature change of the cemented gravel specimen for 7 day, and the test results are shown in Table 1.
Adiabatic temperature rise test results
| Mold temperature (°C) | Appreciation | ||||||
|---|---|---|---|---|---|---|---|
| 0.5 day | 1 day | 2 day | 3 day | 4 day | 7 day | Supreme | |
| (°C) | (°C) | (°C) | (°C) | (°C) | (°C) | (°C) | |
| 32.25 | 5.59 | 9.78 | 13.8 | 15.7 | 15.22 | 15.01 | 15.23 |
From the results, it can be seen that with the hydration reaction, the temperature rises gradually and stabilizes after 3 day and reaches the maximum adiabatic temperature rise at about 4 day, which is 15.23°C; the maximum adiabatic temperature rise rate occurs at about 6 h, and the maximum adiabatic temperature rise rate value is about 0.35 (°C/h).
In order to solve the problems of a cumbersome traditional inversion process and unclear modeling of a mathematical relationship between parameters of CSG, the inversion of fine parameters was carried out according to the response surface method of the previous group [26]. A two-dimensional random aggregate model of Φ400 × 400 mm is established as shown in Figure 3.
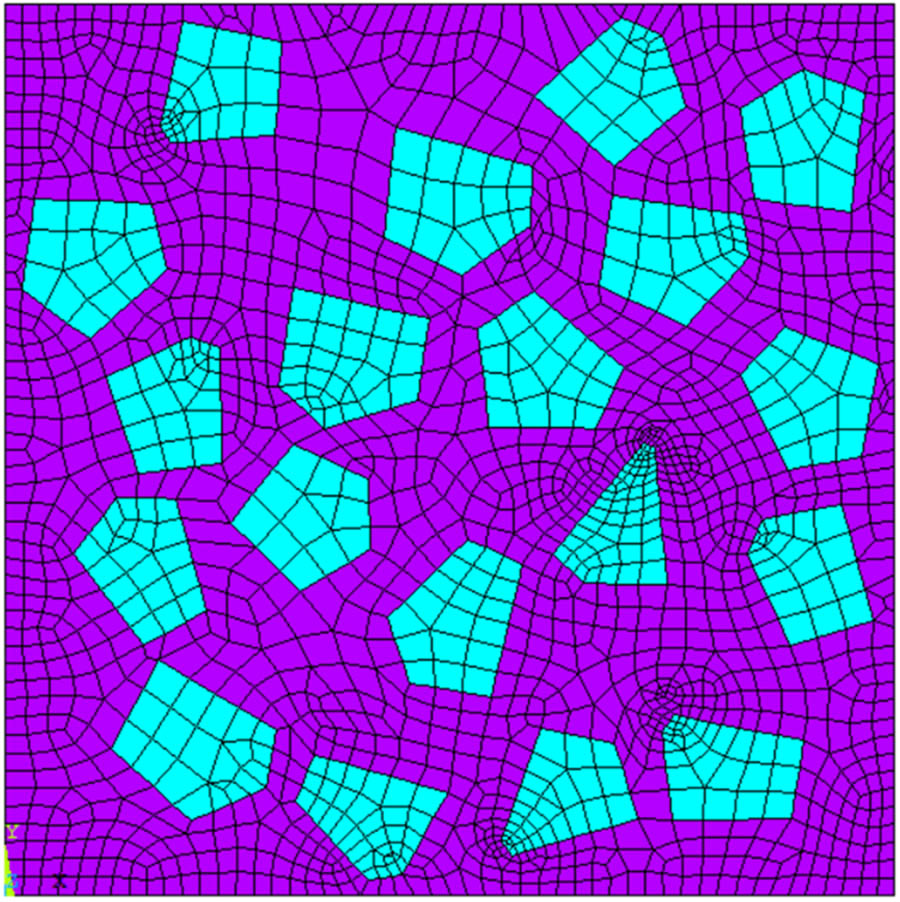
Random polygonal aggregate model of cementitious sand gravel.
The adiabatic temperature rise test data are brought into the response surface model as the inversion target, requiring more than 97% guarantee rate, and the basic parameters are brought into the response surface software to solve the temperature field regression equation. The inversion results are shown in Table 2.
Table of thermal parameters
| Individual parts making up a compound | Thermal conductivity [kJ/(m h °C)] | Thermal conductivity [kJ/(m h °C)] | Specific heat capacity [kJ/ (kg °C)] |
|---|---|---|---|
| Mortar (building) | 2.06 | 15.00 | 0.00 |
| Aggregate | 9.90 | 0.20 | 0.00 |
The adiabatic temperature rise for the macroscopic cemented gravel specimen is 15.23-(1-exp(−0.0208-τ1.2356))°C and for the mortar is 32.55-(1-exp(−0.0208-τ1.2356))°C.
The inversion fine view parameters were brought into the finite-element model for solving to obtain its temperature ephemeral curve and compared with the indoor test results as shown in Figure 4.

Comparison of temperature change curves.
The similar temperature rise trends and close agreement between simulation and experimental results indicate that the numerical analysis of the temperature field for cemented sand and gravel is highly reliable.
To further calculate the thermal stress response, the following fine-scale mechanical parameters shown in Table 3 were used with reference to the relevant literature [27,28].
Parameter description
| Sports event | Coarse aggregate | Mortar (building) | Cohesive sandstone |
|---|---|---|---|
| Coefficient of linear expansion (1/°C) | 8.45 | 15.00 | 8.49 |
| Poisson’s ratio | 0.16 | 0.20 | 0.16 |
3 Thermal stress analysis of cemented gravel considering fine-scale components
3.1 Computational conditions and boundary conditions
In order to explore the distribution and trend of temperature and stress field inside the cemented gravel specimen, the following four working conditions are set as shown in Table 4. Under different working conditions, there are differences in the internal temperature stress field of CSG specimens. In order to explore the distribution and change trend of the internal temperature stress field of CSG specimens and to accurately describe the law, numerical simulation studies were carried out under four working conditions. Among them, working conditions 1 and 2 were compared, working conditions 3 and 4 were compared, working conditions 1, 2, and 3, the microscopic components—such as the distinct phases of mortar and aggregate—were included in the simulation. Only the mortar was assumed to release heat, while the aggregate did not. In contrast, working condition 4 did not consider microscopic components; the specimen was treated as a homogeneous material, and all elements were assumed to release heat uniformly.
Calculate the working conditions and their boundary conditions
| Condition no. | Stress field boundary conditions | Temperature field boundary conditions | Note |
|---|---|---|---|
| 1 | Bottom full constraint | Insulation all around | Model validation, comparison with indoor adiabatic temperature rise test results |
| 2 | Peripheral heat dissipation | Comparison of working conditions 1 | |
| 3 | Two sides insulated, two sides heat dissipation | Consideration of fine-grained components | |
| 4 | Two sides insulated, two sides heat dissipation | Comparison of Case 3 without consideration of fine-grained components |
The temperature field is calculated with an initial pouring temperature of 32.25°C. Case 1 is a verification of the adiabatic temperature rise test, with adiabatic heat all around; Case 2 is a state of full heat dissipation all around, with the third type of boundary conditions; and Cases 3 and 4 are the states of adiabatic heat on the left side and the bottom and heat dissipation on the right side and on the top, with the heat dissipation surface exchanging heat with the external medium. The external ambient temperature is 25°C.
The stress field is analyzed with the model fully constrained at the bottom, and the other faces are free.
The selection of temporal sampling points for temperature field visualization was carefully optimized according to the distinct thermal evolution characteristics of each working condition. For the adiabatic case (Case 1), six representative time points were systematically selected to comprehensively capture the complete thermal transition process, given its relatively gradual temperature variation. In contrast, for the heat dissipation cases (Cases 2–4), the analysis focused on key temporal nodes that most effectively characterize the thermal behavior.
3.2 Analysis of temperature field results
3.2.1 Case 1 (adiabatic temperature rise test verification case)
The simulated specimen tends to an isothermal state.

Cloud picture of temperature distribution changes.
3.2.2 Working condition 2
From Figure 6, comparing the trend of temperature field distribution of Cases 1 and 2 at the same moment, it can be found that the temperature is higher at the same moment in Case 1, the temperature difference is smaller, and the distribution of high-temperature region is different, which is due to adiabatic condition 1, the heat released by the high-temperature mortar is transferred to the low-temperature aggregate, and eventually the internal temperature of the specimen is getting higher and higher, and is maintained at a certain value, while Case 2 is in the state of full dissipation of heat, and heat is exchanged at the boundary, and the temperature is changing more quickly. As time proceeds, the internal temperature of the specimen tends to approach the ambient temperature.

Cloud picture of temperature distribution changes.
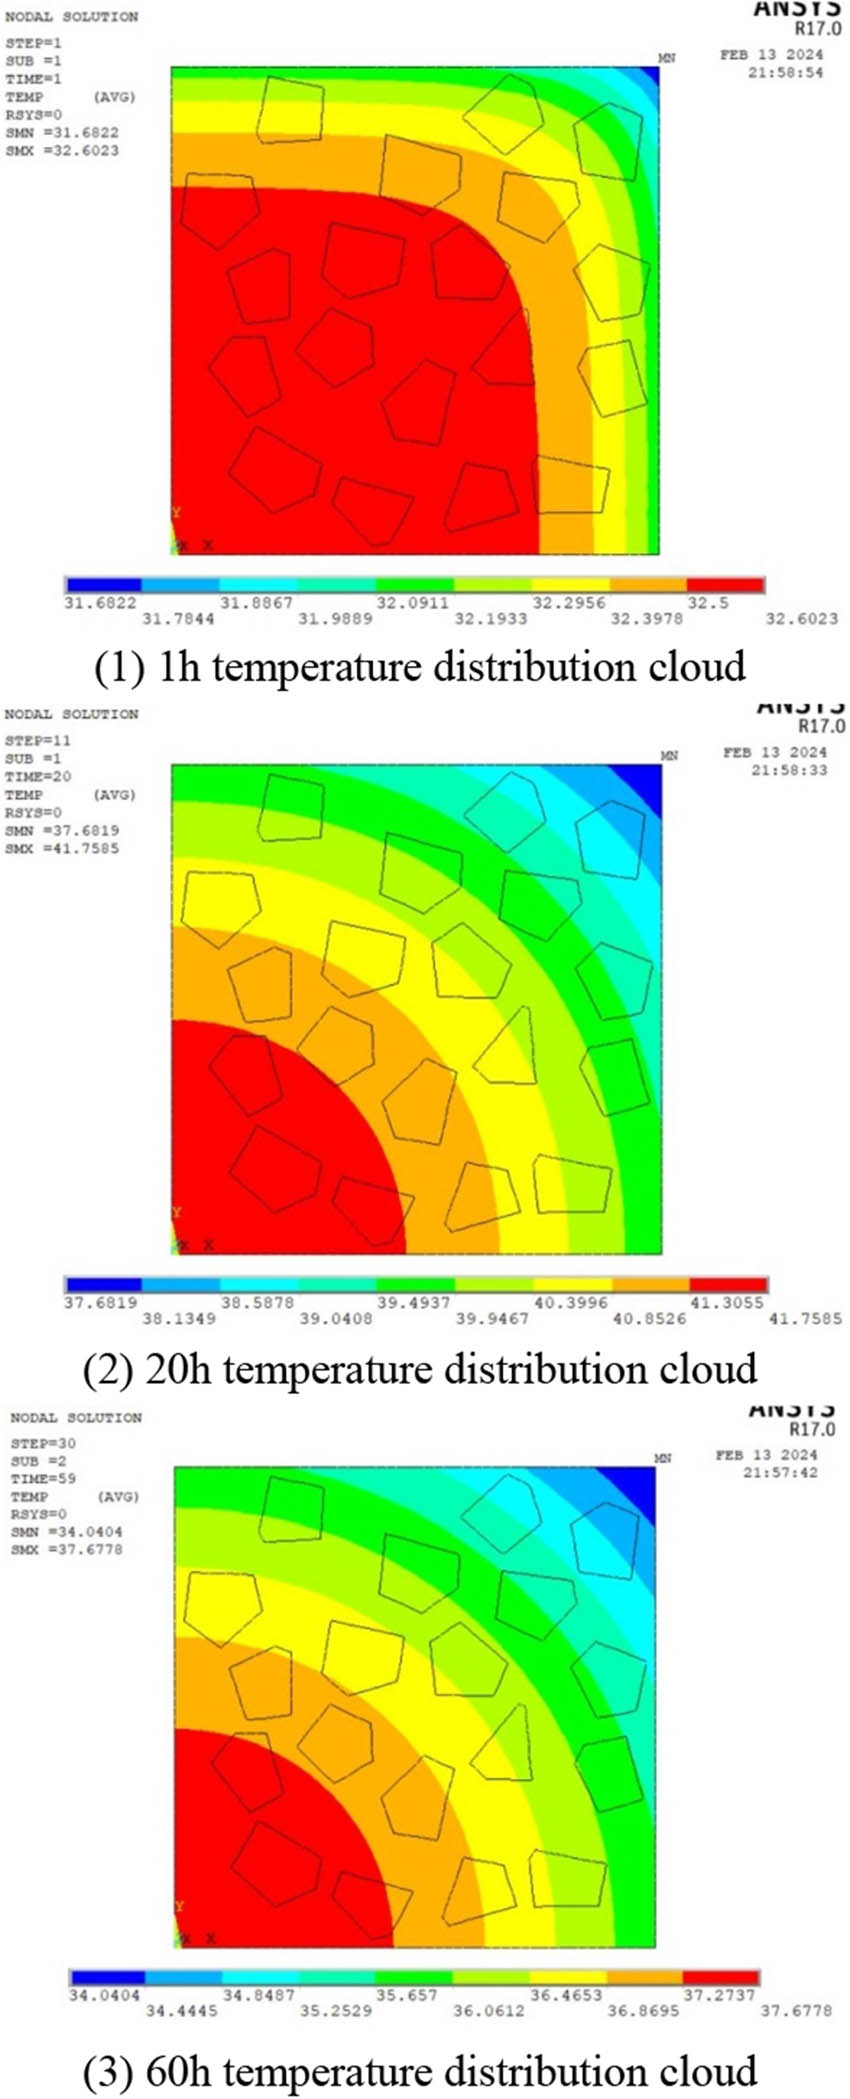
3.2.3 Working condition 3
On the adiabatic surface, the heat released by mortar accumulates and causes a temperature rise, whereas on the heat dissipation surface, although the mortar also releases heat, it is quickly lost to the environment. As hydration progresses and the amount of reactive cementitious material decreases, the temperature distribution gradually becomes more uniform and the temperature difference diminishes.

Cloud picture of temperature distribution changes.
3.2.4 Working condition 4
The comparison of conditions 3 and 4 in Figure 8 shows that the temperature distributions of the two models are not exactly the same, the temperature distribution of the fine model is more drastic, and the temperature difference is larger, which is due to the different material properties of mortar and aggregate, while the temperature distribution of the macroscopic model is relatively moderate, and the macroscopic model considers the cemented gravel as a homogeneous material and pays more attention to the study on the effect of the exotherm of the hydration of the cemented gravel and heat dissipation of the surface of the cemented gravel in contact with the air on the distribution of the temperature field of cemented gravel. It focuses more on the effects of exothermic hydration of cemented gravel and heat dissipation from the surface of cemented gravel in contact with air on the distribution of the temperature field of cemented gravel.
Cloud picture of temperature distribution changes.
3.3 Analysis of stress results
Based on the temperature field results, stress field calculations are performed as shown in Figures 3 4 5 6 7, 3 4 5 6 7 8, 3 4 5 6 7 8 9 and 3 4 5 6 7 8 9 10.

Cloud picture of the first principal stress change.

Cloud picture of the first principal stress change.
3.3.1 Working condition 1
Observing the change of the first principal stress at each moment in Figure 9, it can be seen that the first principal stress of the simulated specimen decreases with time, in which the maximum value of the first principal stress at 1 h is about 0.157 MPa, and the tensile strength at early age is lower, and there is a risk of cracking. The other specimen tensile stress is mainly concentrated in the intersection surface of mortar and aggregate, which is due to the heat released by mortar hydration to the aggregate; there is a temperature difference between the two, but also due to the different moduli of elasticity of the two.
3.3.2 Working condition 2
Comparing the first principal stress of condition 2 and condition 1 in Figure 10, it is found that the maximum first principal stress of condition 2 is greater than that of condition 1 at the same time. This is due to the heat dissipation around the CSG in condition 2, the temperature changes rapidly, the temperature difference is large, and the stress is large.
3.3.3 Working condition 3
Observing the simulation specimen's first principal stress distribution at each moment in Figure 11, it can be seen that 1 h hydration at the beginning of the adiabatic surface causes the temperature to gradually increase and the temperature change is faster, resulting in a larger first principal stress. The maximum first principal stress is about 0.215 MPa. It can also be seen that 60 h hydration exotherm is basically over, the simulation specimen temperature gradually tends to the ambient temperature, and the temperature difference change is small. The maximum first principal stress is about 0.0155 MPa.
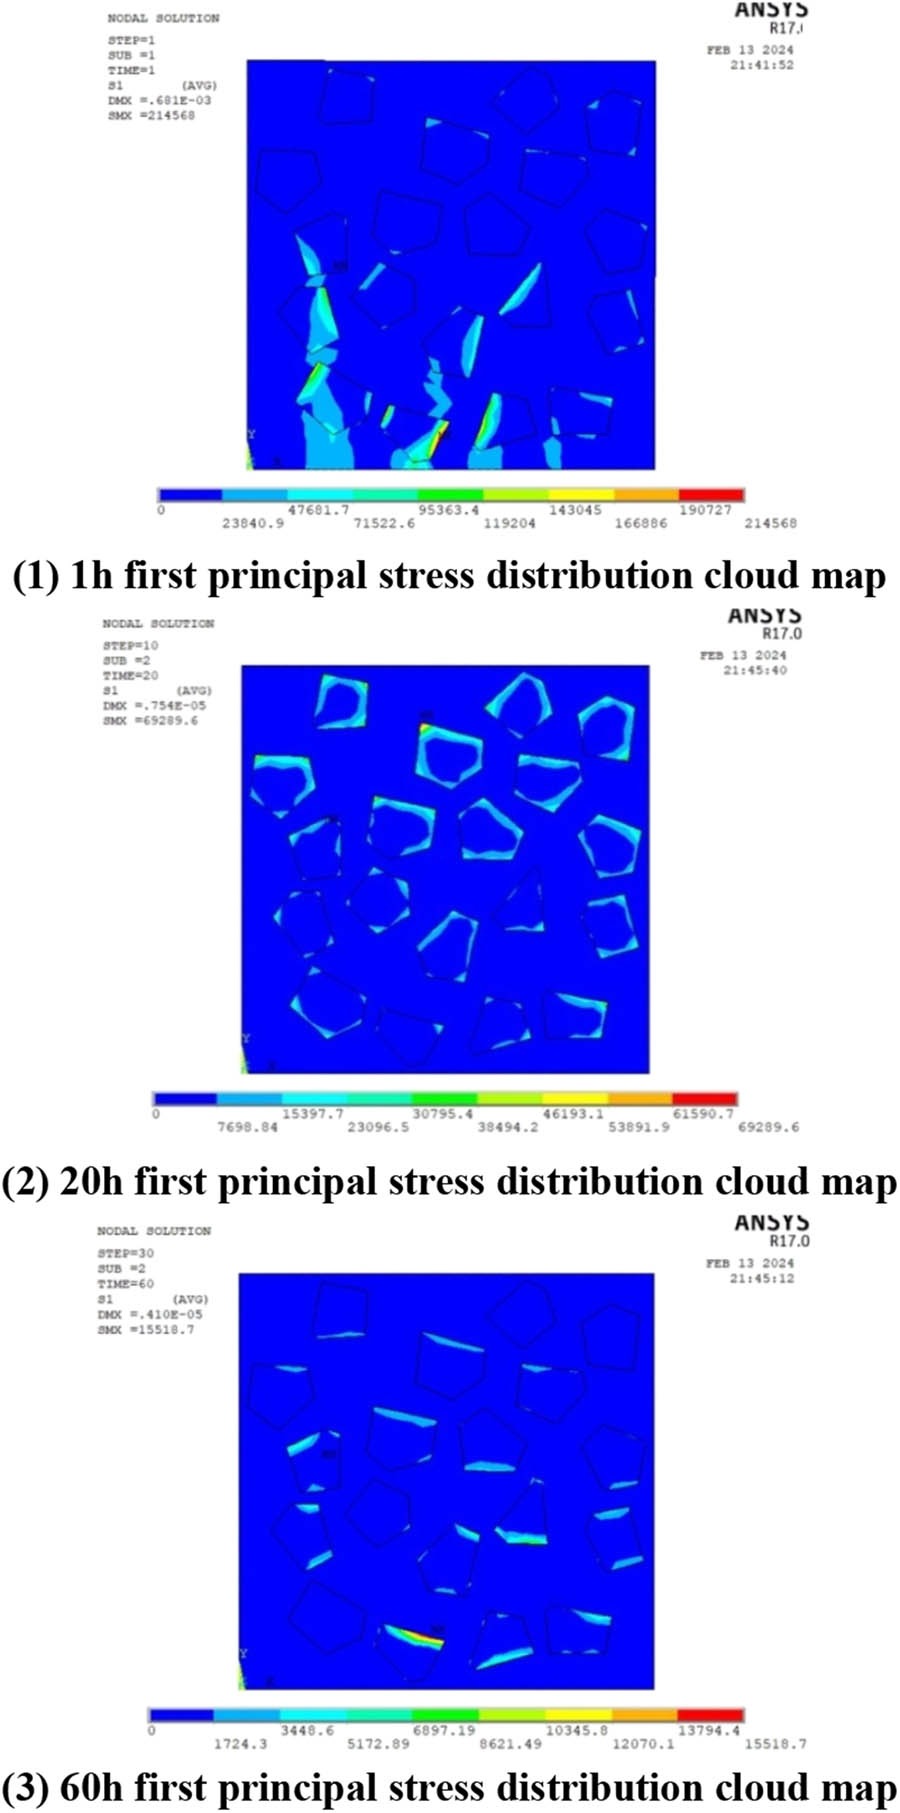
Cloud picture of the first principal stress change.
3.3.4 Working condition 4
As shown in Figure 12, compared with working condition 4 and working condition 3, the first principal stress of working condition 4 is small, mainly distributed at the boundary of the heat dissipation surface, while the maximum first principal stress in working condition 3 is concentrated on the intersection surface of mortar and aggregate. The reason is that in working condition 4, the CSG are regarded as homogeneous materials, and the heat is transferred to the heat dissipation surface. The gradient here is large, and the stress is large. However, in working condition 3, the mortar is exothermic, and the aggregate is not exothermic. There is a temperature difference between the two. Due to the random distribution of aggregate, the stress distribution shows the characteristics of concentration and dispersion. In addition, as the weak link of stress, the interface is easier to crack, which is the focus of future attention.

Cloud picture of the first principal stress change.
4 Conclusion
In this article, according to the characteristics of CSG aggregate, the random polygon aggregate model is established by using ANSYS finite-element software. According to the test results of CSG, the meso parameters are inverted, and the temperature stress variation law of CSG considering meso parameters and not considering meso parameters under different working conditions is studied. The following conclusions are obtained:
Under different boundary conditions, the temperature field distribution of CSG is different. In the case of considering the meso-component, the temperature of the CSG specimen in the adiabatic state gradually increases with time. There is a certain temperature difference between the mortar and the aggregate inside the specimen, and it gradually tends to be isothermal with time. The temperature of the CSG specimen in the heat dissipation state increases first and then decreases with time and gradually maintains an isothermal state with the ambient temperature. The temperature gradient changes rapidly. The internal temperature difference of the specimen is large at the heat dissipation boundary, and the temperature difference between the mortar and the aggregate is not obvious.
The magnitude of the first principal stress of CSG changes with the change of temperature difference. The greater the temperature difference, the greater the first principal stress. If the CSG does not consider the microscopic components, the first principal stress increases first and then decreases with time under the heat dissipation state, and the larger stress is concentrated at the boundary heat dissipation. If the meso-components are considered, in the adiabatic state, the first principal stress increases with time in a wave-like manner, and the maximum stress is mainly concentrated on the intersection surface of mortar and aggregate. However, due to the random distribution of aggregate, the maximum stress is dispersed. In the heat dissipation state, the first principal stress increases with time and then decreases. The stress distribution is uneven, and the maximum stress is concentrated on the intersection surface of mortar and aggregate.
In summary, considering the finite-element analysis results of meso-components, stress concentration is more likely to occur at the interface, and the risk of cracking is increased due to the low strength of early-age CSG, which provides a theoretical basis for crack control in engineering practice.
-
Funding information: This study was funded by the third section of the project scientific research service project (HNYJJH/JS/FWKY-2021003) of the Yangtze River to Huaihe River Project (Henan section).
-
Author contributions: All authors have accepted responsibility for the entire content of this manuscript and consented to its submission to the journal, reviewed all the results, and approved the final version of the manuscript. L.G. designed the study and conducted the experiments; T.L. developed the random aggregate model and performed numerical simulations; L.Z. supervised the research, secured funding, and revised the manuscript.
-
Conflict of interest: Authors state no conflict of interest.
-
Data availability statement: All data, models, and code generated or used during the study appear in the published article.
References
[1] Mehta PK. Greening of the concrete industry for sustainable development. Concr Int. 2002 Jul;24(7):23–8.Search in Google Scholar
[2] Karimi S, Farshbaf Aghajani H. The strength and microstructure of cemented sand-gravel (CSG) mixture containing fine-grained particles. Int J Geo-Engineering. 2023 Feb;14(1):5.10.1186/s40703-023-00182-1Search in Google Scholar
[3] Amini Y, Hamidi A, Asghari E. Shear strength–dilation characteristics of cemented sand–gravel mixtures. Int J Geotech Eng. 2014 Oct;8(4):406–13.10.1179/1939787913Y.0000000026Search in Google Scholar
[4] Londe P. The faced symmetrical hardfill dam: A new concept for RCC. Water Power Dam Constr. 1992;19–24.Search in Google Scholar
[5] Jia J, Michel L, Jin F, Zheng C. Cemented material dam (CMD)—An environmentally friendly new dam type. Engineering. 2016;2(4):220–35.10.1016/J.ENG.2016.04.003Search in Google Scholar
[6] Zhu BF. Temperature stress and temperature control of hydraulic concrete structures. Beijing: Water Conservancy and Electric Power Press; 1976. p. 127–31.Search in Google Scholar
[7] Zhu BF. Expression for adiabatic temperature rise of concrete considering temperature effects. J Hydropower Gener. 2003;2:69–73.Search in Google Scholar
[8] Wu P, Guo L, Luo G, Sun M. Freeze-Thaw simulation analysis of cemented sand and gravel dam during operation period based on damage theory. Water Resour Power. 2017;35(1):81–4.Search in Google Scholar
[9] Liu Z, Tian Y, Wang M. Study on temperature stress of cemented sand and gravel dam. Shanxi Archit. 2018;44(30):212–3.Search in Google Scholar
[10] Liu B, He Y, Peng Y. Simulation analysis of temperature field for hardfill dam. Yangtze River. 2008;39(14):92–5.Search in Google Scholar
[11] Wu H, Peng Y, Yuan Y. Study on simplified construction temperature control measures for cemented sand and gravel dam. Water Resour Hydropower Eng. 2015;46(1):76–79+84.Search in Google Scholar
[12] Xu B. Temperature-controlled freeze-thaw simulation of colluvial gravel dams. Master’s thesis. Zhengzhou, China: North China University of Water Resources and Hydropower; 2022.Search in Google Scholar
[13] Fu Y. Study on seepage characteristics and temperature control simulation of cemented sand and gravel dam. Master’s thesis. Zhengzhou, China: North China University of Water Resources and Electric Power; 2021.Search in Google Scholar
[14] Zhao X, He Y. Influence of seepage field on temperature field in cemented sand and gravel dam. Eng J Wuhan Univ (Eng Sci Ed). 2020;53(4):283–92.Search in Google Scholar
[15] Cai X, Jiang M, Guo X, Chen J, Zhao Q. Experimental study on the creep behaviour of cemented sand and gravel (CSG) and temperature stress prediction of CSG dam under seasonal temperature change. Adv Civ Eng. 2020;2020(1):8289520.10.1155/2020/8289520Search in Google Scholar
[16] Chen S, Zheng Y. Study on the evolutionary model and structural simulation of the freeze–thaw damage of cemented sand and gravel (CSG). J Inst Eng (India): Ser A. 2018 Dec;99:699–704.10.1007/s40030-018-0319-2Search in Google Scholar
[17] Jiang M, Cai X, Guo X, Liu Q, Zhang T. Adiabatic temperature rise test of cemented sand and gravel (CSG) and its application to temperature stress prediction of CSG dam. Adv Mater Sci Eng. 2020;2020(1):3898391.10.1155/2020/3898391Search in Google Scholar
[18] Huang Y, Yang Z, Ren W, Liu G, Zhang C. 3D meso-scale fracture modelling and validation of concrete based on in-situ X-ray Computed Tomography images using damage plasticity model. Int J Solids Struct. 2015 Aug;67:340–52.10.1016/j.ijsolstr.2015.05.002Search in Google Scholar
[19] Huang YJ, Guo FQ, Zhang H, Yang ZJ. An efficient computational framework for generating realistic 3D mesoscale concrete models using micro X-ray computed tomography images and dynamic physics engine. Cem Concr Compos. 2022 Feb;126:104347.10.1016/j.cemconcomp.2021.104347Search in Google Scholar
[20] Feng W, Jia J, Ma F. Study on mix proportion design parameters of cemented sand and gravel material. Water Resour Hydropower Eng. 2013;44(2):55–8. 10.13928/j.cnki.wrahe.2013.02.022.Search in Google Scholar
[21] Guo Q, Pei L, Zhou Z, Chen J, Yao F. Response surface and genetic method of deformation back analysis for high core rockfill dams. Computers Geotech. 2016 Apr;74:132–40.10.1016/j.compgeo.2016.01.001Search in Google Scholar
[22] Wang J, Wu L, Mi K, Wen Q. Numerical simulation of two-dimensional random polygonal aggregate model for three-graded concrete. Yangtze River. 2015;46(11):71–5.Search in Google Scholar
[23] Guo L, Duan Y, Sun M. Adiabatic temperature rise model and its application for cemented sand and gravel material. Yellow River. 2016;38(7):89–91.Search in Google Scholar
[24] Wang Y, Sun X. Research on adiabatic temperature rise model of concrete. J Highw Transport Res Dev (Appl Technol Ed). 2017;13(10):31–3.Search in Google Scholar
[25] Sun J, Ge B, Li S, Zhao Y, Sun F. Research on modification of concrete adiabatic temperature rise model. N Build Mater. 2023;50(6):17–21.Search in Google Scholar
[26] Huang H, Li P, Huo W, Zhang X. Study on macro- and meso-parameters and failure modes of cemented sand and gravel materials. J North China Univ Water Resour Hydropower (Natural Science Edition). 2020;(04):27–38. 10.19760/j.ncwu.zk.20200046.Search in Google Scholar
[27] Li S. Research on the influence of aggregate characteristics on the properties of cemented sand and gravel and optimization. Master’s thesis. Zhengzhou, China: North China University of Water Resources and Hydropower; 2022.Search in Google Scholar
[28] Lu Q, Zhu X, Hui Y Influence of thermal expansion coefficient on thermal stress in concrete. Water Resour Power. 2010;28(8):106–7+170.Search in Google Scholar
© 2025 the author(s), published by De Gruyter
This work is licensed under the Creative Commons Attribution 4.0 International License.
Articles in the same Issue
- Research Articles
- Investigation on cutting of CFRP composite by nanosecond short-pulsed laser with rotary drilling method
- Antibody-functionalized nanoporous silicon particles as a selective doxorubicin vehicle to improve toxicity against HER2+ breast cancer cells
- Study on the effects of initial stress and imperfect interface on static and dynamic problems in thermoelastic laminated plates
- Analysis of the laser-assisted forming process of CF/PEEK composite corner structure: Effect of laser power and forming rate on the spring-back angle
- Phase transformation and property improvement of Al–0.6Mg–0.5Si alloys by addition of rare-earth Y
- A new-type intelligent monitoring anchor system for CFRP strand wires based on CFRP self-sensing
- Optical properties and artistic color characterization of nanocomposite polyurethane materials
- Effect of 200 days of cyclic weathering and salt spray on the performance of PU coating applied on a composite substrate
- Experimental analysis and numerical simulation of the effect of opening hole behavior after hygrothermal aging on the compression properties of laminates
- Engineering properties and thermal conductivity of lightweight concrete with polyester-coated pumice aggregates
- Optimization of rGO content in MAI:PbCl2 composites for enhanced conductivity
- Collagen fibers as biomass templates constructed multifunctional polyvinyl alcohol composite films for biocompatible wearable e-skins
- Early age temperature effect of cemented sand and gravel based on random aggregate model
- Properties and mechanism of ceramizable silicone rubber with enhanced flexural strength after high-temperature
- Buckling stability analysis of AFGM heavy columns with nonprismatic solid regular polygon cross-section and constant volume
- Reusable fibre composite crash boxes for sustainable and resource-efficient mobility
- Investigation into the nonlinear structural behavior of tapered axially functionally graded material beams utilizing absolute nodal coordinate formulations
- Mechanical experimental characteristics and constitutive model of cemented sand and gravel (CSG) material under cyclic loading with varying amplitudes
- Synthesis and properties of octahedral silsesquioxane with vinyl acetate side group
- The effect of radiation-induced vulcanization on the thermal and structural properties of Ethylene Propylene Diene Monomer (EPDM) rubber
- Review Articles
- State-of-the-art review on the influence of crumb rubber on the strength, durability, and morphological properties of concrete
- Recent advances in carbon and ceramic composites reinforced with nanomaterials: Manufacturing methods, and characteristics improvements
- Special Issue: Advanced modeling and design for composite materials and structures
- Validation of chromatographic method for impurity profiling of Baloxavir marboxil (Xofluza)