Analysis of the laser-assisted forming process of CF/PEEK composite corner structure: Effect of laser power and forming rate on the spring-back angle
-
Zhihong Dai
 ,
Qiuyu Miao
,
Qiuyu Miao

Abstract
Carbon fiber-reinforced polyether ether ketone (CF/PEEK) is commonly used in the aerospace industry due to its high specific strength. The laser-assisted forming process shows potential to enhance the efficiency of forming thermoplastic composites and enabling in situ forming. However, when forming CF/PEEK corner structures with laser assistance, the shape accuracy of the part is limited by the spring-back resulting from prepreg bending. This article focuses on investigating the phenomenon of bending spring-back in thermoplastic composite parts. Through laser-assisted heating forming experiments and finite-element simulations, the effects of laser power and forming rate on the spring-back angle of single-layer CF/PEEK parts are analyzed. The process parameter distribution curve for achieving the minimum spring-back angle is determined. The corner structure demonstrates the least spring-back deformation, with a spring-back angle of 1.77°, at a forming rate of 1,700 mm/min, and a laser power of 63 W. At lower temperatures, the spring-back deformation is mainly influenced by the residual stress. The main mechanism of spring-back deformation of resin at high temperatures is the increase of bending caused by deconsolidation. This study offers theoretical guidance for achieving precision molding of multilayer thermoplastic composite bending structures.
1 Introduction
Thermoplastic resin-based composites possess advantages such as high specific strength, short production cycles, and low molding temperatures. They also exhibit excellent impact toughness, recyclability, chemical resistance, and easy storage, making them promising for a wide range of applications [1,2]. Carbon fiber-reinforced polyether ether ketone (CF/PEEK) composites, as specialized thermoplastic resin-based materials, exhibit specific strength and high-temperature performance. It has been extensively utilized in the aerospace industry.
The forming processes for thermoplastic resin-based composites include manual layup and automated layup. For continuous fiber-reinforced semi-crystalline thermoplastic resin matrix composites represented by CF/PEEK, the advent of automated placement processes provides an efficient and accurate forming method for this material. The automated placement process is divided into two processes according to the width of the prepreg: automated fiber placement (AFP) and automated tape placement (ATP), and the ATP process can also be referred to as automated tape laying (ATL). Based on the automated placement process, laser-assisted automated placement processes (LAFP, LATP, LATL) further enhance process efficiency by introducing high-energy density lasers. Automated layup processes, such as AFP and ATL, offer rapid forming rates and high product precision, playing a crucial role in establishing reliable and efficient large-scale manufacturing supply chains [3]. Laser-assisted forming, leveraging the high energy density of lasers, can achieve even higher forming rates.
The research on forming corner structures has primarily focused on stress and spring-back prediction. Most of these studies have examined traditional processes such as autoclave molding, stamping forming, and roll forming [4,5,6,7,8]. However, when laser-assisted forming processes are used to manufacture thermoplastic composite corner structures, spring-back occurs, resulting in significant angular discrepancies in the final product. Miao et al. [9] investigated the influence of different roller pressures and the number of layers of the sample on the spring-back angle of corner forming. They also analyzed the mechanisms behind spring-back deformation. Furthermore, laser-assisted forming of CF/PEEK corner structures is a complex multi-field coupling process with complex stress–strain fields. Additionally, it exhibits coupling with the nonlinearity of thermoplastic composites. Hence, there is a lack of theoretical guidance on deformation control of bending spring-back.
Laser-assisted forming technologies, exemplified by LAFP, have significantly improved the molding efficiency of fiber-reinforced composite materials. Dai et al. [10] used a multi-scale finite-element method to study the bending spring-back mechanism of CF/PEEK composites, revealing that internal fiber kinking and residual stress are the primary mechanisms causing deformation. Shen et al. [11] proposed a dielectric method to monitor the crystallization development of glass fiber-reinforced polypropylene during the LAFP process, validating its potential in quality control. Ma et al. [12] developed a bottom-up analytical framework to predict the mechanical properties of CCF/PEEK composites under high-temperature conditions. In the manufacturing and forming processes, deformation control of fiber composites is a critical issue. Hwang [13] investigated the residual stresses in fiber-reinforced polymer composite laminates, which cause warpage in flat structures and angle changes in corner structures, potentially leading to mismatch problems in advanced assemblies. Dai et al. [10] and Shen et al. [11] further demonstrated that internal fiber kinking and residual stress are the main mechanisms causing deformation and that dielectric methods can effectively monitor and control these deformations. These studies collectively highlight the importance of LAFP and LAC technologies in the manufacturing of fiber-reinforced composites, as well as the crucial role of deformation control and advanced monitoring techniques in improving the quality and efficiency of the forming process.
Carbon fiber-reinforced polymer composites (CFRP) lattice core sandwich structures (Figure 1) have been successfully used as lightweight, high-strength, and multifunctional materials [14] in both natural materials and various real-world engineering applications [15]. CF/PEEK lattice core sandwich structures show great potential for aerospace applications, particularly for aircraft thermal insulation.

Sandwich structures with carbon fiber-reinforced pyramidal lattice truss core.
Spring-back deformation is a critical factor that affects the precision of forming angles during the laser-assisted bending of corner structures. Controlling spring-back deformation is essential in determining the shape accuracy of the final product. However, there is currently a lack of theoretical guidance on the application of this process. This article focuses on studying the spring-back phenomena in CF/PEEK prepreg tapes during the laser-assisted forming process. The study includes experiments and finite-element simulations to analyze the influence of laser power and forming rate on the spring-back angle. The finite-element method is employed to investigate the spring-back deformation of continuous fiber prepreg tapes on the forming die edges. A finite-element model of CF/PEEK single-layer prepreg tape is established using the ABAQUS software, and the spring-back mechanism is analyzed using the finite-element method. The model parameters are experimentally characterized to validate the accuracy of the simulation results.
2 Methodology
2.1 Corner structure forming experiment
The bending angle in the lattice core sandwich structure typically ranges between 30° and 70°. In this study, a 40-degree angle was chosen. To determine the spring-back angle of the component, the change in angle in the normal direction of the straight-edge end face is measured [16]. After the forming process and cooling to room temperature, the angle between the horizontal plane and the inclined plane on the lattice specimen is measured using a universal angle ruler with a precision of 2′. Since the inclined surface forms a 40-degree angle with the horizontal, the angle of the sample becomes 140° ± θ after forming, where θ represents the spring-back angle. The unidirectional AS4/PEEK prepreg used in this study has a PEEK mass fraction of 34 wt%. It has a glass transition temperature of 143°C and a melting point of 343°C. The prepreg has a thickness of 0.16 mm and a width of 5 mm.
The forming process is illustrated in Figure 2(a), and the experimental equipment is shown in Figure 2(b). In Figure 2(b), the laser head is located at the top, and the cylinder is on the right. The cylinder connects the laser head and the placement bracket, while the roller is installed on the bracket through a pair of bearings, allowing control of the vertical pressure exerted on the sample on the mold. A continuous fiber laser with a power source of 300 W, a wavelength of 1,070 nm, a beam diameter of 15 mm, and a Gaussian beam profile is used. The forming process involves the synchronized movement of the laser head and the press roller, both fixed to a three-coordinate test bench. The maximum rate of movement is 1,850 mm/min, and the minimum laser output power is 30 W. The pressure roller has a diameter of 3 mm, and the mold has a width of 10 mm and a height of 8.5 mm. Both the pressure roller and the mold are made of 304 stainless steel. To create the lattice structure, the laser is projected vertically onto the prepreg. The laser head and cylinder remain fixed relative to each other, while the press roller moves vertically, driven by the cylinder, to conform to the lattice structure mold. A compacting force of 5 N is applied. The temperature history of the upper surface of the material at the corner is measured using an infrared thermometer type IPE140 from LUMASENSE IMPAC (indicated by the red dashed line in Figure 2(a)). The temperature measurement range of the device is 50–1,200°C. Additionally, a cooling fan is used on the side of the prepreg mold to create forced convection, preventing the prepreg from burning and contaminating the laser head. The process parameters are shown in Table 1.
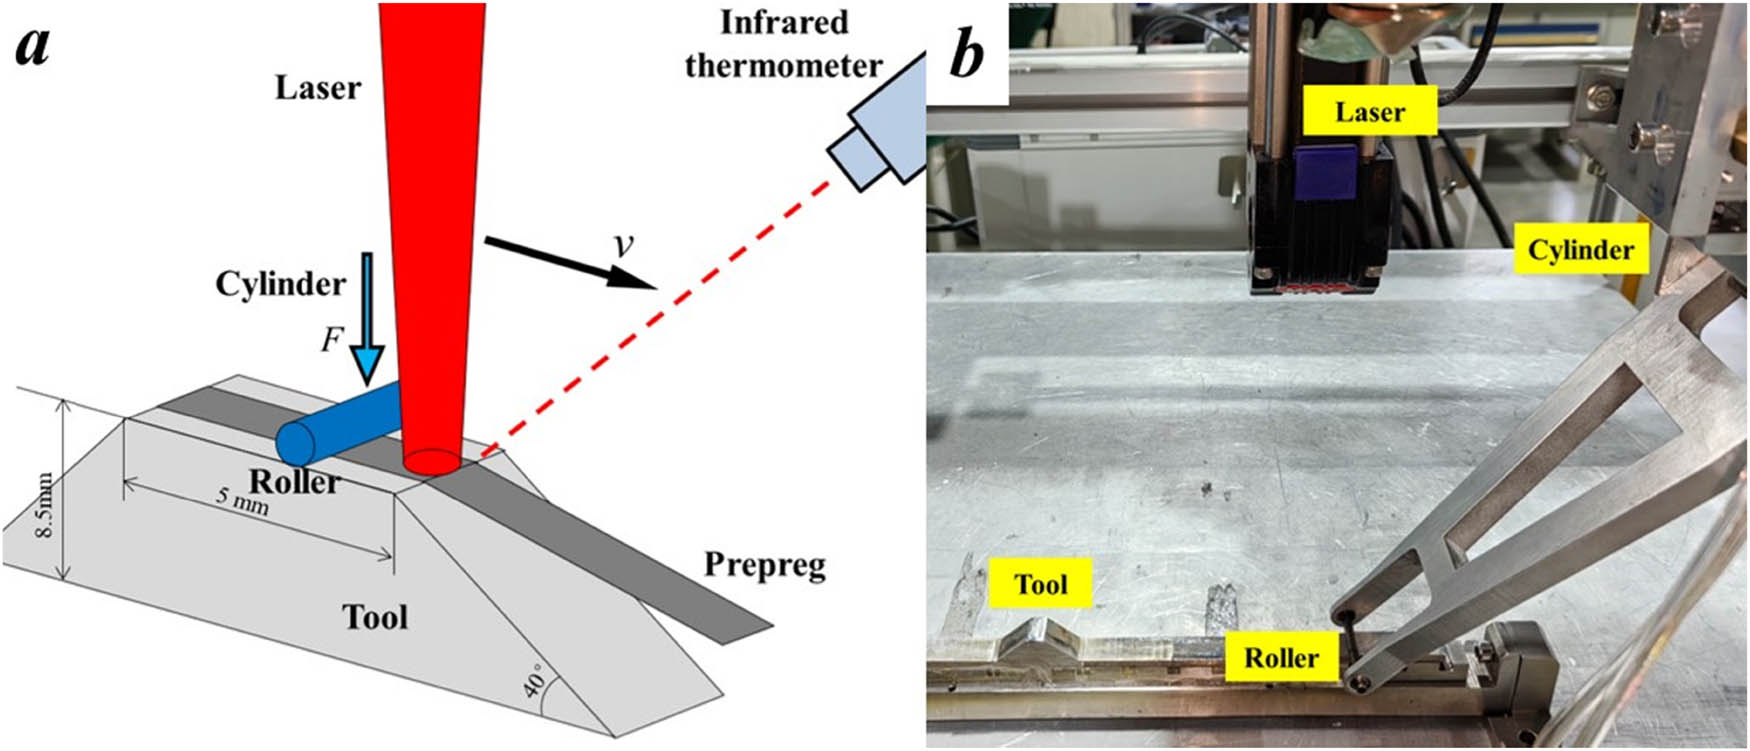
Laser bending forming experiment: (a) process diagram and (b) equipment diagram.
Experimental parameters
| Number | Forming rate v (mm/min) | Laser power P (w) |
|---|---|---|
| 1 | 500 | 36 |
| 2 | 800 | 36 |
| 3 | 1,100 | 36 |
| 4 | 1,400 | 36 |
| 5 | 1,700 | 36 |
| 6 | 1,700 | 45 |
| 7 | 1,700 | 54 |
| 8 | 1,700 | 63 |
| 9 | 1,700 | 72 |
| 10 | 1,000 | 45 |
| 11 | 1,200 | 54 |
| 12 | 1,400 | 63 |
2.2 Thermo-mechanical finite element model
In this article, a finite-element simulation was conducted to analyze the spring-back mechanism of CF/PEEK corner structures. The properties of CFRP are known to be highly temperature-dependent; therefore, a temperature finite element analysis was performed. This analysis involved a two-dimensional (2D) transient temperature-displacement coupled analysis, with a focus on calculating the temperature field at the corner during the process of laser-forming lattice structures. The heat transfer equation used in this analysis is as follows:
In this equation, ρ represents the density of the prepreg, c represents the specific heat capacity of the prepreg, T represents the temperature, t represents the time, k x (T) and k y (T) represent the thermal conductivities of the prepreg along and perpendicular to the fiber direction, respectively, and φ represents the heat generation per unit time per unit area from the heat source.
Both the upper and lower surfaces of the prepreg, as well as the mold, undergo forced convection heat transfer with the surrounding air, as follows:
The contact thermal resistance h between the prepreg tape and the mold or pressure roller is set to be 1,000–1,650 W/m2 K [17,18], and this study adopts a value of 1,650 W/m2 K.
A Gaussian heat source is used to simulate the effect of a Gaussian laser on the material. For the 2D model, the energy density formula of the Gaussian surface heat source is as follows:
The laser power P and the radius of the laser beam spot r l are important parameters. The absorbance of the material to the laser β remains stable at 90% for an incidence angle of 0–50° for CF/PEEK [19].
In the finite-element software ABAQUS, a 2D finite-element model was used to simulate the bending of composite materials. 2D solid elements were employed to calculate the deformation of the prepreg tape. Figure 3 illustrates the setup, where the prepreg tape is placed on the mold with a freely rotating roller positioned above it. The roller experiences rolling friction with the material and moves horizontally. Figure 3(a) demonstrates the coupled heat-deformation analysis used to calculate the temperature field, with the prepreg deformed to fit the mold. The prepreg is constructed using a 2D four-node cell with a mesh size of 0.075 × 0.1 mm, while the mold and pressure roller are constructed using a 2D three-node triangle and a 2D four-node cell. Figure 3(b) presents the dynamic mechanical analysis, where the time-dependent temperature field calculated in Figure 3(a) is imported to simulate the deformation spring-back of the prepreg. Both the tool and the roller are modeled as analytical rigid bodies, and the friction coefficient between the material and the mold is set to 0.2. Additionally, there is forced convection between the prepreg tape and air due to the presence of a cooling fan. During the forming process, the material’s temperature is transferred to the mold and roller and also undergoes natural convection with the air and forced convection. The heat source is implemented through heat flow, simulating the synchronous movement of the laser. The rate on the horizontal plane is consistent with the rate of movement along the inclined surface. Figure 3(c) illustrates the specimen after undergoing bending and spring-back. The Mises equivalent stress history at the node located at the corner of the bend (indicated by a red circle) is recorded to facilitate the analysis of the spring-back deformation mechanism.

Single-layer prepreg tape forming finite element model: (a) temperature model, (b) spring-back model, and (c) spring-back model stress.
The heat flux is applied to the upper edge of the prepreg tape, while the heat flow remains constant in the vertical direction. To calculate complex temperature fields that change over time, the ABAQUS subroutine “vdflux” is used to apply the moving heat source.
The in-plane properties and out-of-plane bending properties of unidirectional fiber-reinforced composite materials are distinct [20]. To accurately represent the nonlinearity of the prepreg tape properties, two separate finite-element models are developed. One model is based on the material’s tensile state along the fiber direction, which is applicable for conditions such as the outer side of the neutral layer during bending where the fibers primarily bear the tensile load. In this model, the prepreg is considered a linear elastic material. The other model is designed for compressive states, such as the inner side of the neutral layer during bending where both fibers and resin matrix share the load. In this case, a simplified Johnson–Cook plasticity model is utilized to calculate stress. These modeling approaches are implemented through the “vumat” subroutine in the ABAQUS finite-element software.
The yield stress in the simplified Johnson–Cook model is as follows:
where A, B, m, and n are the model constants,
The stress analysis of the bending angle of the prepreg is conducted based on the elastic–plastic constitutive relationship. 2D plane strain elements are utilized, and the temperature field is imported as a predefined field. Simulations are performed to calculate the spring-back deformation of the samples under various experimental parameters.
The ABAQUS/Explicit solver, which is fully capable of handling geometric nonlinearity, is utilized to compute the significant deformations that occur during the bending forming of unidirectional composite material prepreg tapes. This solver employs a central difference method, which is well-suited for dealing with nonlinearities and large deformations. To reduce computational costs, varying mass scaling factors are employed during non-critical phases. However, during critical phases (from the point where the roller reaches the start of the ramp’s radius to the end of the material), smaller mass scaling factors are chosen. The spring-back phase after forming is complete requires less time for the explicit solver due to its shorter duration.
3 Results and discussion
3.1 Process window
Based on the preliminary exploratory experiments, we identified the usable high-temperature boundary, where we observed apparent burning of the prepreg, and the low-temperature boundary, where we observed obvious bending spring-back of the prepreg with spring-back angles of 10° or more. To visualize these boundaries, we plotted the high-temperature and low-temperature boundaries on a process window (Figure 4). Table 2 provides the process parameters for each group and the corresponding measured spring-back angles of the specimens.

Process window of laser-assisted forming corner structure.
Experimental results of peak temperature and spring-back angle
| Forming rate v[mm/min] | Laser power P [w] | Peak temperature [℃] | Spring-back angle [°] |
|---|---|---|---|
| 500 | 36 | 812 | 8.57 |
| 800 | 36 | 646.4 | 2.33 |
| 1,100 | 36 | 514.9 | 5.07 |
| 1,400 | 36 | 422.8 | 7.03 |
| 1,700 | 36 | 384.3 | 8.70 |
| 1,700 | 45 | 484 | 5.83 |
| 1,700 | 54 | 567 | 3.83 |
| 1,700 | 63 | 650 | 1.77 |
| 1,700 | 72 | 734 | 2.80 |
| 1,000 | 45 | 681.1 | 2.30 |
| 1,200 | 54 | 736.4 | 3.00 |
| 1,400 | 63 | 759.9 | 3.23 |
In the process window shown in Figure 4, the high-temperature boundary is indicated by the color red, where the sample burned vigorously, and a visible flame was observed. Conversely, the low-temperature boundary is indicated by the color blue, below which the temperature of the prepreg is too low, and the PEEK resin fails to melt sufficiently. It is important to note that a significant error occurs when the spring-back angle exceeds 10°.
3.2 Effect of process parameters on peak temperature
The peak temperature T p in Table 2 is fitted using a composite function of a conic function and a quadratic function to obtain the surface that represents the peak temperature. The specific surface equation is shown in Equation (5) and Table 3, and the shape of the surface is depicted in Figure 5
Parameters for the surface representing the peak temperature
| Parameters | aT | bT | x0T | y0T | a2T | a0T | γT | hT |
|---|---|---|---|---|---|---|---|---|
| Value | 4,051 | 139.55 | 3,573 | −46.52 | 0.006851 | 371.95 | 0.6574 | −499.99 |

Peak temperature distribution surface.
The experimental groups 1–9 data in Table 1 are divided into two groups, 1–5 and 5–9, and presented as bar charts as shown in Figures 6 and 7. From Figure 6, it is evident that the peak temperature curve at the corner decreases with the increase in forming rate during the prepreg forming process. From Figure 7, it is evident that the peak temperature curve at the corner increases with the increase of laser power during the prepreg forming process. The blue color represents the peak temperature measured by the infrared thermometer in the forming experiment, while the red color represents the peak temperature calculated using the finite-element model. The results obtained from the finite-element simulation calculation and infrared temperature measurement are similar, demonstrating a consistent trend within the range of 500–1,700 mm/min and 36–72 W.

The peak temperature at the corner when the laser power is 36 W.

The peak temperature at the corner when the forming rate is 1,700 mm/min.
When the temperature exceeds the thermal decomposition temperature of PEEK (520°C), thermal decomposition will occur. The C–C and C–O bonds in the PEEK molecular chains will break due to the effect of thermal energy, forming free radicals. These generated free radicals can undergo various reactions, such as recombination, chain transfer, or chain termination, which can lead to the breakage and recombination of molecular chains. As the chain breakage and free radical reactions proceed, volatile small molecules such as water, carbon dioxide, and small organic compounds are generated and escape from the material. At extremely high temperatures, PEEK may char or form cross-linked structures, causing the material to become hard and brittle.
The thermal decomposition rate of PEEK is influenced by various factors, including temperature, time, and oxygen concentration. Under the instantaneous high-temperature conditions of this study, although the thermal decomposition rate of PEEK increases, the brief heating time means that most of the molecular chains do not have enough time to break and recombine, so significant decomposition does not occur.
PEEK, a heat-resistant and flame-retardant polymer, exhibits self-extinguishing properties and has the ability to generate carbon residue autonomously, thereby preventing further combustion [22]. The thermal decomposition process of PEEK involves the initial production of carbon residue to inhibit combustion, followed by the complete decomposition of the polymer. In our test, the sample emitted smoke and experienced slight burning loss.
3.3 Effect of process parameters on the spring-back angle
In the process window shown in Figure 4, it is believed that there is a process parameter curve that can maintain a smaller angle without burning the prepreg bending, considering the distribution pattern of the high-temperature boundary and low-temperature boundary. The experimental spring-back angle results were fitted to produce the optimized spring-back angle process parameter distribution curve, as shown in Figure 8.

Process window of laser-assisted forming corner structure.
For a forming rate of 800 mm/min and a laser power of 36 W, the sample exhibited improved forming results. Therefore, we selected a series of parameters including 800 mm/min and 36 W with constant linear energy density for research. In the process window, the black solid line represents this linear energy density value. Furthermore, the black dotted line represents the distribution of the minimum spring-back angle measured experimentally in the process window. This distribution can be considered the optimal process parameter and is fitted using the elliptical equation (Equation (6)). It can be observed that most of the samples with a constant linear energy density are closer to the high-temperature boundary compared to the optimal process parameters (refer to Table 4)
Parameters for optimal spring-back process parameters
| Parameters | a | b | v0 | P0T |
|---|---|---|---|---|
| value | 3643.66 | 146.48 | 3,185 | −73.95 |
In order to investigate the effect of temperature on material defects, the data obtained from the process window was used to fit the regular surface of CF/PEEK prepreg bending for the spring-back angle. The specific surface equation is presented in Equation (7), Table 5, and Figure 9. Analysis of Figure 9 reveals that the curve in the process window corresponds to the minimum value of the function
Parameters for the surface representing the spring-back angle
| Parameters | aα | bα | x0α | y0α | a2α | a0α | γα | hα |
|---|---|---|---|---|---|---|---|---|
| Value | 3,887 | 156.2 | 3,185 | −73.95 | 4.819 | 4.523 | 0.9376 | −7.833 |

Spring-back angle distribution surface.
Based on the analysis of Figures 10 and 11, it can be observed that the forming rate and laser power range from 500 to 1,700 mm/min and 36–72 W, respectively. With an increase in both the forming rate and laser power, the spring-back angle of the prepreg initially decreases but later increases in size. Comparing the results with Figures 6 and 7, it becomes evident that a decrease in the forming rate or an increase in the laser power leads to a gradual increase in the peak temperature. However, when the forming rate decreases further and the laser power increases beyond a certain point, the process parameters exceed the high-temperature boundary of the process window, resulting in the burning of the prepreg. For instance, in Figure 6, where the laser power is fixed at 36 W, it can be observed that as the forming rate decreases, the peak temperature of the prepreg gradually increases. This increase in temperature leads to a decrease in resin viscosity, making it easier for stress to be released and resulting in a decrease in spring-back. The spring-back angle of the prepreg reaches its local minimum value when the forming rate is decreased to 800 mm/min. However, if the forming rate is further reduced, the prepreg temperature becomes excessively high, leading to an increase in spring-back.

The spring-back angle when the laser power is 36 W.

The spring-back angle when the forming rate is 1,700 mm/min.
The stress change curve at a point inside the prepreg bend angle during the forming process is obtained from the bending spring-back finite-element calculation results. These results are presented in Figures 12 and 13. It can be observed that as the forming rate increases and the laser power decreases, the maximum value of the equivalent stress gradually decreases, and a smaller peak stress corresponds to a smaller spring-back angle. The finite-element model takes into account the viscoelasticity of the resin, so as the forming rate increases, the viscoelastic stress also increases. However, as the rate increases, the temperature decreases, which in turn causes the viscoelastic stress to decrease. The same trend is observed for the yield stress of the Johnson–Cook criterion. An increase in the forming rate directly leads to an increase in the yield stress and indirectly leads to a decrease in the yield stress through temperature. However, compared to the forming rate, the peak temperature has a more dominant effect, causing the viscoelastic stress and yield stress to decrease as the forming rate increases, ultimately resulting in a decrease in the equivalent stress.

Von Mises stress at the inner node of the corner when the laser power is 36 W.

Von Mises stress at the inner node of the corner when the forming rate is 1,700 mm/min.
Figure 13 illustrates the impact of laser power on peak stress while keeping the forming rate constant. The results indicate a negative correlation between peak temperature and peak stress. As the temperature rises, both the yield stress and viscoelastic stress gradually decrease. When the laser power exceeds 45 W, the yield stress mostly surpasses the equivalent stress, resulting in a minimal influence. The temperature directly affects the material’s viscoelastic behavior, which subsequently affects the final stress. Consequently, the finite-element simulation structure demonstrates a decrease in the spring-back angle with increasing temperature. However, this model fails to explain the phenomenon of an increased spring-back angle at high temperatures.
As shown in Figure 14, for samples with constant linear energy density, the peak temperature increases with increasing laser power and forming rate. It can be inferred that under this condition of constant linear energy density, the temperature increase effect caused by the increase in laser power is more significant than the temperature decrease caused by the increase in forming rate. The total energy applied to the prepreg by the laser remains unchanged because the linear energy density is constant. However, the lower the forming rate, the longer the forming time, resulting in increased heat dissipation of the prepreg through thermal conduction to the mold and convective heat loss to the air. Therefore, the peak temperature decreases. Consequently, the peak temperature increases with the increase in the forming rate.

Peak temperature with constant linear energy density.
In samples with constant linear energy density, the rebound angle increases with the increase in forming rate and temperature, as shown in Figure 15. The experimental group with this constant energy density is in the high-temperature zone. As shown in Figure 8, increasing the laser power will gradually raise the temperature, and the deconsolidation, defects, and burning of the prepreg can cause an increase in stiffness and spring-back deformation. As the power and rate continue to increase, the parameters gradually approach the high-temperature boundary process (Figure 8).

The spring-back angle with constant linear energy density.
When process parameters exceed the high-temperature boundary in the process window, prepreg combustion occurs. The closer the process parameters are to the high-temperature boundary within the process window, the more severe the prepreg burning phenomenon becomes. In Figure 8, it can be observed that the experimental group with the constant linear energy density follows the distribution curve of the minimum spring-back value. After 800 mm/min, 36 w, it approaches the high-temperature boundary. In this scenario, it can be inferred that the prepreg is fully heated during the bending deformation process. Consequently, the main cause of spring-back deformation is the defects resulting from excessive temperature. Therefore, in Figure 14, the temperature gradually increases, while in Figure 15, the spring-back angle increases due to the rise in temperature. This model fails to accurately simulate spring-back deformation dominated by high-temperature defects, and the finite-element calculation results do not effectively match the experimental results.
The deformation spring-back in bending forming can be observed as either forward spring-in or reverse spring-back. In traditional processes like stamping, the deformation of the bend is primarily seen as forward spring-back [23,24]. However, in this study, reverse spring-back was observed in all corners. The deformation directions in unidirectional continuous fiber reinforced prepreg bending forming involve different mechanisms, which have been thoroughly explained in reference [9]. The tensile force of the fiber, the viscoelasticity of the resin, and the energy stored in the long molecular chain cause the prepreg to exhibit elastic deformation, leading to a tendency to spring-back in the opposite direction. The rapid cooling of the resin molecular chain does not allow complete relaxation, resulting in the freezing of some stress within the PEEK matrix. As a result, stress release causes the sample to tend to spring-back in the reverse direction. Furthermore, the uneven temperature distribution within the sample leads to uneven pre-clamping and density distribution of the prepreg. The bottom of the sample exhibits higher crystallinity and more severe shrinkage, causing the prepreg to tend to spring-back forward.
The article primarily investigates the impact of laser power and forming rate on spring-back deformation as the laser power increases. When the resin reaches full flow, the viscoelasticity of the resin decreases, resulting in a decrease in the potential energy of the molecular chain and residual stress. This decrease causes the material to spring-back in the opposite direction. However, higher temperatures lead to a larger temperature gradient within the sample, a greater difference in crystallinity in the thickness direction, and a tendency for positive spring-back. On the other hand, as the forming rate increases, the temperature of the prepreg decreases, which has an opposing effect to that of the laser power. Additionally, the rolling friction of the pressure roller induces molecular chain orientation and extension on the upper surface of the prepreg, causing the sample to rise. This phenomenon becomes more pronounced with higher rolling friction. In the case of corner forming, maintaining the same rates for the horizontal plane and the inclined plane results in a smaller support force and rolling friction at the corner, leading to a less noticeable upwarping effect on the sample.
The above mechanism can explain the rebound mechanism of the prepreg at low temperatures, which is reflected in the finite-element model. However, it does not provide an explanation for the phenomenon of the spring-back angle increasing at high temperatures.
Figure 16 presents cross-sectional views in two directions of a series of samples with a fixed laser power of 36 W. It can be observed that as the forming rate decreases, the defects in the samples become more evident. Figure 16 presents a representative micrograph, showing clear deconsolidation phenomena [25,26,27]. These phenomena are observed in samples processed at (500 mm/min, 36 W) and (800 mm/min, 36 W) (Figure 16(d) and (e)). These phenomena include fiber decompaction, as indicated by the red box in Figure 16(d), and the presence of cavities, as highlighted by the red box in Figure 16(e). In the sample with a forming rate of 800 mm/min and a laser power of 36 W (Figure 16(e)), noticeable pores and fibers decompaction are seen in the upper fibers [28,29]. The low-temperature sample (Figure 16(f)) exhibits minimal expansion and has less impact on the bending spring-back, resulting in a smaller spring-back angle. However, at high temperatures (Figure 16(d)), the surface resin fluidity increases, reducing the ability of the surface resin matrix to constrain the fibers. This leads to further deconsolidation of the fibers due to residual stresses, causing a significant increase in prepreg thickness, bending stiffness, and spring-back angle. Additionally, pore defects not only increase the spring-back angle of single-layer composite materials but also contribute to crack formation, reducing the interlayer bonding performance of multilayer prepregs [30] and ultimately compromising the load-bearing capacity of composite materials.

Micrograph of the representative sample with a laser power of 36 W. Fiber direction (a) 500 mm/min, (b) 800 mm/min, and (c) 1,700 mm/min. Vertical fiber direction (d) 500 mm/min, (e) 800 mm/min, and (f) 1,700 mm/min.
In Figure 17, representative specimens with a forming rate of 1,700 mm/min, similar to those with a laser power of 36 W, are displayed. For the sample with a forming rate of 1,700 mm/min, as the laser power increases, defects also become increasingly evident. In the specimen with a forming rate of 1,700 mm/min and a laser power of 72 W, the part near the upper surface experiences decompaction (red box in Figure 17(d)) due to the elevated temperature, resulting in an increase in the spring-back angle.

Micrograph of the representative sample with a forming rate of 1,700 mm/min. Fiber direction (a) 72 W, (b) 63 W, and (c) 36 W. Vertical fiber direction (d) 72 W, (e) 63 W, and (f) 36 W.
In Figure 8 of the process window, it is observed that as the process moves along the solid line with a constant linear energy density, the distance to the high-temperature boundary first increases and then decreases. Figure 18 shows the cross-section of representative specimens with a constant linear energy density. Since the samples with constant linear energy density are all within the high-temperature region, defects can be observed in all the samples. As the forming rate gradually increases from the bottom to the top, the decompaction phenomenon becomes more pronounced in the specimens of (1,400 mm/min, 63 W) and (800 mm/min, 36 W) (Figure 18(e) and (h)). The (800 mm/min, 36 W) specimen exhibits more obvious pore defects (red box in Figure 18(h)), while the (1,400 mm/min, 63 W) specimen not only has noticeable pore defects but also experiences significant fiber decompaction on the upper surface (red box in Figure 18(e)). The pore defects cause the specimen to thicken and its bending performance to become stronger. The fiber decompaction on the upper surface leads to the bending of the upper surface fibers, shortening the length of the upper surface fibers in the direction of material length, resulting in the sample’s upward curvature and an increase in the spring-back angle.

Micrograph of the representative sample with constant linear energy density. Fiber direction (a) 63 W, (b) 54 W, (c) 45 W, and (d) 36 W. Vertical fiber direction (e) 63 W, (f) 54 W, (g) 45 W, and (h) 36 W.
4 Conclusion
This study aims to investigate the bending spring-back phenomenon of single-layer prepregs by analyzing temperature measurements, finite-element simulations, and stress calculations. The key findings are as follows:
The spring-back mechanism in low-temperature conditions primarily relies on the elastic behavior of carbon fibers and the viscoelasticity of PEEK. As the temperature rises, the residual stress gradually diminishes, leading to a decrease in the spring-back angle.
The spring-back mechanism in high-temperature cases primarily addresses the deconsolidation phenomenon resulting from voids, fiber decompaction, increased prepreg thickness, and increased bending stiffness. As the temperature rises, the deconsolidation phenomenon becomes more severe, leading to a greater spring-back angle.
The minimum spring-back angle of 1.77° was achieved when the forming rate was set to 1,700 mm/min, and the laser power was 63 W. To obtain the optimized process parameter distribution curve, the surface was fitted with experimental results. This curve resulted in specimens with smaller residual stresses, less deconsolidation, and reduced spring-back.
Acknowledgments
This work was supported by the National Key R&D Program of China (No. 2023YFB4605901) and the National Natural Science Foundation of China (Nos. 52375312 and 51790172).
-
Funding information: This work was supported by the National Key Research and Development Program of China (Grant Number 2023YFB4605901) and the National Natural Science Foundation of China (Grant Numbers 52375312 and 51790172).
-
Author contributions: Zhihong Dai: investigation, methodology, validation, formal analysis, visualization, writing – original draft. Qiuyu Miao: investigation, writing – review & editing. Guangyi Ma: supervision, writing – review & editing. Fangyong Niu: supervision, writing – review & editing. Dongjiang Wu: supervision, methodology, writing – review & editing, funding acquisition.
-
Conflict of interest: The authors state no conflict of interest.
-
Data availability statement: The raw/processed data required to reproduce these findings cannot be shared at this time due to time limitations.
References
[1] Han Z, Li Y, Fu H, Shao Z. Thermoplastic composites fiber placement process research. J Mater Eng. 2012;2:91–6.Suche in Google Scholar
[2] Zheng H, Zhang W, Li B, Zhu J, Wang C, Song G, et al. Recent advances of interphases in carbon fiber-reinforced polymer composites: A review. Compos Part B: Eng. 2022;233:109639.10.1016/j.compositesb.2022.109639Suche in Google Scholar
[3] Almushaikeh AM, Alaswad SO, Alsuhybani MS, AlOtaibi BM, Alarifi IM, Alqahtani NB, et al. Manufacturing of carbon fiber reinforced thermoplastics and its recovery of carbon fiber: A review. Polym Test. 2023;122:108029.10.1016/j.polymertesting.2023.108029Suche in Google Scholar
[4] Uriya Y, Ikeuch K, Yanagimoto J. Cold and warm V-bending test for carbon-fiber-reinforced plastic sheet. Procedia Eng. 2014;81(634):1633–8.10.1016/j.proeng.2014.10.203Suche in Google Scholar
[5] Lynam C, Milani AS, Trudel-Boucher D, Borazghi H. Predicting dimensional distortions in roll forming of comingled polypropylene/glass fiber thermoplastic composites: On the effect of matrix viscoelasticity. J Compos Mater. 2014;48(28):3539–52.10.1177/0021998313511650Suche in Google Scholar
[6] Henninger F, Friedrich K. Production of textile reinforced thermoplastic profiles by roll forming. Compos Part A Applied Sci Manuf. 2004;35(5):573–83.10.1016/j.compositesa.2003.12.001Suche in Google Scholar
[7] Zhang C, Duan Y, Xiao H, Hao J, Lou J, Zhang F. Investigation on tempering process parameters of in-situ consolidation CF/PEEK thermoplastic composites. J Manuf Process. 2023;85:345–55.10.1016/j.jmapro.2022.11.070Suche in Google Scholar
[8] Zheng B, Gao X, Li M, Deng T, Huang Z, Zhou H, et al. Formability and failure mechanisms of woven CF/PEEK composite sheet in solid-state thermoforming. Polymers. 2019;11(6):966.10.3390/polym11060966Suche in Google Scholar PubMed PubMed Central
[9] Miao Q, Dai Z, Ma G, Niu F, Wu D. Analysis of spring-back deformation of CF/PEEK thin angled laminates by laser-assisted forming. Compos Struct. 2023;321:117288.10.1016/j.compstruct.2023.117288Suche in Google Scholar
[10] Dai Z, Miao Q, Ma G, Niu F, Wu D. Multi-scale finite element analysis of laser-assisted forming of CF/PEEK composite corner structures. J Reinforced Plast Compos. 2024. Online ahead of print. 10.1177/07316844241296602.Suche in Google Scholar
[11] Shen G, Hu J, Chen C, Li M, Wang X, Ying Z, et al. In-situ crystallization process monitoring of thermoplastic composites by dielectric sensing during laser-assisted automated fiber placement. J Manuf Process. 2024;124:479–88.10.1016/j.jmapro.2024.06.020Suche in Google Scholar
[12] Ma X, Wen L, Xiao J, Wang S, Lei M. Bottom-up analysis framework for the continuous multidirectional carbon fiber-reinforced PEEK composite laminates. Polym Compos. 2023;44(12):9026–48.10.1002/pc.27754Suche in Google Scholar
[13] Hwang S-F. An overview of angle deviations of fiber-reinforced polymer composite angular laminates. Materials. 2023;16(13):4844.10.3390/ma16134844Suche in Google Scholar PubMed PubMed Central
[14] Liu S, Li Y, Li N. A novel free-hanging 3D printing method for continuous carbon fiber reinforced thermoplastic lattice truss core structures. Mater Des. 2018;137:235–44.10.1016/j.matdes.2017.10.007Suche in Google Scholar
[15] Wu Q, Ma L, Wu L, Xiong J. A novel strengthening method for carbon fiber composite lattice truss structures. Compos Struct. 2016;153:585–92.10.1016/j.compstruct.2016.06.060Suche in Google Scholar
[16] Kappel E. Forced-interaction and spring-in – Relevant initiators of process-induced distortions in composite manufacturing. Compos Struct. 2016;140:217–29.10.1016/j.compstruct.2016.01.016Suche in Google Scholar
[17] Kim HJ, Kim SK, Lee WI. A study on heat transfer during thermoplastic composite tape lay-up process. Exp Therm Fluid Sci. 1996;13(4):408–18.10.1016/S0894-1777(96)00095-7Suche in Google Scholar
[18] Kollmannsberger A, Lichtinger R, Hohenester F, Ebel C, Drechsler K. Numerical analysis of the temperature profile during the laser-assisted automated fiber placement of CFRP tapes with thermoplastic matrix. J Thermoplast Compos Mater. 2017;31(12):1563–86.10.1177/0892705717738304Suche in Google Scholar
[19] Stokes-Griffin CM, Compston P. Optical characterisation and modelling for oblique near-infrared laser heating of carbon fibre reinforced thermoplastic composites. Opt Lasers Eng. 2015;72:1–11.10.1016/j.optlaseng.2015.03.016Suche in Google Scholar
[20] Lichtinger RF. Thermo-mechanical coupled simulation of the thermoset automated fibre placement process, Ph.D. thesis. Munich: Technical University of Munich; 2015.Suche in Google Scholar
[21] Szablewski P, Kobza W. Numerical analysis of peirce’s cantilever test for the bending rigidity of textiles. Fibres Text East Europe. 2003;11(4):54–7.Suche in Google Scholar
[22] Liu Q, Peng X, Wang D, Li Z. Non-isothermal crystallization kinetics of thermotropic liquid crystalline polyarylates/poly(ether ether ketone) s composite fibers. China Synth Fiber Ind. 2022;39(3):4.Suche in Google Scholar
[23] Albert C, Fernlund GR. Spring-in and warpage of angled composite laminates. Compos Sci Technol. 2002;62(14):1895–912.10.1016/S0266-3538(02)00105-7Suche in Google Scholar
[24] Nyman T, Åkermo M, Hallström S. Thickness effect on spring-in of prepreg composite L-profiles – An experimental study. Compos Struct. 2019;209:499–507.10.1016/j.compstruct.2018.10.090Suche in Google Scholar
[25] Çelik O, Peeters D, Dransfeld C, Teuwen J. Intimate contact development during laser assisted fiber placement: Microstructure and effect of process parameters. Compos Part A: Appl Sci Manuf. 2020;134:105888.10.1016/j.compositesa.2020.105888Suche in Google Scholar
[26] Slange TK, Warnet LL, Grouve WJB, Akkerman R. Deconsolidation of C/PEEK blanks: on the role of prepreg, blank manufacturing method and conditioning. Compos Part A: Appl Sci Manuf. 2018;113:189–99.10.1016/j.compositesa.2018.06.034Suche in Google Scholar
[27] Çelik O, Choudhary A, Peeters D, Teuwen J, Dransfeld C. Deconsolidation of thermoplastic prepreg tapes during rapid laser heating. Compos Part A: Appl Sci Manuf. 2021;149:106575.10.1016/j.compositesa.2021.106575Suche in Google Scholar
[28] Patel P, Hull TR, McCabe RW, Flath D, Grasmeder J, Percy M. Mechanism of thermal decomposition of poly(ether ether ketone) (PEEK) from a review of decomposition studies. Polym Degrad Stabil. 2010;95(5):709–18.10.1016/j.polymdegradstab.2010.01.024Suche in Google Scholar
[29] Patel P, Hull TR, Lyon RE, Stoliarov SI, Walters RN, Crowley S, et al. Investigation of the thermal decomposition and flammability of PEEK and its carbon and glass-fibre composites. Polym Degrad Stabil. 2011;96(1):12–22.10.1016/j.polymdegradstab.2010.11.009Suche in Google Scholar
[30] Zhang C, Duan Y, Xiao H, Wang B, Ming Y, Zhu Y, et al. Effect of porosity and crystallinity on mechanical properties of laser in-situ consolidation thermoplastic composites. Polymer. 2022;242:124573.10.1016/j.polymer.2022.124573Suche in Google Scholar
© 2025 the author(s), published by De Gruyter
This work is licensed under the Creative Commons Attribution 4.0 International License.
Artikel in diesem Heft
- Research Articles
- Investigation on cutting of CFRP composite by nanosecond short-pulsed laser with rotary drilling method
- Antibody-functionalized nanoporous silicon particles as a selective doxorubicin vehicle to improve toxicity against HER2+ breast cancer cells
- Study on the effects of initial stress and imperfect interface on static and dynamic problems in thermoelastic laminated plates
- Analysis of the laser-assisted forming process of CF/PEEK composite corner structure: Effect of laser power and forming rate on the spring-back angle
- Phase transformation and property improvement of Al–0.6Mg–0.5Si alloys by addition of rare-earth Y
- A new-type intelligent monitoring anchor system for CFRP strand wires based on CFRP self-sensing
- Optical properties and artistic color characterization of nanocomposite polyurethane materials
- Effect of 200 days of cyclic weathering and salt spray on the performance of PU coating applied on a composite substrate
- Experimental analysis and numerical simulation of the effect of opening hole behavior after hygrothermal aging on the compression properties of laminates
- Engineering properties and thermal conductivity of lightweight concrete with polyester-coated pumice aggregates
- Optimization of rGO content in MAI:PbCl2 composites for enhanced conductivity
- Collagen fibers as biomass templates constructed multifunctional polyvinyl alcohol composite films for biocompatible wearable e-skins
- Early age temperature effect of cemented sand and gravel based on random aggregate model
- Properties and mechanism of ceramizable silicone rubber with enhanced flexural strength after high-temperature
- Buckling stability analysis of AFGM heavy columns with nonprismatic solid regular polygon cross-section and constant volume
- Reusable fibre composite crash boxes for sustainable and resource-efficient mobility
- Investigation into the nonlinear structural behavior of tapered axially functionally graded material beams utilizing absolute nodal coordinate formulations
- Mechanical experimental characteristics and constitutive model of cemented sand and gravel (CSG) material under cyclic loading with varying amplitudes
- Synthesis and properties of octahedral silsesquioxane with vinyl acetate side group
- The effect of radiation-induced vulcanization on the thermal and structural properties of Ethylene Propylene Diene Monomer (EPDM) rubber
- Review Articles
- State-of-the-art review on the influence of crumb rubber on the strength, durability, and morphological properties of concrete
- Recent advances in carbon and ceramic composites reinforced with nanomaterials: Manufacturing methods, and characteristics improvements
- Special Issue: Advanced modeling and design for composite materials and structures
- Validation of chromatographic method for impurity profiling of Baloxavir marboxil (Xofluza)