Functionally graded materials of SS316L and IN625 manufactured by direct metal deposition
-
D. Dev Singh
 ,
Suresh Arjula
,
Suresh Arjula

Abstract
Direct metal deposition (DMD) is a layer-by-layer material addition process. Partial functionally graded material (FGM) blocks of size 26 mm wide × 34 mm thick × 32 mm height were 3D printed based on Taguchi’s L9 approach using a commercial DMD machine equipped with a diode laser. The parameters selected for FGM deposition were laser power, scan velocity, and powder feed rate. The metal powders used for deposition were Stainless Steel 316L (SS316L) and Inconel 625 (IN625). The novelty is the introduction of three gradient layers for joining dissimilar materials of SS316L and IN625. ASTM E8 tensile specimens were cut from each FGM block for testing and characterization. Tensile test results revealed that the thick-layered partial FGM specimen-6 had a high ultimate tensile strength (UTS) of 532.6 MPa at the sixth set of optimum parameters. This is due to the mixed presence of coarser and fine columnar grains and equiaxed grain microstructures. Based on the analysis of variance, scan velocity had a more significant effect on UTS and powder feed rate on micro-hardness. However, a maximum micro-hardness of 202.5 HV was observed in the gradient layers of the ninth sample at the ninth set of parameters. The fractography analysis revealed the ductile failure of specimens.
1 Introduction
The production of functionally graded materials (FGM) and joining dissimilar metals using conventional processes is very difficult. A direct energy deposition (DED) process is an alternative method for overcoming this difficulty. This is because different metal powders can be deposited at a time to build a part. One of the powders fed DED process is direct metal deposition (DMD). It is a tool-less metal powder additive manufacturing process. The DMD produces low-complex parts with strong metallurgical bonding owing to less dilution in small heat-affected zones, which leads to better mechanical properties. It is used for producing fully dense high strength-FGM, cladding, and repairing sophisticated parts [1,2,3,4]. A literature survey revealed that cooling rates from 103 to 104 K/s at solid–liquid interfaces in DED processes resulted in intricate microstructures, very little porosity, and introduced residual stresses [5,6]. The concept of FGM is generated from composite materials combined with dissimilar materials [7,8,9,10]. FGM may be a structural gradient or compositional gradient material. The former can be produced using the powder bed fusion process. The latter can be fabricated using the DED process based on either the gradient path method or the multilayer material (MLM) method [11,12]. In 1987, a Japanese scientist group developed a thermal barrier plate of 10 mm thickness using ceramics and metals for high-temperature gradient aerospace applications [13,14].
The available Scopus literature data from 1980 to 2016 revealed that there are 200 journal papers on the production of FGM and 400 journal papers regarding the analysis of FGM. Among the total quantities of metallic FGM components produced by DMD, laser cladding, powder bed fusion, and laser-engineered net shaping (LENS) were 47%, 25%, 16%, and 12%, respectively [15,16]. For the processing of various steels in additive manufacturing, the powder bed fusion processes 68% of steels, direct energy deposition 28%, binder jetting 3% and electron beam melting 1%. Several studies have been conducted on the processing of Stainless Steel 316 L (SS316L), H13 tool steel, and low-alloy steel using various DED processes [17].
The FGM exhibits changes in the properties in one or multiple directions across the geometry to withstand extreme service conditions [18,19]. These materials have low weights, high strength, and resistance to corrosion and are novel and heterogeneous. Their applications include the automotive, aerospace (gas turbine compressor and combustion chamber), defense, nuclear plant, and marine sectors [20,21,22,23]. In 1997, the first MLM deposition for fabricating FGM parts using SS316, IN690, and MM10 powders by LENS was developed. The thermal history of the melt pool and deposited parts was evaluated using a thermocouple technique; however, mechanical testing was not performed [24,25]. The formations of transition joints were formed by DED using SUS316L and Inconel 625 (IN625) powders. Maximum tensile strength of 550 MPa and micro-hardness varying from 200 to 430 HV were found. If the gradient layers were to be introduced in between SUS316L and IN625, perfect joining could take place instead of direct joining. Here, seven specimens were randomly deposited, but the Taguchi method was not used [26]. The influence of processing parameters on the height deposition of the samples was experimented by using a DMD machine. The samples were printed based on Taguchi’s L9 approach. It was concluded that scan velocity was a significant influencing parameter on the height deposition followed by powder flow rate and laser power. However, metal powders used for deposition were not reported [27]. Other transition joints of multilayer materials were also produced by DED using ferritic and austenitic steel powders. The magnetic response, porosity, and variation in the residual stresses were evaluated in that study. However, mechanical properties were not investigated [28,29,30,31,32]. Dissimilar materials of SS316L and IN625 were joined by the introduction of a single compositional zone in the middle using the pre-mixed powders of 50% SS316L and 50% IN625 by DED. It was revealed that the deposit had a UTS of 605.7 MPa, yield strength of 405.6 MPa, and micro-hardness changing from 170 to 210 HV. The author utilized only one powder composition of 50% SS316L and 50% IN625 and did not use other powder compositions for deposition [33]. A thin five-layered FGM was deposited using a DED system with continuous variation from SS316L to IN625 powders. The micro-hardness varied from 225 to 277 HV. Other properties were also studied [34]. The synonym of FGM is functionally integrated materials. Multilayer material samples having smooth edges were deposited using a DED machine using powder compositions of 10% SS316L + 90% Hynes282 and 50% SS316L + 50% Hynes282. It is suggested that for producing very smooth edges, a gradient path method is preferable to the multilayer material method [35]. The tensile properties of DED deposited SS316L specimens can be increased by the addition of Ti powder to the desired quantity. It is also required to know the hardness at Ti content [36]. A DED machine may be equipped with a lateral, discrete coaxial, or continuous coaxial nozzle. The continuous coaxial nozzle is most commonly used in various DED systems due to its high powder capture efficiency during the deposition for producing desired parts [37]. The UTS of 1029.9 MPa, yield strength of 822.7 MPa, and micro-hardness variation of 216.7 to 355.7 HV for gradient path FGM with changing powder composition of 100% SS316L to 100% IN625 from bottom to top was produced by using laser DMD. Here, Taguchi’s method is not used for determining the optimum process parameters [38,39]. The same concept was repeated for the powder combinations of SS304L and IN625, SS316L and Satellite-6, and SS316L and IN718 to produce the respective gradient path FGM. Fine grain micro-structure and improved micro-hardness were observed. It is indicated that brittle phases may form when the IN625 content is between 10 and 30% and more than 80% [40,41,42,43,44]. Transition gradient FGM were also produced using Dual Wire Arc Additive Manufacturing (D-WAAM). An FGM made of SS316L and IN625 wire feedstocks with IN625 content less than 20 wt% and more than 80 wt% promoted cracks. This can lower the mechanical properties. However, the mechanical properties were optimized at 50 wt% IN625 content. A similar scenario also occurred in the case of powder-fed DED parts [45]. In the WAAM of IN82 alloy, coarse columnar grains microstructure were formed. These can be converted into equiaxed grains by suitably controlling the cooling rate during solidification for better mechanical properties [46]. The process defects such as porosity and residual stresses in direct metal laser sintering parts can also reduced by suitably cooling for obtaining the required properties [47].
An SS316L specimen was fabricated at 90° by a laser-engineered net shaping machine. The sample had high strength and density in that deposited orientation. The deposition was not done based on either full factorial analysis or Taguchi method [48]. In general, the UTS of pure SS316L and pure IN625 samples produced by DED varied from 480–880 and 882–1,000 MPa respectively [49]. The changes in the tensile strength of FGM and the structures of the wafers were produced by DMD using SS316, Aluminum-Bronze, colmonoy 6, Stellite 6, Stainless Steel 402 (SS402), and tool steel powders [50]. The main advantage of DED is the easy change of the metal powder feeding during deposition to the required quantity. To date, no additive manufacturing standards are available for producing DED parts [51,52].
Currently, industries prefer hybrid manufacturing processes. This is a combination of traditional and additive manufacturing processes. In hybrid DED, components are overbuilt by using any DED machines, and milling operations are generally performed on them [53,54,55,56]. There is a new trend in technology that introduces time as the fourth dimension for the 3D printing of parts. Therefore, these parts are known as 4D printed parts, and their behavior changes with time. Functionally graded shape memory alloys are 4D printed components by DED [57,58,59,60]. The additive manufacturing industries nowadays are integrated into Industry 4.0. Thus, it can share information regarding processing methods, data exchange, and availability of machine tools, supply chain management, and cyber security [61,62,63,64]. Six Sigma methods were also used to develop road maps for the integration of Industry 4.0 [65].
The first objective of the present research is to evaluate the mechanical properties (i.e., ultimate tensile strength and micro-hardness) of FGM specimens made of SS316L and IN625 powders. The second objective is to analyze the microstructure and fractography. However the third objective is the optimization of DMD process parameters. In the present work, gradient path partial FGM blocks were deposited using a commercial DMD machine. Here, partial FGM means having three gradient layers (i.e., three intermediate layers) in its middle region. These layers were defined by the authors. A thick layer (i.e., thickness > 1 mm) of powder deposition was used to deposit partial FGM blocks based on Taguchi’s L9 approach because conducting experiments using Taguchi’s method is inexpensive and gives optimum solution. The metallic powders used for the deposition were SS316L powder, IN625 powder, and their three different combinations of 65% SS316L + 35% IN625, 50% SS316L + 50% IN625, and 30% SS316L + 70% IN625. Here, a new novelty is introduced by depositing three gradient layers (Layer 1: 65% SS316L + 35% IN625, Layer 2: 50% SS316L + 50% IN625, and Layer 3: 30% SS316L + 70% IN625) in the middle of FGM blocks. These layers perfectly joined the two dissimilar materials of SS316L and IN625. In these layers, no formation of brittle phases exists as the presence of IN625 content is between 30 and 80%. However, brittle phases may form when the IN625 content is in the range of 10–30% and more than 80% [40]. It is more appropriate instead of direct joining [26] or an introduction of a single compositional layer between SS316L and IN625 [33]. The values of UTS and micro-hardness of the ASTM E8 sample produced in this research matched and reached the already existing findings [26,33]. From the analysis of variance (ANOVA), it was concluded that scan velocity significantly affected the UTS and powder feed rate on micro-hardness. Finally, failure surface morphology and chemical compositional analyses were performed using GeminiSEM500 and Octane Elite EDAX.
The organization of the present article is as follows. The concepts of FGM and properties of FGM deposited with various combinations of metal powders such as Stainless Steel 316 (SS316), Stainless Steel 316L (SS316L), Stainless Steel 304 L (SS304L), Stainless Steel 402 (SS402), Stainless Steel SUS316L, Inconel 690 (IN690), Inconel 625 (IN625), Inconel 718 (IN718), Inconel 82 (IN82), and micro-melt (MM10) tool steel by various authors are majorly discussed in the introduction of Section 1. This section also explains the use of hybrid additive manufacturing and 4D printing. Section 2 describes the present experimental research work for the combination of SS316L and IN625 metal powder deposition of partial FGM blocks using a commercial DMD machine and the conditions for the characterization of ASTM E8 specimens. The macro-structure, micro-structure, micro-tensile test, micro-hardness, failure surface morphology, and chemical composition analysis of the samples are illustrated in Section 3. The conclusions, mainly covering high UTS and micro-hardness at their respective optimum set of process parameters, are given in Section 4. In this study, the word specimen is synonymously used as a sample. However, compositional layers can be used as gradient layers and gradient zones.
2 Experimental work
2.1 Materials and methods
SS316L and IN625 powders were used for the deposition, and their chemical compositions are listed in Table 1. The morphologies of the powders are shown in Figure 1. These powders were gas-atomized particles with a near-spherical shape, and sizes varied from 50 to 150 µm. The alloy compositions prepared for three gradient layers were 65% SS316L + 35% IN625, 50% SS316L + 50% IN625, and 30% SS316L + 70% IN625. These alloy compositions were deposited in the middle of the FGM blocks to avoid the formation of brittle phases. The metal powders were pre-heated to 60°C for 10 min before the deposition occurred. A stainless-steel 316 (SS316) substrate of size 152.5 mm length × 50 mm wide × 16.5 mm thick was utilized for depositing pure SS316L powder on it and on top of the block pure IN625. The substrate chemical composition is given in Table 1. A DMD machine, shown in Figure 2, was used for the deposition of the metal powders. It was equipped with a double heterostructure laser diode. This laser is produced by a laser-producing unit of Laserline LDF4.000-30. Nine partial FGM blocks of size 26 mm width × 34 mm thickness × 32 mm height were 3D printed vertically with bi-directional scanning using a co-axial nozzle of a commercial DMD machine by Taguchi’s L9 approach. It has a laser power capacity of 100–4,000 W, scan velocity of 10–30 mm/s, and powder feeding rate of 15–50 g/min. A co-axial nozzle having a standup distance of 23 mm with a diode laser of 5 mm beam spot was used for depositing the metal powders of 1.3 mm thick layers with 2 mm hatch spacing. The beam spot size varied from 3 to 5 mm. Its wavelength range was 902–1,030 nm. It has one powder hopper with a powder filling capacity varying from a minimum of 100 g to a maximum of 1.5 kg. The powder carrying gas (with 10–12 L/min) and shielding gas (with 12–15 L/min) used here is argon (Ar).
Chemical compositions of selected substrates and metal powders
| Materials | Ni | Cr | Mo | Mn | Si | P | S | C | Nb + Ta | Ti | Co | Al | Fe |
|---|---|---|---|---|---|---|---|---|---|---|---|---|---|
| SS316 | 9.1 | 15.8 | 2.3 | 1.1 | 0.8 | 0.039 | 0.026 | 0.02 | — | — | — | 0.01 | Bal |
| SS316L | 10.4 | 16.8 | 2.0 | 1.4 | 0.2 | 0.024 | 0.007 | 0.01 | — | — | — | — | Bal |
| IN625 | Bal | 20.8 | 9.0 | 0.1 | 0.1 | 0.001 | 0.003 | 0.01 | 3.69 | 0.2 | 0.06 | 0.12 | 1.69 |
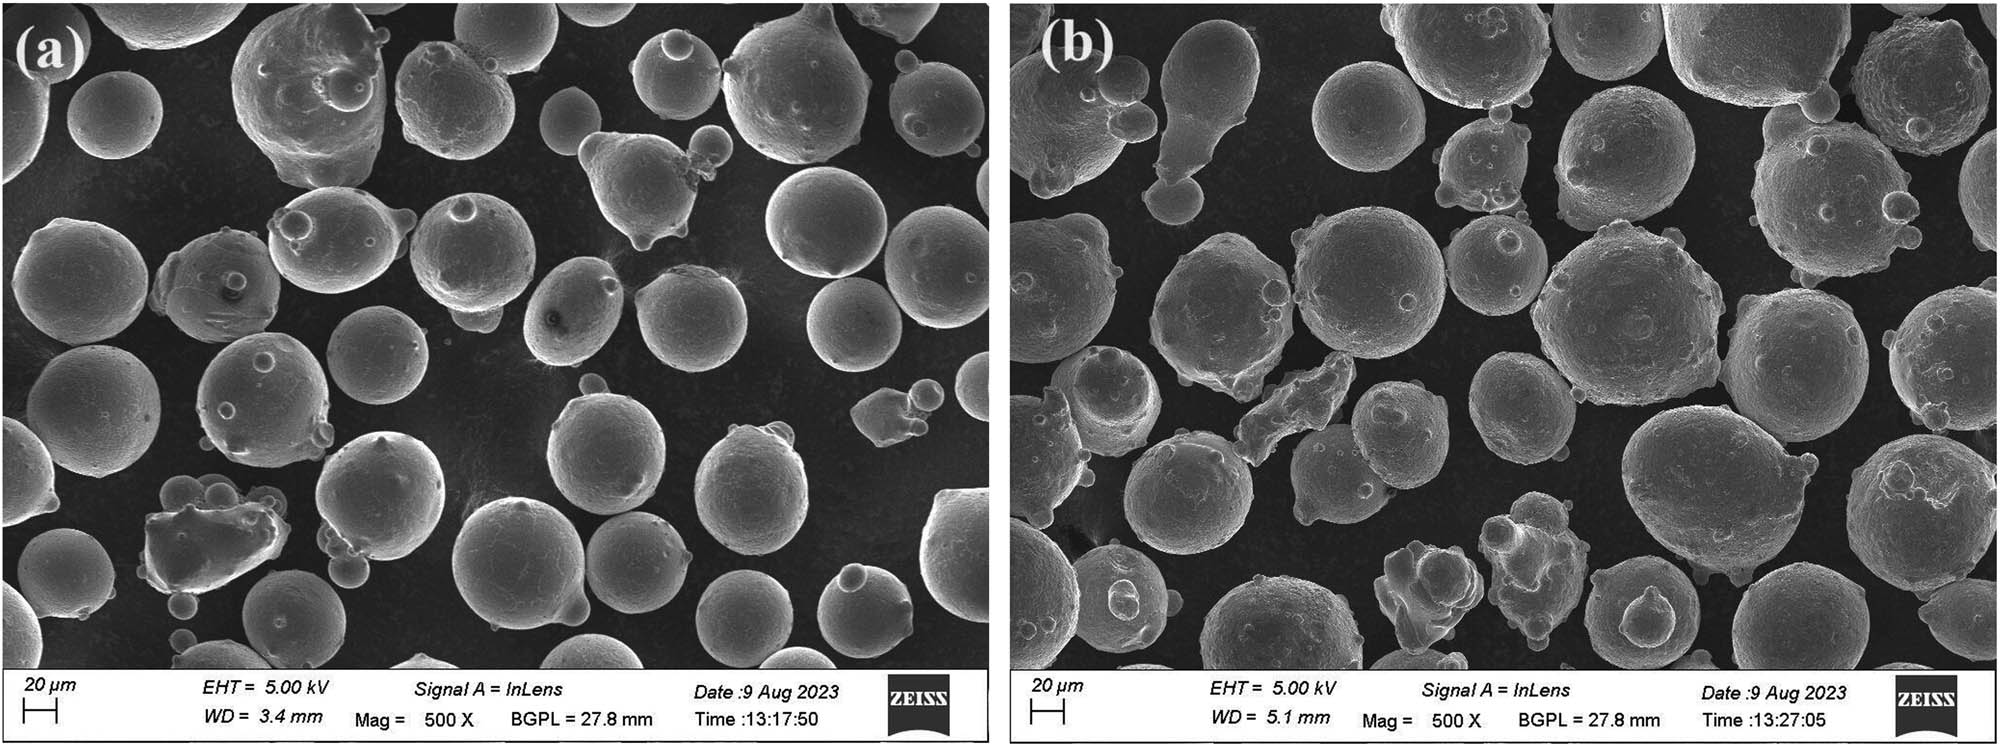
Morphology of (a) SS316L powder and (b) IN625 powder.
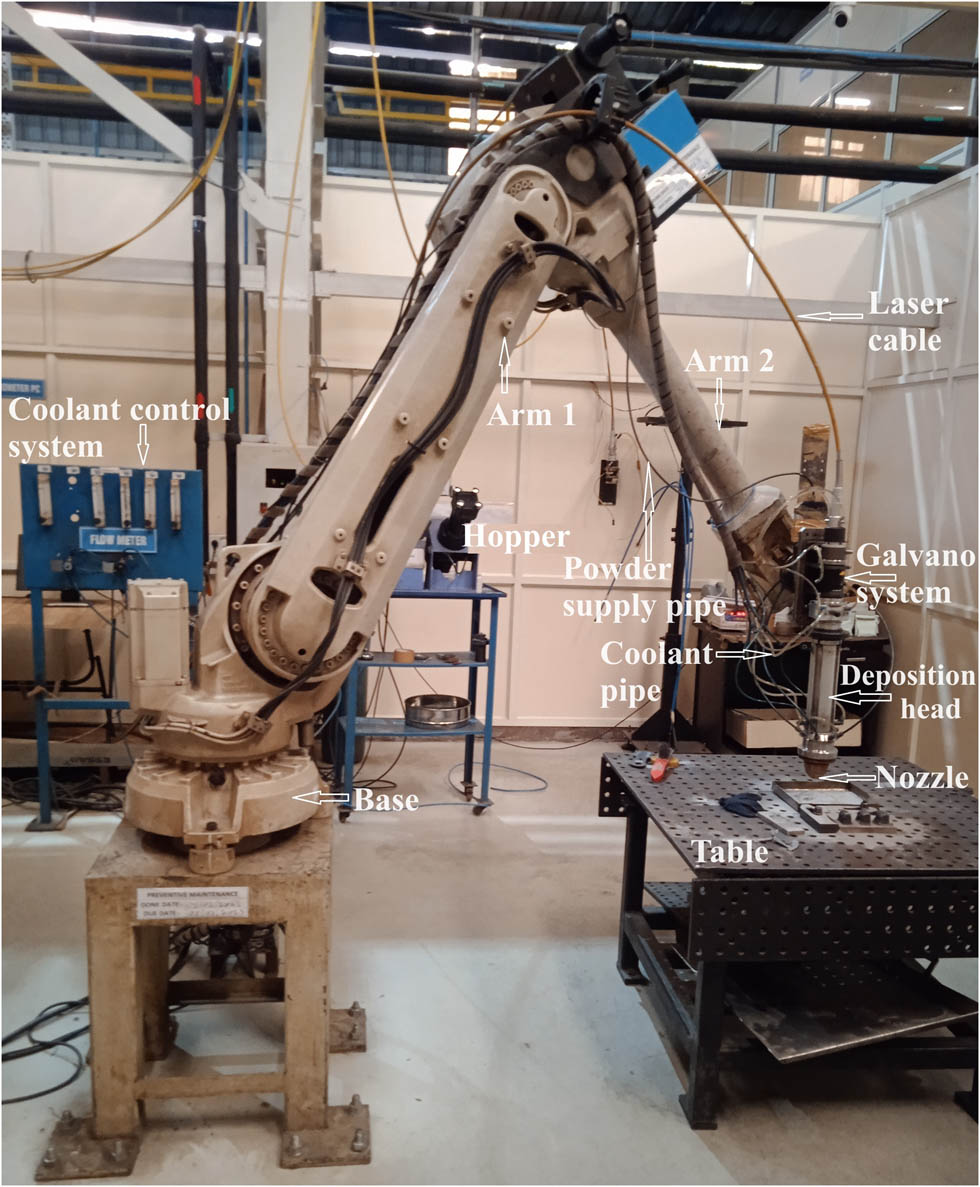
A robot-based direct metal deposition setup.
2.2 Taguchi’s method
The design of the experiments performed was based on full factorial analysis or Taguchi’s method. Therefore, in this research, Taguchi’s method was selected. It consists of eight steps to determine the optimum parameter set. A series of experiments were performed using a commercial DMD machine with the SS316L powder, IN625 powder, and three different powder compositions prepared from the powders of SS316L and IN625. The factors that affected the metal powder deposition on the DMD machine are listed in Table 2. Based on these factors, as shown in Table 2, the most required and influencing factors, such as laser power, scan velocity, and powder feed rate, were selected for powder deposition/experiments and are listed in Table 3. The rationale is the perfect joining of two dissimilar materials of SS316L and IN625 using a DMD rather than a conventional welding process. These factors were also used in many DED processes [66]. Three factors and three levels were selected. Thus, using the Taguchi L9 orthogonal array, only nine experiments were sufficient. The levels of DMD parameters selected for deposition were based on lower laser power with a low scan velocity and low powder feed rate; moderate laser power with a moderate scan velocity and moderate powder feed rate; a high laser power with a higher scan velocity; and a higher powder feed rate for obtaining high strength. However, high strength was obtained at a moderate laser power with a high scan velocity and low powder feed rate (i.e., at six sets of parameters, see Table 4). Table 4 provides the matrix of experiments for the selected values of the factor-based Taguchi L9 orthogonal array. Nine experiments were conducted for the deposition of partial FGM blocks of size 26 mm width × 34 mm thickness × 32 mm height, and one of them is shown in Figure 3. The input variables for FGM depositions are used for obtaining output responses of high strength and hardness, as shown in Table 5.
Factors affecting metal powder deposition
| S. no. | Control factors | Noise factors |
|---|---|---|
| 1 | Laser power (i.e., heat energy) | Smoke formation during deposition |
| 2 | Scan velocity | Formation of swirling due to un-melted powder particles |
| 3 | Powder feed rate | Vibration of commercial DMD machine |
| 4 | Beam spot size | Temperature of atmosphere |
| 5 | Part orientation | Maintenance of the vacuum was not possible because the machine has an open chamber for parts building |
| 6 | Uniform powder deposition for constant thickness of layers using a uniform slicing method | Non-uniform powder deposition for varying thickness of layers using an adaptive slicing method |
| 7 | Coolant flow rate and its temperature | Solidification rate of the melt-pool |
| 8 | Preparation of different powder compositions manually (Ex situ powder mixing) for printing heterogeneous parts | In situ mixing powders in co-axial nozzle |
| 9 | Carrier and shielding gas flow rate | Controlling of oxygen and nitrogen particles |
| 10 | Every time powder carrying pipe was cleaned with compressed air | Automatic manufacturing of heterogeneous parts was not possible. At present, no CAD packages are available for modeling heterogeneous 3D CAD models |
Selection of factors and levels
| Factors (F) | Levels (L) | ||
|---|---|---|---|
| 1 | 2 | 3 | |
| Laser power (P) W | 1,500 | 2,500 | 3,500 |
| Scan velocity (V), mm/s | 10 | 20 | 30 |
| Powder feed rate (M), g/min | 20 | 25 | 30 |
Matrix of experiments
| Experiment no. | Control factors | ||
|---|---|---|---|
| Laser power (P), W | Scan velocity (V), mm/s | Powder feed rate (M), g/min | |
| 1 | 1,500 | 10 | 20 |
| 2 | 1,500 | 20 | 25 |
| 3 | 1,500 | 30 | 30 |
| 4 | 2,500 | 10 | 25 |
| 5 | 2,500 | 20 | 30 |
| 6 | 2,500 | 30 | 20 |
| 7 | 3,500 | 10 | 30 |
| 8 | 3,500 | 20 | 20 |
| 9 | 3,500 | 30 | 25 |
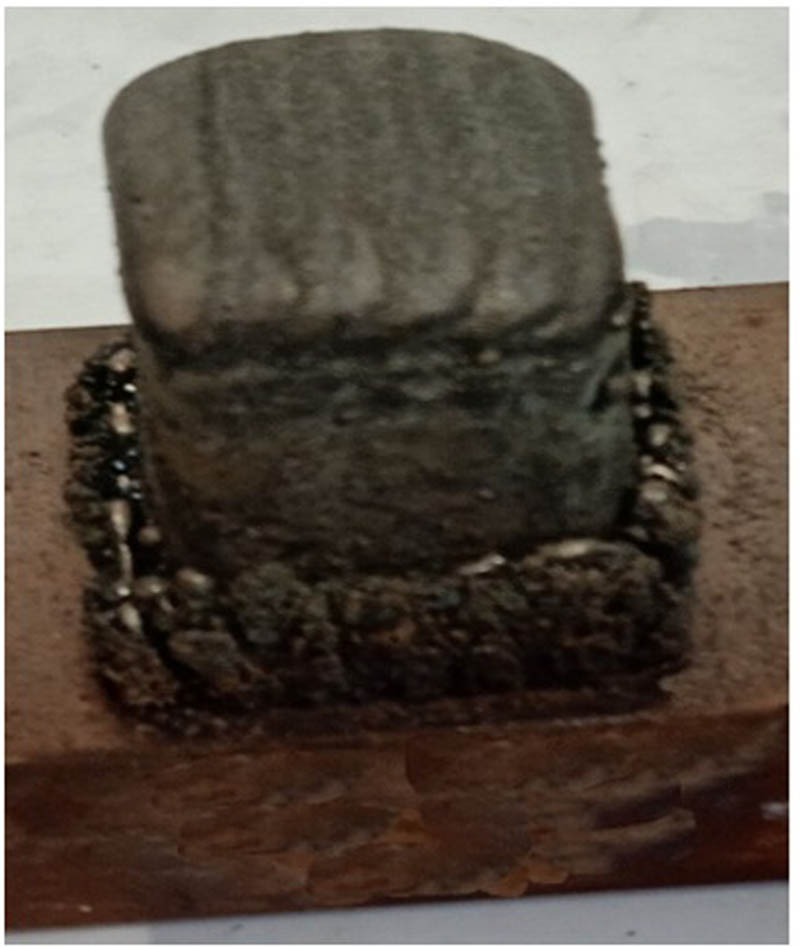
Partial FGM block.
Input variables and output responses
| S. no. | Input variables | Output responses |
|---|---|---|
| 1 | Laser power | High strength and hardness |
| 2 | Scan velocity | High strength and hardness |
| 3 | Powder feed rate | High strength and hardness |
| 4 | Beam spot size (5 mm) | Uniform focusing of laser beam for melting powder particles |
| 5 | Hatch spacing (2 mm) | Proper overlapping of layers |
| 6 | Vertical deposition High strength and hardness | |
2.3 Characterization
Micro-tensile tests were performed on the ASTM E8 samples in the direction perpendicular to the materials deposition using a SHIMADZU micro-tensile testing machine with a capacity of 250 kN. According to ASTM E8 standards, the load applied on the specimens was at a rate of 5 mm/min for a gauge length of 12.5 mm. Figure 4 shows the ASTM E8 tensile specimens cut from each FGM block using an Electronica CNC wire-cut EDM. The ASTM E8 specimen was 9 mm wide, 3 mm thick, and 30 mm height.
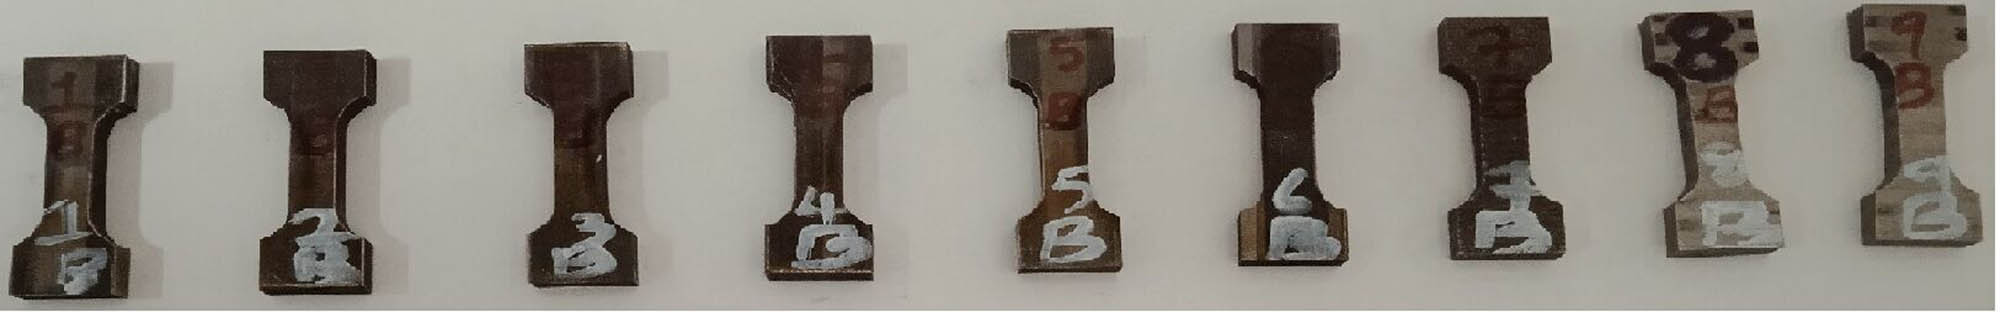
ASTM E8 tensile specimens.
The micro-hardness of nine partial FGM samples was evaluated using an ECONOMET hardness tester. It has a diamond pyramid indenter with an applied load capacity ranging from 5 g to 1 kg. A load of 500 g was applied to the indenter for 15 s at each location perpendicular to the deposition direction. These locations have 0.5 mm interval distances along the center-line of the samples. The micro-hardness indentations on compositional layers of the sample-9 are shown in Figure 5. To understand the gradient zones in a better way, the macro-structure of sample-6 was taken using an Olympus optical microscope, as shown in Figure 6. Micro-structural examination was performed to understand the distribution of phases in various layers of the gradient zones. The morphologies of the fractured surfaces of the broken specimens were captured using a GeminiSEM500 at various magnifications. Chemical compositional analysis was performed using Octane Elite EDAX with the help of GeminiSEM500.
Micro-hardness indentations on compositional layers of sample-9.
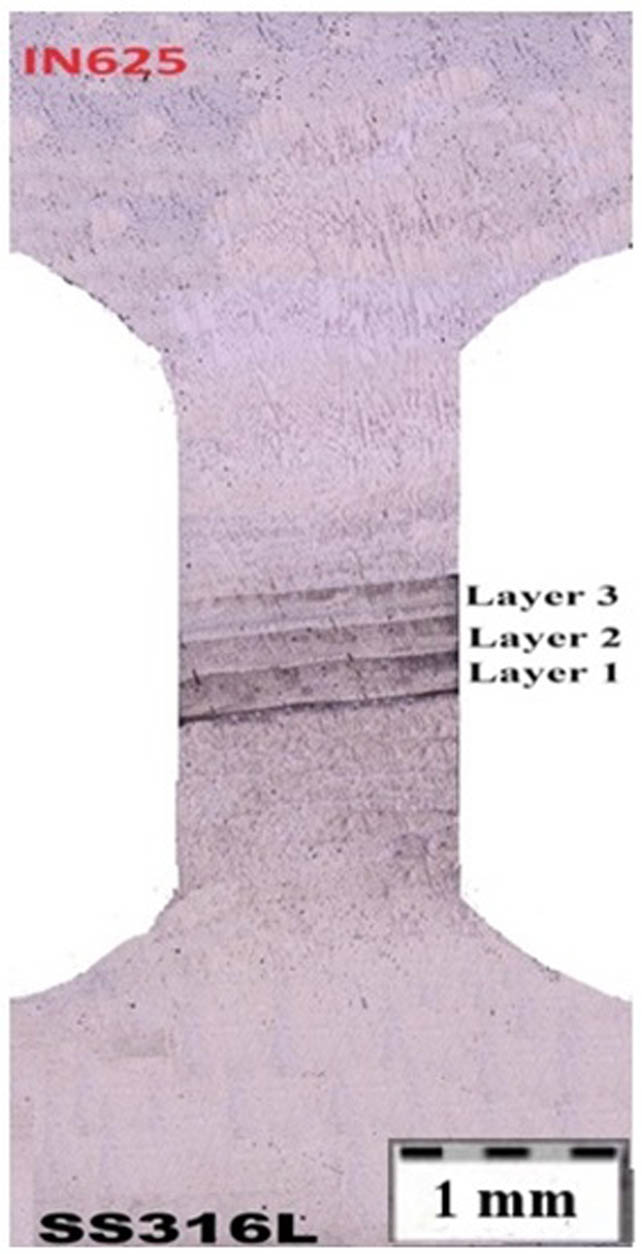
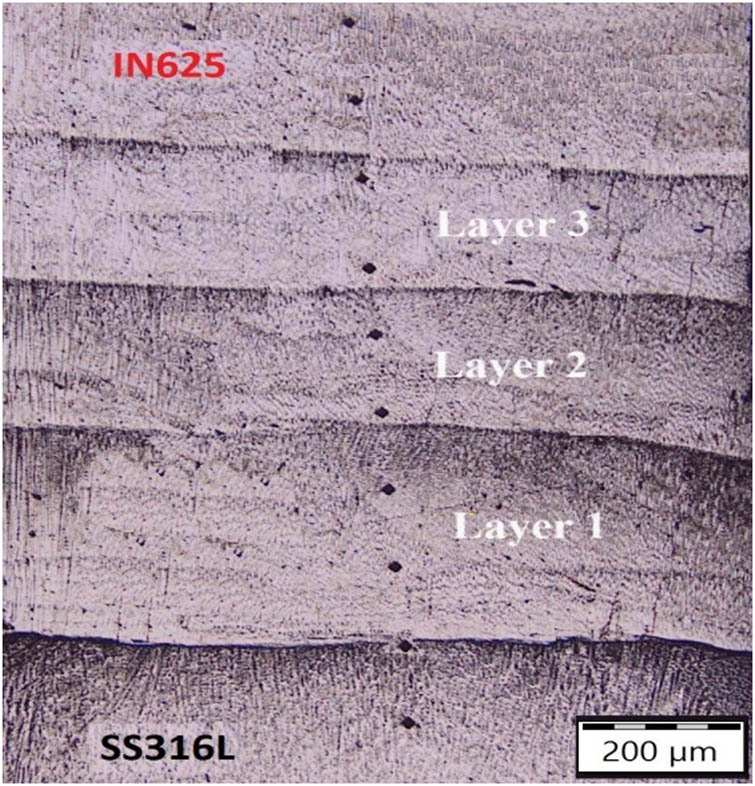
Macrostructure of ASTM E8 sample-6.
3 Results and discussion
3.1 Macro-structure
Here, gradient path partial FGM indicates three different compositional layers in the middle of the ASTM E8 specimen, shown in Figure 6, captured by an Olympus optical microscope. It is the macrostructure of sample-6. These layers are known as gradient zones. The chemical compositions of the first, second, and third layers are 65% SS316L + 35% IN625, 50% SS316L + 50% IN625, and 30% SS316L + 70% IN625, respectively. These samples were polished with emery papers of 200, 600, and 1,000 using a METCO BAINAPOL polishing machine for macrostructure analysis. However, emery papers of 1, 500, and 2,000 were used along with the above polishing papers for observing the microstructures of the samples. The etchant used for these samples is a modified Frys reagent. The measured thickness of each gradient layer is 1.3 mm, and the step-over is 1.9 mm. There is a small variation in the thickness of individual gradient layers due to the metal powders swirling by the atmospheric air in an open part building chamber. The swirling powders cannot flow toward the melt pool but mix with atmospheric air. This indicates the loss of metal powders, and may occur by improper focusing of the laser beam at the focusing point in the melt pool during melting of metal powders. However, the gradient layer thickness and step-over meet the desired values.
3.2 Microstructure
The microstructures of the three compositional layers of specimen-2 taken by an Olympus optical microscope are shown in Figure 7. Crack propagation perpendicular to the deposition direction is observed in the first compositional layer, as shown in Figure 7a. Fine, small columnar grains are shown in Figure 7b. However, large coarse columnar grains observed in the third compositional layer are shown in Figure 7c. The white regions in all compositional layers of the specimen indicate an austenitic phase, and dark spots are unmelted powder particles. The reasons for the formation of the unmelted powder particle regions were due to insufficient laser power and improper focusing of the laser beam at the melt pool. Sometimes, impurities were also present in the unmelted powder particle regions. However, crack propagation was generated, which may be due to the existence of tensile residual stresses in the sample.
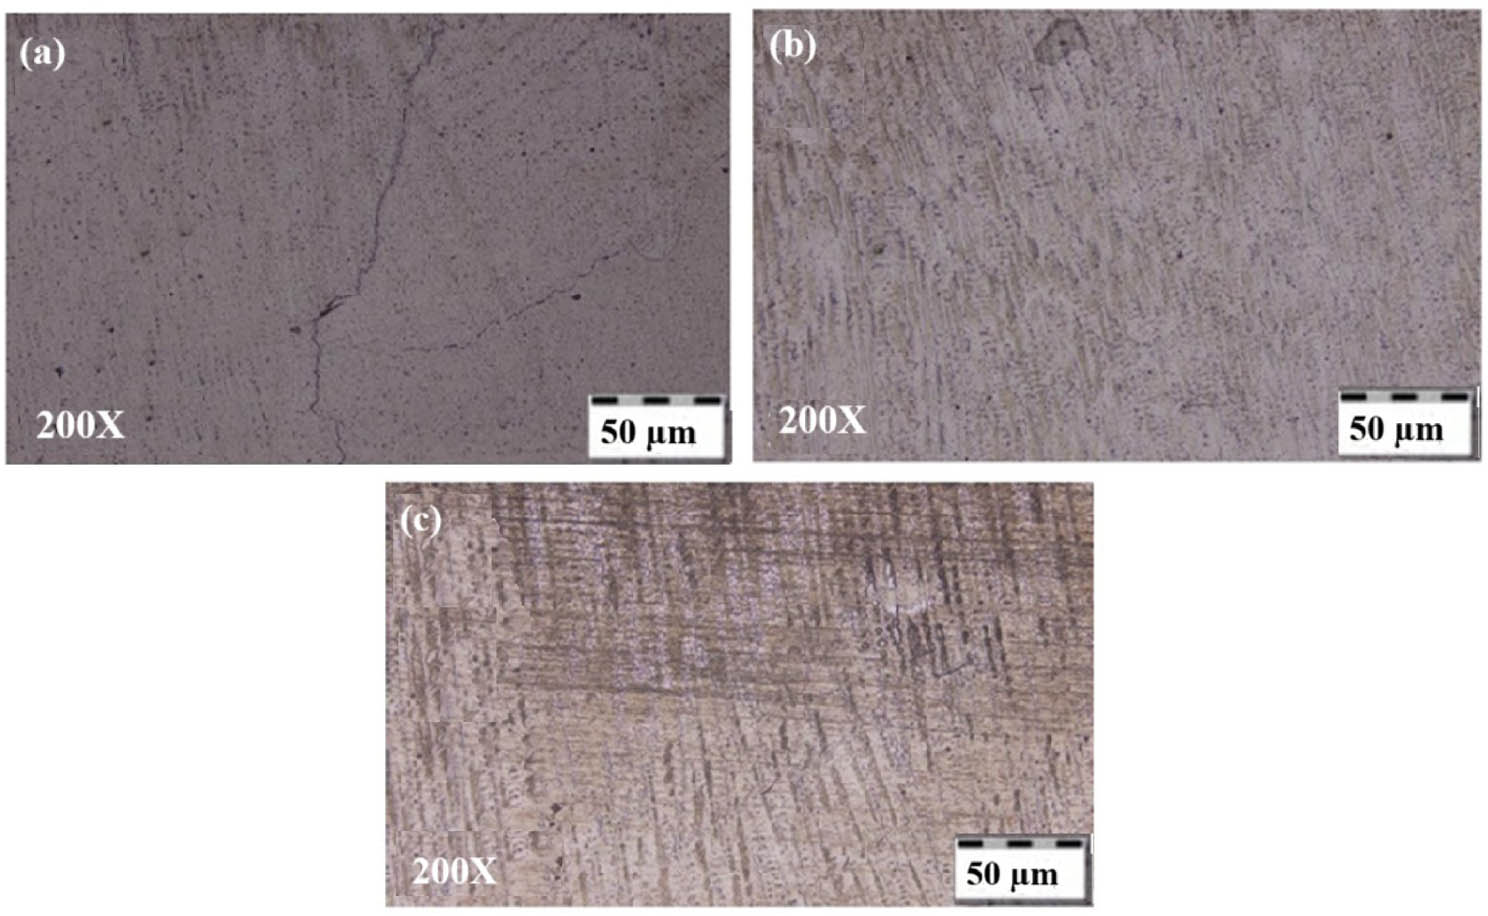
Microstructures of (a) layer 1, (b) layer 2, and (c) layer 3 of sample-2.
The microstructures of specimen-6 were similar to those of sample-2 and are shown in Figure 8. No microcracks or micropores were observed in the three different compositional layers of the specimen during microscopic examination. This is because of the lower powder feed rate, high scan velocity, and sufficient laser power for the melting of the SS316L and IN625 powder particles. However, coarse parallel columnar grains in the first compositional layer, fine columnar grains in the second compositional layer, and equiaxed and coarse columnar grains in the third compositional layer were observed in the specimen and are shown in Figure 8a–c, respectively. The microstructures of these three compositional layers also had white regions, indicating the austenite phase, dark spots of unmelted powder particles, and light–dark regions of compounds of SS316L and IN625. In general, conventional microstructural analysis indicates that the presence of coarse parallel columnar grain microstructures can decrease the mechanical properties and fine grain microstructures can increase the mechanical properties. However, sample-6 had high UTS because of the mixed presence of coarser and finer columnar grains and equiaxed grains microstructures. The remaining specimens exhibited coarse columnar grain microstructures with microcracks and micropores.
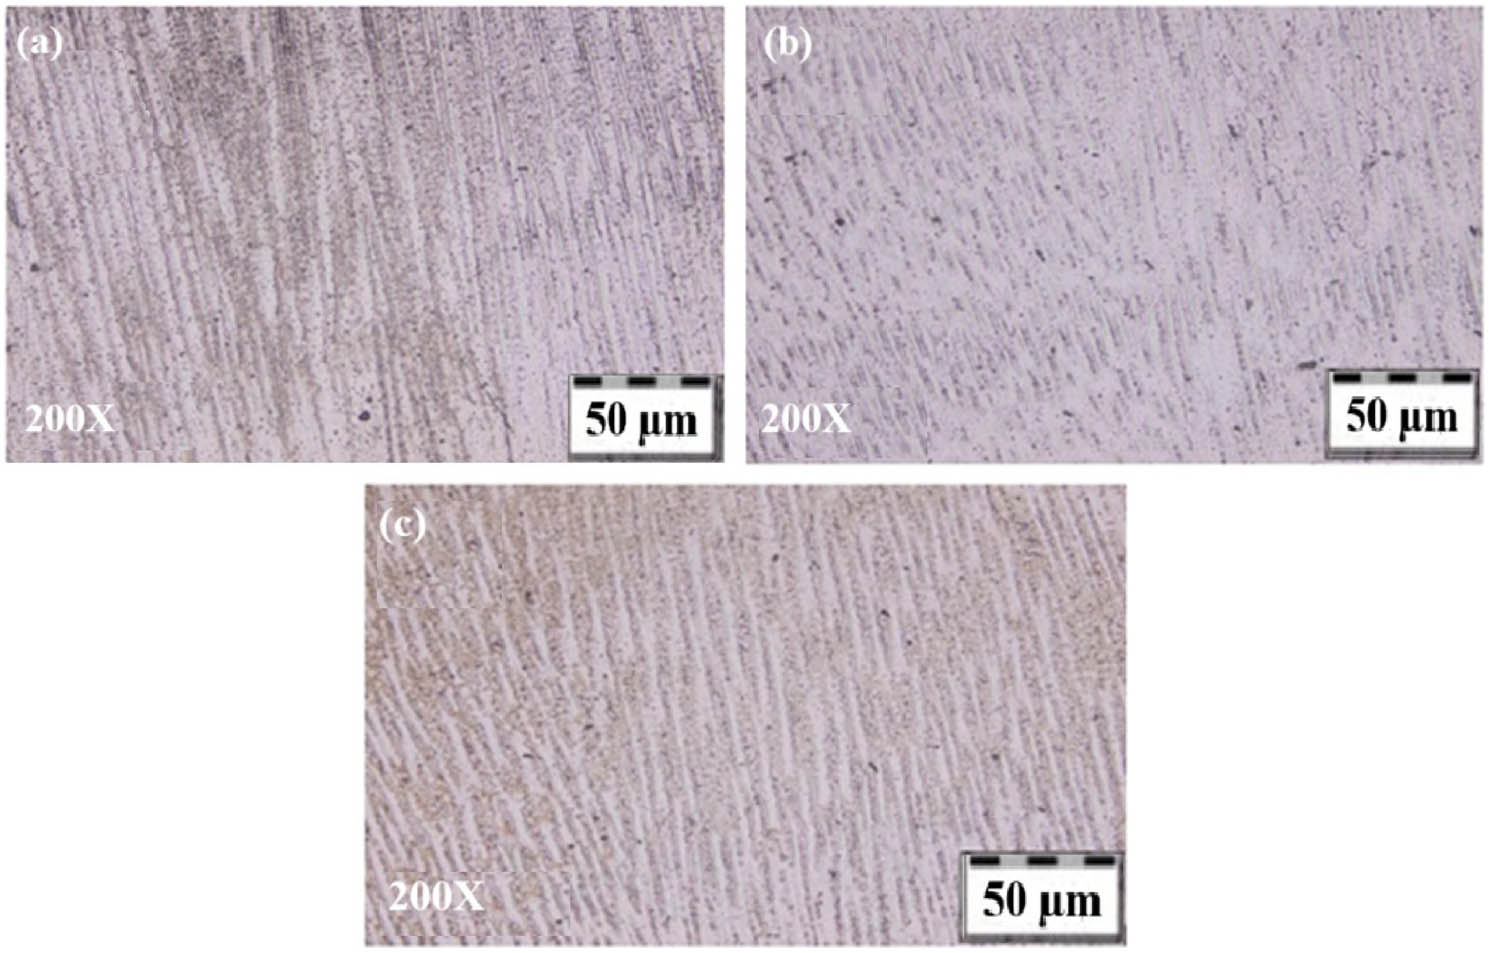
Microstructures of (a) layer 1, (b) layer 2, and (c) layer 3 of sample-6.
3.3 Tensile tests
Three tensile tests were performed for each experiment. The averages of the three UTS values of the partial FGM specimens are listed in Table 6. The fractured specimens after the microtensile tests are shown in Figure 9. From the micro-tensile test results (see Table 6), it was found that sample-6 had a high UTS of 532.6 MPa compared with other specimens. This indicated that the use of medium laser power (i.e., 2,500 W) with high scan velocity and with a lower powder feed rate can produce specimens with high tensile strength because this medium laser power can melt powder particles completely and cause strong metallurgical bonds. The three trial stress–strain curves of the micro-tensile tested sample-6 are depicted in Figure 10. The UTS obtained from the thick layered (i.e., thickness more than 1 mm) gradient path partial FGM sample-6 in this research work was almost close to the thin layered (i.e., thickness less than 1 mm) multilayer material specimens of previous studies [26,33]. Therefore, in the present research, the UTS results indicate that for joining two dissimilar materials to obtain the desired properties, either the thin-layer multilayer materials method or the thick-layer gradient path method (for partial FGM) should be selected. However, it is better to choose the latter because it requires less time for part deposition and is more economical. If the UTS of the conventional welded joints (399–522 MPa) of SS316L and IN625 are considered, it was less than that of the partial FGM sample-6.
Measured values of ultimate tensile strength
| Experiment no. | Ultimate tensile strength (MPa) | Avg. (MPa) | ||
|---|---|---|---|---|
| Trial 1 | Trial 2 | Trial 3 | ||
| 1 | 467.4 | 536.3 | 526.8 | 510.1 |
| 2 | 490.7 | 408.6 | 498.5 | 465.9 |
| 3 | 516.5 | 517.8 | 517.4 | 517.2 |
| 4 | 441.6 | 504.0 | 506.9 | 484.2 |
| 5 | 497.3 | 501.7 | 501.5 | 500.2 |
| 6 | 538.4 | 521.1 | 538.3 | 532.6 |
| 7 | 491.8 | 383.3 | 479.0 | 451.4 |
| 8 | 519.6 | 482.4 | 514.3 | 505.4 |
| 9 | 511.7 | 522.4 | 522.3 | 518.8 |
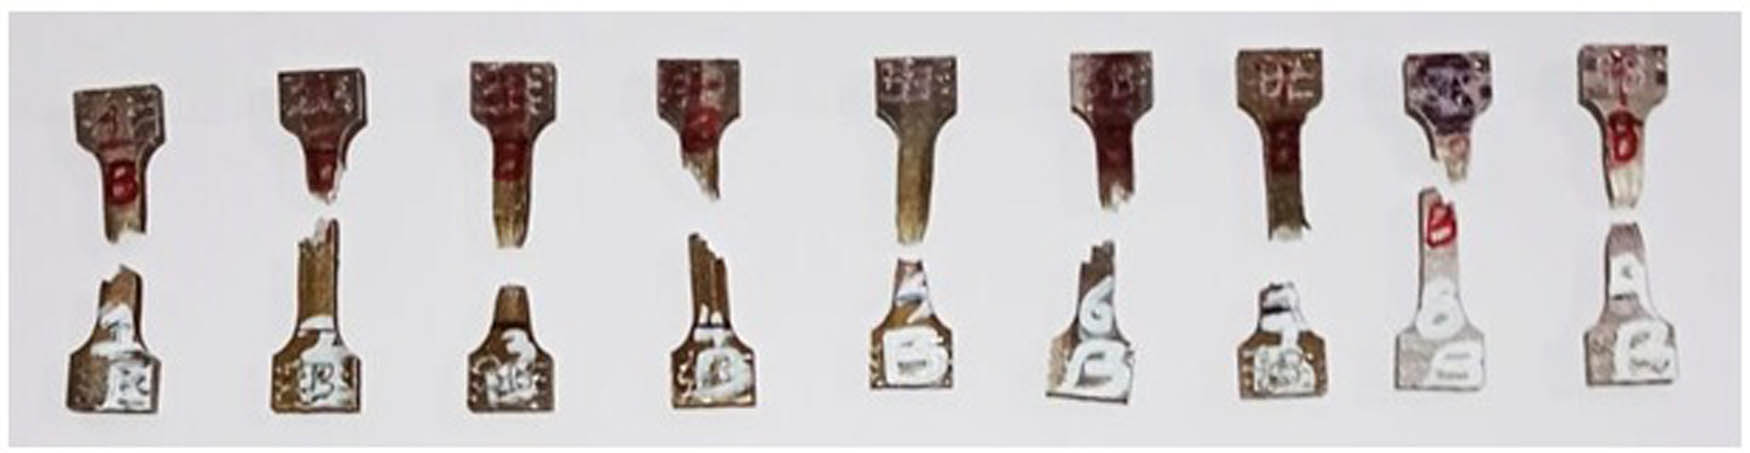
ASTM E8 tensile specimens after failure.
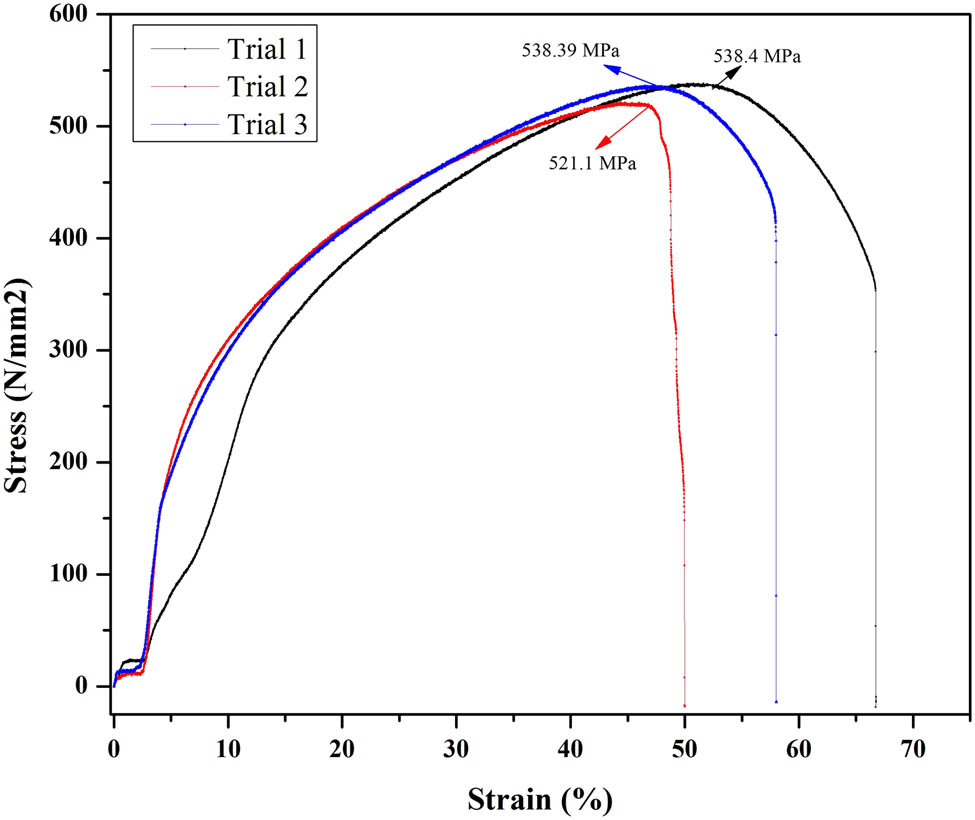
Stress versus strain curves of sample-6 for trial 1, trial 2, and trial 3.
Specimen-2, specimen-4, specimen-5, and specimen-6 were fractured at 17.6, 17.9, 16.6, and 17.1 mm, respectively, from the lower side of the pure SS316L region. This indicated that they failed in the third compositional layer. In contrast, samples-1 and samples-3 broke into two pieces in the second compositional layers at a distance of 15.3 and 14.5 mm, respectively. The specimens that failed in the second and third compositional layers have high strength because of the absence of molybdenum (Mo) and niobium (Nb) brittle phases. Specimen-7 failed in the first compositional layer (i.e., at 13 mm), and sample-8 and sample-9 broke in the regions of pure IN625. The failure specimens are depicted in Figure 9. It is concluded that specimen-3 showed the maximum percentage of reduction in area (i.e., 76.8%) and also the percentage of strain (i.e., 64.6%). Therefore, it had the highest ductility compared to other specimens.
3.4 Hardness
Hardness is the surface property of a material to resist plastic deformation. Two locations/indentation spots were selected for the evaluation of micro-hardness from each compositional layer of the samples. There were three compositional layers in each sample. Therefore, a total number of six locations/indentation spots were considered for the measurement of micro-hardness from every sample. For more details regarding micro-hardness indentation spots, see Figure 5. The micro-hardness values measured using an ECONOMET hardness tester for all nine samples are shown in Table 7.
Measured values of micro-hardness
| Experiment no. | Micro-hardness (HV) | Avg. (HV) | |||||
|---|---|---|---|---|---|---|---|
| Indentation spot 1 | Indentation spot 2 | Indentation spot 3 | Indentation spot 4 | Indentation spot 5 | Indentation spot 6 | ||
| 1 | 177.2 | 178.3 | 191.1 | 189.7 | 179.7 | 210.3 | 187.7 |
| 2 | 172.5 | 176.1 | 177.2 | 180.0 | 186.9 | 201.6 | 182.3 |
| 3 | 177.1 | 175.7 | 180.8 | 191.0 | 188.4 | 200.7 | 185.6 |
| 4 | 197.1 | 183.6 | 180.8 | 203.0 | 192.1 | 197.0 | 192.2 |
| 5 | 180.9 | 143.2 | 180.1 | 186.4 | 195.7 | 183.4 | 178.2 |
| 6 | 165.4 | 165.3 | 185.7 | 183.6 | 193.0 | 189.4 | 180.4 |
| 7 | 164.2 | 160.0 | 187.0 | 197.2 | 195.1 | 196.7 | 183.3 |
| 8 | 175.8 | 216.3 | 191.5 | 182.9 | 184.1 | 202.9 | 192.2 |
| 9 | 193.5 | 197.0 | 194.6 | 198.7 | 208.5 | 222.9 | 202.5 |
The micro-hardness of each gradient zone increases with increasing content of IN625. However, the micro-hardness of the gradient zones is not lower than the hardness of the pure SS316L region and not higher than the hardness of the pure IN625 region in all samples. The micro-hardness graph of sample-5 is shown in Figure 11a. Its gradient zone micro-hardness (i.e., 178.2 HV) is very low compared to the those of the remaining samples. However, the highest gradient zone micro-hardness (202.5 HV) is observed in sample-9, as shown in Figure 11b. Hence, it is concluded that sample-9 printed at a high laser power has the highest gradient zone micro-hardness, and this specimen also has coarse columnar and equiaxed grain microstructure for exhibiting high hardness. Considering the micro-hardness variations in the entire sample-9, the micro-hardness of the pure SS316L region increased from its bottom layer (175.2 HV) to a maximum value of 192.4 HV in it, then decreased to that of the first compositional layer (167.4 HV). Similarly, for its pure IN625 region, the micro-hardness increased from the third compositional layer (240.2 HV) to its top surface (258.5 HV). In sample-5, as depicted in Figure 11(a), the hardness of the pure SS316L portion increases from its bottom layer (170.4 HV) to the first gradient layer (187.3 HV). However, the hardness of its pure IN625 region also increases from the third compositional layer (228.3 HV) to its top surface (254.2 HV). Therefore, for comparing the micro-hardness of the top surfaces of these samples, the ninth sample has the highest value due to the formation of fine grain microstructure by the absence of repetitive heating and cooling.
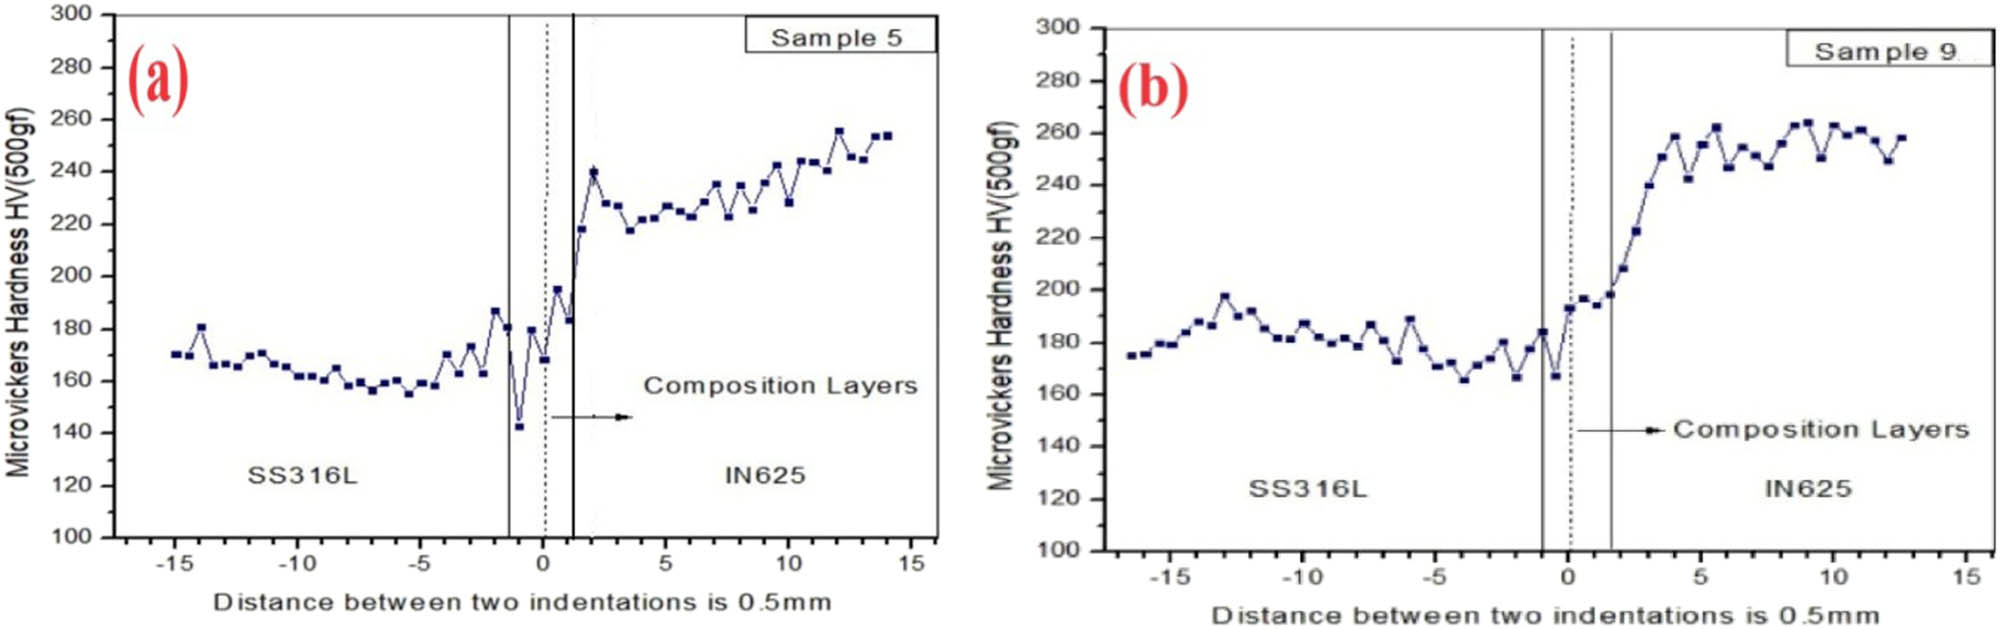
Micro-hardness of partial FGM (a) sample-5 and (b) sample-9.
3.5 Failure surface morphology and chemical composition analysis
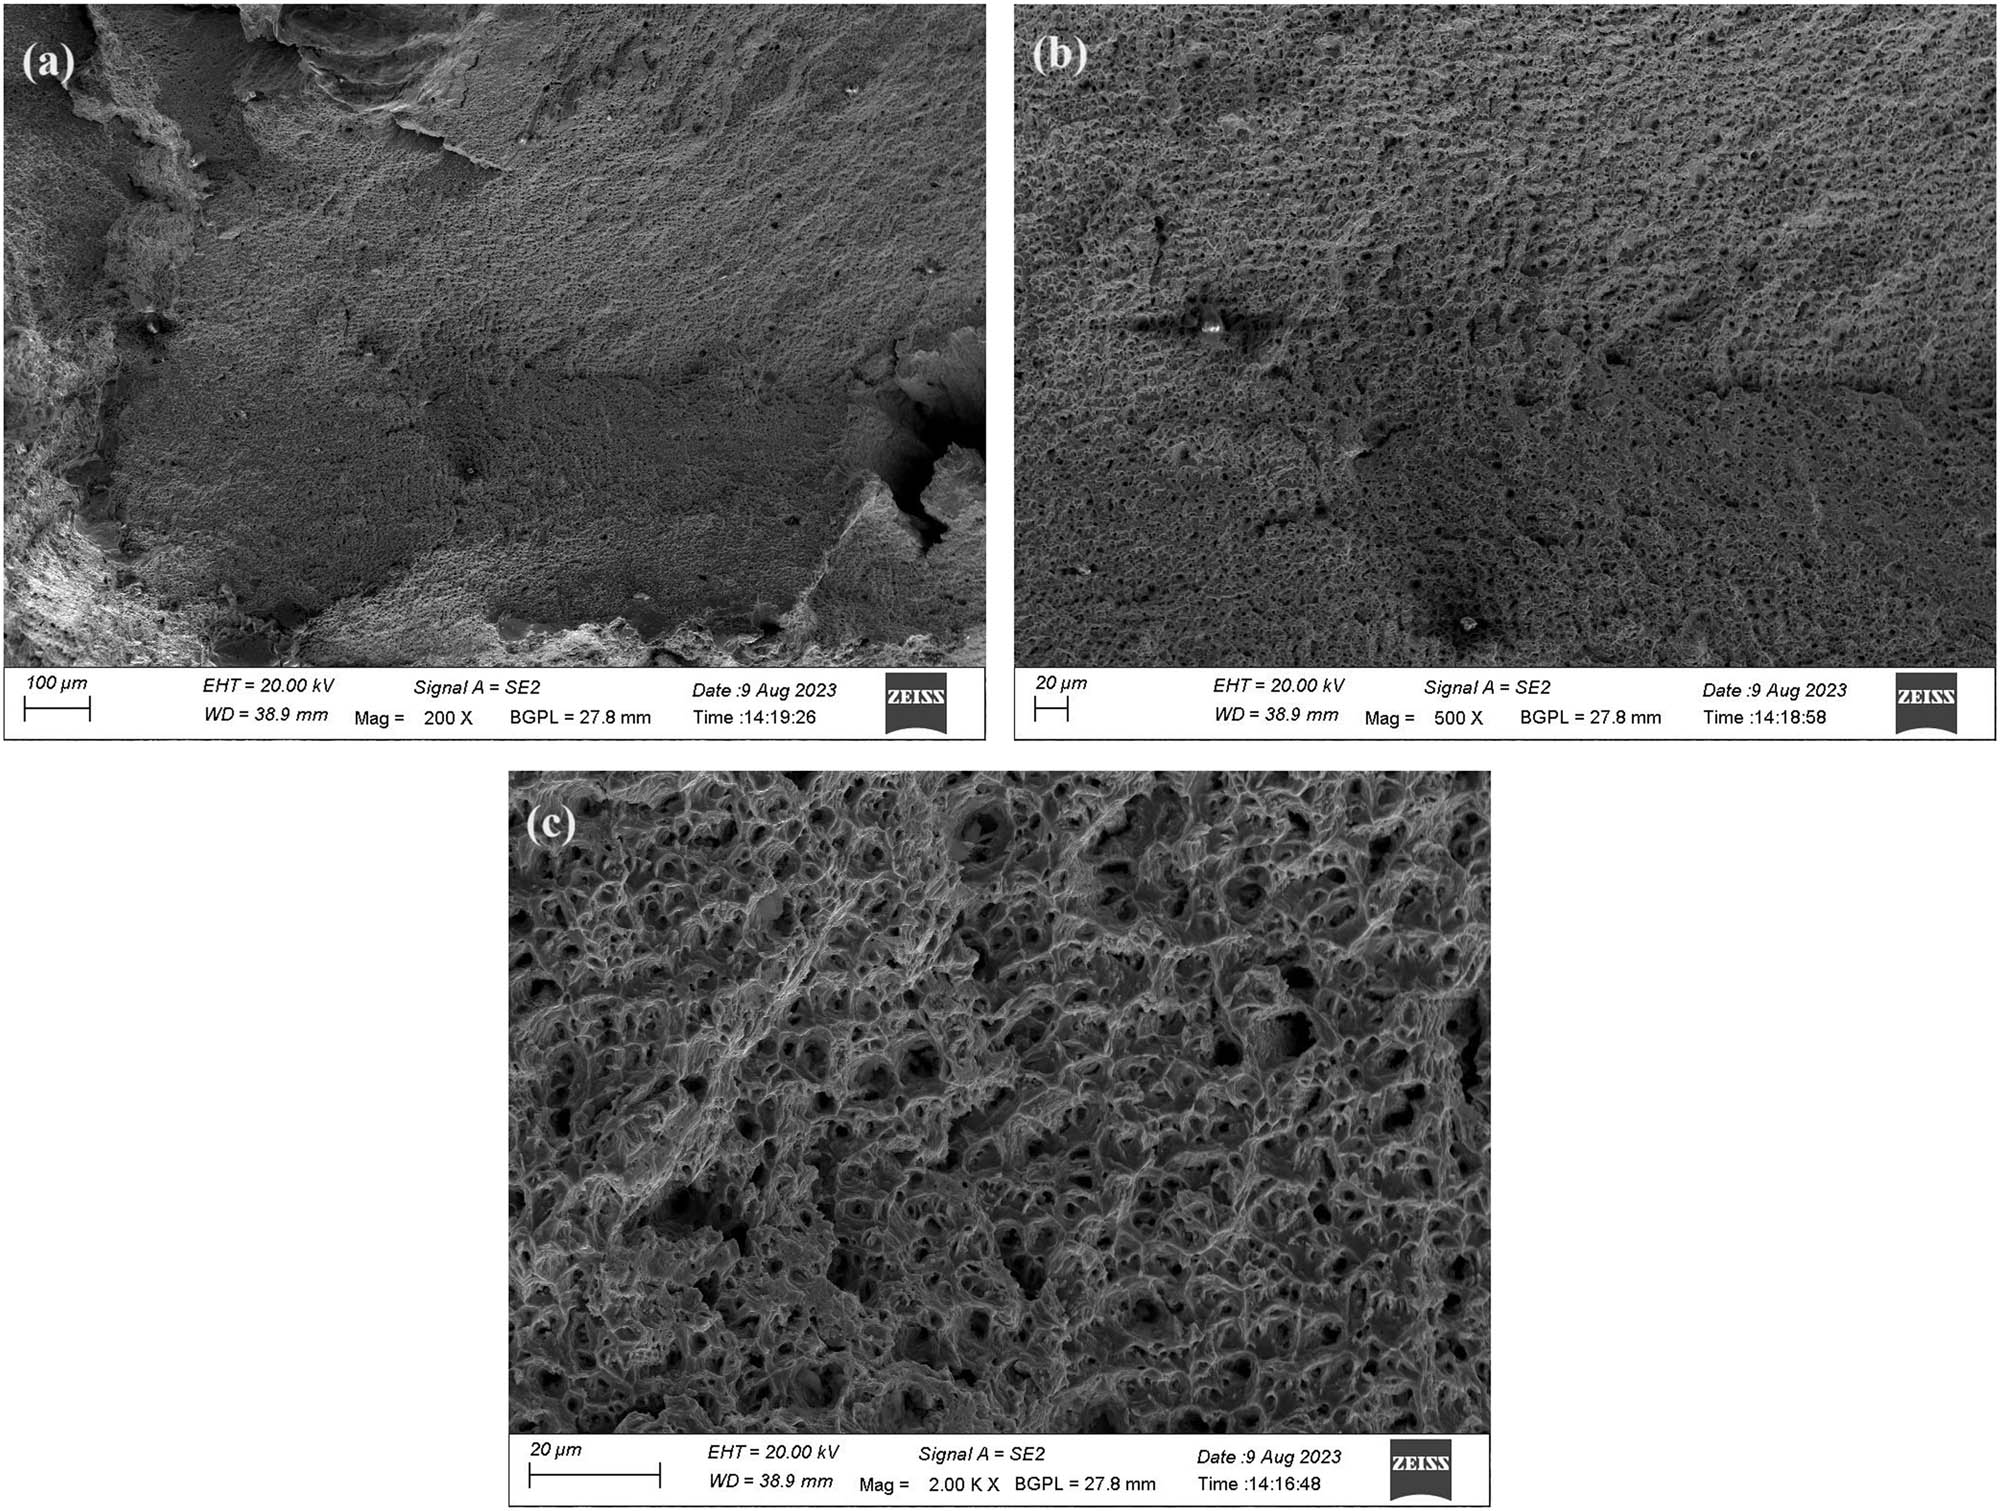
Failure surface morphology is known as fractography. The morphologies of the fractured layer of sample-2, sample-6, and sample-7 were captured using a GeminiSEM500. These three specimens were printed at a lower energy parameter set (1,500 W, 20 mm/s, and 25 g/min), medium energy parameter set (2,500 W, 30 mm/s, and 20 g/min), and high energy parameter set (3,500 W, 10 mm/s, 30 g/min). Specimen-2 and specimen-6 failed at the third compositional layer. However, sample-7 broke in the first gradient zone. The surface morphologies of sample-2 and sample-6 at different magnifications are shown in Figures 12 and 13. Both microholes and microcracks of the samples are shown in Figures 12a and 13a. However, microcracks and microholes are shown individually in Figures 12b and 13b, respectively. In contrast, many simple shallows with uniform sizes are shown in Figure 12c, and smeared or angled shallows with uniform morphology are shown in Figure 13c. Therefore, the surface morphologies with shallows were mainly ductile, with very little deformation in specimen-2 and specimen-6. The surface morphology of fractured sample-7 at various magnifications exhibits the same surface morphology as compared to the morphologies of sample-2 and sample-6. The required three gradient zones of the partial FGM samples were printed with the desired amount of IN625 in the metal powder mixture of SS316L and IN625. Therefore, it can avoid the formation of microcracks and micropores. Hence, the mechanical properties of the FGM samples can be improved [38,39].
(a–c) Tensile failure surface morphology of third compositional layer of sample-2.
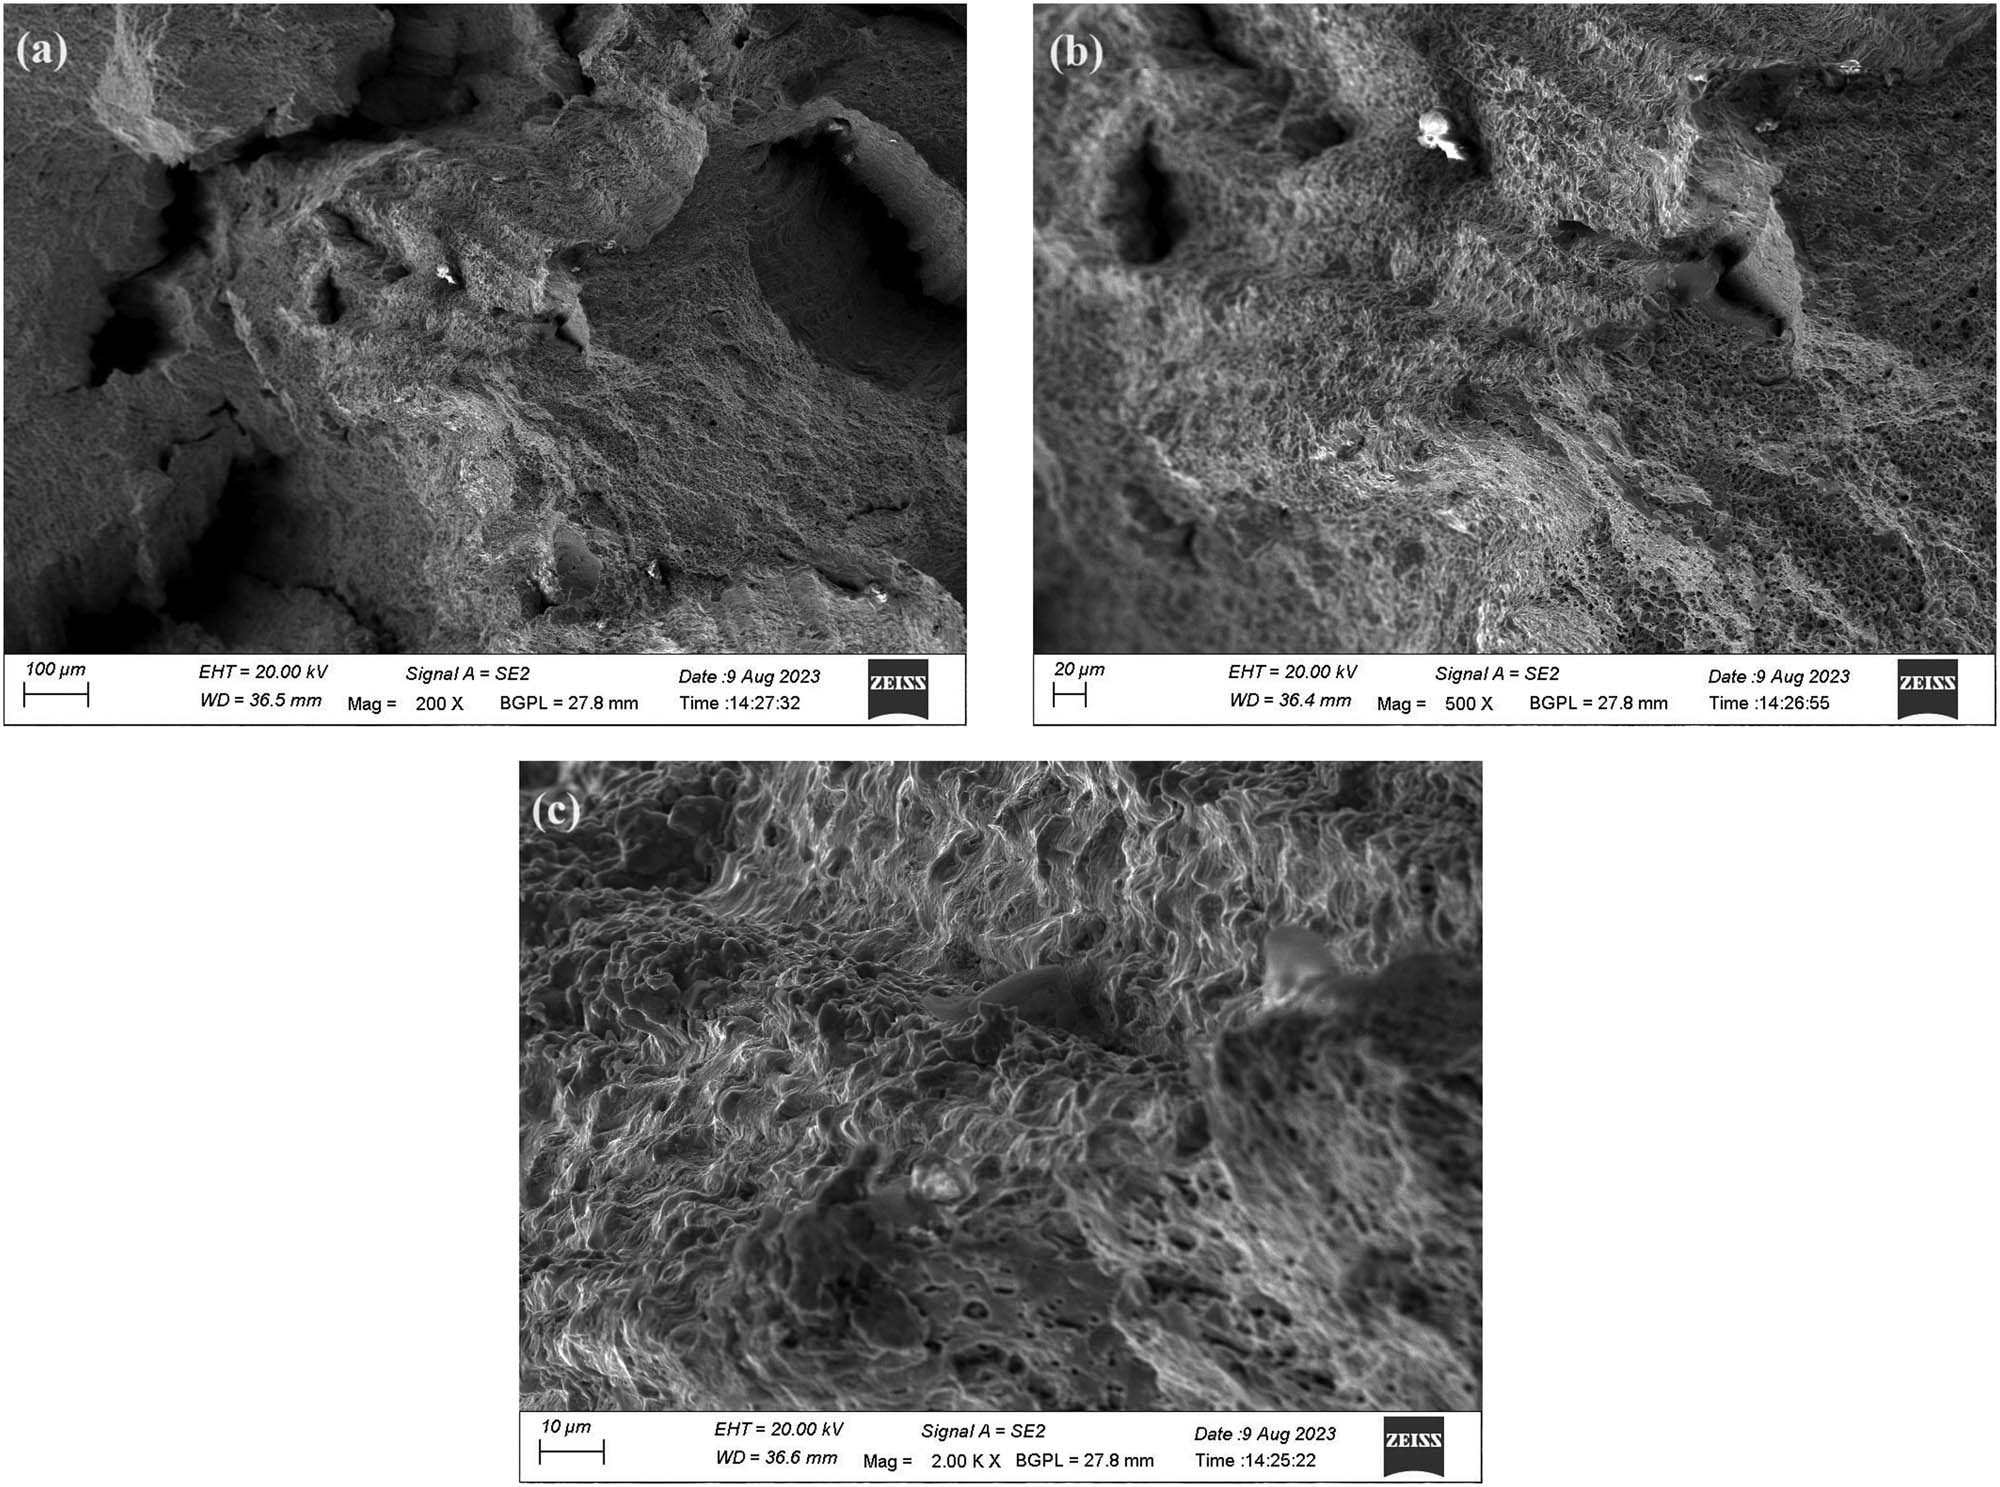
(a–c) Morphology of tensile failure surface of third compositional layer of sample-6.
In general, columnar grains with uniform morphology were generated in the DMD-processed depositions. Microholes were formed owing to the escape of powder-entrapped gases and other gases during the deposition process or melt-pool solidification. This is known as process-induced porosity. In DMD deposition, the presence of residual stress is common. Tensile residual stresses create microcracks. However, the compressive residual stresses close them. Debris means the generation of unwanted material during powder deposition (see Figure 12a). This may be due to various factors, such as the quality of the powder feedstock used, improper selection of deposition parameters, and the size of the part to be built. Smeared or angular shallows were formed because of the rapid solidification of the molten pool during the deposition process.
Fractured specimen-2, specimen-6, and specimen-7 were used for microstructure and chemical compositional analyses using GeminiSEM500 and Octane Elite EDAX. Two locations were selected on the fractured surfaces of the samples for analysis. From the EDAX report, molybdenum was present in sample-2, sample-6, and sample-7 at 3.1, 2.8, and 2.1%, respectively, in their respective fractured layers. However, niobium was present in specimen-2 and specimen-7 at 1 and 1.4%, respectively, in their fractured layers. The detected molybdenum (Mo) and niobium (Nb) content by EDAX was within the range of 2–9% and 3.1–4.1% in the fractured layers in those specimens, as compared to SEM powder morphology and powder supplier reports. This indicates Mo and Nb brittle phases were not formed and did not allow for microcracks and micropores. The scanning electron beam microstructure and elemental distribution shown by EDAX for sample-6 is shown in Figure 14. There was no presence of Nb (at the selected spots; see Figure 14a) observed in the EDAX report (Figure 14b) in the fractured surface of sample-6. However, it may be present in other layers of the sample in lower or higher quantities. It was revealed from the EDAX reports of these samples that iron (Fe) was observed in the maximum quantity, followed by chromium (Cr) and nickel (Ni). The elements observed by EDAX in sample-6 are shown in Figure 14b.
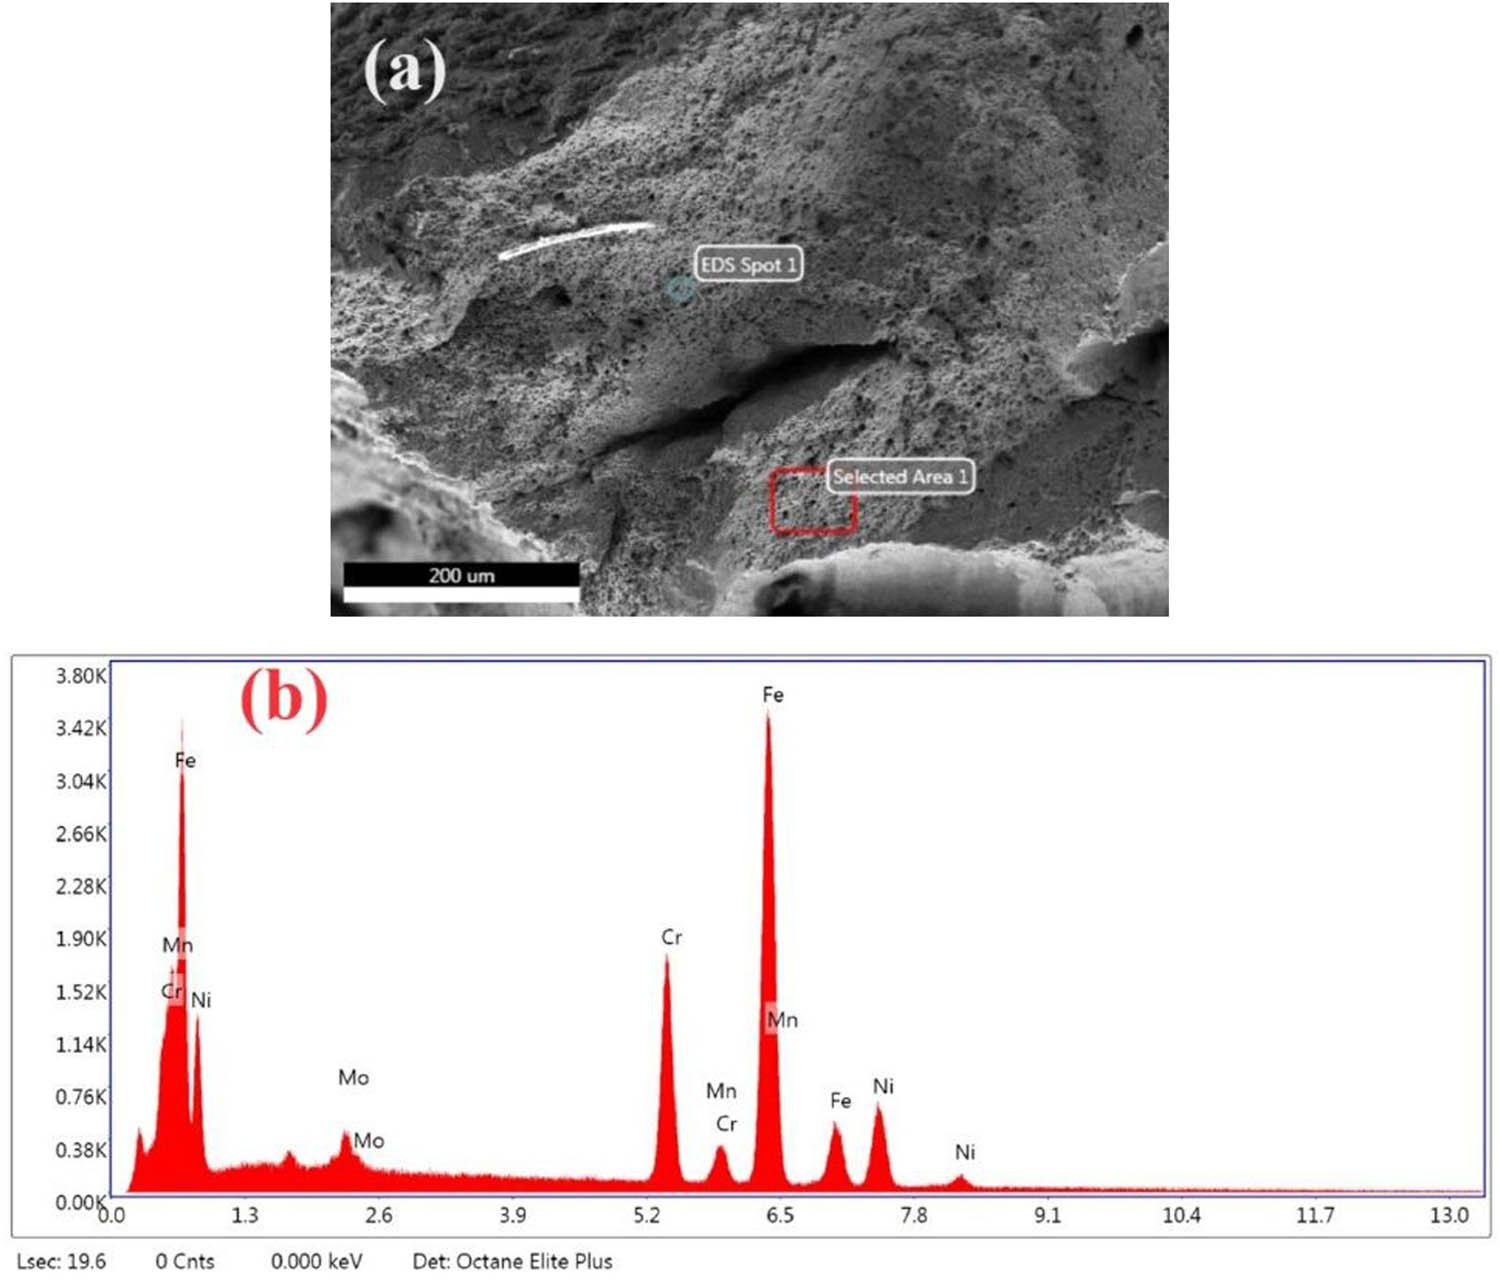
(a) SEM image of specimen-6 at the fracture and (b) its chemical composition distribution by EDAX.
3.6 Optimization of process parameters
3.6.1 Ultimate tensile strength
To calculate signal-to-noise (S/N) ratios, an objective function (i.e., ultimate tensile strength) larger-the-better was utilized. Therefore, the S/N ratio for this function is given by −10 × log (Σ(1/y i 2)/n), where y i indicates the responses (i.e., ultimate tensile strengths) for the given factor level combination and n is number of trials in the factor level combination. Table 8 shows the S/N ratios of the nine experiments, which were solved analytically, and the same values were obtained when validated with Minitab statistical 21.2.0.0 software. The S/N ratios for the individual control factors validated by the Minitab software are listed in Table 9. Among the selected parameters for UTS, the scan velocity played a prominent role (i.e., 1st rank), followed by the powder feed rate and laser power. Figure 15 shows the deposition parameter levels versus S/N ratios for determining the optimum parameter values.
Minitab-validated S/N ratios for UTS
| Experiment no. | S/N ratio |
|---|---|
| 1 | 54.1 |
| 2 | 53.2 |
| 3 | 54.2 |
| 4 | 53.6 |
| 5 | 53.9 |
| 6 | 54.5 |
| 7 | 52.9 |
| 8 | 54.0 |
| 9 | 54.3 |
S/N ratios for the individual control factors for UTS: larger the better
| Level | Laser power (P), W | Scan velocity (V), mm/s | Powder feed rate (M), g/min |
|---|---|---|---|
| 1 | 53.8 | 53.5 | 54.2 |
| 2 | 54.0 | 53.7 | 53.7 |
| 3 | 53.7 | 54.3 | 53.7 |
| Delta | 0.2 | 0.8 | 0.5 |
| Rank | 3 | 1 | 2 |
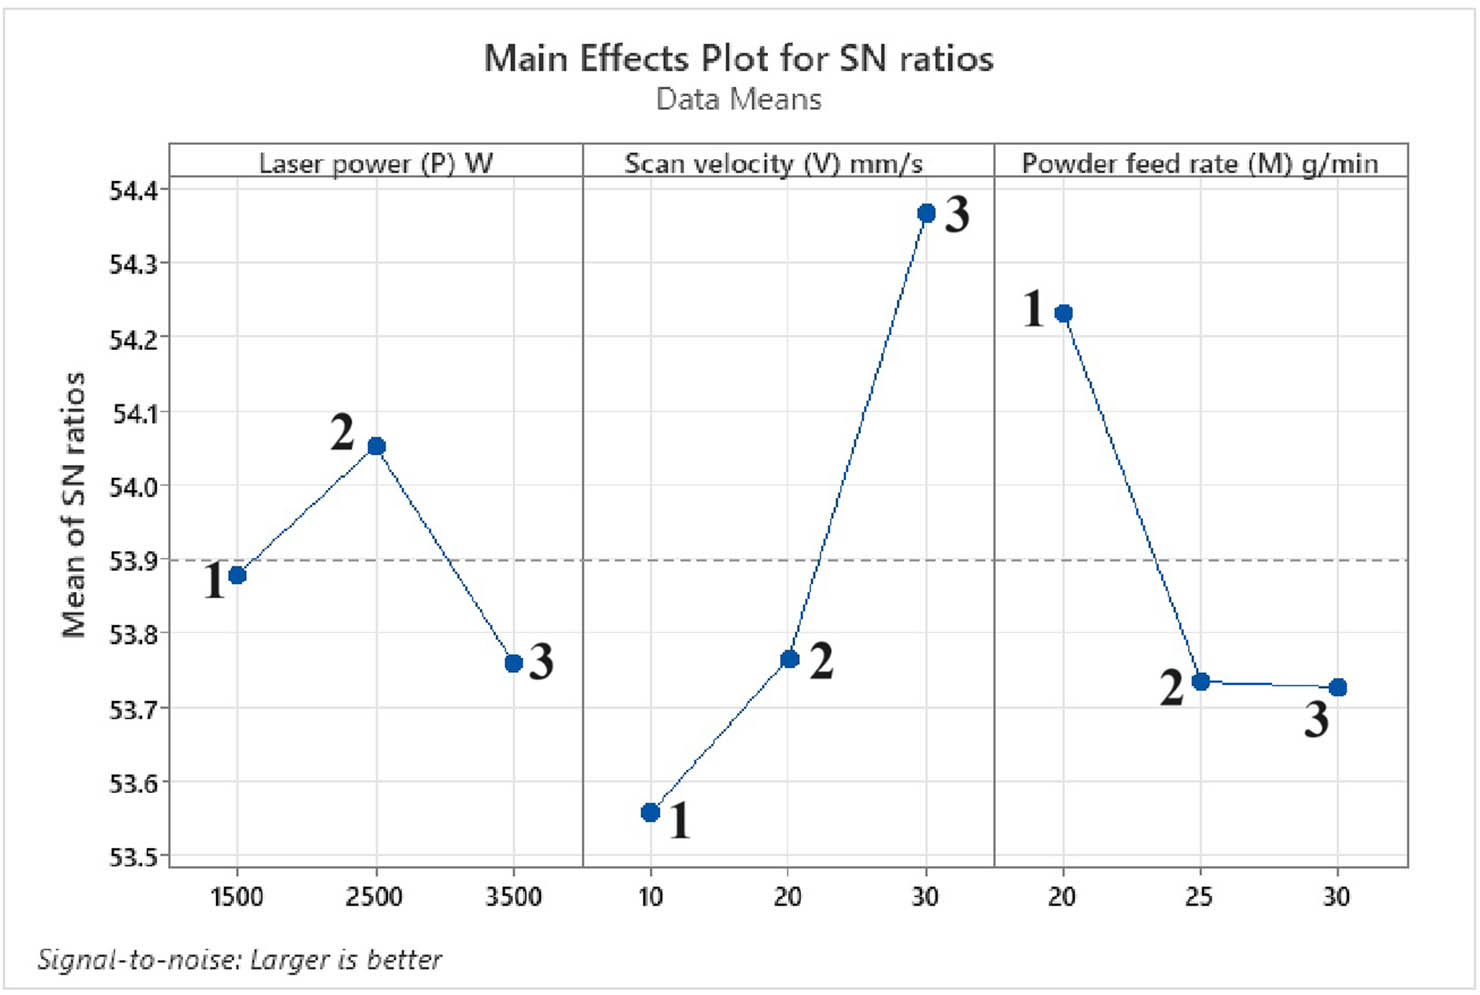
Deposition parameter levels versus S/N ratios for UTS.
To calculate UTS, a larger-the-better type of objective function is utilized. The highest S/N ratio for the corresponding factor levels was selected to optimize the conditions. From the linear graph (see Figure 15), the optimum values of the factors were the following: laser power of 2,500 W, scan velocity of 30 mm/s, and powder feed rate of 20 g/min at the levels of (2, 3, 1). This indicated that the sixth set of parameters had optimum values for obtaining high UTS in this DMD printing experiment. For more details, refer to Table 4. In this research, the time required for deposition of each FGM block using the selected commercial DMD machine was 1 hour 30 min. In the case of a non-commercial DMD machine, the deposition time may be 8 h or more for depositing one FGM block.
The degrees of freedom (DOF) were evaluated for the selected L9 orthogonal array of experiments. There were two degrees of freedom for each factor. There are four factors, e.g., the powder feed rate, scan velocity, laser power, and error. Thus, it has a total of eight degrees of freedom. The response magnitude in the percentage of each parameter was determined and validated using the ANOVA module of the Minitab software. It was used to identify and quantify the sources of various microtensile test trial results obtained from various parameter sets of powder depositions. The total sum of the squares (SS T ) can be calculated as the sum of squares (SS) of all the factors and errors based on Eqs. (1) and (2), and the values are listed in Table 10.
Analysis of variance for UTS
| Source | DOF | Adj. SS | Adj. MS | F-Value | P-Value | % SS = Adj. SS/Total |
|---|---|---|---|---|---|---|
| Laser power (P), W | 2 | 0.12 | 0.06 | 0.25 | 0.80 | 5.8 |
| Scan velocity (V), mm/s | 2 | 1.05 | 0.52 | 2.06 | 0.32 | 48.1 |
| Powder feed rate (M), g/min | 2 | 0.49 | 0.24 | 0.97 | 0.50 | 22.7 |
| Error, e | 2 | 0.51 | 0.25 | 23.3 | ||
| Total | 8 | 2.19 | 1.09 | 100 |
Table 10 shows that for UTS, the contribution of scan velocity (48.1%) was a more significant factor than the powder feed rate (22.7%). These two factors were more significant than the laser power (5.8%). However, the effect of noise factors on UTS was 23.3%. The reasons for obtaining more errors are due to vibrations of the commercial DMD machine, use of manually mixed powder compositions, specimens not printed with different layer thicknesses, hatch spacing, and the use of an open part building chamber of the machine.
3.6.2 Micro-hardness
A larger-the-better objective function (i.e., micro-hardness) was utilized to evaluate signal-to-noise (S/N) ratios. Table 11 shows S/N ratios of nine micro-hardness samples, and their S/N ratios for the individual control factors are listed in Table 12. The powder feed rate is an important influencing parameter (i.e., standing at first rank) on micro-hardness, followed by laser power and scan velocity. The deposition parameter levels versus S/N ratios for determining the optimum parameter values are shown in Figure 16. The highest S/N ratio for the corresponding factor levels was considered to optimize the conditions. From the linear graph (Figure 16), the optimum values of the factors were as follows: laser power of 3,500 W, scan velocity of 30 mm/s, and powder feed rate of 25 g/min at the levels of (3, 3, 2). Table 4 shows the details about it. The ninth set of parameters had optimum values for obtaining high micro-hardness.
Minitab-validated S/N ratios for micro-hardness
| Experiment no. | S/N ratio |
|---|---|
| 1 | 45.4 |
| 2 | 45.1 |
| 3 | 45.3 |
| 4 | 45.6 |
| 5 | 44.8 |
| 6 | 45.0 |
| 7 | 45.1 |
| 8 | 45.6 |
| 9 | 46.0 |
S/N ratios of the individual control factors for micro-hardness: larger the better
| Level | Laser power (P), W | Scan velocity (V), mm/s | Powder feed rate (M), g/min |
|---|---|---|---|
| 1 | 45.3 | 45.4 | 45.3 |
| 2 | 45.2 | 45.2 | 45.6 |
| 3 | 45.6 | 45.5 | 45.1 |
| Delta | 0.4 | 0.2 | 0.5 |
| Rank | 2 | 3 | 1 |
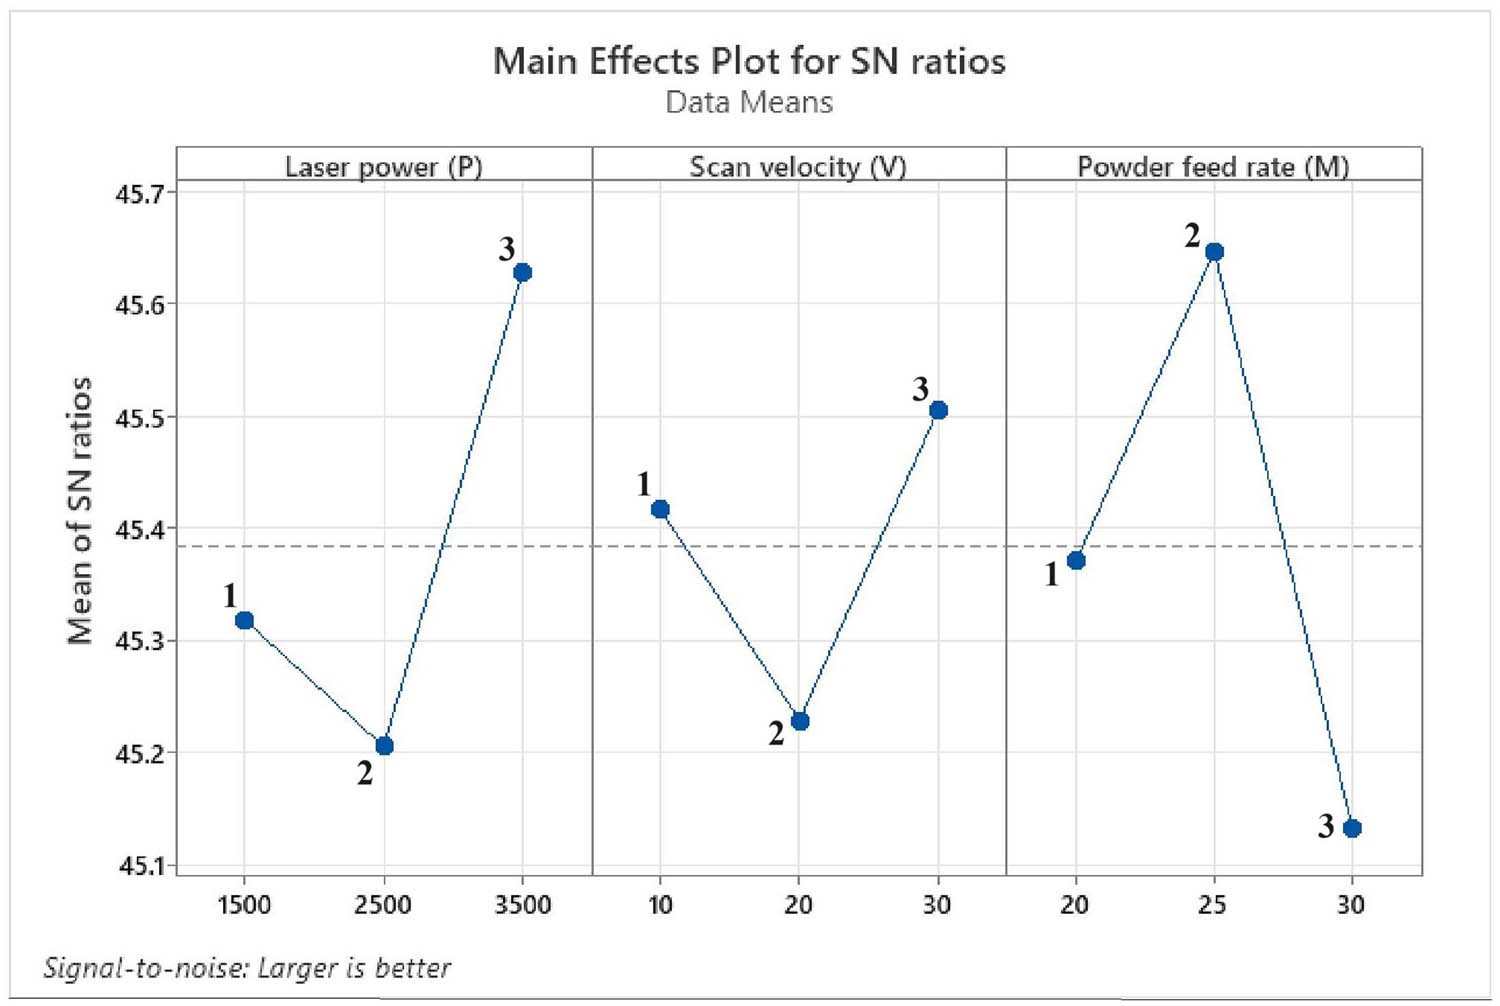
Deposition parameters levels versus S/N ratios for micro-hardness.
ANOVA was utilized to identify and quantify the sources of various micro-hardness test trial results obtained from the different parameter sets of 3D-printed deposits. Using Eqs. (1) and (2), the total sum of the squares (SS T ) determined as the sum of squares (SS) of all factors and errors are given in Table 13.
Analysis of variance for micro-hardness
| Source | DOF | Adj. SS | Adj. MS | F-value | P-value | % SS = Adj. SS/total |
|---|---|---|---|---|---|---|
| Laser power (P), W | 2 | 0.28 | 0.14 | 1.06 | 0.48 | 26.9 |
| Scan velocity (V), mm/s | 2 | 0.11 | 0.05 | 0.44 | 0.69 | 10.5 |
| Powder feed rate (M), g/min | 2 | 0.39 | 0.19 | 1.48 | 0.40 | 37.5 |
| Error, e | 2 | 0.26 | 0.13 | 25.0 | ||
| Total | 8 | 1.04 | 0.51 | 100 |
The contribution of powder feed rate (37.5%) was a significant parameter on micro-hardness than laser power (26.9%). However, the lowest significant factor was scan velocity (10.5%) as compared to the above factors. However, the effect of noise factors on micro-hardness was 25%. From Table 13, it can be concluded that metal powder melts completely as the powder feed rate increases with increasing laser power simultaneously. However, this condition is satisfied at a lower scan velocity.
4 Conclusions
From the tensile test results, the measured values of micro-hardness, and characterization performed on the specimens, the following conclusions were drawn.
The micro-tensile test results revealed that sample-6 has a high UTS of 532.6 MPa as compared to all other specimens. This value was obtained at the sixth set of optimum parameters. However, a maximum micro-hardness of 202.5 HV was found in its compositional layers of sample-9 at the ninth set of optimum parameters.
From the ANOVA results, for obtaining high UTS, the contribution of scan velocity (48.1%) was a significant factor. However, for obtaining maximum micro-hardness, the powder feed rate (37.5%) contributed more significantly.
The UTS obtained from the thick-layered gradient path partial FGM sample-6 in this research was almost closer to that of the thin-layered multilayer material specimens [26,33]. Therefore, for joining two dissimilar materials to obtain the desired properties, the thick layer gradient path method should be selected.
Specimen-2, specimen-6, and specimen-7 were used for SEM and EDAX analyses. Specimen-2 and specimen-6 were broken in the third compositional layer, whereas sample-7 failed in the first gradient zone. The presence of Mo and Nb was within the acceptable range at the fractured layers in these samples. Therefore, brittle phases of Mo and Nb were not present in these samples.
-
Funding information: The authors declared that no funding was received to carry out the present work.
-
Author contributions: All authors have accepted responsibility for the entire content of this manuscript and agreed to submit to the journal, verified all the results of the final version of the manuscript. S.A. designed the experiments and D.D.S. carried them out and performed testing. A.R.R. has done characterization.
-
Conflict of interest: The authors reported no potential conflict of interest.
References
[1] Dev Singh D, Arjula S, Raji Reddy A. Functionally graded materials manufactured by direct energy deposition: a review. Mater Today: Proc. 2021;47:2450–6.10.1016/j.matpr.2021.04.536Search in Google Scholar
[2] Kumaran M, Senthilkumar V. Experimental characterization of stainless steel 316L alloy fabricated with combined powder bed fusion and directed energy deposition. Weld World. 2021;65(7):1373–88.10.1007/s40194-021-01117-zSearch in Google Scholar
[3] Naesstroem H, Brueckner F, Kaplan AFH. From mine to part: directed energy deposition of iron ore. Rapid Prototyp J. 2021;27(11):37–42.10.1108/RPJ-10-2020-0243Search in Google Scholar
[4] Noh I, Jeon J, Lee SW. A study on metallographic and machining characteristics of functionally graded material produced by directed energy deposition. Crystals. 2023;13(10):17.10.3390/cryst13101491Search in Google Scholar
[5] Duan X, Wang S, Yang H, Wang G, Liu W, Xiao Z. Microstructure and mechanical properties of functional gradient materials of high entropy alloys prepared by direct energy deposition. J Mater Res Technol. 2023;26:1677–96.10.1016/j.jmrt.2023.07.276Search in Google Scholar
[6] Singh DD, Arjula S, Reddy AR. Metal additive manufacturing by powder blown beam deposition process. Int J Eng Adv Technol. 2019;9(2):5291–304.10.35940/ijeat.B2603.129219Search in Google Scholar
[7] Chen Y, Liou F. Additive manufacturing of metal functionally graded materials: a review. Proceedings of the 29th Annual International Solid Freeform Fabrication Symposium. -An Additive Manufacturing Conference. Austin, USA: The University of Texas; Aug 2018.Search in Google Scholar
[8] Zhang C, Chen F, Huang Z, Jia M, Chen G, Ye Y, et al. Additive manufacturing of functionally graded materials: a review. Mater Sci Eng A. 2019;764:29.10.1016/j.msea.2019.138209Search in Google Scholar
[9] Zhai X, Jin L, Jiang J. A survey of additive manufacturing reviews. Mater Sci Addit Manuf. 2022;1(4):1–22.10.18063/msam.v1i4.21Search in Google Scholar
[10] Yang W, Yoon J, Lee H, Shim DS. Defect of functionally graded material of inconel 718 and STS 316l fabricated by directed energy deposition and its effect on mechanical properties. J Mater Res Technol. 2022;17:478–97.10.1016/j.jmrt.2022.01.029Search in Google Scholar
[11] Aysha CPM S, Varghese B, Baby A. A review on functionally graded materials. Int J Eng Sci. 2014;3(6):90–101.Search in Google Scholar
[12] Kumar Bohidar S, Sharma R, Mishra R. Functionally graded materials: a critical review. Int J Sci Footpr. 2014;2(4):18–29.Search in Google Scholar
[13] Owoputi AO, Inambao FL, Ebhota WS. A review of functionally graded materials: fabrication processes and applications. Int J Appl Eng Res. 2018;13(23):16141–51.Search in Google Scholar
[14] Udupa G, Rao SS, Gangadharan KV. Functionally graded composite materials: an overview. Procedia Mater Sci. 2014;5:1291–9.10.1016/j.mspro.2014.07.442Search in Google Scholar
[15] Sarathchandra DT, Kanmani Subbu S, Venkaiah N. Functionally graded materials and processing techniques: an art of review. Mater Today: Proc. 2018;5:21328–34.10.1016/j.matpr.2018.06.536Search in Google Scholar
[16] Naebe M, Shirvanimoghaddam K. Functionally graded materials: a review of fabrication and properties. Appl Mater Today. 2016;5:223–45.10.1016/j.apmt.2016.10.001Search in Google Scholar
[17] Fayazfar H, Salarian M, Rogalsky A, Sarker D, Russo P, Paserin V, et al. A Critical review of powder-based additive manufacturing of ferrous alloys: process parameters, microstructure and mechanical properties. Mater Des. 2018;144:98–128.10.1016/j.matdes.2018.02.018Search in Google Scholar
[18] El-Wazery MS, El-Desouky AR. A review on functionally graded ceramic-metal materials. J Mater Environ Sci. 2015;6(5):1369–76.Search in Google Scholar
[19] Song X, Huang J, Fan D. Review of functionally graded materials processed by additive manufacturing. China Weld. 2023;32(3):41–50.Search in Google Scholar
[20] Yan L, Chen Y, Liou F. Additive manufacturing of functionally graded metallic materials using laser metal deposition. Addit Manuf. 2020;31:28.10.1016/j.addma.2019.100901Search in Google Scholar
[21] Zhang B, Jaiswal P, Rai R, Nelaturi S. Additive manufacturing of functionally graded material objects: a review. J Comput Inf Sci Eng. 2018;14(4):22.10.1115/1.4039683Search in Google Scholar
[22] Li W, Han B. Research and application of functionally gradient materials. Mater Sci Eng. 2018;394:6.10.1088/1757-899X/394/2/022065Search in Google Scholar
[23] Alami AH, Ghani Olabi A, Alashkar A, Alasad S, Aljaghoub H, Rezk H, et al. Additive manufacturing in the aerospace and automotive industries: recent trends and role in achieving sustainable development goals. Ain Shams Eng J. 2023;14:18.10.1016/j.asej.2023.102516Search in Google Scholar
[24] D’Andrea D. Additive manufacturing of AISI 316L stainless steel: a review. Metals. 2023;13:24.10.3390/met13081370Search in Google Scholar
[25] Griffith ML, Harwell LD, Romero T, Schlienger E, Atwood CL, Smugeresky JE. Multi-material processing by lens. International Solid Freeform Fabrication Symposium. Austin. USA: The University of Texas; 1997 Aug.Search in Google Scholar
[26] Koike R, Unotoro I, Kakinuma Y, Aoyama T, Oda Y, Kuriya T, et al. Evaluation for mechanical characteristics of Inconel625-SUS316L joint produced with direct energy deposition. Procedia Manuf. 2017;14:105–10.10.1016/j.promfg.2017.11.012Search in Google Scholar
[27] Kumar S, Choudhary AKS, Anwar J, Sharma V. Optimization of process parameters in direct metal deposition technique using Taguchi method. Int J Mech Eng Technol. 2016;7(3):225–39.Search in Google Scholar
[28] Heer B, Bandyopadhyay A. Compositionally graded magnetic-nonmagnetic bimetallic structure using laser engineered net shaping. Mater Lett. 2018;216:16–9.10.1016/j.matlet.2017.12.129Search in Google Scholar
[29] Kim DK, Woo W, Kim EY, Choi SH. Microstructure and mechanical characteristics of multi-layered materials composed of 316L stainless steel and ferritic steel produced by direct energy deposition. J Alloys Compd. 2019;774:896–907.10.1016/j.jallcom.2018.09.390Search in Google Scholar
[30] Woo W, Kim DK, Kingston EJ, Luzin V, Salvemini F, Hill MR. Effect of interlayers and scanning strategies on through-thickness residual stress distributions in additive manufactured ferritic-austenitic steel structure. Mater Sci Eng A. 2019;744:618–29.10.1016/j.msea.2018.12.078Search in Google Scholar
[31] Zhang CH, Zhang H, Wu CL, Zhang S, Sun ZL, Dong SY. Multi-layer functional graded stainless steel fabricated by laser melting deposition. Vacuum. 2017;141:181–7.10.1016/j.vacuum.2017.04.020Search in Google Scholar
[32] Jo M, Kim H-S, Park JY, Lee SG, Kim BJ, Kim HC, et al. Microstructure and mechanical properties of P21-STS316L functionally graded material manufactured by direct energy deposition 3D print. Metals. 2022;12(12):1–17.10.3390/met12122086Search in Google Scholar
[33] Zhang X, Chen Y, Liou F. Fabrication of SS316L-IN625 functionally graded materials by powder-fed directed energy deposition. Sci Technol Weld Join. 2019;24(5):504–16.10.1080/13621718.2019.1589086Search in Google Scholar
[34] Mehrabi O, Seyedkashi SMH, Moradi M. Functionally graded additive manufacturing of thin-walled 316L stainless steel-Inconel 625 by direct laser metal deposition process: characterization and evaluation. Metals. 2023;13(6):1–18.10.3390/met13061108Search in Google Scholar
[35] MacDonald BE, Zheng B, Fields B, Wang X, Jiang S, Cao P. Influence of co-deposition strategy on the mechanical behavior of additively manufactured functionally integrated materials. Addit Manuf. 2023;61:103328.10.1016/j.addma.2022.103328Search in Google Scholar
[36] Bin Han S, Lee YS, Park SH, Song H. Ti-containing 316L stainless steels with excellent tensile properties fabricated by directed energy deposition additive manufacturing. Mater Sci Eng A. 2023;862:144414.10.1016/j.msea.2022.144414Search in Google Scholar
[37] Guner A, Bidare P, Jiménez A, Dimov S, Essa K. Nozzle designs in powder-based direct laser deposition: a review. Int J Precis Eng Manuf. 2022;23(9):1077–94.10.1007/s12541-022-00688-1Search in Google Scholar
[38] Chen B, Su Y, Xie Z, Tan C, Feng J. Development and characterization of 316L/Inconel625 functionally graded material fabricated by laser direct metal deposition. Opt Laser Technol. 2020;123:8.10.1016/j.optlastec.2019.105916Search in Google Scholar
[39] Meng W, Zhang W, Zhang W, Yin X, Cui B. Fabrication of steel-Inconel functionally graded materials by laser melting deposition integrating with laser synchronous preheating. Opt Laser Technol. 2020;131:10.10.1016/j.optlastec.2020.106451Search in Google Scholar
[40] Carroll BE, Otis RA, Borgonia JP, Suh JO, Dillon RP, Shapiro AA, et al. Functionally graded material of 304L stainless steel and Inconel 625 fabricated by directed energy deposition: characterization and thermodynamic modeling. Acta Mater. 2016;108:46–54.10.1016/j.actamat.2016.02.019Search in Google Scholar
[41] Muller P, Mognol P, Hascoet JY. Modeling and control of a direct laser powder deposition process for functionally graded materials (fgm) parts manufacturing. J Mater Process Technol. 2013;213(5):685–92.10.1016/j.jmatprotec.2012.11.020Search in Google Scholar
[42] Sargent N, Wang Y, Li D, Zhao Y, Wang X, Xiong W. Exploring alloy design pathway through directed energy deposition of powder mixtures: a study of stainless steel 316L and Inconel 718. Addit Manuf Lett. 2023;6:100133.10.1016/j.addlet.2023.100133Search in Google Scholar
[43] Sommer N, Bauer A, Kahlmeyer M, Wegener T, Degener S, Liehr A. High-throughput alloy development using advanced characterization techniques during directed energy deposition additive manufacturing. Adv Eng Mater. 2023;25(15):1–11.10.1002/adem.202300030Search in Google Scholar
[44] Markanday JFS. Applications of alloy design to cracking resistance of additively manufactured Ni-based alloys. Mater Sci Technol. 2022;38(16):1300–14.10.1080/02670836.2022.2068759Search in Google Scholar
[45] Zhu Q, Yu X, Yao P, Yue Y, Kang G. Study on optimization strategy for the composition transition gradient in SS 316L/Inconel 625 functionally graded materials. Materials. 2024;17:1–15.10.3390/ma17122910Search in Google Scholar PubMed PubMed Central
[46] Anand M, Das AK. Grain refinement in wire-Arc additive manufactured inconel 82 alloy through controlled heat input. J Alloys Compd. 2022;929:166949.10.1016/j.jallcom.2022.166949Search in Google Scholar
[47] Anand M, Das AK. Issues in fabrication of 3D components through DMLS Technique: A review. Opt Laser Technol. 2021;139:106914.10.1016/j.optlastec.2021.106914Search in Google Scholar
[48] Terrassa KL, Smith TR, Jiang S, Sugar JD, Schoenung JM. Improving build quality in directed energy deposition by cross-hatching. Mater Sci Eng A. 2019;765:1–8.10.1016/j.msea.2019.138269Search in Google Scholar
[49] Choi C, Jung M. Characterization and mechanical properties of stainless steel 316L fabricated using additive manufacturing processes. KEPCO J Electr Power Energy. 2021;7(1):129–35.Search in Google Scholar
[50] Soodi M, Masood SH, Brandt M. Tensile strength of functionally graded and wafer layered structures produced by direct metal deposition. Rapid Prototyp J. 2014;20(5):360–8.10.1108/RPJ-02-2013-0014Search in Google Scholar
[51] Paul AC, Jinoop AN, Paul CP, Deogiri P, Bindra KS. Investigating build geometry characteristics during laser directed energy deposition based additive manufacturing. J Laser Appl. 2020;32(4):15.10.2351/7.0000004Search in Google Scholar
[52] Ribeiro I, Matos F, Jacinto C, Salman H, Cardeal G, Carvalho H, et al. Framework for life cycle sustainability assessment of additive manufacturing. Sustainability. 2020;12(3):22.10.3390/su12030929Search in Google Scholar
[53] Han D, Lee H. Recent advances in multi-material additive manufacturing: methods and applications. Curr Opin Chem Eng. 2020;28:158–66.10.1016/j.coche.2020.03.004Search in Google Scholar
[54] Popov VV, Fleisher A. Hybrid additive manufacturing of steels and alloys. Manuf Rev. 2020;7(6):9.10.1051/mfreview/2020005Search in Google Scholar
[55] Zhang W, Soshi M, Yamazaki K. Development of an additive and subtractive hybrid manufacturing process planning strategy of planar surface for productivity and geometric accuracy. Int J Adv Manuf Technol. 2020;109(5–6):1479–91.10.1007/s00170-020-05733-9Search in Google Scholar
[56] Liu B, Shen H, Deng R, Li S, Tang S, Fu J, et al. Research on a planning method for switching moments in hybrid manufacturing processes. J Manuf Process. 2020;56:786–95.10.1016/j.jmapro.2020.05.039Search in Google Scholar
[57] Spiegel CA, Hippler M, Münchinger A, Bastmeyer M, Barner-Kowollik C, Wegener M, et al. 4D printing at the microscale. Adv Funct Mater. 2020;30(26):16.10.1002/adfm.201907615Search in Google Scholar
[58] Gao W, Zhang Y, Ramanujan D, Ramani K, Chen Y, Williams CB, et al. The status, challenges, and future of additive manufacturing in engineering. Comput Aided Des. 2015;69:65–89.10.1016/j.cad.2015.04.001Search in Google Scholar
[59] Song Y-A, Park S. Investigation into freeform fabrication of multi-material parts by 3D welding and milling process. Mat Res Soc Symp Proc. 2000;625:37–42.10.1557/PROC-625-37Search in Google Scholar
[60] Choi J, Kwon OC, Jo W, Lee HJ, Moon MW. 4D printing technology: a review, 3D Print. Addit Manuf. 2015;2(4):159–67.10.1089/3dp.2015.0039Search in Google Scholar
[61] Dobrzański LA, Dobrzański LB, Dobrzańska-Danikiewicz AD. Additive and hybrid technologies for products manufacturing using powders of metals, their alloys and ceramics. Arch Mater Sci Eng. 2020;102(2):59–85.10.5604/01.3001.0014.1525Search in Google Scholar
[62] Roblek V, Thorpe O, Bach MP, Jerman A, Meško M. The fourth industrial revolution and the sustainability practices: a comparative automated content analysis approach of theory and practice. Sustainability. 2020;12(20):1–27.10.3390/su12208497Search in Google Scholar
[63] Sepasgozar SME, Shi A, Yang L, Shirowzhan S, Edwards DJ. Additive manufacturing applications for industry 4.0: a systematic critical review. Buildings. 2020;10(12):1–30.10.3390/buildings10120231Search in Google Scholar
[64] Asadollahi-Yazdi E, Couzon P, Nguyen NQ, Ouazene Y, Yalaoui F. Industry 4.0: revolution or evolution?. Am J Oper Res. 2020;10(6):241–68.10.4236/ajor.2020.106014Search in Google Scholar
[65] Butt J. A strategic roadmap for the manufacturing industry to implement industry 4.0. Designs. 2020;4(11):1–31.10.3390/designs4020011Search in Google Scholar
[66] Dev Singh D, Arjula S, Raji Reddy A, Sathwik S. Quality of powder fed direct energy deposition parts: a review. Proceeding of the 14th International Conference on Materials Processing and Characterization. Hyderabad, India: AIP Conference Proceedings; 2023 March.10.1063/5.0194052Search in Google Scholar
© 2024 the author(s), published by De Gruyter
This work is licensed under the Creative Commons Attribution 4.0 International License.
Articles in the same Issue
- Research Articles
- Evaluation of the mechanical and dynamic properties of scrimber wood produced from date palm fronds
- Performance of doubly reinforced concrete beams with GFRP bars
- Mechanical properties and microstructure of roller compacted concrete incorporating brick powder, glass powder, and steel slag
- Evaluating deformation in FRP boat: Effects of manufacturing parameters and working conditions
- Mechanical characteristics of structural concrete using building rubbles as recycled coarse aggregate
- Structural behavior of one-way slabs reinforced by a combination of GFRP and steel bars: An experimental and numerical investigation
- Effect of alkaline treatment on mechanical properties of composites between vetiver fibers and epoxy resin
- Development of a small-punch-fatigue test method to evaluate fatigue strength and fatigue crack propagation
- Parameter optimization of anisotropic polarization in magnetorheological elastomers for enhanced impact absorption capability using the Taguchi method
- Determination of soil–water characteristic curves by using a polymer tensiometer
- Optimization of mechanical characteristics of cement mortar incorporating hybrid nano-sustainable powders
- Energy performance of metallic tubular systems under reverse complex loading paths
- Enhancing the machining productivity in PMEDM for titanium alloy with low-frequency vibrations associated with the workpiece
- Long-term viscoelastic behavior and evolution of the Schapery model for mirror epoxy
- Laboratory experimental of ballast–bituminous–latex–roving (Ballbilar) layer for conventional rail track structure
- Eco-friendly mechanical performance of date palm Khestawi-type fiber-reinforced polypropylene composites
- Isothermal aging effect on SAC interconnects of various Ag contents: Nonlinear simulations
- Sustainable and environmentally friendly composites: Development of walnut shell powder-reinforced polypropylene composites for potential automotive applications
- Mechanical behavior of designed AH32 steel specimens under tensile loading at low temperatures: Strength and failure assessments based on experimentally verified FE modeling and analysis
- Review Article
- Review of modeling schemes and machine learning algorithms for fluid rheological behavior analysis
- Special Issue on Deformation and Fracture of Advanced High Temperature Materials - Part I
- Creep–fatigue damage assessment in high-temperature piping system under bending and torsional moments using wireless MEMS-type gyro sensor
- Multiaxial creep deformation investigation of miniature cruciform specimen for type 304 stainless steel at 923 K using non-contact displacement-measuring method
- Special Issue on Advances in Processing, Characterization and Sustainability of Modern Materials - Part I
- Sustainable concrete production: Partial aggregate replacement with electric arc furnace slag
- Exploring the mechanical and thermal properties of rubber-based nanocomposite: A comprehensive review
- Experimental investigation of flexural strength and plane strain fracture toughness of carbon/silk fabric epoxy hybrid composites
- Functionally graded materials of SS316L and IN625 manufactured by direct metal deposition
- Experimental and numerical investigations on tensile properties of carbon fibre-reinforced plastic and self-reinforced polypropylene composites
- Influence of plasma nitriding on surface layer of M50NiL steel for bearing applications