Evaluating deformation in FRP boat: Effects of manufacturing parameters and working conditions
-
Pham-Thanh Nhut


Abstract
Fiber-reinforced plastic (FRP) is utilized in the fabrication of the primary structures of FRP boats. A majority of these structures are produced using molds. Subsequently, these products often experience deformation upon being released from the mold, as well as when they are exposed to high temperatures. Hence, it is crucial to carry out experimental investigations and evaluations related to the deformation of laminated composite structures. The specimens, which are in the form of L-shapes and curve-shapes, are constructed using unsaturated polyester resin and fiberglass material. The study focuses on two independent variables, namely the percentage of hardeners and the temperature during the manufacturing process. The output factor under examination is deformation, which is measured on these specimens. Subsequently, all of the specimens are subjected to varying levels of temperature using an oven as the working condition. The deformation is further assessed based on the experimental findings and regression equation. The results indicate that as the rate of hardener and temperature increase, the level of deformation decreases. Additionally, it was observed that when the temperature rises from 500 to 800°C, the specimens with initial deformation values that are either too high or too low undergo rapid changes. Moreover, the experimental equations can be utilized to predict the values of deformation or input factors.
1 Introduction
Laminate composite is extensively employed because of its excellent qualities, including high specific strength, high specific modulus, and low cost. Combining reinforcing fibers with a polymer matrix creates the most widely used composite material ever. Carbon, glass, aramid, and other fiber types are among the matrices used in this, together with unsaturated polyester, epoxy, or vinyl-ester resin. Glass fibers and unsaturated polyester resin are the primary building components utilized in the manufacturing of tiny composite boats. Resin transfer molding (RTM) is the principal technique for producing composite boats. The fibers in this process are positioned within a mold prior to the application of resin. Room temperature will allow the material in the mold to self-cure. An exothermic interaction between the resin and the curing agent, which is put into the resin prior to usage, causes unsaturated polyester to cure. As a result, the product deforms and shrinks after curing. The product’s geometry, therefore, frequently differs from the mold after the mold has been removed.
The manufacturing process, strength, and even the appearance of composite structures can all be impacted by deformation. It finds the challenging to achieve high precision, particularly for items with complicated forms, as well as to manage deformation. In addition, the temperature of the working environment has an impact on how structures deform. Several composite structures, such as a boat’s bulkhead, floor, and engine room frame, must function in temperatures above 60°C. Thus, conducting experimental research and evaluating the deformation of laminated composite structures is imperative.
Researchers have investigated the relationship between temperature and laminate composite deformation (or shrinkage). Xiaoxia et al. [1] studied the thermal curing-induced deformation of fiber composite laminates. The coupling method of multi-physical fields was used for this study. The fiber-dominated parameters, such as ply orientation and fiber volume percentage, and the resin-dominated ones, such as curing shrinkage and reaction heat, were methodically considered. The simulated results show that these factors impact the curing deformation differently: reaction heat primarily influences the temperature and curing degree fields, and chemical shrinkage directly impacts the strain. Conversely, ply orientation and fiber volume fraction impact the laminates’ mechanical properties. The prediction and control of deformation of continuous fiber-reinforced thermosetting composite structures caused by the curing process were reviewed by Biao et al. [2]. The authors claim that because the curing process involves high coupling effects of the thermochemomechanical behaviors of composite components, the mechanism of the process-induced deformation is complicated. The findings demonstrated the potential effectiveness of analytical approaches for the behavior prediction of components with regular geometry; nevertheless, numerical methods are more commonly employed because of their adaptability to complex geometries.
The impact of cure settings on residual deformation for thermoset composite laminates was investigated by Zhendong et al. [3]. An investigation was conducted using varying heating rates and initial stay durations. In addition, a multi-scale thermoviscoelastic modeling method was used to forecast the deformation caused by the process. Based on the findings, it is recommended to use a lower heating rate in order to lessen residual stress and process-induced deformation. Additionally, Zhendong et al. [4] employed a different technique that involved the introduction of prestresses to lessen process-induced deformation of carbon fiber-reinforced polymers. The study suggested applying prestress to one layer or a subset of the layers rather than all relevant layers in order to lessen distortion caused by processes. The required prestress level for the single layer in this procedure was within a tolerable range. In contrast, the experimental findings indicate that the prestressing layer lowers more than 80% of the curing deformation. Theoretically, the prestress technique can entirely counterbalance the specimens’ curing deformation.
The impact of epoxy’s chemical shrinkage and anisotropy in thermal expansion on the process-induced deformation of carbon/epoxy composite stiffener structures was examined and assessed by Yoon et al. [5]. Temperature variation was used to describe the elastic characteristics and coefficients of thermal expansion in the primary directions of the material. Then, they predicted the distortion of curved laminate using a computer technique. The use of macro-fiber composite (MFC) actuators to compensate for heat deformation in composite structures was investigated by Dano et al. [6]. The particular goal is to ascertain if MFC actuators connected to a composite plate’s surface can counteract thermally induced deformations when actuated using both experimentation and finite-element analysis techniques.
According to Kim et al. [7], surface deformation caused by heat stress was examined for circular quasi-isotropic laminate mirrors. Finite element calculations are conducted on circular quasi-isotropic laminated mirrors to examine thermally induced surface deformations. Sun et al. examined Heat diaphragm-formed C-shaped thermosetting composite laminates [8] for the impact of forming temperature on quality. This article examined the mechanism of double diaphragm forming for C-shaped carbon fiber/epoxy resin prepreg laminate. Additionally, a hot diaphragm-forming apparatus was built to explore the impact of forming temperature on the quality of produced laminate. Furthermore, there are several other studies on the deformation of structures caused by cure-induced deformation [9,10,11,12] and fiber orientation or stacking sequence [13,14,15,16].
For the processing of statistical data, several books and manuals introducing statistical theory and regression, such as Roni and Djajadikerta [17], Dougherty [18], Lewis-Beck [19], and Zou et al. [20]. In addition, Oyeyemi et al. [21] have compared the utility of three statistical data processing software: SAS, SPSS, and STATA. The results show that SPSS software is highly reliable and easy to use.
It is clear from the aforementioned analysis that there are several reasons why composite structures distort. However, the impact of the heat element is our main concern in this investigation. The curing reaction is the indirect heat source, whereas manufacturing and operating circumstances are the direct heat sources. A more significant hardener percentage causes the exothermic process to become stronger.
In general, most structures on FRP boats are produced using the RTM technique, utilizing unsaturated polyester resin as the primary material. Product distortion frequently occurs due to the polymerization reaction when a hardener is employed to cure the resin. In addition, several structural components are subjected to high-temperature conditions when in operation, causing additional deformations, and all such deformations remain uncontrolled. Therefore, this study aims to examine the deformation of several exemplary structural elements on FRP boats using experimental modeling. The deformation of FRP structures is evaluated by examining many vital parameters, such as the percentages of hardeners, manufacturing temperature factors, and operational temperature (working conditions). Furthermore, to control the deformation of structural components on FRP boats, this study processes experimental data using SPSS software. Formulas derived from the statistical results of experiments will enable the control of deformation levels by adjusting input parameters such as hardener percentages and manufacturing temperature. This approach enables a comprehensive analysis of the experimental data, which in turn provides insights into the factors that influence the deformation of FRP boats. The results of this study could prove useful for businesses and academic institutions involved in the design and manufacture of FRP boats.
2 Methodology
2.1 Method
FRP vessels’ and fishing boats’ primary structural shapes are curved and L-shaped (Figure 1). Glass fiber and unsaturated polyester resin are the principal building components. Methyl Ethyl Ketone Peroxide (MEKP) is the curing agent used in unsaturated polyester resin. Therefore, utilizing glass fiber and unsaturated polyester resin, L-shaped and curve-shaped specimens are created in this investigation, with two varied factors: temperature and hardener % (MEKP). The samples are created manually using hand lay-up and produced by the RTM technique. The specimens are taken out of the mold, and their respective deformations are measured after a full day of natural drying at room temperature. After that, an oven with four temperature settings is used to heat them all. Deformation is remeasured 48 h after each stage. The specimen’s deformation is assessed three times, and the average result is given. An experimental equation is also provided by the simultaneous multiple regression model [18]. The regression equation and experimental findings are used to assess the specimens’ deformation.

Geometries of FRP boat: (a) arrangement view; (b) structure view; and (c) cross-section view.
2.2 Theory
In addition to being evaluated directly, the regression equation also discusses the experiment’s outcomes. We employ the multiple linear nonlinear regression model in this study [18]:
General equation of linearity model is given by:
where y is the dependent variable; x
1
, x
2
,…, x
k
are the independent variables;
In this work, the independent variables are assigned as follows:
x 1 = percentage of hardener, %
x 2 = temperature, °C
and dependent variable is deformation (Def.), mm.
For the nonlinearity model, we can use a general form as follows:
By defining
The experiment data were processed by SPSS software (Statistical Package for the Social Sciences).
3 Experiment
3.1 Description of materials and specimens
Fifteen varieties of L-shaped samples and 15 types of curve-shaped samples made up the total number of samples, as shown in Table 1. Both the woven (with a mass per square meter of 570 g/m2) and mat (with a mass per square meter of 300 g/m2) E-glass fibers came from the South Korean Kimchon Plant Company. The hardener and unsaturated polyester resin (MEKP-925) were obtained from the South Korean manufacturer AEKYUNG. Polyester’s characteristics are displayed in Table 2 and Figure 2. The fabrication methods for experimental specimens corresponded to the regulations provided in the reference [22].
Code of specimens
| Types | Hard. (%) | Code of specimens | ||
|---|---|---|---|---|
| 15°C | 25°C | 35°C | ||
| L-shape | 0.5 | L-H0.5-T15 | L-H0.5-T25 | L-H0.5-T35 |
| 1.0 | L-H1.0-T15 | L-H1.0-T25 | L-H1.0-T35 | |
| 1.5 | L-H1.5-T15 | L-H1.5-T25 | L-H1.5-T35 | |
| 2.0 | L-H2.0-T15 | L-H2.0-T25 | L-H2.0-T35 | |
| 2.5 | L-H2.5-T15 | L-H2.5-T25 | L-H2.5-T35 | |
| Curve shape | 0.5 | C-H0.5-T15 | C-H0.5-T25 | C-H0.5-T35 |
| 1.0 | C-H1.0-T15 | C-H1.0-T25 | C-H1.0-T35 | |
| 1.5 | C-H1.5-T15 | C-H1.5-T25 | C-H1.5-T35 | |
| 2.0 | C-H2.0-T15 | C-H2.0-T25 | C-H2.0-T35 | |
| 2.5 | C-H2.5-T15 | C-H2.5-T25 | C-H2.5-T35 | |
Properties of unsaturated polyester resin
| Parameters | Units | Values |
|---|---|---|
| Type | — | CF-180 |
| Density | g/cm3 | 1.1–1.2 |
| Viscosity at 25°C | CP | 450 ± 50 |
| Gel time at 25°C | minute | 12–15 |
| Catalyst (MEKP) at 25°C | % | ∼1.0 |
| Peak temperature | °C | 138 |

Materials used in specimen manufacturing: (a) woven 570 g/m2 E-glass fiber; (b) mat 300 g/m2 E-glass fiber; (c) unsaturated polyester resin; and (d) hardener (MEKP-925).
The specimens were made from fiberglass/polyester with four layers [mat/woven/mat/woven (∼3 mm thickness)]. The L-shape specimens were made from an aluminum mold, and the curve-shape specimens were made from a composite mold. Every mold was divided into two parts for two specimens (Figure 3). Geometric parameters of molds and specimens are shown in Figure 4.

L-Shape mold (Aluninum) and curve-shape mold (composite).

Geometric parameters of molds and specimens.
3.2 Experiment setup
Stage 1 (fabricate conditions): Fabrication temperature conditions correspond to the environmental temperature.
The resin and fiber were laid up onto the mold in a ratio of 45/55 parts by weight. The total number of specimens was divided into nine fabrication cycles. In the first cycle, 0.5% and 1% vol. MEKP-925 catalysts were mixed into the resin and used for each mold part. Subsequently, they were placed in the drying oven at 15°C for 1 h. Hardener rates of 1.5 and 2.0% were used for the second cycle, and for the third cycle, it was 2.5%. The performance remained consistent at 25 and 35°C (Figure 5). The hardener rate and temperature levels were selected based on standard values provided by the manufacturer as presented in Table 2. After a minimum of 48 h of specimen fabrication, the specimens were removed from the molds, and deformation was measured at three positions, as shown in Figure 4. The drying oven utilized in this study is of the Thermo Oven GP type (The Carl Stuart Group, UK) with the following basic specifications: product type, Oms100; power supply, 230 V, 60 Hz; temperature range, 10–250°C; internal volume, 104 L; internal dimensions (W × D × H), 464 × 368 × 608 mm; outer dimensions (W × D × H), 640 × 565 × 820 mm (Figure 6c).
Stage 2 (work conditions): Conditions for usage temperature are in line with the marine engine room’s temperature.

Manufacturing process (stage 1): (a) specimens with 0.5% and 1% MEKP; (b) specimens with 1.5% and 2% MEKP; (c) specimens with 2.5% MEKP.

Some pictures of manufacturing process (stage 1): (a) L-shaped specimens fabricated within the mold; (b) curve-shaped specimens fabricated within the mold; (c) thermal treatment for specimens in the furnace; (d) specimens after mold separation; (e) placing specimens into the mold for deformation measurement.
After completing the specimen fabrication in phase 1 for a minimum of 72 h, all specimens are subjected to additional heating for 48 h at four temperature levels: 50, 60, 70, and 80°C (corresponding to the operational temperature range of the marine engine room). Initially, all 15 L-shape and 15 curve-shape specimens are placed in the oven and heated to 50°C for 2 h. Subsequently, the specimens are removed from the oven and allowed to cool naturally, and deformation is measured as in phase 1. The subsequent steps are carried out similarly at 60, 70, and 80°C temperatures, as shown in Figure 7.
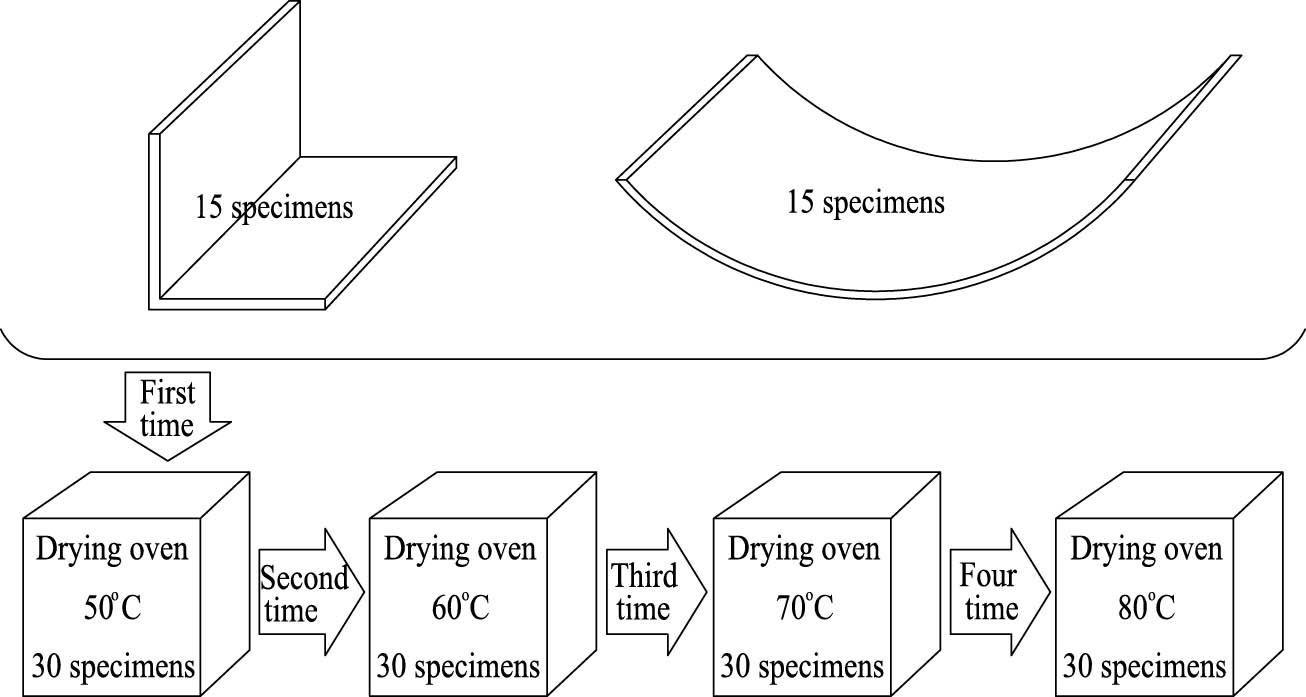
Heating process (stage 2).
3.3 Experimental result
3.3.1 Results of deformation measurement in phase 1
The specimens’ deformation was measured using a Mitutoyo microscale. The positions of the three measurement points are described in Figure 4. The final deformation result is the average value of the measurements taken at these three points. The deformation results are presented in Table 3 and Figure 8.
Results of the deformation measurement in Phase 1
| Types | Specimens | Deflection (mm) | |||
|---|---|---|---|---|---|
| Point 1 | Point 2 | Point 3 | Mean | ||
| L-shape | L-H0.5-T15 | 5.80 | 5.60 | 5.70 | 5.70 |
| L-H0.5-T25 | 4.30 | 4.30 | 4.30 | 4.30 | |
| L-H0.5-T35 | 2.40 | 2.40 | 2.60 | 2.47 | |
| L-H1.0-T15 | 4.90 | 4.70 | 4.90 | 4.83 | |
| L-H1.0-T25 | 3.70 | 3.70 | 3.70 | 3.70 | |
| L-H1.0-T35 | 2.00 | 2.30 | 2.30 | 2.20 | |
| L-H1.5-T15 | 4.40 | 4.30 | 4.30 | 4.33 | |
| L-H1.5-T25 | 3.30 | 3.50 | 3.60 | 3.47 | |
| L-H1.5-T35 | 2.00 | 2.00 | 1.90 | 1.97 | |
| L-H2.0-T15 | 3.90 | 4.00 | 3.60 | 3.83 | |
| L-H2.0-T25 | 2.80 | 3.00 | 3.10 | 2.97 | |
| L-H2.0-T35 | 1.80 | 1.70 | 1.70 | 1.73 | |
| L-H2.5-T15 | 3.50 | 3.60 | 3.50 | 3.53 | |
| L-H2.5-T25 | 2.70 | 2.70 | 2.50 | 2.63 | |
| L-H2.5-T35 | 1.60 | 1.60 | 1.70 | 1.63 | |
| Curve-shape | C-H0.5-T15 | 4.10 | 4.00 | 4.00 | 4.03 |
| C-H0.5-T25 | 3.80 | 3.90 | 3.90 | 3.87 | |
| C-H0.5-T35 | 3.20 | 3.40 | 3.40 | 3.33 | |
| C-H1.0-T15 | 3.60 | 3.60 | 3.70 | 3.63 | |
| C-H1.0-T25 | 3.50 | 3.40 | 3.30 | 3.40 | |
| C-H1.0-T35 | 2.40 | 2.60 | 2.50 | 2.50 | |
| C-H1.5-T15 | 3.20 | 3.20 | 3.10 | 3.17 | |
| C-H1.5-T25 | 2.70 | 3.00 | 2.90 | 2.87 | |
| C-H1.5-T35 | 2.00 | 2.40 | 2.00 | 2.13 | |
| C-H2.0-T15 | 2.60 | 2.70 | 2.50 | 2.60 | |
| C-H2.0-T25 | 2.50 | 2.50 | 2.40 | 2.47 | |
| C-H2.0-T35 | 1.50 | 1.70 | 1.50 | 1.57 | |
| C-H2.5-T15 | 2.40 | 2.30 | 2.20 | 2.30 | |
| C-H2.5-T25 | 2.20 | 2.40 | 2.10 | 2.23 | |
| C-H2.5-T35 | 1.30 | 1.30 | 1.20 | 1.27 | |

Results of deformation (stage 1): (a) L-shape specimens; (b) curve-shape specimens.
According to the observations from Figure 8, it can be concluded that the deformation rate decreases with the increase in temperature and the percentage of hardener for both types of specimens, L-shaped and curve-shaped. Figure 8a displays that the slope of the deformation rate gradually decreases as the hardener percentage increases from 0.5 to 2.5%. On the other hand, Figure 8b shows that the difference in deformation reduction rates among the specimens is insignificant.
When considering the deformation variation concerning the manufacturing temperature, the deformation of curve-shaped specimens exhibited a nonlinear trend with temperature. In contrast, the deformation of L-shaped specimens displayed an almost linear relationship. In this scenario, the deformation of curve-shaped specimens decreased gradually as the temperature increased from 15 to 25°C, but it declined rapidly beyond 25°C. Additionally, the patterns of variation with hardener percentage and temperature differed significantly among the L-shaped specimens. Specifically, as the hardener percentage changed from 0.5 to 2.5, the deformation of the 15-degree specimen decreased from 5.7 to 3.53 mm (a difference of 2.17 mm), the 25-degree specimen decreased from 4.3 to 2.63 mm (a difference of 1.67 mm), and the 35-degree specimen decreased from 2.47 to 1.63 mm (a difference of 0.84 mm). When the temperature increased from 15 to 35°C, the deformation of the 0.5% hardener specimen varied the most (3.23 mm), while the 2.5% hardener specimen varied the least (1.9 mm). These values for the curve-shape specimen showed a relatively uniform deformation, with a variation of approximately 1.7 to 2.3 mm as the hardener percentage changed from 0.5 to 2.5 and a variation of about 0.7 to 1.0 mm as the temperature changed from 15 to 35°C.
3.3.2 Results of deformation measurement in phase 2
The procedure and method for measuring deformation in Phase 2 were carried out similarly to Phase 1. Results of deformation are presented in Table 4 and Figure 9.
Results of the deformation measurement in Phase 2
| Types | Specimens | Deflection (mm) | |||
|---|---|---|---|---|---|
| 50°C | 60°C | 70°C | 80°C | ||
| L-shape | L-H0.5-T15 | 5.13 | 4.23 | 3.77 | 3.67 |
| L-H0.5-T25 | 4.27 | 4.20 | 4.17 | 4.17 | |
| L-H0.5-T35 | 3.00 | 3.77 | 4.40 | 4.93 | |
| L-H1.0-T15 | 4.47 | 4.00 | 3.87 | 3.87 | |
| L-H1.0-T25 | 3.97 | 4.20 | 4.40 | 4.53 | |
| L-H1.0-T35 | 2.63 | 3.47 | 4.83 | 5.60 | |
| L-H1.5-T15 | 4.23 | 4.13 | 4.03 | 4.03 | |
| L-H1.5-T25 | 3.80 | 4.23 | 4.50 | 4.73 | |
| L-H1.5-T35 | 2.83 | 3.90 | 5.00 | 5.93 | |
| L-H2.0-T15 | 4.00 | 4.07 | 4.17 | 4.20 | |
| L-H2.0-T25 | 3.53 | 4.20 | 4.90 | 5.60 | |
| L-H2.0-T35 | 2.77 | 4.00 | 5.33 | 6.10 | |
| L-H2.5-T15 | 3.80 | 4.50 | 4.97 | 5.17 | |
| L-H2.5-T25 | 3.63 | 4.43 | 5.27 | 5.87 | |
| L-H2.5-T35 | 2.50 | 3.83 | 5.37 | 6.70 | |
| Curve-shape | C-H0.5-T15 | 3.20 | 1.63 | 0.70 | 0.40 |
| C-H0.5-T25 | 3.13 | 1.50 | 0.90 | 0.67 | |
| C-H0.5-T35 | 3.00 | 2.13 | 1.40 | 1.00 | |
| C-H1.0-T15 | 3.27 | 2.47 | 1.57 | 1.10 | |
| C-H1.0-T25 | 3.10 | 2.27 | 1.70 | 1.30 | |
| C-H1.0-T35 | 2.23 | 2.00 | 1.50 | 1.43 | |
| C-H1.5-T15 | 2.87 | 2.23 | 1.63 | 1.40 | |
| C-H1.5-T25 | 2.60 | 2.10 | 1.60 | 1.53 | |
| C-H1.5-T35 | 2.07 | 2.00 | 1.90 | 1.80 | |
| C-H2.0-T15 | 2.43 | 2.23 | 2.03 | 1.70 | |
| C-H2.0-T25 | 2.40 | 2.23 | 2.13 | 2.10 | |
| C-H2.0-T35 | 1.93 | 2.30 | 2.60 | 2.87 | |
| C-H2.5-T15 | 2.03 | 1.90 | 1.90 | 1.83 | |
| C-H2.5-T25 | 2.27 | 2.33 | 2.37 | 2.37 | |
| C-H2.5-T35 | 1.80 | 2.50 | 3.00 | 3.37 | |

Results of deformation in Phase 2: (a) L-shape specimens; (b) curve-shape specimens.
After 48 h of heating, the deformation of all specimens was measured. The deformation results are presented in Figure 9. The findings showed that the deformation of most specimens increased for the L-shape and decreased for the curve-shape case as the temperature rose from 50 to 80°C. Specimens manufactured under high environmental temperature conditions and with a high hardener content exhibited a significant increase in deformation with increasing working temperature. Conversely, specimens fabricated under low environmental temperature conditions and low hardener content showed a slight decrease in deformation with increasing working temperature. Meanwhile, a few specimens exhibited almost no change in deformation with increasing working temperatures, such as L-H0.5-T25, L-H1.5-T15, and L-H2.0-T15. The maximum deformation value for the L-shape case was 6.70 mm, with a maximum variability range of 4.20 mm (L-H2.5-T35).
Most of the curve-shaped specimens displayed a decrease in deformation as the temperature increased from 50 to 80°C, as shown in Figure 9b. The specimens produced under low environmental temperature conditions and with a small hardener content showed a significant reduction in deformation as the working temperature increased. However, the specimens fabricated under high environmental temperature conditions and with a significant hardener content showed a slight increase in deformation with increasing working temperature. A few specimens, such as C-H1.5-T35, C-H2.0-T25, C-H2.5-T15, and C-H2.5-T25, exhibited almost no change in deformation with increasing working temperature. The minimum deformation value for the curve-shaped specimens was 0.40 mm, and the maximum variability range was 2.80 mm (L-H0.5-T15).
4 Discussions
4.1 Effect of fabricate conditions
Both L-shaped and curve-shaped specimens experienced less deformation with increased temperature and hardener percentage. This was because the resin hardened while the fibers stretched, causing the resin to shrink. Initially, there was noticeable shrinkage, and the fibers moved closer together. As the temperature rises, glass fibers are stretched from 90 degrees to a greater angle (for L-shaped structures) or from 135 mm to a greater radius (for curve-shaped structures). These findings align with research conducted by Xiaoxia et al. [1] and Biao et al. [2] on the curing and shrinking processes of polyester resin.
The variation and deformation differences related to temperature and hardener percentage vary for each specimen. This indicates that the temperature during manufacturing has a more significant effect on the structure’s deformation than the hardener percentage. Therefore, when producing composite products, it is crucial to consider the environmental temperature changes throughout different times of the day (morning, noon, and evening) and the seasons of the year (spring, summer, fall, and winter) to minimize product deformation. Moreover, the deformation caused by the influence of temperature and hardener percentage is more significant for L-shaped specimens than for curve-shaped specimens. L-Shaped specimens are formed by bonding two flat panels together, and flat panels experience significant thermal deformation. Therefore, when producing reinforced structural details on vessels in the form of L, V, or T shapes, it is advisable to reduce the flat panel area by creating a large curved radius between the adjacent surfaces of the two flat panels.
4.2 Effect of working conditions
The study’s findings suggest that the degree of manufacturing conditions has a direct influence on the deformation of the specimens. With an increase in temperature and curing agent concentration, the resin undergoes thermal softening, resulting in a decrease in its mechanical characteristics and the occurrence of internal tensions. This results in an escalation of deformation as the resin persists in contracting due to the impact of residual stress. Conversely, if the specimens are produced at low temperatures and with a low concentration of curing agent, the resin undergoes a process of “softening” as the temperature rises during use. This softening effect causes the glass fibers to regain their straight shape after being bent, resulting in a decrease in the deformation of the specimens compared to their initial state.
The research findings indicate that the performance of L-shaped and curve-shaped specimens is significantly affected by the production parameters, precisely the temperature and hardener rate. To minimize product deformation in the production of FRP boats, it is essential to select optimal manufacturing conditions that consider the product’s shape and the ambient temperature in which it will be used.
In order to provide a more precise description of the research results, the deformation/length and deformation/flexure ratios were computed by creating controlled conditions that simplified evaluations, as indicated in Figure 10. This was done without taking into account the initial deformation. The charts showed that each structure exhibited a stable deformation as the temperature increased. The equivalent result for the curve-shaped case was 2.3 mm with specimen C-H2.5-T25, while for the L-shaped case, it was about 4.2 mm with specimen L-H0.5-T25. If the specimens’ initial deformation (at 50°C) were more significant than these values, then deformation would decrease with increasing temperature and vice versa.

Results of deformation ratio without initial deformation: (a) L-shape specimens; b) curve-shape specimens.
4.3 Prediction of deformation with fabricate conditions
Tables 5 and 6 show how the deformation findings were organized for the SPSS program to use. Def. (mm) is an output factor (dependent variable), whereas Hard. (%) and Temp. (°C) are two input factors (independent variables). For both L-shaped and curve-shaped specimens, the analysis is carried out independently. Input-output correlation and regression are regarded as simple and multiple models, as well as linear and nonlinear models.
Input data for SPSS for L-shape specimens
| Specimens | Hard. (%) | Temp. (°C) | Deflection (mm) |
|---|---|---|---|
| L-H0.5-T15 | 0.5 | 15.0 | 5.70 |
| L-H0.5-T25 | 0.5 | 25.0 | 4.30 |
| L-H0.5-T35 | 0.5 | 35.0 | 2.47 |
| L-H1.0-T15 | 1.0 | 15.0 | 4.83 |
| L-H1.0-T25 | 1.0 | 25.0 | 3.70 |
| L-H1.0-T35 | 1.0 | 35.0 | 2.20 |
| L-H1.5-T15 | 1.5 | 15.0 | 4.33 |
| L-H1.5-T25 | 1.5 | 25.0 | 3.47 |
| L-H1.5-T35 | 1.5 | 35.0 | 1.97 |
| L-H2.0-T15 | 2.0 | 15.0 | 3.83 |
| L-H2.0-T25 | 2.0 | 25.0 | 2.97 |
| L-H2.0-T35 | 2.0 | 35.0 | 1.73 |
| L-H2.5-T15 | 2.5 | 15.0 | 3.53 |
| L-H2.5-T25 | 2.5 | 25.0 | 2.63 |
| L-H2.5-T35 | 2.5 | 35.0 | 1.63 |
Input data for SPSS for curve-shape specimens
| Specimens | Hard. (%) | Temp. (°C) | Def. (mm) |
|---|---|---|---|
| C-H0.5-T15 | 0.5 | 15.0 | 4.03 |
| C-H0.5-T25 | 0.5 | 25.0 | 3.87 |
| C-H0.5-T35 | 0.5 | 35.0 | 3.33 |
| C-H1.0-T15 | 1.0 | 15.0 | 3.63 |
| C-H1.0-T25 | 1.0 | 25.0 | 3.40 |
| C-H1.0-T35 | 1.0 | 35.0 | 2.50 |
| C-H1.5-T15 | 1.5 | 15.0 | 3.17 |
| C-H1.5-T25 | 1.5 | 25.0 | 2.87 |
| C-H1.5-T35 | 1.5 | 35.0 | 2.13 |
| C-H2.0-T15 | 2.0 | 15.0 | 2.60 |
| C-H2.0-T25 | 2.0 | 25.0 | 2.47 |
| C-H2.0-T35 | 2.0 | 35.0 | 1.57 |
| C-H2.5-T15 | 2.5 | 15.0 | 2.30 |
| C-H2.5-T25 | 2.5 | 25.0 | 2.23 |
| C-H2.5-T35 | 2.5 | 35.0 | 1.27 |
To assess how each component affects the dependent variable in a basic regression linear model, two independent variables (x 1, x 2) are considered independently. It got the numbers below (Tables 7 and 8) using SPSS software and data from Tables 5 and 6. where p is the significance threshold, R is the coefficient of correlation, and R 2 is the coefficient of multiple determination.
Simple regression analysis for L-shape specimens
| Factors | β 0 | β 1 | R | R 2 | p |
|---|---|---|---|---|---|
| Hard. | −0.769 | 4.440 | 0.469 | 0.220 | 0.078 |
| Temp. | −0.122 | 6.345 | 0.861 | 0.742 | 0.000 |
Simple regression analysis for curve-shape specimens
| Factors | β 0 | β 1 | R | R 2 | p |
|---|---|---|---|---|---|
| Hard. | −0.918 | 4.134 | 0.827 | 0.684 | 0.000 |
| Temp. | −0.049 | 3.991 | 0.513 | 0.263 | 0.050 |
The L-shaped case has a low hardener rate and a strong temperature correlation coefficient. This indicates a strong correlation between temperature and deformation but a modest correlation with the hardener rate component. Additionally, only the temperature factor (p-value is too small) and the thickness factor (p-value > 5%) were statistically significant. In the case of curves, it was entirely the opposite. Consequently, we are still looking for the regression equation for every element.
For linear multiple regression model, two independent variables (x 1, x 2) are considered together. The results from SPSS software were shown in Tables 9 and 10.
Linear multiple regression analysis for L-shape specimens
| Factors | β i | β 0 | R | R 2 | p |
|---|---|---|---|---|---|
| Hard. | −0.769 | 7.498 | 0.981 | 0.962 | 0.000 |
| Temp. | −0.122 | 0.000 |
Linear multiple regression analysis for curve-shape specimens
| Factors | β i | β 0 | R | R 2 | p |
|---|---|---|---|---|---|
| Hard. | −0.918 | 5.368 | 0.973 | 0.947 | 0.000 |
| Temp. | −0.049 | 0.000 |
The linear multiple regression equations were written:
L-shape case:
Curve-shape case:
The Eqs. (4) and (5) were checked error with the data from Tables 5 and 6 and results were shown in Table 11.
Errors of linear multiple regression equation
| No. of spec. | Error (%) | |
|---|---|---|
| L-shape | Curve-shape | |
| L-H0.5-T15 | −7.31 | 3.49 |
| L-H0.5-T25 | −5.50 | −4.72 |
| L-H0.5-T35 | 15.28 | −4.18 |
| L-H1.0-T15 | 1.36 | 2.25 |
| L-H1.0-T25 | −0.57 | −5.15 |
| L-H1.0-T35 | 11.77 | 9.40 |
| L-H1.5-T15 | 4.18 | 2.82 |
| L-H1.5-T25 | −4.97 | −3.51 |
| L-H1.5-T35 | 5.48 | 6.69 |
| L-H2.0-T15 | 7.74 | 7.58 |
| L-H2.0-T25 | −1.91 | −6.47 |
| L-H2.0-T35 | −2.50 | 15.98 |
| L-H2.5-T15 | 6.00 | 1.65 |
| L-H2.5-T25 | −4.09 | −17.25 |
| L-H2.5-T35 | −20.07 | 7.21 |
Tables 9 and 10 show a very tight association (R > 0.9) between the two input components and deformation. All input factors were also statistically significant, with p-values of zero or very close to zero. For all scenarios, however, the error numbers were too high (almost more than 5%). Therefore, Eqs. (4) and (5) are useless.
After testing a variety of equation forms (square, cube, square root, log, etc.) for the nonlinear multiple regression model, two cubic root Eqs. (6) and (7) were chosen. In addition to satisfying the inaccuracy (almost less than 5%), these equations demonstrated a strong link and statistical significance. Tables 12–14 display the findings.
Nonlinear multiple regression analysis for L-shape specimens
| Factors | β i | β 0 | R | R 2 | p |
|---|---|---|---|---|---|
| Hard. | −0.404 | 3.260 | 0.974 | 0.948 | 0.000 |
| Temp. | −0.466 | 0.000 |
Nonlinear multiple regression analysis for curve-shape specimens
| Factors | β i | β 0 | R | R 2 | p |
|---|---|---|---|---|---|
| Hard. | −0.160 | 1.856 | 0.962 | 0.925 | 0.000 |
| Temp. | −0.009 | 0.000 |
Errors of nonlinear multiple regression equation
| Specimens | Error (%) | |
|---|---|---|
| L-shape | Curve-shape | |
| L-H0.5-T15 | 0.19 | 3.02 |
| L-H0.5-T25 | −3.06 | −1.32 |
| L-H0.5-T35 | 4.69 | −2.41 |
| L-H1.0-T15 | 0.93 | 1.46 |
| L-H1.0-T25 | −3.47 | −2.33 |
| L-H1.0-T35 | 2.36 | 1.51 |
| L-H1.5-T15 | 1.09 | 0.76 |
| L-H1.5-T25 | −5.21 | −2.25 |
| L-H1.5-T35 | 1.59 | 0.80 |
| L-H2.0-T15 | 2.33 | 1.78 |
| L-H2.0-T25 | −3.39 | −3.16 |
| L-H2.0-T35 | 2.09 | 4.83 |
| L-H2.5-T15 | 2.57 | −0.05 |
| L-H2.5-T25 | −2.32 | −6.02 |
| L-H2.5-T35 | 0.80 | 5.12 |
The nonlinear multiple regression equations were written:
The deformation value corresponding to each temperature and hardener rate value may be found using Eqs. (6) and (7), as well as their inverse. In actuality, these elements often create a certain production environment. Thus, their effects are felt simultaneously. Thus, it would be appropriate to apply Eqs. (6) and (7) more broadly.
5 Conclusions
Based on the presented experimental results, the following conclusions can be drawn:
First, two input factors (hardener rate and temperature) were examined to assess the deformation of L-shape and curve-shape laminated composite structures. Two testing phases were implemented: Phase 1, corresponding to the fabrication conditions (temperature and solidification agent content), and Phase 2, corresponding to the operational conditions (environmental working temperature).
Second, the findings for the fabricate circumstances indicated that decreasing the temperature and hardener rate will increase deformation. The change in L-shaped specimens was nearly linear, whereas curve-shaped specimens declined more quickly at temperatures above 25°C and less dramatically when temperatures rose from 15 to 25°C.
Third, during operating conditions, the deformation was relatively steady, rising from 50 to 80°C by around 4.2 mm (L-H0.5-T25) and 2.3 mm (C-H2.5-T2.5). Specimens with starting deformation values that were either too high or too low (due to operating circumstances) saw significant changes in deformation. Therefore, we should be made at the above two related requirements for structures that operate in high-temperature environments.
Fourth, it can forecast deformation or identify the input components by using experimental regression equations. It can be determined how much a structure will deform under particular manufacturing circumstances. To fulfill the deformation requirements for various goods, on the other hand, it may also choose the temperature or hardener rate. The practical ramifications of this are enormous. Depending on its intended use, every product may need varying degrees of distortion (or accuracy). The production parameters (temperature and hardener percentage) may be managed to provide products with deformations that satisfy the criteria using Eqs. (6) and (7).
Finally, to enhance the accuracy and precision of the study on deformation, future work should concentrate on the following research areas: (1) Including additional types of composite materials such as epoxy resin, carbon fibers, and natural fibers in the deformation analysis; (2) Examining deformation across various details with different radii, given the wide range of curved features found on FRP boats, to identify more accurate deformation patterns; (3) Improving the simulation of the deformation process of composite materials to enhance the reliability of the outcomes.
-
Funding information: The authors state no funding is involved.
-
Author contributions: All authors have accepted responsibility for the entire content of this manuscript and approved its submission.
-
Conflict of interest: The authors declare no conflict of interest.
References
[1] Xiaoxia W, Yuxi J, Chengguo W. Thermal curing induced deformation of fiber composite laminates. Polym Polym Compos. 2012;20(2):171–6.10.1177/0967391112020001-233Search in Google Scholar
[2] Biao W, Shuaijie F, Jiping Ch, Weidong Y, Weiping L, Yan L. A review on prediction and control of curing process-induced deformation of continuous fiber-reinforced thermosetting composite structures. Compos Part A: Appl Sci Manuf. 2023;165:107321.10.1016/j.compositesa.2022.107321Search in Google Scholar
[3] Zhendong L, Xitao Z, Lixiaoyuan G, Leilei Y, Guolian S, Shiquan Z. Comparative study on the effect of cure parameters on residual deformation for thermoset composite laminates. J Compos Mater. 2021;55(19):1–14.10.1177/0021998321992423Search in Google Scholar
[4] Zhendong L, Xitao Z, Wenjing F, Fei W, Sohail A, Leilei Y. An alternative method to reduce process-induced deformation of CFRP by introducing prestresses. Chin J Aeronautics. 2022;35(8):314–23.10.1016/j.cja.2022.03.005Search in Google Scholar
[5] Yoon KJ, Kim JS. Effect of thermal deformation and chemical shrinkage on the process induced distortion of carbon-epoxy curved laminates. J Compos Mater. 2001;35(3):253–63.10.1106/XNUF-87AG-V8VA-VXN7Search in Google Scholar
[6] Dano ML, Gakwaya M, Benjamin J. Compensation of thermally induced distortion in composite structures using macro-fiber composites. J Intell Mater Syst Struct. 2008;19:225–33.10.1177/1045389X06074679Search in Google Scholar
[7] Kim K, Richard DH. Analysis of surface deformation due to thermal load on circular quasi-isotropic laminate mirrors. Am Inst Aeronaut Astronaut. 2008;161:1–10.10.2514/6.2008-2185Search in Google Scholar
[8] Sun J, Gu Y, Li M, Ma X, Zhang Z. Effect of forming temperature on the quality of hot diaphragm formed C-shaped thermosetting composite laminates. J Reinforced Plast Compos. 2012;31(16):1074–87.10.1177/0731684412453778Search in Google Scholar
[9] Peng X, Xu J, Cheng Y, Zhang L, Yang J, Yinghui L. An Analytical model for cure-induced deformation of composite laminates. Polymers. 2022;14(14):2903.10.3390/polym14142903Search in Google Scholar PubMed PubMed Central
[10] Bosi F, Pellegrino F, Schlothauer A. Cure-induced deformation of ultra-thin composite laminates. Am Inst Aeronaut Astronaut. 2018;6:1–10.10.2514/6.2018-2241Search in Google Scholar
[11] Zhang C, Sun Y, Xu J, Shi X, Zhang G. Study on curing deformation of composite thin shells prepared by M-CRTM with adjustable injection gap. Polymers. 2022;14(24):5564.10.3390/polym14245564Search in Google Scholar PubMed PubMed Central
[12] Guan CL, He JL, Yang XB, Dai J, Zhang J. The composite curing deformation prediction with the account of mold factors. IOP Conf Ser: Mater Sci Eng. 2019;474:012056.10.1088/1757-899X/474/1/012056Search in Google Scholar
[13] Kerboua B, Addabedia EA, Tounsi A, Sereir Z. Thermal impact and the fiber orientation effect of structures reinforced by composites FRP, the new prestressed laminates model. J Thermoplast Compos Mater. 2012;25(4):491–504.10.1177/0892705711417031Search in Google Scholar
[14] Onal L, Adanur S. Effect of stacking sequence on the mechanical properties of glass–carbon hybrid composites before and after impact. J Ind Text. 2002;31(4):225–271.10.1106/152808302028713Search in Google Scholar
[15] Lin HJ, Lai WM, Huang HD, Kuo JM. Discussion on the cause of print-through phenomenon of FRP and several improvement methods. J Compos Mater. 2010;44(17):2111–26.10.1177/0021998310364263Search in Google Scholar
[16] Kuo JmLin, HJ, Lee JH, Lai WM. Study of the decrease in print-through phenomenon on fiber-reinforced plastic material. J Reinforced Plast Compos. 2011;30(24):1989–2001.10.1177/0731684411431766Search in Google Scholar
[17] Roni SM, Djajadikerta HG. Data analysis with SPSS for survey-based research. eBook (Springer Nature Singapore Ltd.); 2021. Search in Google Scholar
[18] Dougherty C. Introduction to econometrics. 6th edn. London: Oxford University Press; 2016.Search in Google Scholar
[19] Lewis-Beck MS. Regression analysis. London: SAGE Publications, Toppan Publishing; 1993.Search in Google Scholar
[20] Zou D, Jennifer E, Lloyd V, Jennifer LB. Using SPSS to analyze complex survey data: A primer. J Mod Appl Stat Methods. 2018;18(1):1–22.10.22237/jmasm/1556670300Search in Google Scholar
[21] Oyeyemi GM, Adewara AA, Adeyemi RA. Complex survey data analysis: A comparison of SAS. SPSS STATA Asian J Math Stat. 2010;3(1):33–9.10.3923/ajms.2010.33.39Search in Google Scholar
[22] QCVN-BGTVT 56. National technical regulation on classification and construction of ships of fiberglass reinforced plastics. Vietnamese Standards; 2013.Search in Google Scholar
© 2024 the author(s), published by De Gruyter
This work is licensed under the Creative Commons Attribution 4.0 International License.
Articles in the same Issue
- Research Articles
- Evaluation of the mechanical and dynamic properties of scrimber wood produced from date palm fronds
- Performance of doubly reinforced concrete beams with GFRP bars
- Mechanical properties and microstructure of roller compacted concrete incorporating brick powder, glass powder, and steel slag
- Evaluating deformation in FRP boat: Effects of manufacturing parameters and working conditions
- Mechanical characteristics of structural concrete using building rubbles as recycled coarse aggregate
- Structural behavior of one-way slabs reinforced by a combination of GFRP and steel bars: An experimental and numerical investigation
- Effect of alkaline treatment on mechanical properties of composites between vetiver fibers and epoxy resin
- Development of a small-punch-fatigue test method to evaluate fatigue strength and fatigue crack propagation
- Parameter optimization of anisotropic polarization in magnetorheological elastomers for enhanced impact absorption capability using the Taguchi method
- Determination of soil–water characteristic curves by using a polymer tensiometer
- Optimization of mechanical characteristics of cement mortar incorporating hybrid nano-sustainable powders
- Energy performance of metallic tubular systems under reverse complex loading paths
- Enhancing the machining productivity in PMEDM for titanium alloy with low-frequency vibrations associated with the workpiece
- Long-term viscoelastic behavior and evolution of the Schapery model for mirror epoxy
- Laboratory experimental of ballast–bituminous–latex–roving (Ballbilar) layer for conventional rail track structure
- Eco-friendly mechanical performance of date palm Khestawi-type fiber-reinforced polypropylene composites
- Isothermal aging effect on SAC interconnects of various Ag contents: Nonlinear simulations
- Sustainable and environmentally friendly composites: Development of walnut shell powder-reinforced polypropylene composites for potential automotive applications
- Mechanical behavior of designed AH32 steel specimens under tensile loading at low temperatures: Strength and failure assessments based on experimentally verified FE modeling and analysis
- Review Article
- Review of modeling schemes and machine learning algorithms for fluid rheological behavior analysis
- Special Issue on Deformation and Fracture of Advanced High Temperature Materials - Part I
- Creep–fatigue damage assessment in high-temperature piping system under bending and torsional moments using wireless MEMS-type gyro sensor
- Multiaxial creep deformation investigation of miniature cruciform specimen for type 304 stainless steel at 923 K using non-contact displacement-measuring method
- Special Issue on Advances in Processing, Characterization and Sustainability of Modern Materials - Part I
- Sustainable concrete production: Partial aggregate replacement with electric arc furnace slag
- Exploring the mechanical and thermal properties of rubber-based nanocomposite: A comprehensive review
- Experimental investigation of flexural strength and plane strain fracture toughness of carbon/silk fabric epoxy hybrid composites
- Functionally graded materials of SS316L and IN625 manufactured by direct metal deposition
- Experimental and numerical investigations on tensile properties of carbon fibre-reinforced plastic and self-reinforced polypropylene composites
- Influence of plasma nitriding on surface layer of M50NiL steel for bearing applications