Mechanical properties and microstructure of roller compacted concrete incorporating brick powder, glass powder, and steel slag
-
Mohammed Hazim Yaseen
 ,
Eethar Thanon Dawood
,
Eethar Thanon Dawood

Abstract
The objective of this study is to explore the feasibility of developing environmentally friendly green roller-compacted concrete (RCC) by utilizing locally available materials. The research investigates the behavior of RCC properties when different amounts of solid waste materials (brick powder, glass powder, and steel slag) are added as substitutes for cement content. To accomplish this, four laboratory tests were conducted: compressive strength, flexural strength, X-ray diffraction analysis, and scanning electron microscope imaging. These tests aimed to identify the changes in concrete properties resulting from the inclusion of waste construction materials as cement replacements. The study employed an approach that involved adding waste materials to the concrete mixture, with replacement percentages ranging from 10.0 to 40.0% in increments of 10.0%. Consequently, 12 concrete mixtures were prepared to examine the effects of adding waste materials (10.0–40.0%) as substitutes for cement content. In addition, one reference mixture was designed without any inclusion of waste materials for comparison purposes. In general, the results indicate that as the percentage of waste construction materials increases in the mixtures, there is a corresponding decrease in compressive strength. However, it is noteworthy that the strength activity index (SAI) exceeded 75% according to ASTM C618 standards. This indicates that the waste construction materials possess pozzolanic properties, making them suitable for use as cement replacements in RCC mixtures.
1 Introduction
One or more of the components of green concrete mixture can have the advantage that its manufacturing process does not lead to environmental destruction. In addition to, it has high performance and sustainability over the life cycle. Green concrete mixture production is also inexpensive because the waste construction materials are used as partial substitutes for cement or other components. Continuously, the disposal fee is eliminated, the manufacturing energy consumption is reduced, and the durability is much greater. Replacement of the traditional components of the mixture by waste materials and by-products gives an opportunity to manufacture an economical and environmentally friendly mixtures [1,2].
About 8% of the overall carbon dioxide emissions are generated from production activities of cement. There are two major sources of cement production that generate CO2 emissions. The first source is the chemical reaction related with the manufacturing of the cement’s major component, clinker, in which carbonates decompose in the presence of heat into chemical reaction. The second source of CO2 emissions is the combustion of fossil fuels to generate sufficient energy needed to heat raw materials [3].
1.1 Literature review
In their study, Malkawi et al. [4] undertook a comparative analysis of various pozzolanic materials employed in the construction of roller-compacted concrete (RCC) dams. The researchers determined that natural pozzolanic materials and/or rock flour exhibited exceptionally favorable physical and chemical properties in comparison to fly ash and other pozzolanic materials. As a result, they concluded that the utilization of natural pozzolanic materials and rock flour in RCC dam construction is highly advantageous and effective
In their research, Shuhua et al. [5] examined the characteristics and microstructure of RCC incorporating a high volume of low-quality fly ash. The study demonstrated that the utilization of 60% ground fly ash in cement led to notably accelerated and enhanced property development compared to using an equivalent amount of untreated fly ash. The incorporation of a high volume (60%) of ground low-quality fly ash resulted in the refinement of pore size and improved pore size distribution within cement pastes. This substantial improvement in microstructure consequently elevated the strength and durability of the RCCs.
In their investigation, Lam et al. [6] explored the influence of compaction delay on the optimal moisture content and mechanical properties of roller-compacted concrete pavement (RCCP) incorporating electric arc furnace (EAF) Slag Aggregate. The study revealed that the higher water absorption characteristic of EAF slag, which typically leads to a decrease in water content, was effectively mitigated by employing a novel mixing method. Surprisingly, the delay in compaction had minimal impact on the optimal water content and maximum dry density of RCCP. Additionally, the compressive strength and splitting tensile strength of RCCP utilizing EAF slag aggregate met the strength requirements for pavement, even when compaction was delayed by up to 90 min.
In their study, Fardin and Santos [7] aimed to examine the mechanical and physical characteristics of RCC by incorporating recycled concrete aggregate (RCA) as a replacement for natural coarse aggregate. The research revealed that as the proportion of RCA in the mixtures increased, there was a decrease in specific mechanical properties, notably the modulus of elasticity. However, it was observed that there was no significant decrease in the splitting tensile strength, indicating that the utilization of RCA as a substitute for natural coarse aggregate in RCC did not adversely affect this particular strength parameter.
1.1.1 Materials used
In this research, the cement of choice was ordinary Portland cement Type 1 (OPC). The physical and chemical characteristics of the OPC used in this study were evaluated in accordance with the Iraqi specifications [8]. The findings are presented in Tables 1 and 2 for easy reference.
Physical and mechanical properties of OPC
| Properties | Test results | Iraqi specification No.5/1984 limits |
|---|---|---|
| Specific surface area (Blain’s method), m²/kg | 263.6 | ≥230 |
| Soundness (Autoclave method), % | 0.14 | <0.8 |
| Setting time (Vicat’s method) | ||
| Initial setting, h:min | 1:13 | ≥45 min |
| Final setting, h:min | 3:15 | ≤10 h |
| Compressive strength | ||
| 3 days, N/mm² | 21 | ≥15 |
| 7 days, N/mm² | 29 | ≥23 |
Chemical compositions of OPC used
| Oxide composition (% by weight) | Test result of cement used | Limits of IQS: 5/1984 |
|---|---|---|
| SiO2 | 21.31 | — |
| Al2O3 | 5.89 | — |
| Fe2O3 | 2.67 | — |
| CaO | 62.2 | — |
| MgO | 3.62 | ≤5% |
| SO3 | 2.6 | ≤2.80% (if C3A ≥ 5%) |
| Loss of ignition | 1.59 | ≤4% |
| Insoluble residue | 0.24 | ≤0.15% |
| Main component | ||
| C3S | 40.388 | — |
| C2S | 30.835 | — |
| C3A | 11.09 | — |
| C4AF | 8.12 | — |
1.1.2 Coarse aggregate
For this study, gravel with a maximum aggregate size of 19 mm was utilized, conforming to the specifications outlined in the ACI 211.3R standard [9]. The sieve analysis results for the gravel are presented in Table 3 for clarity and reference.
Sieve analysis of the used coarse aggregate
| Sieve size (mm) | Cumulative passing (%) | Limits of ACI 211.3 R, |
|---|---|---|
| 25 | 100 | 100 |
| 19 | 93 | 82–100 |
| 12.5 | 84 | 72–93 |
| 9.5 | 74 | 66–85 |
1.1.3 Fine aggregate
The research employed fine natural sand sourced from the Kanhash region, which adhered to the prescribed limits of the ACI 211.3R standard. The sieve analysis results for this sand are provided in Table 4 for easy reference.
Sieve analysis of the used fine aggregate
| Sieve size (mm) | Cumulative passing (%) | Limits of ACI 211.3R |
|---|---|---|
| 4.75 | 54 | 51–69 |
| 2.36 | 38 | 38–56 |
| 1.18 | 29 | 28–46 |
| 0.6 | 22 | 18–36 |
| 0.3 | 17 | 11–27 |
| 0.15 | 7 | 6–18 |
| 0.075 | 2 | 2–8 |
1.1.4 Steel slag
The by-products generated during the high-temperature smelting of iron ore were utilized in this study. The slag used in the research was obtained from a local factory plant located in Zakho, Iraq. Prior to usage, the slag particles were sieved through a #325 sieve, resulting in a particle size of 45 μm.
The physical and chemical properties of slag, as per the ASTM C989 [10] standard, are presented in Tables 5 and 6. These tables provide a comprehensive overview of the characteristics of the slag used in the study.
Physical properties of slag
| Slag activity strength index (%) at 28 days | 82% | ≥75% for slag grade 80 |
|---|---|---|
| Type | Powder | — |
| Color | Black and dark grey | — |
| Specific gravity | 2.92 | — |
| Bulk density (kg/m3) | 1,375 | — |
| Fineness surface area, (Blaine) | 550 | — |
Chemical compositions of slag powder
| Chemical elements | Elements in slag (%) |
|---|---|
| SiO2 | 11.4 |
| Al2O3 | 3.4 |
| Fe2O3 | 28.5 |
| MnO2 | 0.09 |
| CaO | 49.2 |
| SO3 | 0.16 |
| K2O | 0.99 |
| Na2O | 0.23 |
| MgO | 0.98 |
| TiO2 | 0.14 |
| P2O5 | 0.06 |
| Loss on ignition | 1.10 |
1.1.5 Cementitious materials
This study incorporated two types of waste materials: Waste glass powder (WGP) and waste brick powder (WBP). To attain a fineness comparable to that of cement, these materials underwent several phases of preparation and grinding
The waste materials (glass and brick) were obtained from local landfills and construction sites in Mosul, Iraq. The collected waste was thoroughly washed and air-dried. Subsequently, each material underwent separate grinding for approximately 1 h using a Los Angeles abrasion machine, as depicted in Figure 1, following the guidelines outlined in ASTM C131 [11].
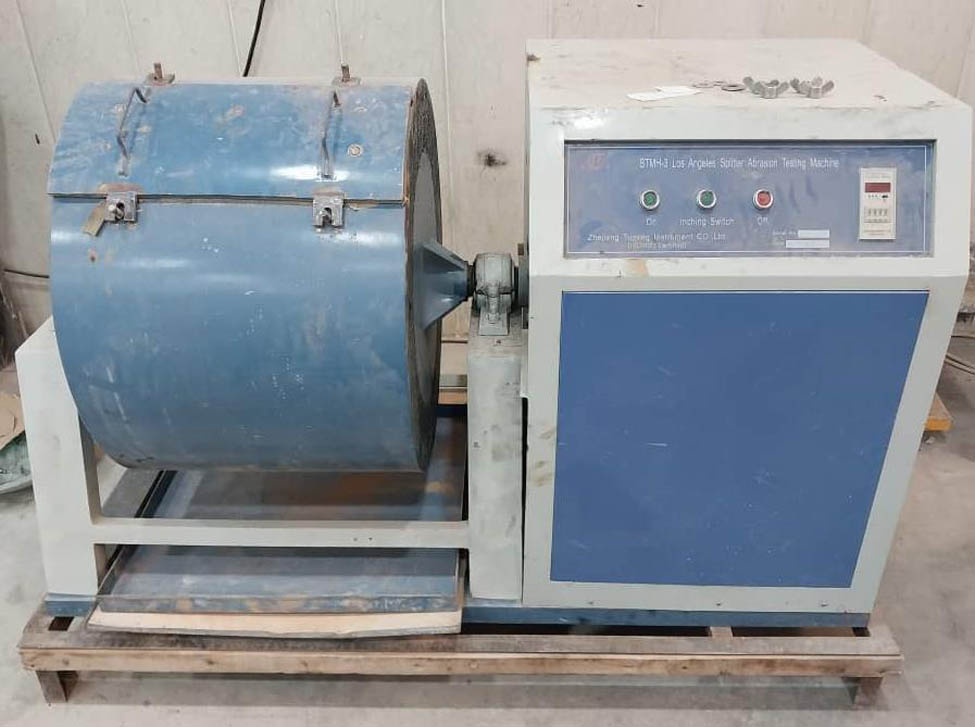
Los Angeles machine.
Then, it was passed through sieve No. 4 and the materials from the sieve were ground in another mill, Guyixuan (MFS 150), Figure 2.

Guyixuan (MFS 150) grinding machine.
The test results demonstrated that the fineness of the material met the requirements specified in ASTM C 618 [13]. The specific gravity of the prepared powder was determined following the procedures outlined in ASTM C188 [12]. Chemical analysis of these materials was conducted at Soran University in Soran, Erbil, Iraq, utilizing sequential X-ray fluorescence. The results of these tests are presented in Table 7.
Physical properties and chemical compositions of WGP and WBP
| Physical properties | Values | ASTM C618 [13] | |
|---|---|---|---|
| WGP | WBP | ||
| Specific gravity | 2.56 | 2.73 | — |
| Blaine´s fineness (cm²/gm) | 2,980 | 3,600 | — |
| Retained on sieve No. 325 (%) | 24 | 20 | ≤34 |
| Chemical composition | Content% | ASTM C618 [13] | |
|---|---|---|---|
| SiO₂ | 72.7 | 51.9 | — |
| Al₂O₃ | 1.49 | 13.5 | — |
| Fe₂O₃ | 1.17 | 4.5 | — |
| CaO | 11.9 | 15.6 | — |
| SO₃ | 0.33 | 3.43 | ≤4 |
| MgO | 1.48 | 6.3 | — |
| Alkalis (Na₂O + K₂O) | 8.9 | 2.8 | — |
| MnO | 0.014 | 0.122 | — |
1.1.6 Water
All the concrete mixtures were prepared using tap water.
2 Experimental work
This study involved a two-stage process. Initially, the first stage encompassed the preparation of a mixture proportion of RCC based on ACI 211.3R guidelines, serving as the reference mixture. Subsequently, the second stage entailed the preparation of mixtures of green roller compacted concrete (GRCC).
The outcomes of the second stage were assessed by comparing them with the reference mixture.
Sections 2.1–2.4 provide a comprehensive explanation of the mix proportions, mixing procedure, sample preparation, curing methods, and test procedures employed in this study.
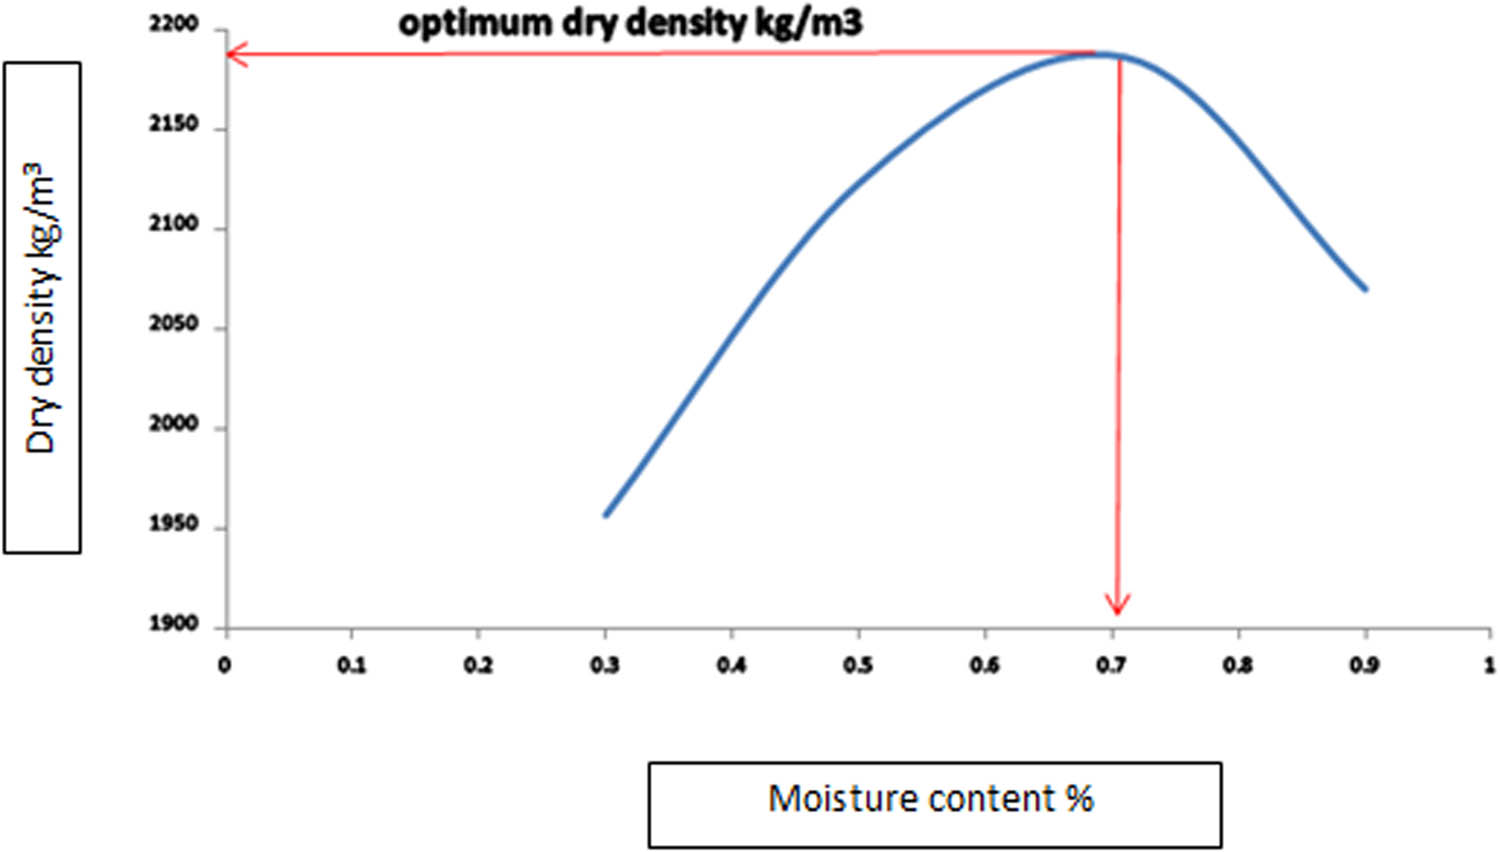
Moisture–density curves.
2.1 Procedure for determining the mixture proportions of reference mixtures
Select well-graded dry coarse and fine aggregates that fall within the prescribed limits of ACI 211.3R (2002).
Determine the optimum moisture content and maximum dry density using ASTM D 1557.
Determine the optimum moisture content (OMC) and maximum dry density of RCC mixtures by casting various quantities of cement, ranging from 10–17% of the dry aggregates’ mass. For each cement content, four mixtures were cast, with varying water content ranging from 3–9% of the dry aggregate’s weight, The OMC for cement contents of 10, 13, 14, and 17% resulted in values of 6.23, 6.86, 7.1, and 8.56%, respectively. Figure 3 illustrates the moisture vs density curves for the 14% cement content mixture.
Four RCC mixtures were cast using cement content of (10, 12, 14 and 17) as percentage of aggregate content. by fixing optimum moisture content determined from stage 2 saving as the water quantity for the mixture. The compressive strength and flexural strength of each mixture were measured after 28 days. Based on the desired flexural strength range of 4–5 MPa, a cement content of 14% was selected, which was used for casting all the mixtures discussed in this work.
To meet the desired strength requirements, a mixture proportion of 1:3.23:2.63, w/c = 0.47 was used as reference mixture (R0).
2.2 Procedure for determining the mixture proportions of GRCC
Mixtures R1–R4 were prepared by incorporating brick powder (BP), ranging from 10–40% as replacement of cement content.
Mixtures R5–R8 were prepared by incorporating glass powder (GP), ranging from 10–40% as replacement of cement content.
Mixtures R9–R12 were prepared by incorporating steel slag (SS), ranging from 10–40% as replacement of cement content.
Table 8 presents the detailed composition of the mixtures used in this work.
Mix proportion of reference and green mixtures
| Mix | Cement (kg/m3) | Sand (kg/m3) | Gravel (kg/m3) | Water (kg/m3) | BP (kg/m3) | GP (kg/m3) | SS (kg/m3) |
|---|---|---|---|---|---|---|---|
| R0 | 327 | 1,058 | 861 | 154 | — | — | — |
| R1 | 294.3 | 1,058 | 861 | 154 | 32.7 | — | — |
| R2 | 261.6 | 1,058 | 861 | 154 | 65.4 | — | — |
| R3 | 228.9 | 1,058 | 861 | 154 | 98.1 | — | — |
| R4 | 196.2 | 1,058 | 861 | 154 | 130.8 | — | — |
| R5 | 294.3 | 1,058 | 861 | 154 | — | 32.7 | — |
| R6 | 261.6 | 1,058 | 861 | 154 | — | 65.4 | — |
| R7 | 228.9 | 1,058 | 861 | 154 | — | 98.1 | — |
| R8 | 196.2 | 1,058 | 861 | 154 | — | 130.8 | — |
| R9 | 294.3 | 1,058 | 861 | 154 | — | — | 32.7 |
| R10 | 261.6 | 1,058 | 861 | 154 | — | — | 65.4 |
| R11 | 228.9 | 1,058 | 861 | 154 | — | — | 98.1 |
| R12 | 196.2 | 1,058 | 861 | 154 | — | — | 130.8 |
2.3 Sample preparation and curing process
During this stage, the procedure involved the preparation of mixture specimens followed by their curing in tap water for durations of 7 and 28 days. For assessing compressive strength, a total of six plastic cube molds (100 × 100 × 100 mm) were utilized for each mixture. These cubes were poured in two layers and compacted using a vibrating hammer, as depicted in Figure 4. At the age of 7 days, three cubes were examined, while another set of three cubes was tested at 28 days, all within tap water conditions. Additionally, to evaluate the flexural strength, three plastic prism molds (100 × 100 × 400 mm) were filled for each mixture. Similar to the cube molds, the prism molds were poured in two layers, compacted with a vibrating hammer, and tested after 28 days of curing.

Vibrating hammer for molding RCC samples.
2.4 Sample testing procedures
2.4.1 Compressive test
The compressive test involved subjecting (100 × 100 × 100 mm) cube specimens to compression after curing in water for (7 and 28) days. A compression testing machine with a loading rate of 0.3 MPa/s and a capacity of 2,000 KN, as depicted in Figure 5, was used for this test. The testing procedure followed the guidelines outlined in BS: 1881: Part 116: 1983 [14].

Compressive strength test: (a) cube specimen and (b) compressive testing machine ready to test the cube.
2.4.2 Flexural test
Flexural test was performed on prisms (400 × 100 × 100 mm) using simple beam with third-point loading according to ASTM C78 [15]. A universal testing machine with a loading rate of 0.3 MPa/s and a capacity of 2,000 KN, as depicted in Figure 6a and b, was used.

Flexural strength test: (a) prism specimen and (b) flexural testing machine ready to test the prism.
2.4.3 Vibrating hammer
The samples were produced using a vibrating hammer in accordance with ASTM C1435 [16]. Figure 7 illustrates the vibrating hammer employed to prepare all RCC samples, adhering to the specifications outlined in ASTM C1435.

Vibrating hammer for preparing RCC Samples.
3 Results and discussion
In this study, the following experiments were performed:
3.1 Strength activity index (SAI)
The activity index test was employed to assess the activity of the materials employed, with a 20% replacement ratio utilizing various waste materials like glass, stainless steel, and BP, as per ASTM C311 [17]. The SAI exceeded 75% after 7 days. Eq. (1) was utilized to calculate the SAI.
where, z is the mean compressive strength of the pozzolanic materials, and R is the average compressive strength of the reference mixture.
The SAI for WBP, WGP, and waste steel slag (WSS) was determined by comparing them with the reference mixture (R0) at 7 and 28 days. The corresponding results are depicted in Figure 8.

SAI for 20% replacement of WBP, WGP, and WSS.
Based on the aforementioned findings, the Substitution Activity Index (SAI) surpassed 75%. This indicates the presence of the desired pozzolanic property in these materials. Consequently, they are deemed appropriate for substituting cement in concrete mixtures.
These results align with previous studies [18,19,20], corroborating their findings.
The observed activity can be attributed to the reaction between the SiO2 present in WBP, WGP, and WSS, and the calcium hydroxide produced during cement hydration [21]. This reaction leads to the formation of secondary calcium silicate hydrate (C–S–H) [23]
Additionally, the findings indicate that WSS exhibits a higher SAI compared to the other materials. This can be attributed to the higher fineness and specific surface area of WSS powder in comparison to the others. The elevated specific surface area enhances the contact area, thereby increasing the effectiveness of its pozzolanic properties [22]
3.2 Compressive strength test results
Table 9 and Figure 9 display the results of RCC mixtures/ compressive strength.
Compressive strength test results
| Mix | Replacement details | (Compressive strength) (MPa) at 7 day | (Compressive strength) (MPa) at 28 day |
|---|---|---|---|
| R0 | Reference | 28.3 | 36.7 |
| R1 | 10% WBP | 25 | 35 |
| R2 | 20% WBP | 22.7 | 30.3 |
| R3 | 30% WBP | 20 | 25 |
| R4 | 40% WBP | 16 | 22.2 |
| R5 | 10% WGP | 24.3 | 34 |
| R6 | 20% WGP | 21.2 | 30 |
| R7 | 30% WGP | 18 | 23.3 |
| R8 | 40% WGP | 15 | 19.3 |
| R9 | 10% WSS | 28.3 | 36 |
| R10 | 20% WSS | 22 | 31.3 |
| R11 | 30% WSS | 21.2 | 28.5 |
| R12 | 40% WSS | 17.3 | 25 |

Compressive strength test results.
Table 9 and Figure 9 show that the inclusion of waste materials cause a diminution in compressive strength at both 7 and 28 days as compared to reference mixture.
Table 9 and Figure 9 also show that at 7 days, compressive strength of 20% replacement of cement by BP (R2) is greater than that of 20% replacement of cement by SS (R10), while beyond 28 days, the strength development rate was found to be higher in SS (R10) when compared with (R2) mixture.
The findings demonstrate that the proportion of SS and the duration of the curing process had a moderate impact on the development of compressive strength. The glossy constituents present in SS exhibit a gradual reaction with water.
Based on the findings, it was observed that the compressive strength increased from 7 days to 28 days. Furthermore, the mixes incorporating WSS exhibited higher compressive strength values compared to the mixes containing WBP or WGP at the same replacement ratio. This difference can be attributed to the pozzolanic effect of SiO2 on calcium hydroxide, leading to the formation of secondary calcium silicate hydrate (C–S–H) [23].
By enhancing the specific surface area of WSS, the contact area is enlarged, resulting in heightened consumption of calcium hydroxide and improved pozzolanic effectiveness. Additionally, this process contributes to denser microstructural formation, ultimately enhancing resistance [22,23,24].
3.3 Flexural strength test results
Table 10 displays the results of RCC mixtures’ flexural strength.
Flexural strength test results
| Mix | Replacement details | Flexural strength (MPa) at 28 days |
|---|---|---|
| R0 | Reference | 6.7 |
| R1 | 10% WBP | 6.3 |
| R2 | 20% WBP | 5.4 |
| R3 | 30% WBP | 4.55 |
| R4 | 40% WBP | 4.1 |
| R5 | 10% WGP | 6.12 |
| R6 | 20% WGP | 5.4 |
| R7 | 30% WGP | 4.2 |
| R8 | 40% WGP | 3.5 |
| R9 | 10% WSS | 6.4 |
| R10 | 20% WSS | 5.6 |
| R11 | 30% WSS | 5.2 |
| R12 | 40% WSS | 4.5 |
According to the information presented in Table 10, it is evident that the incorporation of waste construction materials (WBP,WGP, and WSS) leads to a decrease in the flexural strength of GRCC in comparison to the reference mixture. This finding aligns with prior studies [18,22,24].
Furthermore, it is noteworthy that “R2 and R6,” which include WBP and WGP, exhibit reduced flexural strength compared to “R10,” which incorporates WSS at the same replacement percentage. This disparity can be attributed to the higher specific surface area of WSS in comparison to WBP and WGP. Consequently, finer particles necessitate a greater amount of water, resulting in increased water consumption [14].
4 Micro-structural analysis
X-ray diffraction analysis (XRD) and scanning electron microscope (SEM) images were obtained from both the reference mixture and the GRCC samples following 28 days immersion in tap water.
4.1 XRD
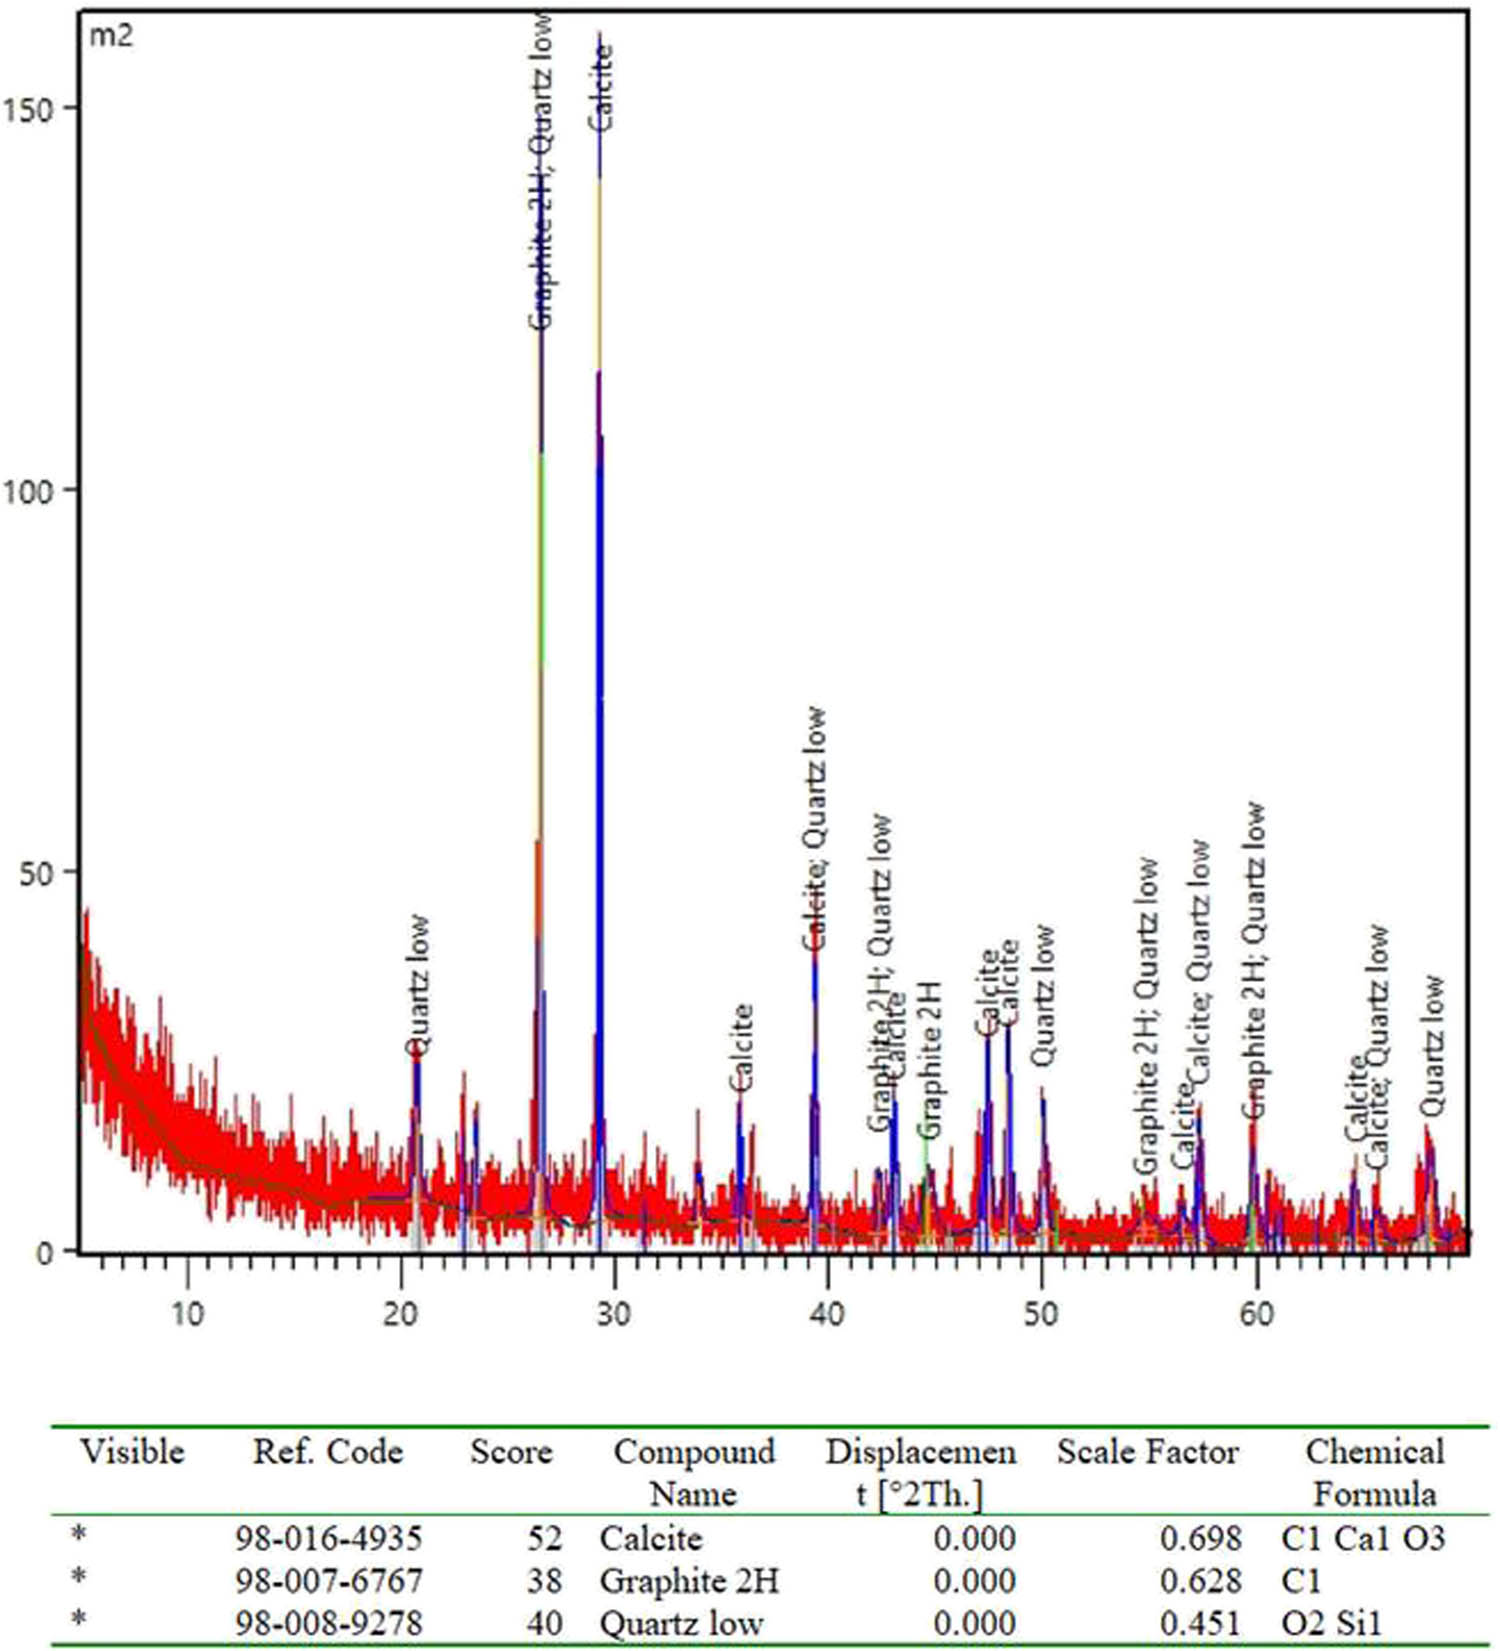
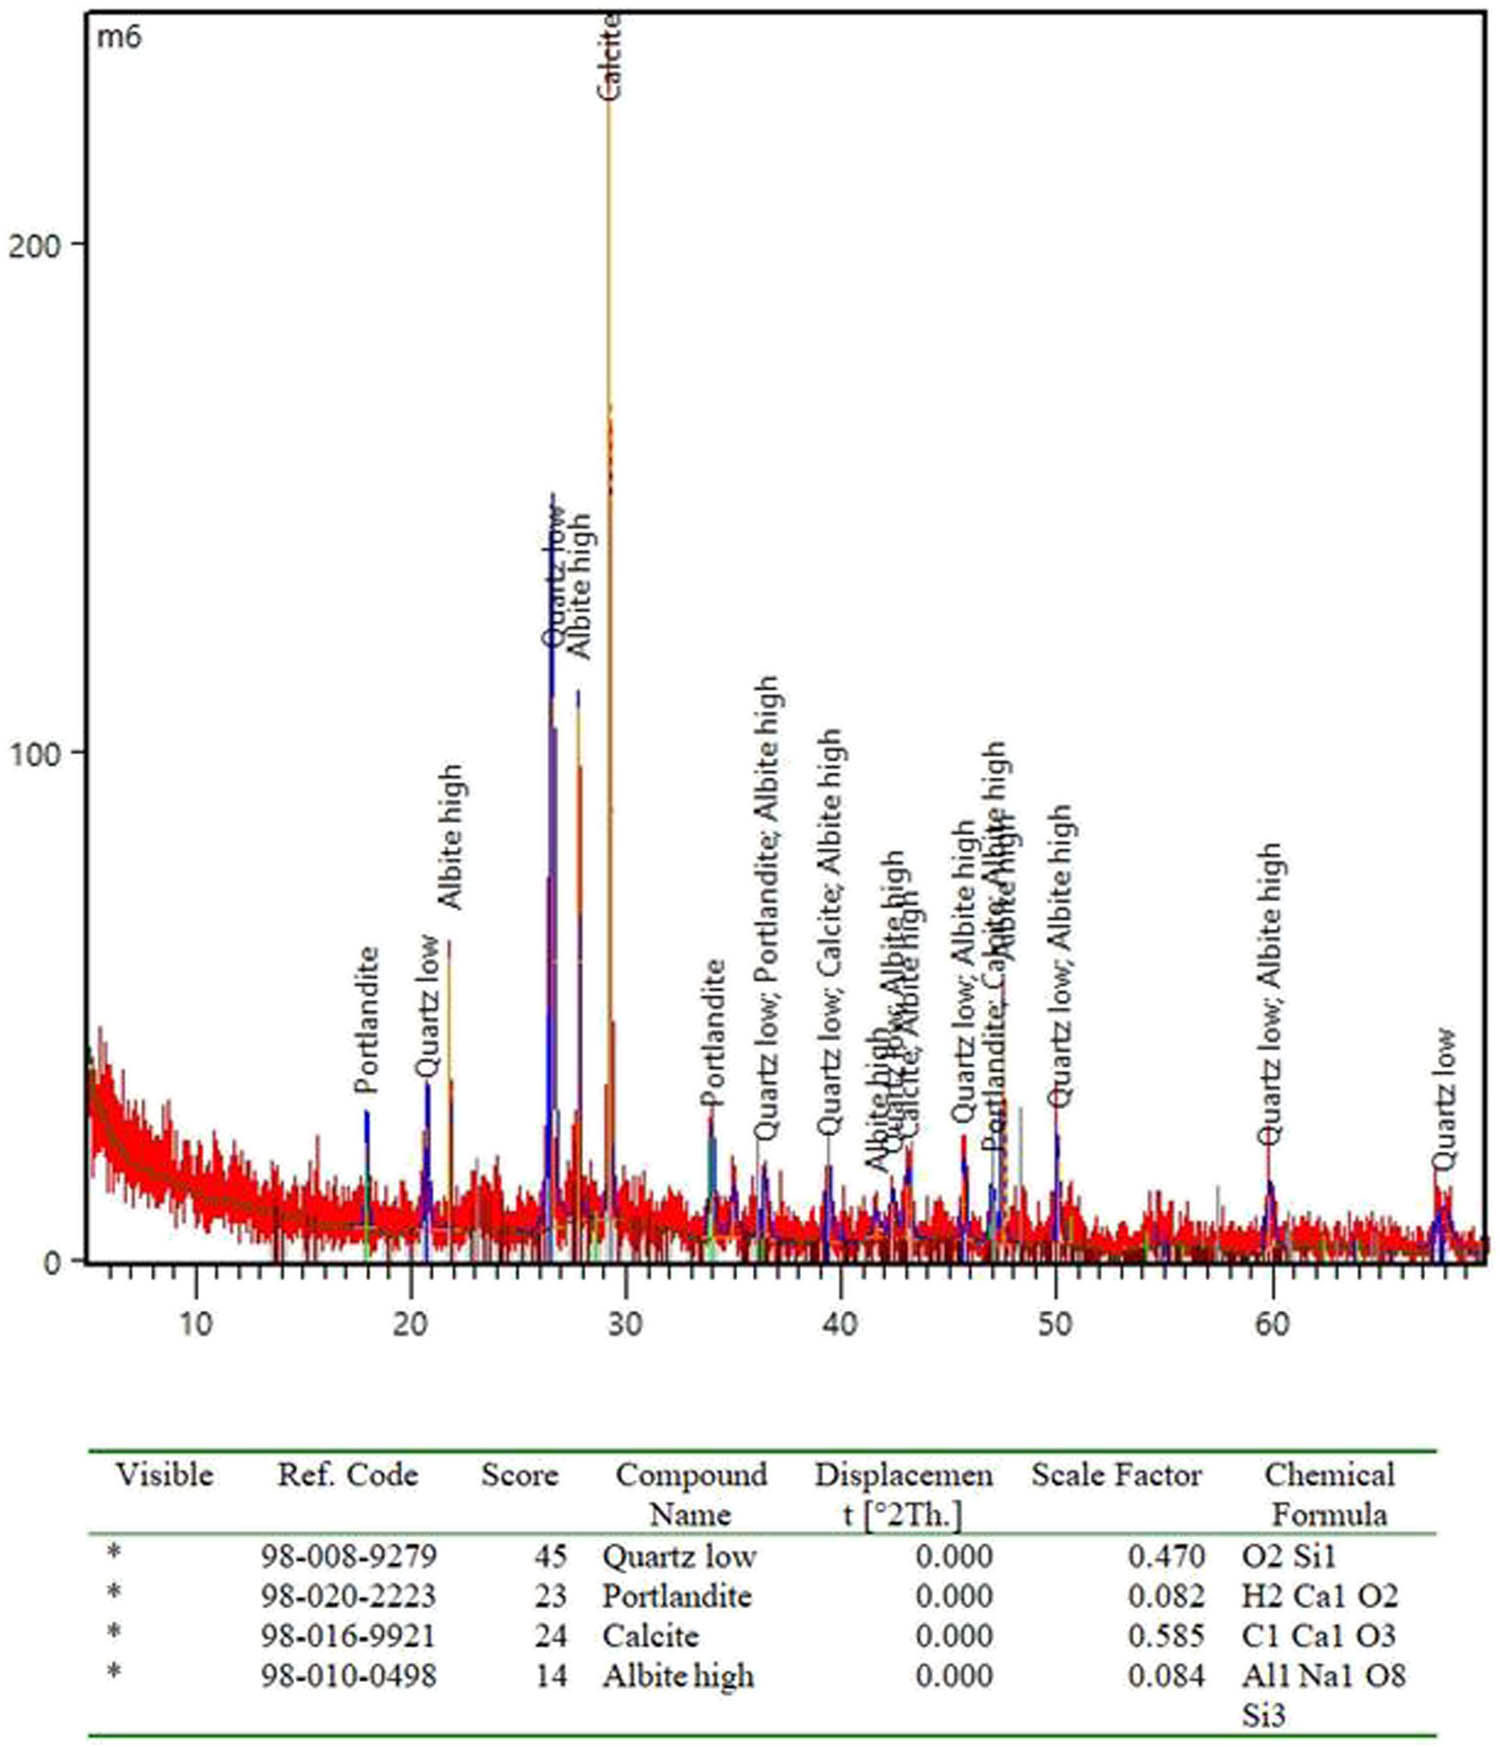
The outcomes of XRD analysis of the reference mixture and the GRCC samples are shown in Figures 10–13, respectively.

XRD pattern for reference mixture at 28 days in tap water.
XRD pattern for green mixture containing 20% WBP at 28 days in tap water.
XRD pattern for green mixture containing 20% WGP at 28 days in tap water.
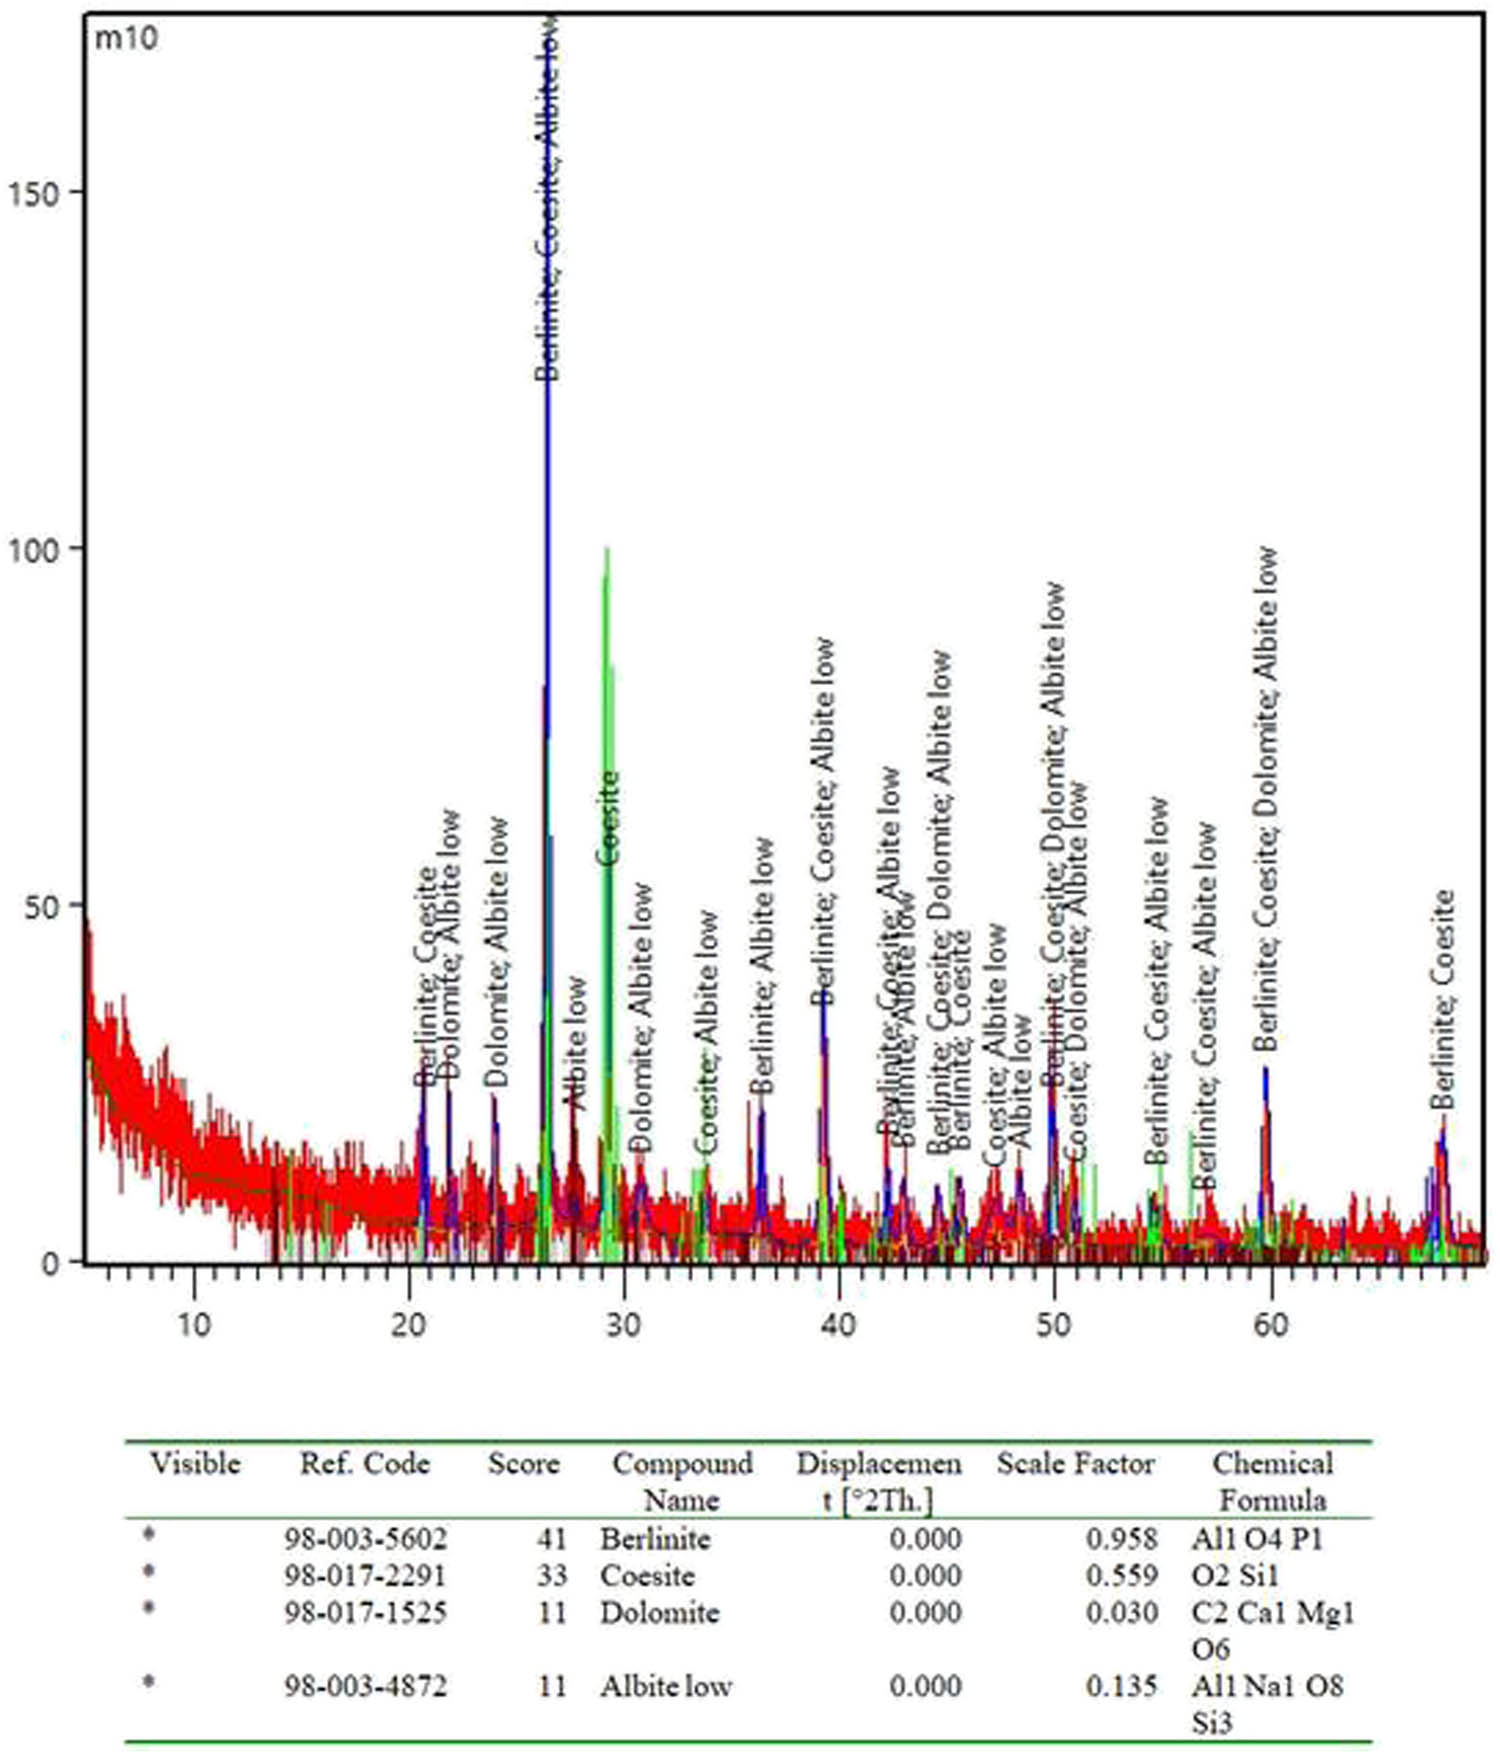
XRD pattern for green mixture containing 20% WSS at 28 days in tap water.
The XRD analysis of the selected GRCC samples reveals similar peaks with varying intensities for the main phases, namely, quartz, calcite, and graphite 2H. Among these phases, quartz exhibits the majority of the peaks observed.
4.2 SEM
Figures 14–17 show the SEM morphology of reference mixture and the GRCC, respectively.
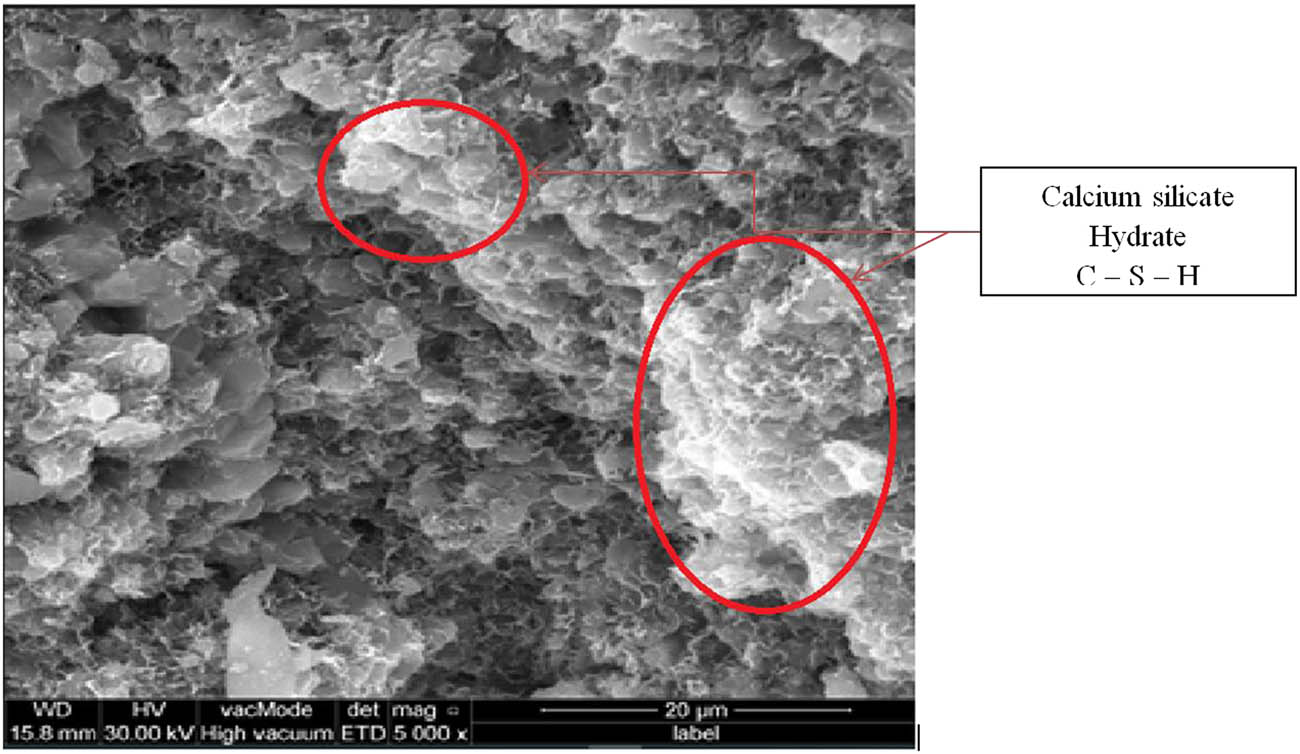
SEM image of reference mixture.

SEM image of green mixture containing 20% WBP.
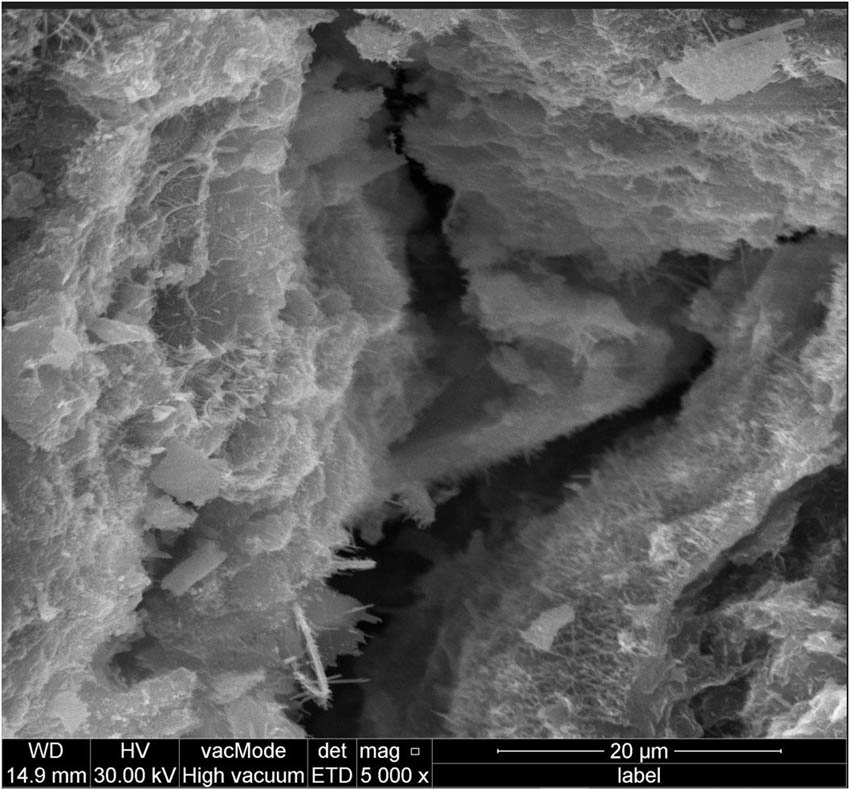
SEM image of green mixture containing 20% WGP.
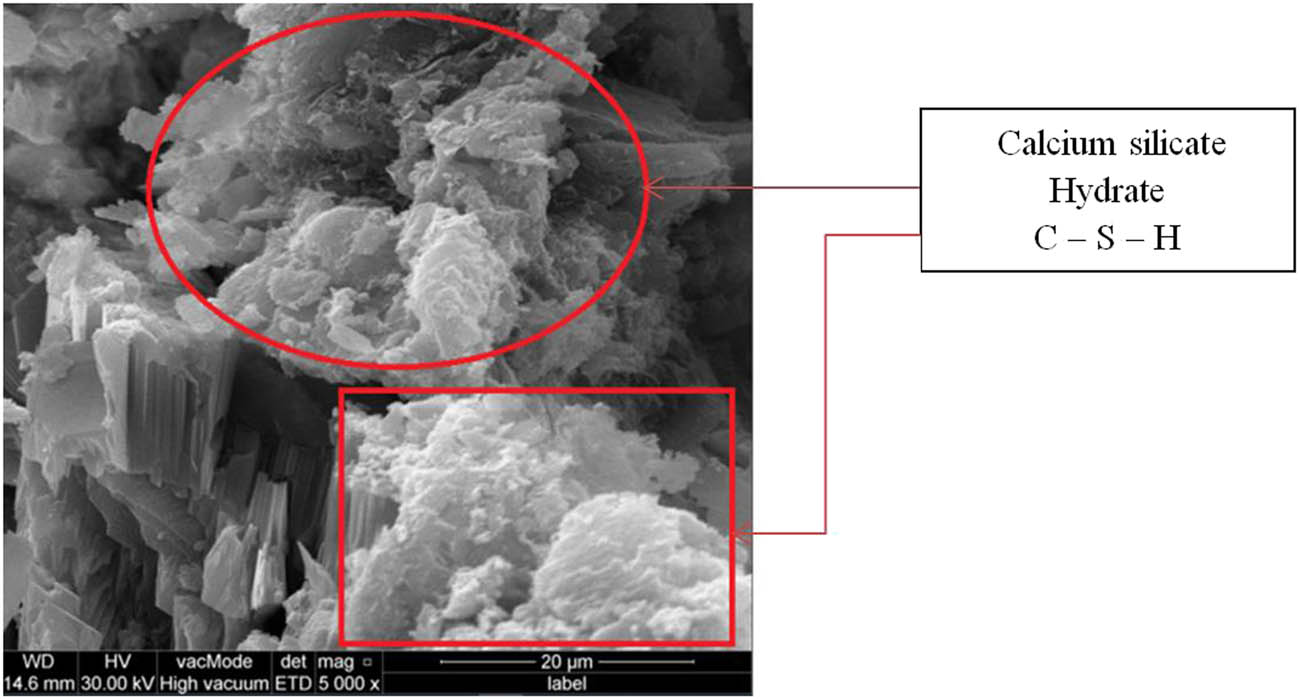
SEM image of for Green mixture containing 20% WSS.
From Figures 14–16, the generation of C–S–H can be seen, which is a product of secondary hydration reactions. Also, a small amount of calcium hydroxide Ca(OH)2 can be seen.
Figure 16 also shows that in the mixture incorporating WSS, it was observed that the calcium silicate hydrate (C–S–H) was denser when compared to the mixtures containing WBP or WGP at the same replacement ratio. This difference can be attributed to the pozzolanic effect of SiO2 on calcium hydroxide, leading to the formation of secondary calcium silicate hydrate (C–S–H) [23].
The microscopy analysis substantiates the findings and conclusions derived from the compressive strength, density, and other mechanical testing.
5 Conclusion
The WBP, WGP, and WSS possess pozzolanic properties, making them suitable as cement substitutes. Among these, the WSS exhibits a higher SAI compared to the others.
GRCC incorporating WSS and WBP demonstrates higher compressive strength values compared to GRCC incorporating WGP at the same replacement ratio.
Among the various mixes tested for GRCC, GRCC9 stands out as the most optimal choice, exhibiting superior compressive strength and flexural strength compared to the other mixes.
The XRD analysis of the selected GRCC samples reveals similar peaks with varying intensities for the main phases, namely, quartz, calcite, and graphite 2H. Among these phases, quartz exhibits the majority of the peaks observed.
The SEM morphology analysis of the chosen GRCC samples indicates that mixes with a substantial quantity of calcium silicate hydrate (C–S–H) exhibit a cloud-like appearance, resulting in a dense microstructure with minimal pore formation.
5.1 Recommendations for further work
Conduct additional durability tests: Explore the durability characteristics of GRCC, such as resistance to freeze–thaw cycles, chemical exposure, and wetting and drying cycles.
Investigate alternative reinforcement materials: Explore the use of alternative reinforcement materials, such as fiber-reinforced polymers (FRP) or carbon fibers, to enhance the mechanical properties and durability of GRCC.
Explore sustainable production methods: Investigate eco-friendly production methods for GRCC, such as incorporating recycled aggregates or optimizing energy consumption during the manufacturing process, to enhance the sustainability of the material.
Acknowledgements
The authors thank and gratitude to Northern Technical University, which provided all facilities and necessary scientific support (reading and borrowing the available scientific references in its libraries and use of the internet unit, etc.) to complete this work.
-
Funding information: The authors state no funding involved.
-
Author contributions: All authors have accepted responsibility for the entire content of this manuscript and approved its submission.
-
Conflict of interest: Authors state no conflict of interest.
References
[1] Khazaleh M, Gopalan B. Eco-friendly green concrete: a review. The International Conference on Innovative Applied Energy (IAPE’19); 2019 Mar 14–15; Oxford, UK. p. 19–21.Search in Google Scholar
[2] Kumar R, Kumar D, Hussain S. Green concrete method. Int J Innov Res Sci Eng. 2017;3(4):702–6.Search in Google Scholar
[3] Andrew RM. Global CO2 emissions from cement production. Earth Syst Sci Data Discuss. 2017;10(1):1–52.10.5194/essd-10-195-2018Search in Google Scholar
[4] Malkawi AI, Shatnawi E, Malkawi DA. A comparative study of physical and chemical properties of different pozzolanic materials used for roller compacted concrete RCC dams. MATEC Web Conf. 2017;120:02025. 10.1051/matecconf/201712002025.Search in Google Scholar
[5] Shuhua LI, Qiaoling LI, Meijuan RA, Lu WA. Properties and microstructure of roller compacted concrete with high volume low quality fly ash. Mater Sci (Medžiagotyra). 2017;23(3):273–9.10.5755/j01.ms.23.3.16318Search in Google Scholar
[6] Lam MN, Jaritngam S, Le DH. EAF slag aggregate in roller-compacted concrete pavement: Effects of delay in compaction. Sustainability. 2018;10:1122. 10.3390/su10041122. Search in Google Scholar
[7] Fardin HE, Santos AG. Roller compacted concrete with recycled concrete aggregate for paving bases. Sustainability. 2020;12:3154. 10.3390/su12083154. Search in Google Scholar
[8] Iraqi Organization Standardization and Quality Control. No. 5. Standard Specifications for Portland Cement. Baghdad, Iraq; 2019.Search in Google Scholar
[9] ACI 211.3R-02 (2009). Guide for Selecting Proportions for No-Slump Concrete. Farmington Hills (MI), USA: American Concrete Institute.Search in Google Scholar
[10] ASTM. Standard specification for slag cement for use in concrete and mortars. West Conshohocken (PA), USA: ASTM International; 2019. Search in Google Scholar
[11] ASTM C 131. Standard test method for resistance to degradation of small-size coarse aggregate by abrasion and impact in the Los Angeles Machine. Annual Book of ASTM Standards. West Conshohocken (PA), USA: ASTM International; 2014. p. 19428–2959.Search in Google Scholar
[12] ASTM C 188. Standard Test Method for Density of Hydraulic Cement. Annual book of ASTM Standards. West Conshohocken (PA), USA: ASTM International; 2016.Search in Google Scholar
[13] ASTM C 618. Standard Specification for Coal Fly Ash and Raw or Calcined Natural Pozzolan for Use in Concrete. Annual book of ASTM Standards. West Conshohocken (PA), USA: ASTM International; 2012.Search in Google Scholar
[14] B.S.: 1881: Part 116. “Method of testing hardened concrete for other strength. London, United Kingdom: British Standard Institution; 1983.Search in Google Scholar
[15] ASTM C78 2015. Standard specifications for flexural strength of concrete using simple beam with third-point loading. West Conshohocken (PA), USA: ASTM International; 2015.Search in Google Scholar
[16] ASTM C1435. Standard practice for molding roller-compacted concrete in cylinder molds using a vibrating hammer. West Conshohocken (PA), USA: ASTM International; 2014. Search in Google Scholar
[17] ASTM C311 – 00. Standard test methods for sampling and testing fly ash or natural pozzolans for use as a mineral admixture in Portland-cement concrete. Annual Book of ASTM Standards. West Conshohocken (PA), USA: ASTM International; 2004.Search in Google Scholar
[18] Mohan M, Apurva A, Kumar N, Ojha A. A review on use of crushed brick powder as a supplementary cementitious material. IOP Conf Ser: Mater Sci Eng. 2020;936:012001.10.1088/1757-899X/936/1/012001Search in Google Scholar
[19] Deepa Shri S, Dhivya K. Experimental study on the effect of partial replacement of cement by using glass powder and fly ash in concrete. Pak J Biotechnol. 2017;14:507–10.Search in Google Scholar
[20] Shao J, Gao J, Zhao Y, Chen X. Study on the pozzolanic reaction of clay brick powder in blended cement pastes. Constr Build Mater. 2019;213:209–15.10.1016/j.conbuildmat.2019.03.307Search in Google Scholar
[21] Alnahhal MF, Alengaram UJ, Jumaat MZ, Alsubari B, Alqedra MA, Mo KH. Effect of aggressive chemicals on durability and microstructure properties of concrete containing crushed new concrete aggregate and non-traditional supplementary cementitious materials. Constr Build Mater. 2018;163:482–95.10.1016/j.conbuildmat.2017.12.106Search in Google Scholar
[22] Zhao Y, Gao J, Liu C, Chen X, Xu Z. The particle-size effect of waste clay brick powder on its pozzolanic activity and properties of blended cement. J Clean Prod. 2020;242:118521.10.1016/j.jclepro.2019.118521Search in Google Scholar
[23] Baghabra Al-Amoudi OS. Attack on plain and blended cements exposed to aggressive sulfate environments. Cem Concr Compos. 2002;24:305–16.10.1016/S0958-9465(01)00082-8Search in Google Scholar
[24] Mohammadhosseini H, Lim NHAS, Tahir MM, Alyousef R, Samadi M. Performance evaluation of green mortar comprising ceramic waste as cement and fine aggregates replacement. SN Appl Sci. 2019;1. 10.1007/s42452-019-0566-5.Search in Google Scholar
© 2024 the author(s), published by De Gruyter
This work is licensed under the Creative Commons Attribution 4.0 International License.
Articles in the same Issue
- Research Articles
- Evaluation of the mechanical and dynamic properties of scrimber wood produced from date palm fronds
- Performance of doubly reinforced concrete beams with GFRP bars
- Mechanical properties and microstructure of roller compacted concrete incorporating brick powder, glass powder, and steel slag
- Evaluating deformation in FRP boat: Effects of manufacturing parameters and working conditions
- Mechanical characteristics of structural concrete using building rubbles as recycled coarse aggregate
- Structural behavior of one-way slabs reinforced by a combination of GFRP and steel bars: An experimental and numerical investigation
- Effect of alkaline treatment on mechanical properties of composites between vetiver fibers and epoxy resin
- Development of a small-punch-fatigue test method to evaluate fatigue strength and fatigue crack propagation
- Parameter optimization of anisotropic polarization in magnetorheological elastomers for enhanced impact absorption capability using the Taguchi method
- Determination of soil–water characteristic curves by using a polymer tensiometer
- Optimization of mechanical characteristics of cement mortar incorporating hybrid nano-sustainable powders
- Energy performance of metallic tubular systems under reverse complex loading paths
- Enhancing the machining productivity in PMEDM for titanium alloy with low-frequency vibrations associated with the workpiece
- Long-term viscoelastic behavior and evolution of the Schapery model for mirror epoxy
- Laboratory experimental of ballast–bituminous–latex–roving (Ballbilar) layer for conventional rail track structure
- Eco-friendly mechanical performance of date palm Khestawi-type fiber-reinforced polypropylene composites
- Isothermal aging effect on SAC interconnects of various Ag contents: Nonlinear simulations
- Sustainable and environmentally friendly composites: Development of walnut shell powder-reinforced polypropylene composites for potential automotive applications
- Mechanical behavior of designed AH32 steel specimens under tensile loading at low temperatures: Strength and failure assessments based on experimentally verified FE modeling and analysis
- Review Article
- Review of modeling schemes and machine learning algorithms for fluid rheological behavior analysis
- Special Issue on Deformation and Fracture of Advanced High Temperature Materials - Part I
- Creep–fatigue damage assessment in high-temperature piping system under bending and torsional moments using wireless MEMS-type gyro sensor
- Multiaxial creep deformation investigation of miniature cruciform specimen for type 304 stainless steel at 923 K using non-contact displacement-measuring method
- Special Issue on Advances in Processing, Characterization and Sustainability of Modern Materials - Part I
- Sustainable concrete production: Partial aggregate replacement with electric arc furnace slag
- Exploring the mechanical and thermal properties of rubber-based nanocomposite: A comprehensive review
- Experimental investigation of flexural strength and plane strain fracture toughness of carbon/silk fabric epoxy hybrid composites
- Functionally graded materials of SS316L and IN625 manufactured by direct metal deposition
- Experimental and numerical investigations on tensile properties of carbon fibre-reinforced plastic and self-reinforced polypropylene composites
- Influence of plasma nitriding on surface layer of M50NiL steel for bearing applications