Development of a small-punch-fatigue test method to evaluate fatigue strength and fatigue crack propagation
-
Yasuhiro Yamazaki
 ,
Keisuke Yoshida
,
Keisuke Yoshida

Abstract
Herein, fatigue and crack propagation tests were conducted using the small-punch-fatigue (SPF) test to verify its applicability to assess fatigue strength and fatigue crack propagation behavior. During the SPF test, a fatigue crack first initiated at the specimen center and then propagated in the radial direction. In most cases, three fatigue cracks propagated from the specimen center to the radial direction in point symmetry. X-ray computed tomography revealed that the crack initiated by the SPF test had a quarter ellipse shape. Elastic finite element (FE) analysis was conducted to estimate the stress state and stress intensity factor (SIF) of the specimen, and an approximate equation was obtained as a function of the applied load. The experimental results comprising fatigue lives and crack growth rates obtained via the SPF test were compared with the conventional uniaxial test data as functions of the stress amplitude and SIF determined via elastic FE analysis, respectively. This comparison showed that the SPF test can be applied to the fatigue test and fatigue crack propagation test.
1 Introduction
To ensure the safety and reliability of engineering components used in thermal and other power plants, periodic inspections are necessary to assess their damage and degradation. Generally, the damage conditions and the remaining fatigue lives of power plant components have been estimated using experimental methods combined with numerical analysis. For example, Zhu et al. proposed a fatigue life prediction method in the structure of a pressure vessel based on the relationship between fatigue-crack size and residual strength, which was established according to the permissible residual strength [1]. Gao et al. proposed a neuro-fuzzy-based machine learning method to predict the multiaxial fatigue life of various metallic materials [2].
Experimental damage and degradation evaluation methods are broadly classified into destructive and nondestructive testing [3,4,5,6,7]. Destructive testing involves cutting specimens from a structure and is generally considered more reliable than nondestructive testing methods, such as ultrasonic testing techniques [8,9]. However, when sampling relatively large specimens for conventional uniaxial tests, such as tensile, fatigue, and creep tests, considerable damage to the structure can occur. The small-sample-testing technique is a semi-destructive technique used for damage assessment in periodic inspections. It requires only a small-volume specimen cut from the part of the actual component. The small-sample-testing technique is used for quality inspections of the actual component products.
The small punch (SP) test is a semi-destructive small-sample-testing technique used for evaluating the damage and remaining life of small samples. In this test, a small rigid ball punches a small disk (SD) specimen with a diameter ranging from 3 to 10 mm and a thickness of less than a millimeter. The SP test method has been used in the nuclear field for over 30 years to evaluate the ductile to brittle transition temperature of materials and to estimate their fracture toughness [10,11,12]. Recently, an SP creep test has been proposed to assess the creep damage of actual components in thermal power plants [13,14,15,16]. For assessment using the SPC test, SD specimens are prepared from a small sample (e.g., 20 mm × 30 mm × 10 mm in size), which is cut from the surface of the actual component in thermal plants; moreover, the SPC test is often conducted under temperature-accelerated conditions.
The small-punch-fatigue (SPF) test has been proposed to evaluate the fatigue strength and crack propagation characteristics [17,18]. It is one of the best methods to estimate the damage and remaining fatigue life of the actual components in power plants. As fatigue cracks usually start on the surface of a component, it is important to evaluate the fatigue damage around the surface of the component. The SPF test requires only a small part around the surface of the component; thus, the damage caused by sampling the specimen can be negligible when applying the SPF test for fatigue damage assessments.
In this study, to confirm the validity of the SPF test, we used the SPF test to evaluate the fatigue lives and crack growth rates and compared the test results with those of conventional uniaxial fatigue (CUF) tests. In the following sections, the tested material and experimental procedures are first described. Subsequently, the experimental and analysis results regarding the fatigue crack initiation and propagation morphologies, evaluation of fatigue strength, and evaluation of crack propagation rates are presented and discussed. Finally, the conclusion of this study is presented.
2 Experimental procedures
The polycrystalline Ni-based superalloy IN 718 was used in this study. Tables 1 and 2 list the chemical composition and tensile properties of the tested material. The microstructure of the tested material is shown in Figure 1. The average grain size was approximately 15.9 μm. The SD specimens were machined from a round bar of the alloy. The surface of the SD specimen was polished to mirror smoothness using diamond pastes and choroidal silica before the SPF test. The diameter and thickness of the polished disk specimen were 15 mm and 0.290 ± 0.05 mm, respectively. The thickness of each SD specimen was measured before the SPF test.
Chemical composition and heat treatment conditions of the tested material (in wt%)
| Fe | Cr | Ni | Mo | Al | Ti | Cu |
|---|---|---|---|---|---|---|
| 17.50 | 17.89 | 53.93 | 2.96 | 0.55 | 0.98 | 0.07 |
| Co | Ta | B | C | Mn | Si | P |
| 0.25 | 0.01 | 0.0038 | 0.04 | 0.09 | 0.06 | 0.010 |
Solution annealing: 1 h at 955°C → water quenching.
Aging: 8 h at 718°C → furnace cool + 8 h at 621°C → air cool.
Tensile properties of the tested material
| Young’s modulus | 204 GPa |
| 0.2% proof stress | 1,207 MPa |
| Tensile strength | 1,420 MPa |
| Elongation | 21.0% |
| Reduction of area | 39.0% |
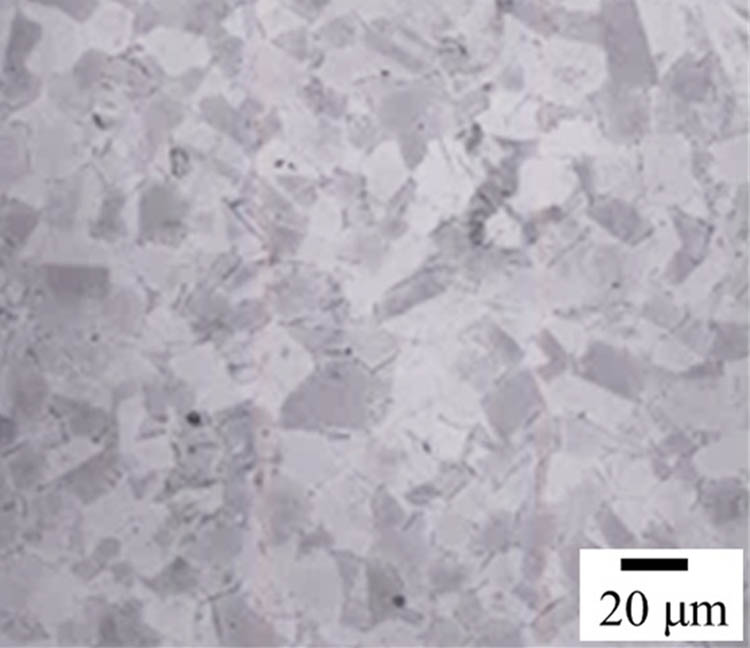
Microstructure of the tested material.
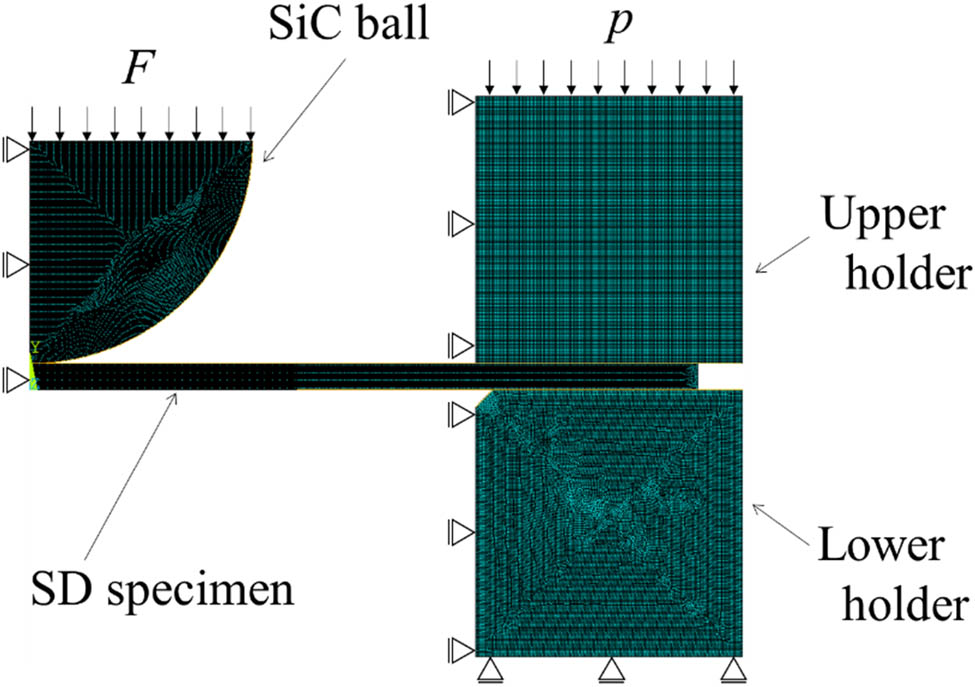
Figure 2 schematically illustrates the setup of an SD specimen and the testing jig. The SD specimen was securely fixed between the upper and lower holders made of SUS304 austenitic stainless steel. Cyclic bending load was applied to the specimen using a 5 mm diameter SiC ball. SPF tests were conducted at room temperature at a load ratio R = 0.1 and frequency f = 50 Hz using a sinusoidal waveform on an electrodynamic fatigue testing machine (Asahi seisakusho, FRDS-20). During the SPF test, the surface of the SD specimen was observed, and its movies were recorded using a digital microscope equipped with a video recording device, as shown in Figure 2. In the fatigue tests, the fatigue life was determined by counting the number of cycles until a surface fatigue crack with a length of 300 μm, which is almost comparable with the specimen thickness, was observed on the surface of the SD specimen. In the fatigue crack growth tests, the crack growth rates were measured for the fatigue crack ranging from ∼0.3 to 1.5 mm in length measured on the specimen surface (given in detail in Section 3.3).
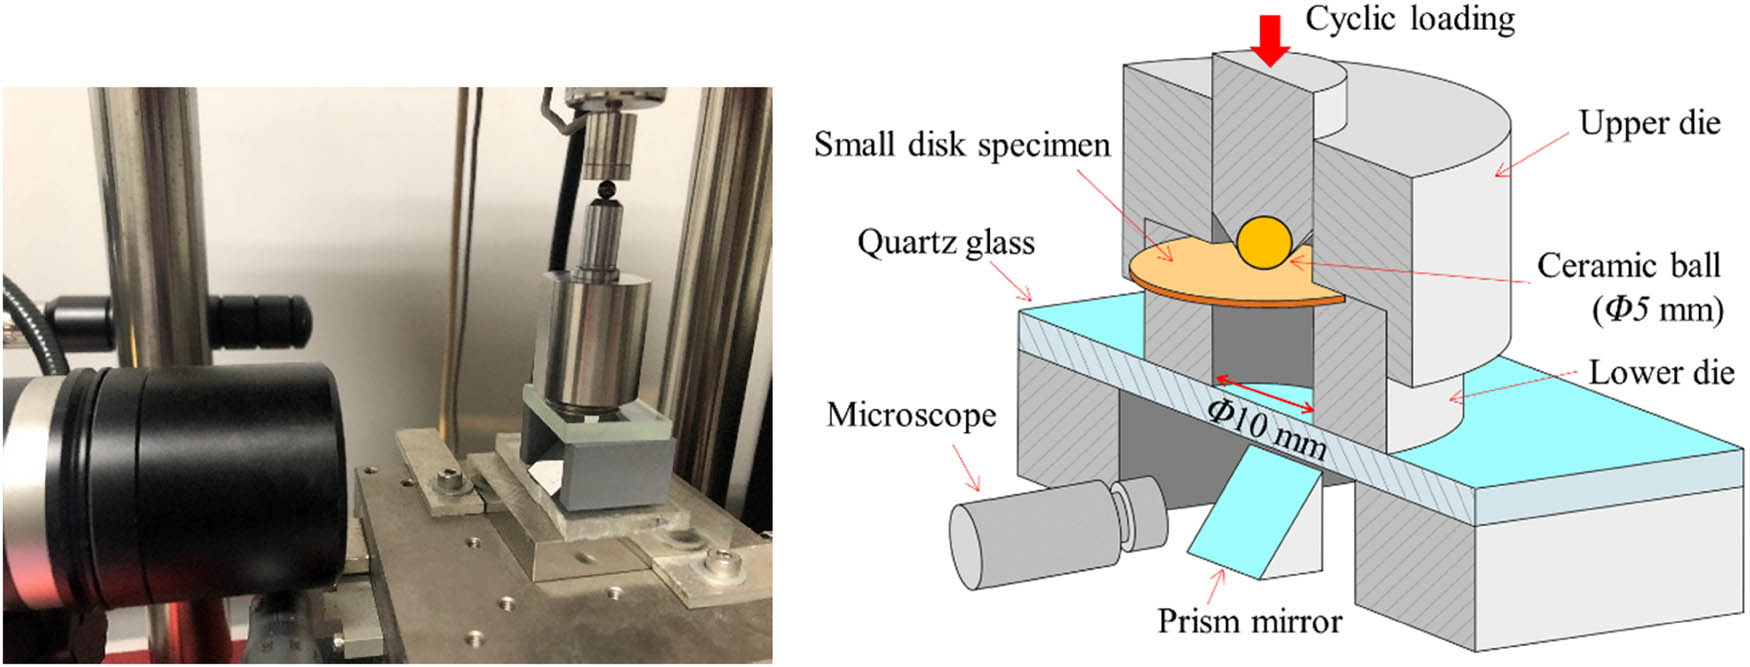
Photo and schematic illustration of the SPF test.
In this study, the specimen geometries were selected and determined based on the load capacity of the testing machine (max. 100 N). The SiC ball diameter affects the stress distribution in the specimen; the stress distribution gradient increases with the decrease in the ball diameter. Therefore, a ball diameter of 5 mm was determined as the optimum condition for gradual stress distribution. The load ratio of 0.1 was determined because it is impossible to perform under a negative load ratio condition owing to the loading mechanism that involves cyclic ball pushing. Furthermore, the fatigue test results will be almost unaffected by the loading frequency in the tested material at room temperature. Thus, the loading frequency was set as high as possible within the range where self-heating did not occur in the specimen.
The test results are expected to be sensitive to the test conditions, particularly specimen geometry and ball diameter. Further studies regarding the effects of specimen geometry and ball diameter on the test results are essential if SPF tests are conducted under other conditions.
3 Results and discussion
3.1 Morphology of fatigue crack initiation and propagation
Typical fatigue cracks generated on the SD specimen surface during the SPF test are shown in Figure 3. A fatigue crack, which was almost straight, was initiated at the center of the SD specimen (Figure 3(a)). A small fatigue crack was then propagated in the radial direction, and another fatigue crack was generated perpendicular to the original crack (Figure 3(b)). The three fatigue cracks were observed to propagate in the radial direction with point symmetry toward the center of the SD specimen (Figure 3(c)). Most fatigue cracks propagated in point symmetry and three radial directions (Figure 3), although a few cross-type cracks were observed.
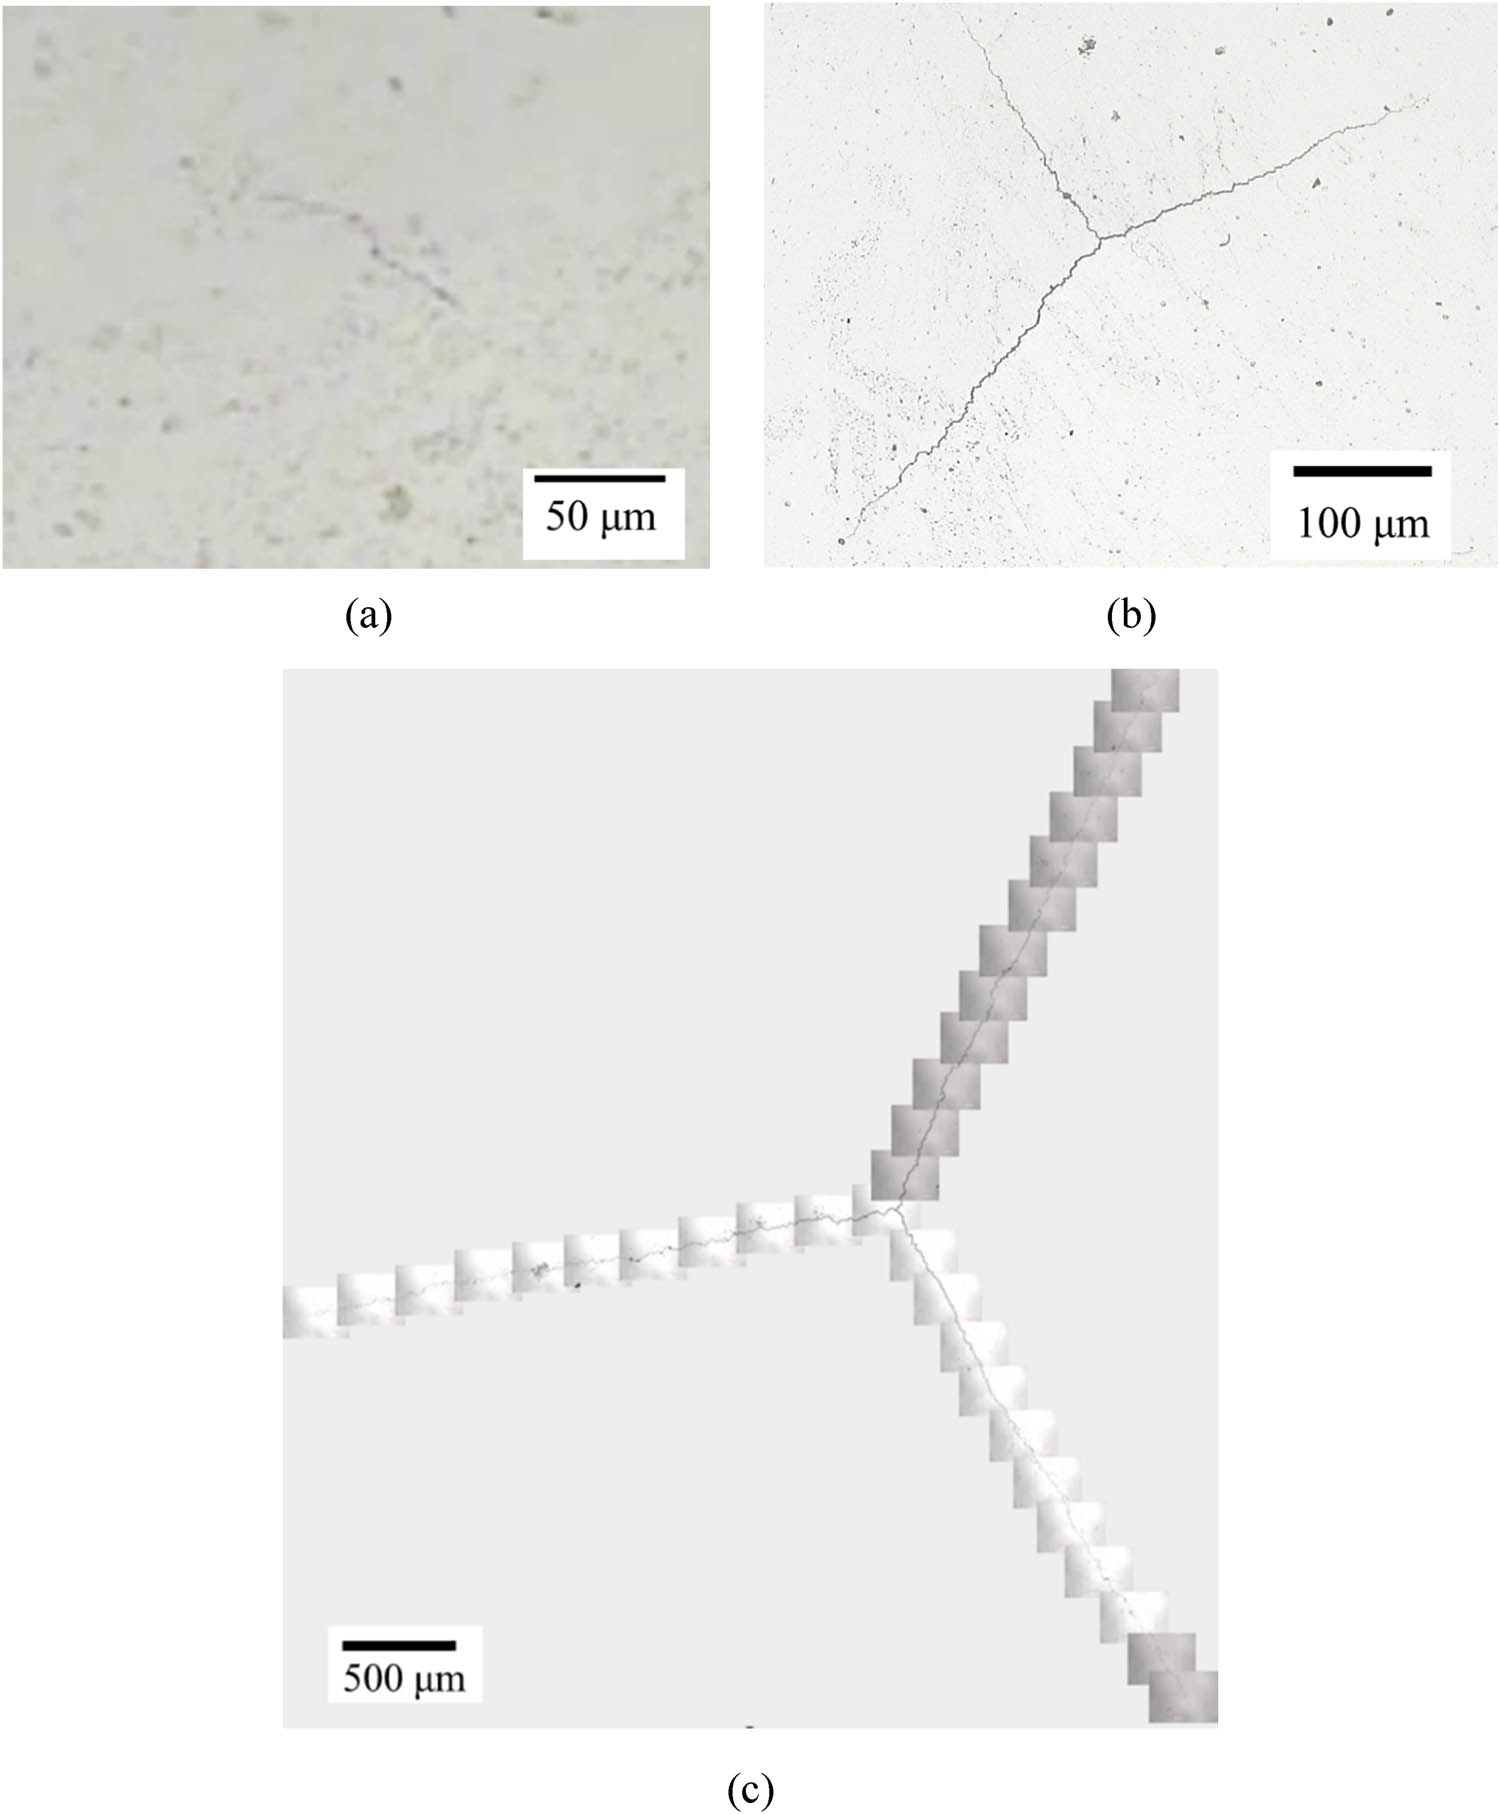
Morphologies of typical fatigue cracks on the SD specimen: (a) just initiated (the still image of the recorded video captured using a digital microscope), (b) after fatigue test, and (c) after crack propagation test.
The fatigue crack propagation morphologies could be observed on the surface of the SD specimen because the digital microscope recorded it during the SPF test. The three-dimensional geometry of the fatigue crack on the SD specimen surface could not be observed in the recorded video. In this study, several interrupted specimens with cracks of different lengths were prepared and the three-dimensional geometry of the cracks was measured using X-ray computed tomography (X-CT). A comparison of Figure 4(a) and (d) shows that the crack length measured through X-CT is slightly shorter than that measured by the optical microscope. This is because detecting cracks through X-CT can be challenging if the crack tip mouth is closed, which can result in a shorter crack length measurement compared with an optical microscope.
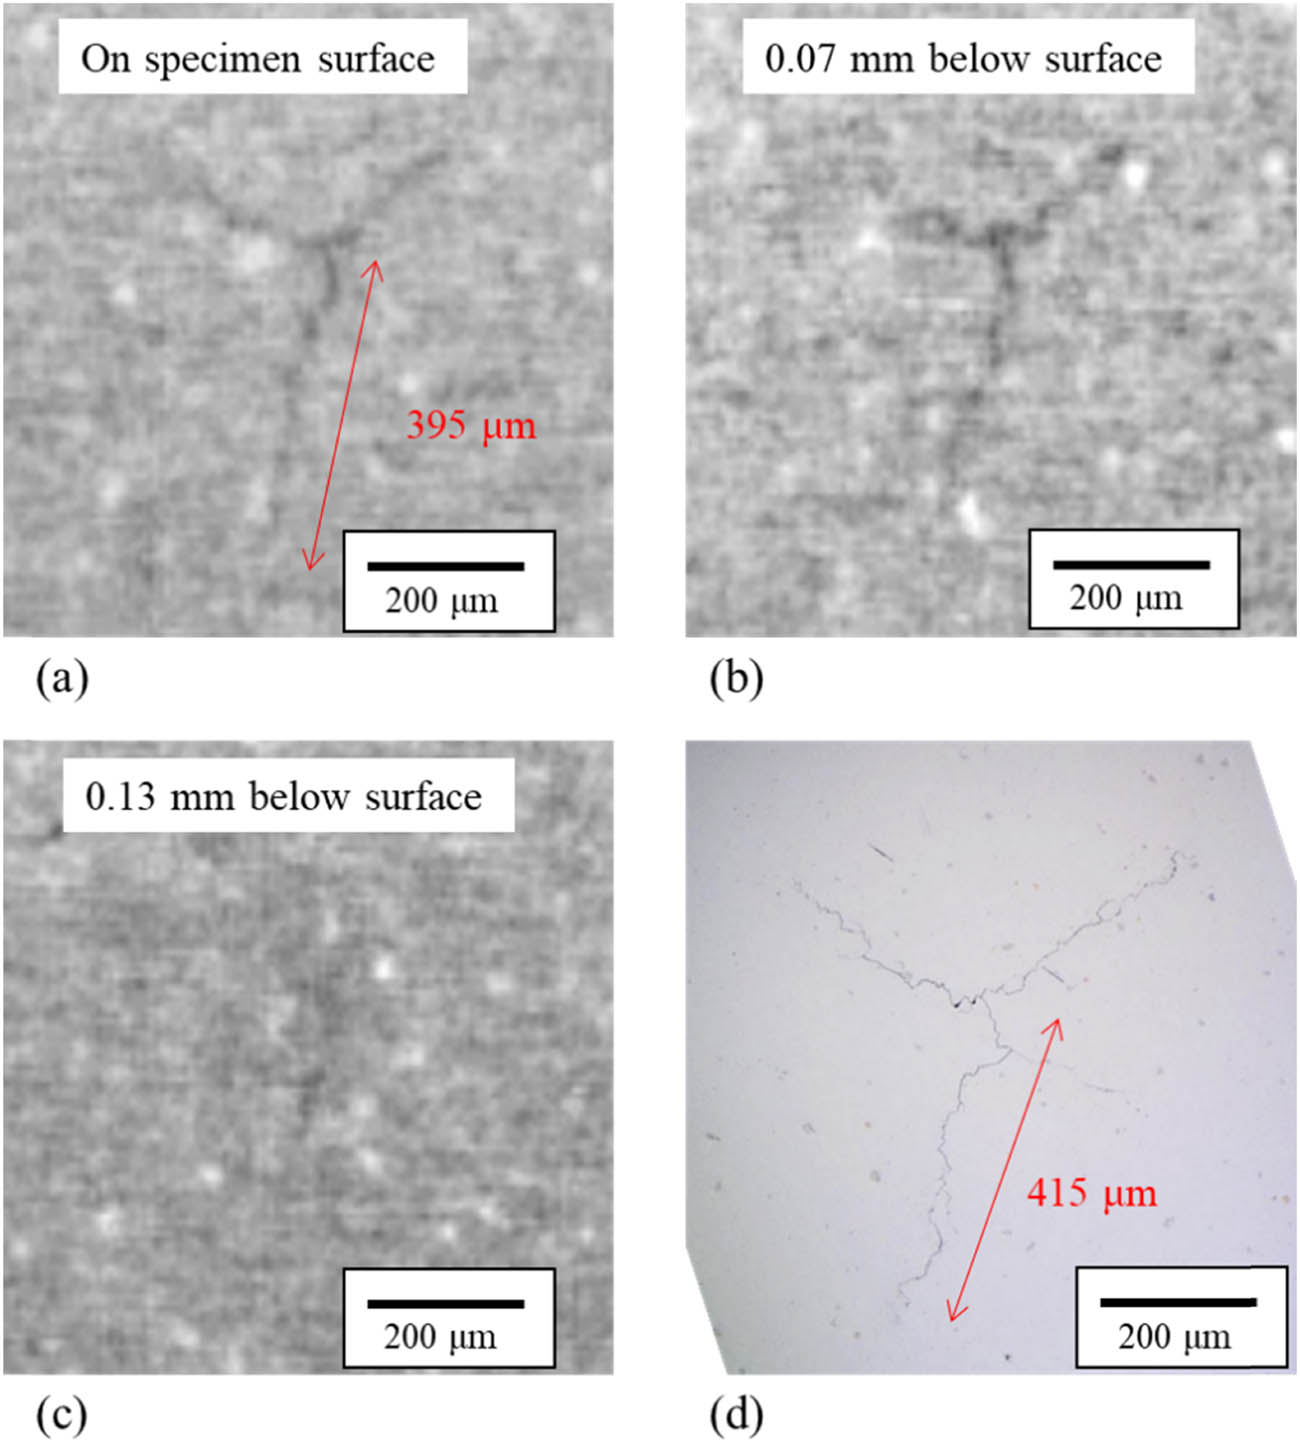
Typical images obtained by X-CT: (a) On the surface of the SD specimen, (b) 0.07 mm below the surface, (c) 0.13 mm below the surface, and (d) optical microscope image.
Figure 5 shows the typical crack shapes measured via X-CT, each of which can be approximated by a quarter ellipse. Figure 6 shows the relation between the crack depth c and crack length a measured via X-CT. From the results shown in Figure 6 the crack depth, c, can be estimated from the crack length, a, which is measured from the surface of the SD specimen using the following equation:
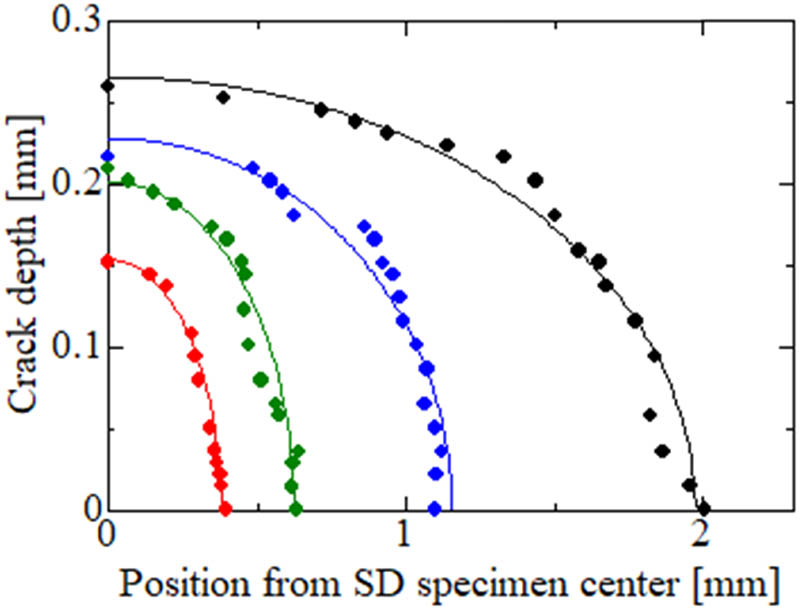
Typical crack shapes measured by X-CT.
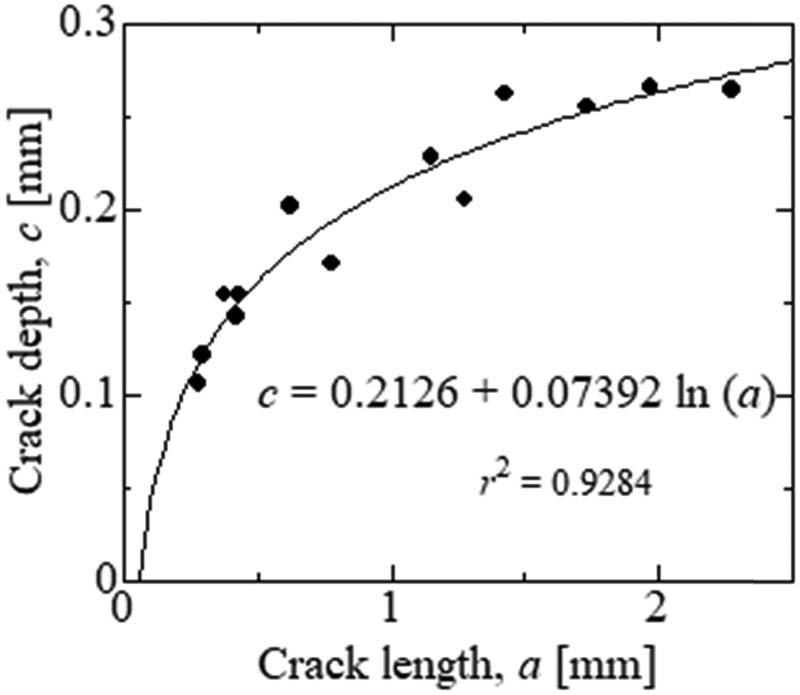
Relation between the crack depth and length measured by X-CT.
3.2 Evaluation of fatigue strength
3.2.1 Finite element (FE) analysis
Elastic FE analysis was performed using ANSYS® Mechanical APDL 2022 R2 to assess the stress distribution in the SD specimen because the stress field on the SD specimen surface varies with the distance from the center of the specimen in the SPF test. The FE model is illustrated in Figure 7, and the conditions of FE analysis are summarized in Table 3. The two-dimensional model presented in Figure 7, which is axisymmetric and has nodes ranging from 241,188 to 248,891, was used. The stress distribution in the SD specimen was almost independent of the friction coefficients between the SD specimen and SiC ball as well as between the SD specimen and holders; the difference in the stress at the specimen center was less than 1.5% of the maximum circumferential stress. The large deformation in the SD specimen, i.e., large overhang deformation, is speculated to affect the stress distribution. In addition, the increasing slip between the SD specimen and holder might increase the specimen deformation. Thus, the analysis was performed with zero friction coefficient in this study.
FE model to estimate the stress distribution in the SD specimen.
Conditions of FE analysis to evaluate the stress distribution in SD specimen
| Young’s modulus | SD specimen | 204 GPa |
| SUS304 holders | 193 GPa | |
| SiC ball | 400 GPa | |
| Specimen fix pressure by holders, p | 10 MPa | |
| Friction coefficient | SD specimen/SiC ball | 0 and 0.3 |
| SD specimen/holders | 0 and 0.3 | |
| SD specimen thickness | 0.285, 0.290, and 0.295 mm | |
| Applied load, F | 30, 40, and 50 N | |
The distributions of the circumferential stress on the bottom surface (tension side) of the SD specimen, obtained through elastic FE analysis, are shown in Figure 8. At the center of the SD specimen, the stress components in the radial and circumferential directions reach their maximum and are the same. However, the circumferential stress is larger than the radial one at any point except for the specimen center, and their difference increases with the increase in the distance from the center of the SD specimen. The results presented in Figure 8 show that a fatigue crack initiates at the center of the SD specimen and propagates in the radial direction.
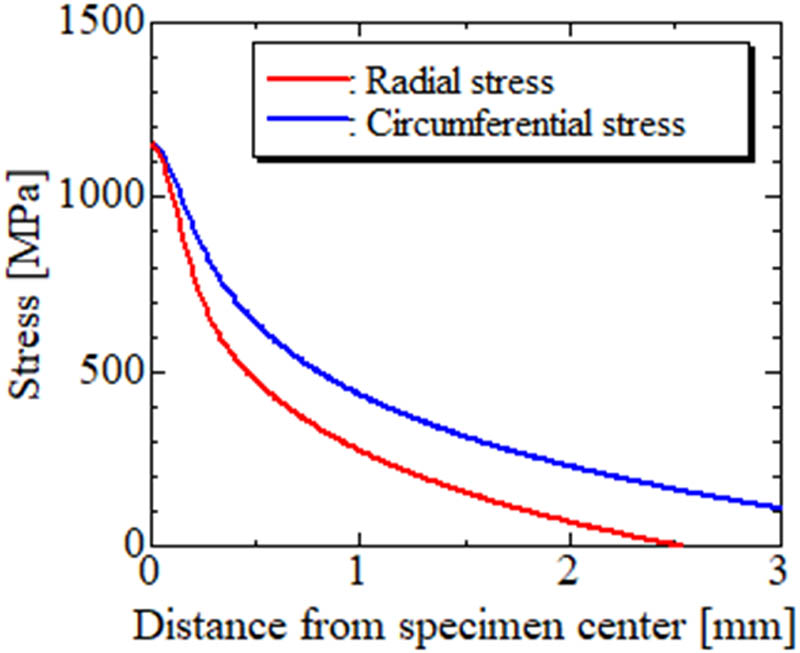
Typical stress distributions obtained by the FE analysis: applied load, F = 40 N, SD specimen thickness = 0.290 mm.
Figures 9 and 10 demonstrate how the applied load and the thickness of the SD specimen affect the circumferential stress. As shown in Figure 9(a), the circumferential stress at any position increases with the increase in the applied load. However, Figure 9(b) shows that the distributions of the circumferential stress normalized by the applied load were independent of the applied load. The maximum circumferential stress σ θmax is proportional to the applied load (Figure 9(c)). From Figure 9(c), σ θmax can be evaluated from the applied load F using the following equation:
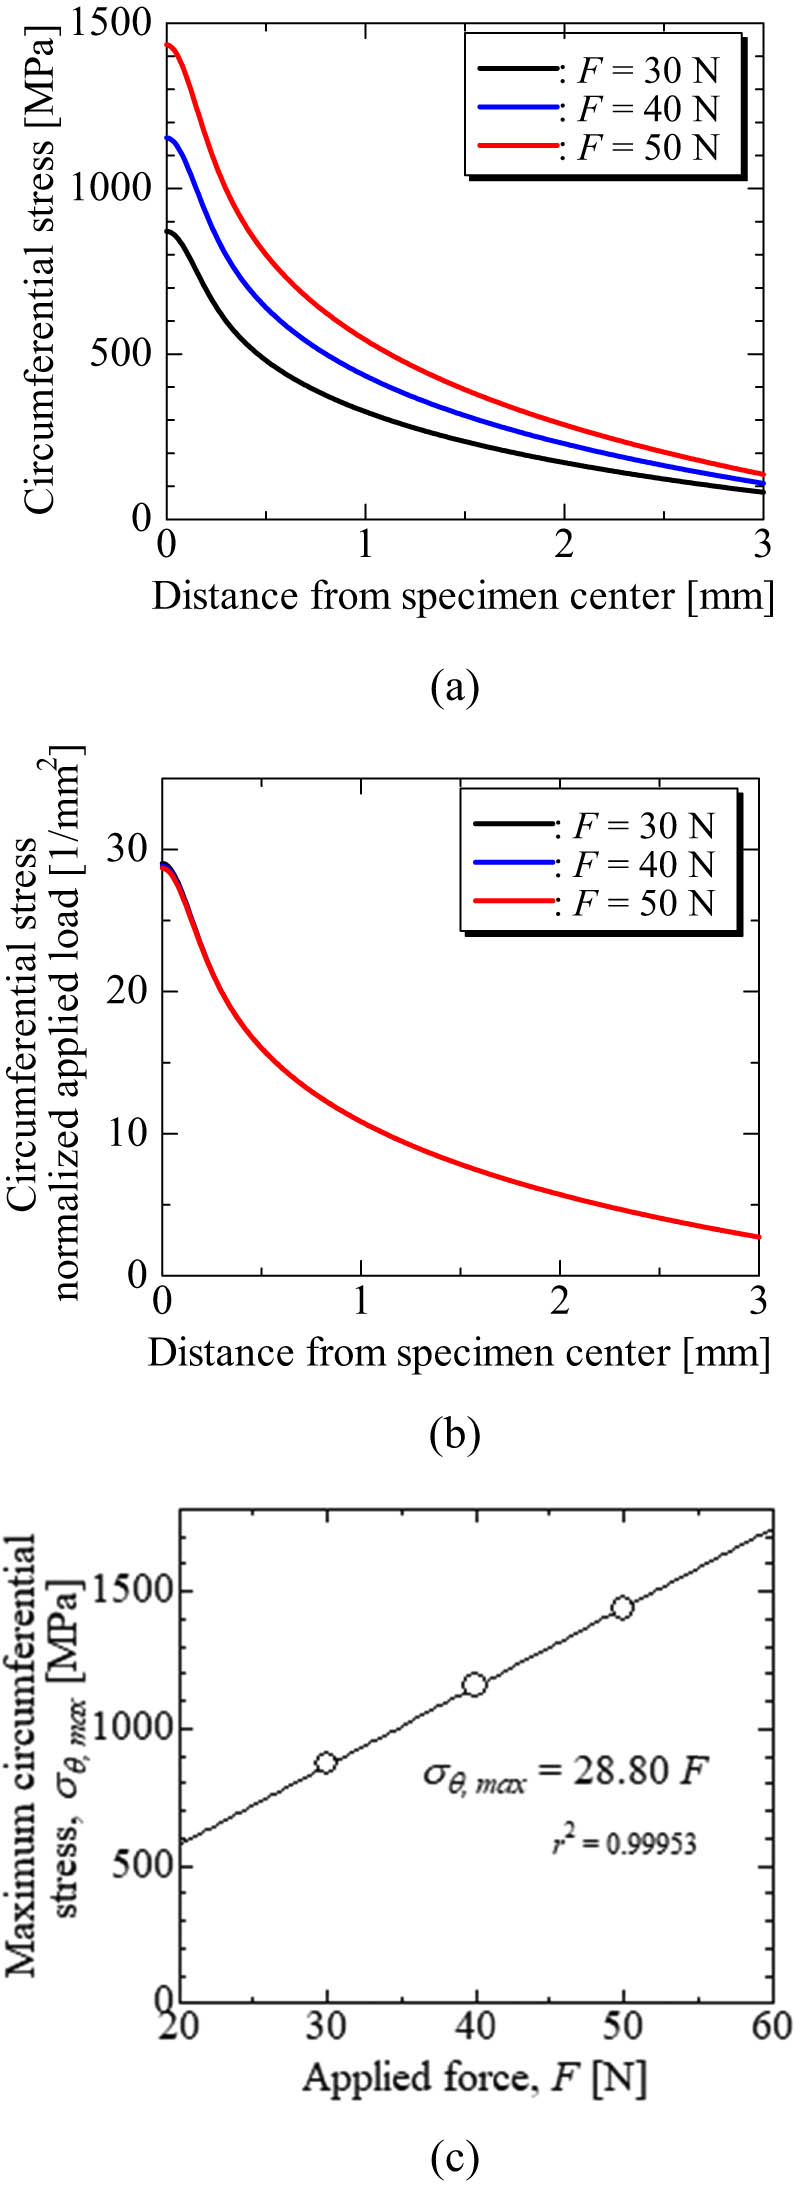
Effect of the applied load on the circumferential stress: (a) effect on the stress distribution, (b) distribution of circumferential stress normalized by the applied load, and (c) relation between the maximum circumferential stress and the applied load.
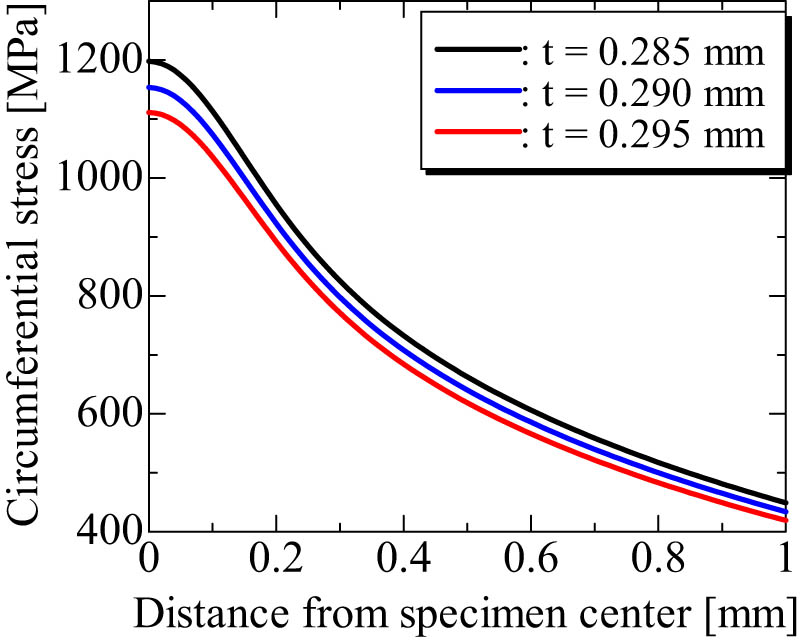
Effect of the SD specimen thickness on the circumferential stress.
As shown in Figure 10, the circumferential stress is affected by the thickness of the SD specimen around its center. However, the difference in stress decreases with the increase in the distance from the center. The thickness of the SD specimen was maintained at 0.290 ± 0.05 in this study. Within the limited thickness, the difference in the maximum circumferential stress due to specimen thickness was negligible as it was less than ±4% (Table 4).
Effect of specimen thickness on maximum circumferential stress
| Specimen thickness (mm) | Maximum circumferential stress (MPa) | Difference with data for t = 0.290 mm |
|---|---|---|
| 0.285 | 1,198 | +3.84% |
| 0.290 | 1,154 | — |
| 0.295 | 1,111 | −3.68% |
3.2.2 Test results
The results obtained via the SPF test are shown in Figure 11. The fatigue data obtained from the CUF test are also included in the figure for comparison. The stress state at the crack initiation point, which is located at the specimen center, is the equibiaxial condition in the SPF test. Thus, the equivalent stress range at the crack initiation point in the SPF test (Figure 11),
where
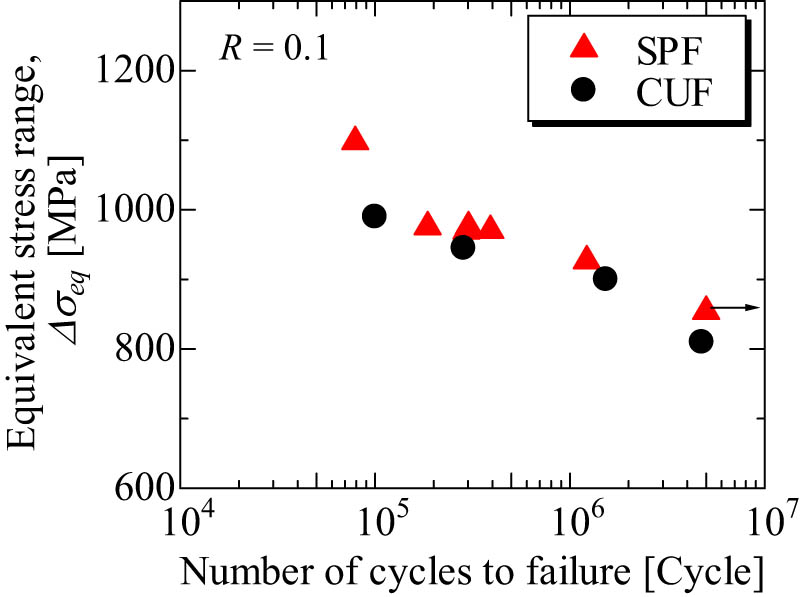
Fatigue strength obtained from the SPF test.
3.3 Evaluation of crack propagation rates
3.3.1 FE analysis of the fracture mechanics parameter
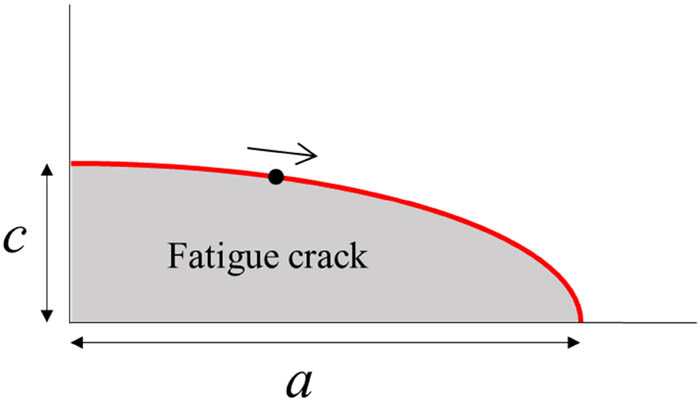
As previously mentioned, most fatigue cracks were found to have propagated in point symmetry and three radial directions, as shown in Figure 3. Thus, to account for this symmetry, a 1/3 model with the crack shown in Figure 12 was used for the FE analysis to estimate the stress intensity factor (SIF). Three-dimensional (3D) FE analysis was performed using ANSYS® Workbench 2022 R2. The total number of nodes in the model used for the 3D FE analysis were 118,840–431,125. As shown in Figure 12, the FE model, each cross-section of the SD specimen, the holders, and the SiC ball are set as the periodic symmetric boundary. This study assumed a quarter ellipse shape for the fatigue crack based on the results of X-CT, as shown in Table 5.
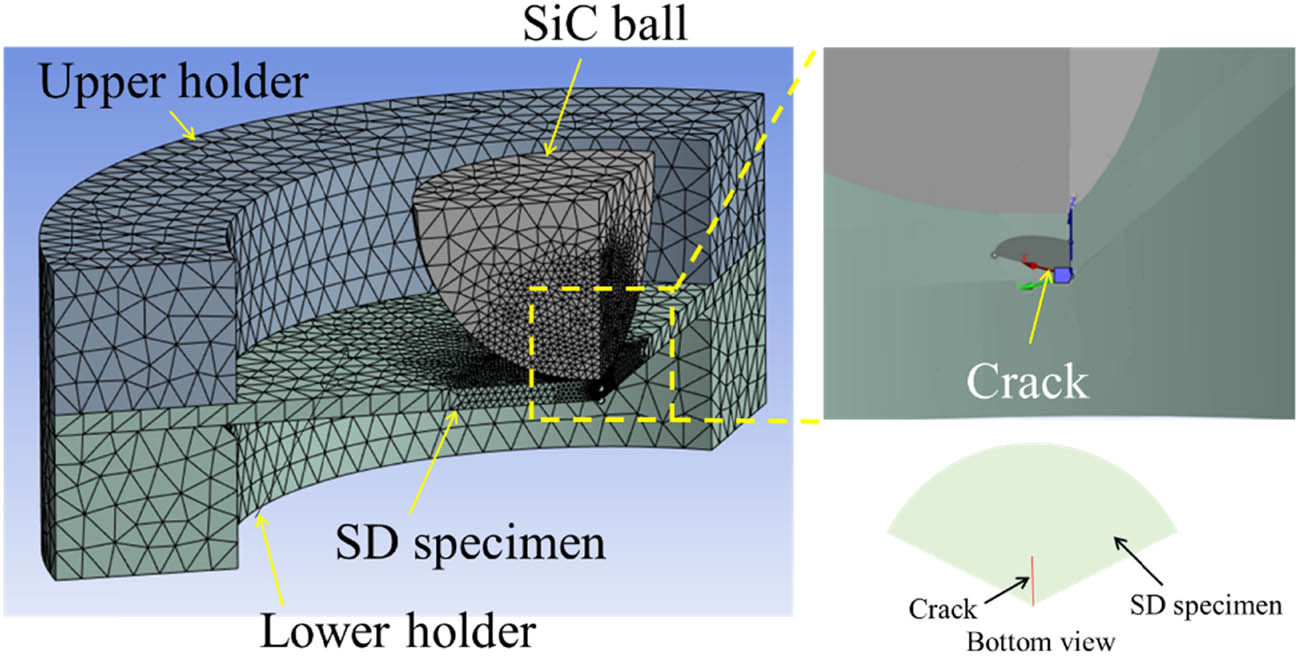
FE model to evaluate the SIF.
Conditions of FE analysis to evaluate the SIF
| Young’s modulus (GPa) | SD specimen | 204 |
| SUS304 holders | 193 | |
| SiC ball | 400 | |
| Specimen fix pressure by holders, p (MPa) | 10 | |
| Friction coefficient | SD specimen/SiC ball | 0 |
| SD specimen/holders | 0 | |
| SD specimen thickness (mm) | 0.290 | |
| Applied load, F (N) | 30, 40, and 50 | |
| Crack size, (a, c) (mm) | (0.3, 0.1236), (0.5, 0.1614), (0.75, 0.1914), (1.0, 0.2126), and (1.5, 0.2638) | |
The impact of the applied load on the SIF obtained through FE analysis is illustrated in Figure 13. The SIF distributions along the crack leading edge, as shown in Figure 14, are represented in Figure 13; the average node spacing along the crack leading edge was approximately 2 μm. As shown in Figure 13(a), the SIF increases with the increase in the applied load. However, Figure 13(b) reveals that the SIF distributions normalized by the applied load were independent of the applied load, similar to the stress distribution shown in Figure 9.
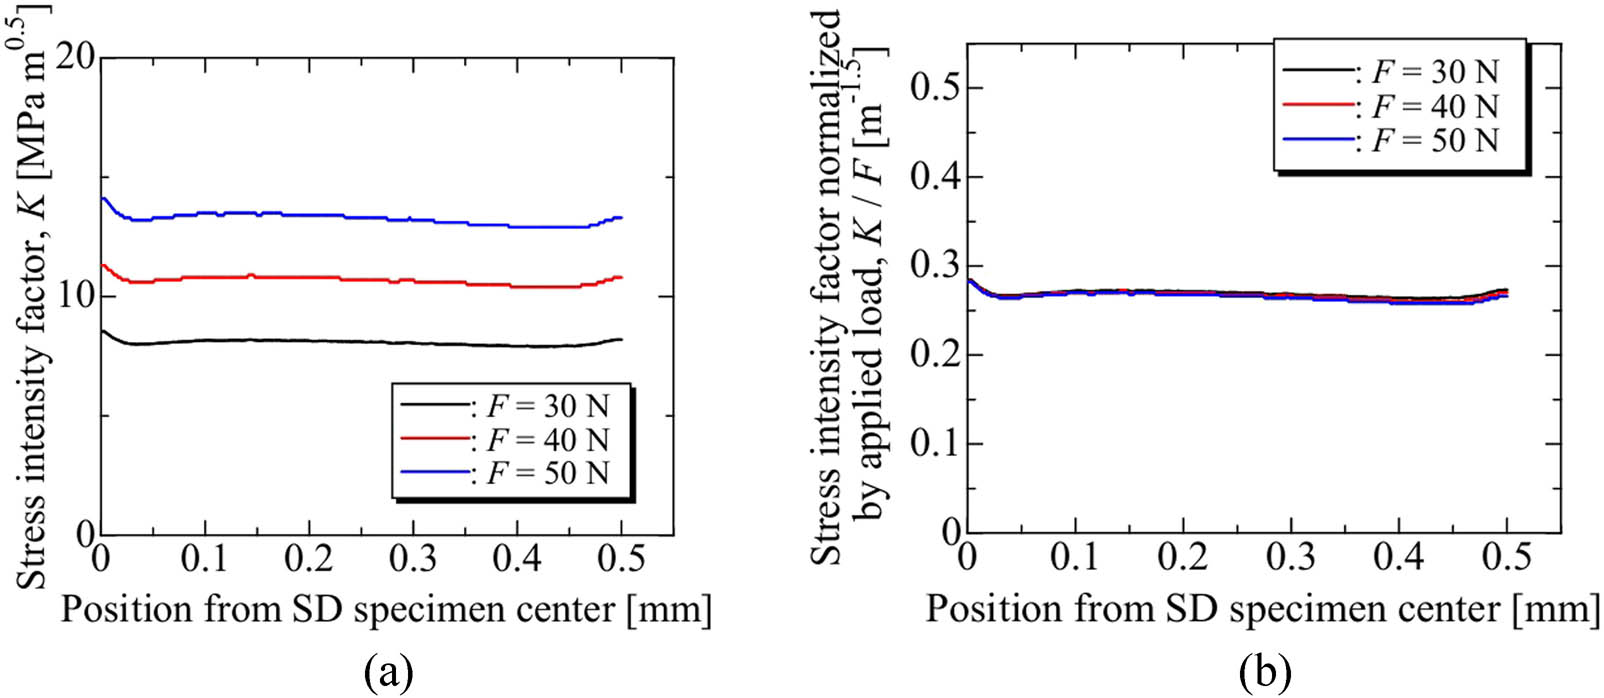
Effect of the applied load on the SIF: (a) Distribution of SIF, (b) Distribution of SIF normalized by applied load.
Schematic illustration of the definition of the position for calculating the SIF along the crack leading edge.
Figure 15 illustrates the impact of the crack geometry on the SIF. When the crack length is relatively short (almost less than 0.5 mm), the SIF is almost uniform along the crack leading edge. However, as the crack length increases, the distribution of the SIF becomes nonuniform. When the crack length exceeds 1 mm, the SIF around the center of the SD specimen decreases considerably. This decrease in SIF around the center of the SD specimen with the increase in the crack length is related to the crack geometry. A comparison of Figures 5 and 15 shows that the area with a low SIF corresponds to the area where the crack tip extends beyond the neutral plane of the specimen. Based on the results presented in Figures 5 and 15, it can be concluded that the fatigue crack is unlikely to penetrate through the thickness of the specimen as the driving force for crack growth is reduced around the center of the SD specimen.
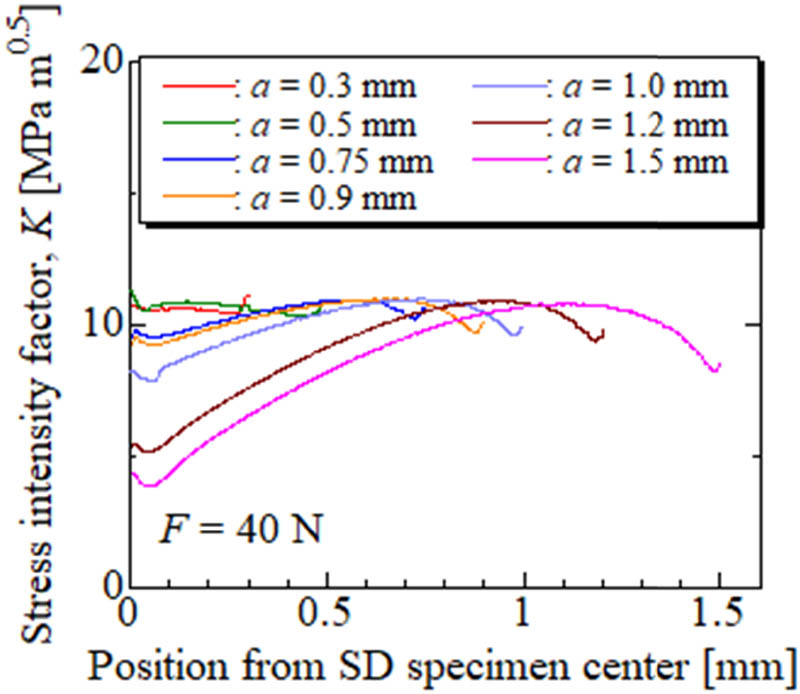
Effect of the crack geometry on the SIF.
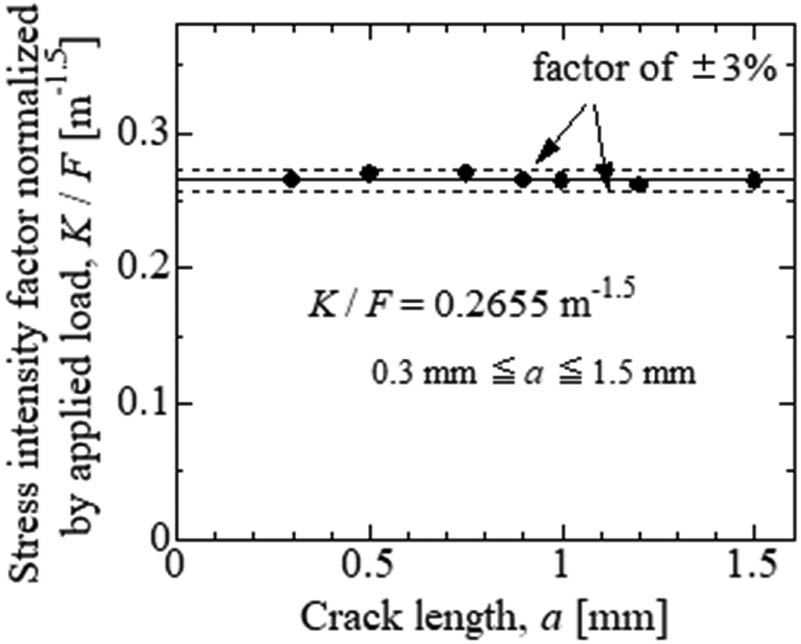
Based on the results obtained and the crack length measured at the SD specimen surface, the SIF for the given crack length was determined. The SIF was calculated as the average value along the crack leading edge in the region from the SD crack surface to a depth of 50% of the surface (i.e., to the neutral plane). Figure 16 shows the relation between the SIF and crack length. The SIF remains constant and independent of the crack length. Generally, the SIF, K, is represented by the crack length a and applied stress σ as follows:
where B represents the shape coefficient. In the conventional fatigue crack propagation test on a compact tension (CT) specimen or center-notch specimen under constant-load conditions, the SIF increases with crack growth. However, the results presented in Figure 15 indicate that the SPF test enables the fatigue crack propagation tests under a constant SIF condition. In the SPF test, the SIF remains unaffected by changes in the crack length because the stress at the crack tip decreases with the increase in the crack length.
Relation between the SIF obtained from the FE analysis and the crack length.
Based on the aforementioned results, this study evaluated the crack growth rate in the crack length range of 0.3–1.5 mm. The SIF range ΔK was calculated using the following equation:
where F max and F min represent the maximum and minimum applied forces in the SPF test, respectively, and R represents the load ratio (F min/F max).
3.3.2 Test results
The SPF test was performed to investigate the behavior of crack growth. a is defined as the average distance between the specimen center and crack tip for three radial cracks.
Figure 17 shows the relation between the fatigue crack growth rate (da/dN) and a obtained via the SPF test. This relation indicates that the crack growth rate increased with the increase in the applied load. The findings shown in Figure 17 reveal that the crack propagation tests under the constant SIF condition can be conducted via the SPF test, as the crack growth rates are almost independent of the crack length at the given load condition.
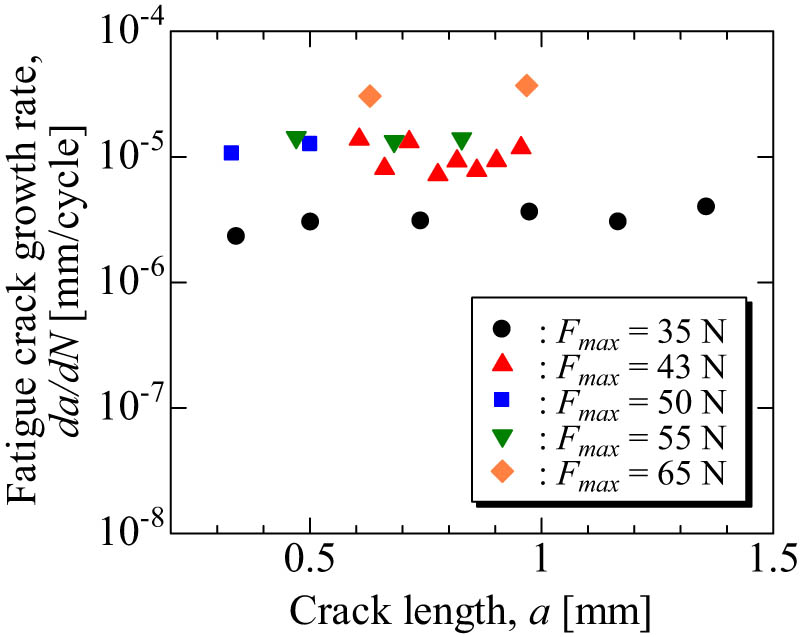
Relation between the fatigue crack growth rate, da/dN, and the crack length, a.
Figure 18 shows the crack growth rate correlated with the SIF range obtained from the average crack length using equation (5). For comparison, the crack growth curves reported in previous studies are also shown in Figure 18 [19,20]. As observed in Figure 18, the crack growth rates obtained via the SPF test are relatively higher than those reported in the previous studies. However, the difference in the crack propagation test results between this study and the previous studies is not significant.
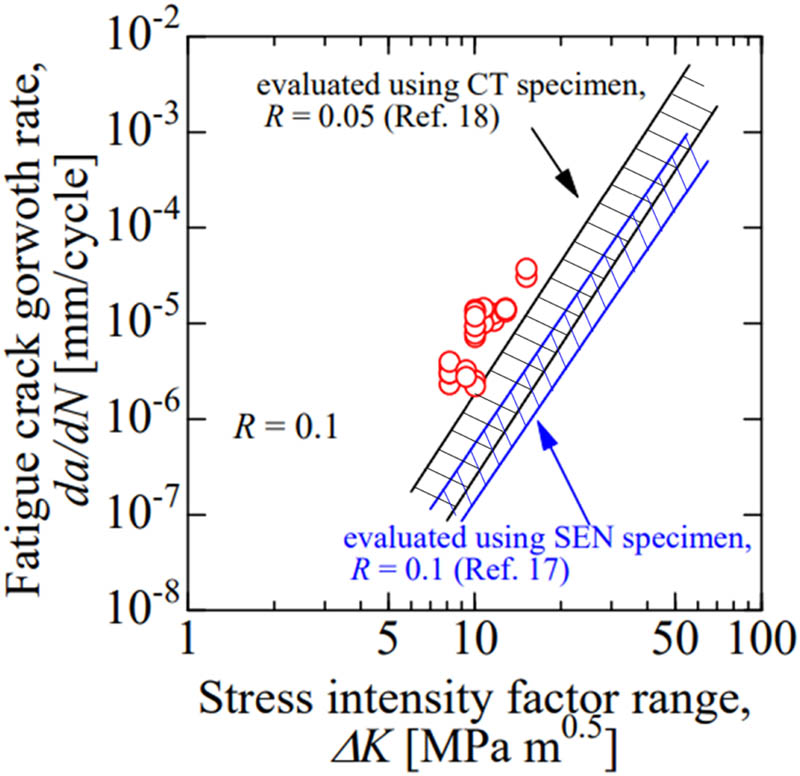
Fatigue crack propagation rates obtained by the SPF test correlated with the SIF range.
The reference data shown in Figure 14 are obtained for relatively large crack sizes using single-edge notched bend specimens or compact-tension specimens. Furthermore, the crack growth data in this study were evaluated for the surface cracks whose lengths were less than 1.5 mm. The difference in the crack propagation rates shown in Figure 14 might be related to the crack size difference, i.e., the “small crack effect” [21].
The aforementioned results indicate that the SPF test can be used to conduct a constant-SIF range test. However, further verification is required to determine the applicability of the SPF test to ductile and large-grain materials for crack propagation testing.
4 Conclusion
Herein, the morphologies of fatigue crack initiation and propagation for the Ni-based superalloy IN 718 were investigated through the SPF test to verify the applicability of this test in evaluating fatigue lives and crack growth rates.
The main conclusions can be summarized as follows.
A fatigue crack was found to initiate at the center of the SD specimen surface, where stress was the maximum. In most cases, three fatigue cracks propagated from the center to the radial direction of the SD specimen in point symmetry.
X-CT results revealed that the fatigue crack initiated by the SPF test had a quarter ellipse shape. Based on these results, an approximate equation was obtained to calculate the crack depth from the measured crack length for the SD specimen.
When the fatigue lives evaluated via the SPF test were related to the range of the maximum stress at the SD specimen center obtained through elastic FE analysis, the fatigue strength determined via the SPF test was almost comparable with that determined via the CUF test.
The elastic FE analysis results indicated that the SIF for the fatigue crack in the SD specimen was independent of the crack length; further, it could be calculated via the approximate equation using the applied load regardless of the crack length.
The results of the crack propagation test and elastic FE analysis confirm that the SIF test can be used to conduct a constant-SIF crack propagation test.
Based on the aforementioned results, the applicability of the SPF test to assess fatigue strength and crack propagation behavior was confirmed.
-
Funding information: No funding was received to assist with the preparation of this manuscript.
-
Author contributions: Yasuhiro Yamazaki: conceptualization, methodology, data curation, writing – original draft, writing – review and editing, visualization, supervision, and project administration. Keisuke Yoshida: investigation, FE analysis, data curation, and visualization. Kazuhiro Okada: investigation, data curation, and visualization. Momoka Arai: FE analysis, data curation and visualization. Yosuke Nakahara: validation, investigation, and resources. Yutaro Ota: validation, investigation, and resources. All authors have read and agreed to the published version of the manuscript.
-
Conflict of interest: The authors declare no conflicts of interest associated with this manuscript.
-
Data availability statement: Data will be made available on request.
References
[1] Zhu M, Liu X, Lai J, Luo J. Fatigue life of a pressure vessel based on residual strength and crack size. Trans Can Soc Mech Eng. 2022;46:391–9.10.1139/tcsme-2021-0063Suche in Google Scholar
[2] Gao J, Heng F, Yuan Y, Liu Y. A novel machine learning method for multiaxial fatigue life prediction: improved adaptive neuro-fuzzy inference system. Int J Fatigue. 2024;178:108007.10.1016/j.ijfatigue.2023.108007Suche in Google Scholar
[3] Thombre SC, Kotwal MR. Residual life assessment. Int J Eng Res Technol. 2015;4:1068–75.10.17577/IJERTV4IS031113Suche in Google Scholar
[4] Kadoya Y, Goto T, Date S, Yamauchi T, Saida T, Sada T. Assessment of remaining life of fossil power plant parts by means of a miniature creep rupture test. ISIJ Int. 1990;30:854–61.10.2355/isijinternational.30.854Suche in Google Scholar
[5] Liaw PK, Saxena A, Schaefer J. Estimating remaining life of elevated-temperature steam pipes – part I. Materials properties. Eng Fract Mech. 1989;32:675–708.10.1016/0013-7944(89)90166-5Suche in Google Scholar
[6] Garzillo A, Guardamagna C, Moscotti L, Ranzani L. A technique for the residual life assessment of high temperature components based on creep-rupture testing on welded miniature specimens. Int J Pressure Vessels Piping. 1996;66:223–32.10.1016/0308-0161(95)00097-6Suche in Google Scholar
[7] Liaw PK, Rao GV, Burke MG. Creep fracture behavior of 214Cr 1Mo welds from a 31-year-old fossil power plant. Mater Sci Eng A. 1991;131:187–201.10.1016/0921-5093(91)90395-4Suche in Google Scholar
[8] Oka M, Yakushiji T, Tsuchida Y, Enokizono M. Nondestructive evaluation of fatigue damage in the stainless steel by using electromagnetic method. E-J Adv Maint. 2009;1:77–82.10.1063/1.3114126Suche in Google Scholar
[9] Sposito G, Ward C, Cawley P, Nagy PB, Scruby C. A review of non-destructive techniques for the detection of creep damage in power plant steels. NDT&E Int. 2010;43:555–67.10.1016/j.ndteint.2010.05.012Suche in Google Scholar
[10] Dzugan J, Konopík P. Small punch test application to material properties evolution determination. J Solid Mech Mater Eng. 2012;6:782–91.10.1299/jmmp.6.782Suche in Google Scholar
[11] Suzuki M, Eto M, Fukaya K, Nishiyama Y, Kodaira T, Oku T. Estimation of toughness degradation by microhardness and small punch tests. Small specimen test techniques. ASTM STP. 1993;1204:217–27.10.1520/STP12731SSuche in Google Scholar
[12] Bruchhausen M, Holmström S, Simonovski I, Austin T, Lapetite J-M, Ripplinger S, et al. Recent developments in small punch testing: tensile properties and DBTT. Theor Appl Fract Mech. 2016;86:2–10.10.1016/j.tafmec.2016.09.012Suche in Google Scholar
[13] Ule B, Šuštar T, Dobeš F, Milička K, Bicego V, Tettamanti S, et al. Small punch test method assessment for the determination of the residual creep life of service exposed components: outcomes from an interlaboratory exercise. Nucl Eng Des. 1999;192:1–11.10.1016/S0029-5493(99)00039-4Suche in Google Scholar
[14] Holmström S, Li Y, Dymacek P, Vacchieri E, Jeffs SP, Lancaster RJ, et al. Creep strength and minimum strain rate estimation from small punch creep tests. Mater Sci Eng A. 2018;731:161–72.10.1016/j.msea.2018.06.005Suche in Google Scholar
[15] Ortiz-Mariscal A, Saucedo-Muñoz ML, Naveena KS, Komazaki S. Application of small punch creep testing for evaluation of creep properties of as-received and artificially aged 5Cr-0.5Mo steel. Mater Sci Eng A. 2018;709:322–9.10.1016/j.msea.2017.10.060Suche in Google Scholar
[16] Komazaki S, Sugimoto T, Hasegawa Y, Kohno Y. Damage evaluation of a welded joint in a long-term service-exposed boiler by using a small punch creep test. ISIJ Int. 2007;47:1228–33.10.2355/isijinternational.47.1228Suche in Google Scholar
[17] Lancaster RJ, Jeffs SP, Illsley HW, Argyrakis C, Hurst RC, Baxter GJ. Development of a novel methodology to study fatigue properties using the small punch test. Mater Sci Eng A. 2019;748:21–9.10.1016/j.msea.2019.01.074Suche in Google Scholar
[18] Yamazaki Y, Sugaya R, Kobayashi U, Ohta Y. Effects of thermal cycling and microstructure on the fatigue crack propagation in forged titanium–aluminide alloys under thermomechanical fatigue conditions. Mater Sci Eng A. 2020;797:140248.10.1016/j.msea.2020.140248Suche in Google Scholar
[19] Mercer C, Soboyejo ABO, Soboyejo WO. Micromechanisms of fatigue crack growth in a forged inconel 718 nickel-based superalloy. Mater Sci Eng A. 1999;270:308–22.10.1016/S0921-5093(99)00214-2Suche in Google Scholar
[20] James LA. Fatigue crack propagation in alloy 718: a review. Superalloys. 1989;499–515.10.7449/1989/Superalloys_1989_499_515Suche in Google Scholar
[21] Phillips EP, Newman JC. Impact of small-crack effects on design life calculations. Exp Mech. 1989;29:221–5.10.1007/BF02321379Suche in Google Scholar
© 2024 the author(s), published by De Gruyter
This work is licensed under the Creative Commons Attribution 4.0 International License.
Artikel in diesem Heft
- Research Articles
- Evaluation of the mechanical and dynamic properties of scrimber wood produced from date palm fronds
- Performance of doubly reinforced concrete beams with GFRP bars
- Mechanical properties and microstructure of roller compacted concrete incorporating brick powder, glass powder, and steel slag
- Evaluating deformation in FRP boat: Effects of manufacturing parameters and working conditions
- Mechanical characteristics of structural concrete using building rubbles as recycled coarse aggregate
- Structural behavior of one-way slabs reinforced by a combination of GFRP and steel bars: An experimental and numerical investigation
- Effect of alkaline treatment on mechanical properties of composites between vetiver fibers and epoxy resin
- Development of a small-punch-fatigue test method to evaluate fatigue strength and fatigue crack propagation
- Parameter optimization of anisotropic polarization in magnetorheological elastomers for enhanced impact absorption capability using the Taguchi method
- Determination of soil–water characteristic curves by using a polymer tensiometer
- Optimization of mechanical characteristics of cement mortar incorporating hybrid nano-sustainable powders
- Energy performance of metallic tubular systems under reverse complex loading paths
- Enhancing the machining productivity in PMEDM for titanium alloy with low-frequency vibrations associated with the workpiece
- Long-term viscoelastic behavior and evolution of the Schapery model for mirror epoxy
- Laboratory experimental of ballast–bituminous–latex–roving (Ballbilar) layer for conventional rail track structure
- Eco-friendly mechanical performance of date palm Khestawi-type fiber-reinforced polypropylene composites
- Isothermal aging effect on SAC interconnects of various Ag contents: Nonlinear simulations
- Sustainable and environmentally friendly composites: Development of walnut shell powder-reinforced polypropylene composites for potential automotive applications
- Mechanical behavior of designed AH32 steel specimens under tensile loading at low temperatures: Strength and failure assessments based on experimentally verified FE modeling and analysis
- Review Article
- Review of modeling schemes and machine learning algorithms for fluid rheological behavior analysis
- Special Issue on Deformation and Fracture of Advanced High Temperature Materials - Part I
- Creep–fatigue damage assessment in high-temperature piping system under bending and torsional moments using wireless MEMS-type gyro sensor
- Multiaxial creep deformation investigation of miniature cruciform specimen for type 304 stainless steel at 923 K using non-contact displacement-measuring method
- Special Issue on Advances in Processing, Characterization and Sustainability of Modern Materials - Part I
- Sustainable concrete production: Partial aggregate replacement with electric arc furnace slag
- Exploring the mechanical and thermal properties of rubber-based nanocomposite: A comprehensive review
- Experimental investigation of flexural strength and plane strain fracture toughness of carbon/silk fabric epoxy hybrid composites
- Functionally graded materials of SS316L and IN625 manufactured by direct metal deposition
- Experimental and numerical investigations on tensile properties of carbon fibre-reinforced plastic and self-reinforced polypropylene composites
- Influence of plasma nitriding on surface layer of M50NiL steel for bearing applications