OPGW fault localization method based on transformer and federated learning
-
Zhigang Yan
 ,
Xinyue Su
,
Xinyue Su

Abstract
A fault localization and analysis method for Optical Power-Grade Ground Wire (OPGW) based on transformer and federated learning (FedL) in a cloud edge collaborative environment is proposed. First, based on the cloud edge collaboration architecture, a model framework for OPGW fault location is designed through the collaboration between the cloud center and edge computing. Then, by introducing FedL for model training at each OPGW edge sensor, only model parameters are exchanged without transmitting raw data, greatly reducing computational costs and network bandwidth requirements. Finally, the Transformer network was introduced into the model, which greatly improved the processing efficiency of fault data through parallel computing. The simulation experiment results show that the relative error, absolute error, and localization time of the proposed method for fault localization are the smallest on different datasets, with the lowest values being 0.78%, 0.0297 km, and 5.33 µs, respectively.
1 Introduction
With the rapid development of global informatization, the importance of power communication networks as an important infrastructure to support the safe and stable operation of power systems is becoming increasingly prominent. In the power communication network, Optical Power-Grade Ground Wire (OPGW) is a special optical cable that combines power transmission and communication transmission, and is widely used in the communication protection of high-voltage transmission lines [1,2,3]. OPGW is designed and installed simultaneously with the overhead ground wire of the transmission line by combining optical fibers in the overhead ground wire of the transmission line, completing the installation in one go. On the premise of maintaining all the performance and functions of the original overhead ground wire unchanged, optical fibers are added to open up high-performance optical transmission channels, making them both lightning protection and communication functions [4,5,6]. OPGW has excellent electrical, mechanical, and optical transmission performance and has been widely used in power grids in recent years. Most newly built transmission lines use OPGW as overhead ground wire, which undertakes important tasks in power communication [7,8,9,10]. However, compared to overhead transmission lines, OPGW towers are higher, closer to thunderstorms, and more susceptible to lightning strikes [11,12,13]. And because the mechanical strength of OPGW is usually lower than that of wires, it is more susceptible to damage and more severe. In addition, due to long-term exposure to the natural environment and various complex factors, OPGW has a high probability of failure, posing a serious threat to the safe and stable operation of the power system. Therefore, rapid and accurate positioning and analysis of OPGW faults are of great significance for ensuring the safe and stable operation of the power system [14,15,16].
The traditional OPGW fault location method mainly relies on manual inspection and fixed-point detection. These methods are not only inefficient, but also difficult to achieve comprehensive coverage and cope with large-scale and complex OPGW networks [17,18,19]. With the rapid development of artificial intelligence technology, fault diagnosis methods based on data-driven and deep learning have gradually become a research hotspot. However, traditional data-driven methods typically require centralized storage and processing of all data on central servers, which not only brings data privacy and security issues, but also leads to low computational efficiency due to large data volumes and high dimensions [20,21,22,23]. However, models based on deep learning typically have a high number of parameters, resulting in a significant amount of computational resources and storage space required for model training and inference processes. In addition, it is sensitive to changes in the scale and dimension of input data, and is easily affected by noise and outliers, resulting in unreliable accuracy and stability of positioning results [24,25]. This article applies transformer and federated learning (FedL) to OPGW fault localization and analysis, solving the problems of large localization errors, low data privacy and security, as well as being greatly affected by noise and outliers, and improving the accuracy of OPGW fault localization. Compared with traditional methods, the innovations in the proposed method are as follows:
Based on the cloud edge collaborative environment, an OPGW fault localization framework was constructed, which reduces the burden on the central server and improves data processing efficiency by dispersing large-scale computing tasks to edge nodes.
By introducing FedL into the OPGW fault localization model, based on its distributed learning characteristics, efficient training and rapid updates of the model were achieved while ensuring data privacy and security.
By combining the improved transformer network with FedL, fast and accurate localization and analysis of OPGW faults in a cloud edge collaborative environment have been achieved.
The core content of this article is a fault localization and analysis method for OPGW based on transformer and FedL in a cloud edge collaborative environment. The main structure and related content of the article are as follows:
Section 2 provides an overview of current relevant research and achievements, analyzes the advantages and disadvantages of different methods, and based on this, investigates ideas that can better achieve OPGW fault localization.
Section 3 proposes an OPGW fault localization model based on the cloud edge collaboration framework, and provides a detailed introduction to the overall structure of the model, the functions of each module in the model, and the principle of effective cooperation among different modules.
Section 4 describes the experimental verification on the effectiveness of the proposed method, and compares it with other methods from multiple dimensions by setting multiple evaluation indicators.
Section 5 summarizes the proposed method, clarifies its advantages and disadvantages, and proposes the next research direction based on this.
2 Related work
Some scholars have conducted relevant research on OPGW fault localization and analysis methods, and these research results to some extent have promoted the development of this field Meng et al. [26]. Based on the Density Based Spatial Clustering of Applications with Noise (DBSCAN) algorithm and Brillouin Optical Time Domain Reflection (BOTDR/A) technique, a terminal connection method and corresponding fault location method are proposed for the positioning problem of OPGW faults. Taking conventional transmission lines as the research object, using “Phase Sensitive Optical Time Domain Reflectometer” Φ based on the basic theoretical basis of OTDR, Yunxin et al. [27] proposed a fault location method for transmission lines after lightning strikes, and verified the proposed method through simulation experiments. In response to the problem of difficulty in achieving accurate positioning during the operation of OPGW, based on distributed sensing technology, Li et al. [28] proposed a method that can accurately locate the fault tower position and fiber terminal box of OPGW based on the distributed Brillouin frequency shift (BFS) characteristics of optical fibers. Lu et al. [29], taking OPGW and cables as research objects, proposed a state monitoring method for OPGW and cables during operation by comprehensively utilizing technologies such as fiber optic sensing, radar tracking, and wireless positioning. This method can achieve fault diagnosis and lightning strike point localization. In response to the accurate positioning problem of fiber breakage faults in connecting towers and optical fibers used to carry OPGW, Xia et al. [30] proposed a fault location method for OPGW operation by utilizing the BFS characteristics at the down conductor and utilizing multiple fiber core BFS jumps. Based on the weak fiber Bragg grating array (WFBGA) as the basic theoretical basis, Feng et al. [31] proposed a lightning fault localization and identification method by monitoring the real-time temperature of OPGW and combining the relationship between lightning strikes and temperature. Li and Li [32] summarized the application of BOTDR technology in the field of online monitoring of OPGW status, analyzed the actual application situation and application effect in the field, and verified the feasibility of BOTDR technology in the operation conditions and environmental monitoring of OPGW lines through experiments. Xia et al. [33] proposed a method for automatic identification of BFS differences between adjacent intervals by reasonably designing the reliable range of BOTDR and BOTDA, combined with DBSCAN. By analyzing the distributed strain measurement results, accurate positioning of OPGW fault areas was achieved.
Compared to traditional OPGW fault localization and analysis methods, although the above methods can improve the accuracy and efficiency of fault localization to a certain extent, they usually require a large amount of computing resources, have limited ability to handle abnormal data, are easily affected by external factors, and have poor interpretability. This will to some extent lead to unreliable accuracy and stability of the localization results, and affect the trust and acceptability of fault location results.
3 Proposed OPGW fault location model
3.1 Cloud edge collaboration framework
Based on the cloud edge collaborative architecture, this article designs a model framework for OPGW fault localization as follows.
In Figure 1, at the edge, operational data of OPGW is collected through different sensors and fault feature extraction is performed. These data will be used for training local models at the edge, while transformers will be used to distribute input data to various data sources. Each data source conducts model training locally, updating only the parameters of the model, rather than the entire model. This can utilize the characteristics of transformer for efficient model training and updates.

A model framework for OPGW fault location. Source: Created by the authors.
In the cloud, the central server will receive the parameters of each trained edge model and form a joint model. Utilize the powerful computing power of cloud computing to perform big data analysis and processing on extracted features, thereby providing reliable data support for fault localization. Cloud computing can process large-scale data, improving the accuracy and reliability of fault localization. In addition, cloud computing can perform large-scale learning on training data to train more accurate fault localization models. By continuously optimizing the model, the accuracy and response speed of fault localization can be improved. The trained joint model can be distributed to the edge for use on the edge side. In this way, even if the cloud cannot respond in real time, fault location can also be carried out through edge computing to improve the real-time and reliability of the system.
The optimization of resources, data, and services can be achieved through cloud edge collaboration. In terms of resources, edge nodes can provide infrastructure resources such as computing, storage, and network, and collaborate with the cloud for scheduling and management. In terms of data, edge nodes are responsible for data collection and preprocessing, uploading results and related data to the cloud to form a complete data flow path. In terms of services, the cloud manages the lifecycle of edge side applications, including application deployment, start, stop, delete, and version update, while generating application orchestration strategies. The edge side executes applications according to cloud policies.
3.2 FedL
FedL is an emerging machine – learning algorithm framework. Initially, it was developed to address the issue of Android mobile terminal users updating language – production models at the edge. Its design objective is to safeguard privacy and data security during big – data exchanges, all while adhering to legal and compliance requirements. Consequently, it is structured in a way that obviates the need for direct data exchange or collection. By doing so, it not only protects user privacy but also resolves the data – silo dilemma that the artificial – intelligence industry encounters.
FedL aims to establish a federated model leveraging distributed devices. In the FedL framework, there should be at least two client – side entities. These clients collaborate with a central server to train a global model, and the training process mandates that the original data remains at the edge. The working principle of FedL is as follows:
As depicted in Figure 2, the shared global model is trained by a consortium of participating devices hosted by a central server. This approach enables edge nodes to collaboratively train models at the edge without sharing the original training data. The central server aggregates these parameter updates and generates a new iteration of the training model. This process is repeated until the global model converges.

Operational principle of FedL. Source: Created by the authors.
The effective combination of cloud edge collaboration theory and FedL greatly improves the performance of OPGW fault localization. First, the theory of cloud edge collaboration provides practical application scenarios and frameworks for FedL. In OPGW fault location, cloud edge collaboration tightly connects the cloud and edge ends, achieving remote control, processing, analysis, and intelligent decision-making of data. The cloud is responsible for global model training and optimization, while the edge is responsible for local data collection and processing, as well as collaborative work with the cloud. This architecture enables FedL to train and optimize models in a distributed environment, fully utilizing computing resources in the cloud and edge. Second, FedL provides the ability to protect data privacy for cloud edge collaboration. In OPGW fault location, data privacy and security are very important. Through FedL, various participants can jointly train a global model without exchanging raw data. This can not only avoid data leakage and abuse, but also improve the efficiency and accuracy of model training. Meanwhile, FedL can also address issues of uneven data distribution and inconsistent labels, making the model more robust and reliable. Finally, the combination of cloud edge collaboration and FedL can also improve the accuracy and real-time performance of OPGW fault localization. Through collaborative work between the cloud and edge, real-time fault data can be collected and processed, and the model can be updated and optimized online through FedL. This can make the model more adaptable to changes in the actual environment, improve the accuracy and real-time performance of fault localization. Meanwhile, cloud edge collaboration can also achieve functions such as fault warning and prediction, further improving the reliability and stability of the system.
The FedL system consists of one server and K users. Let
where
where
where

The training process of FedL system. Source: Created by the authors.
The application of FedL in OPGW fault location has the following benefits:
The data for OPGW fault location may contain sensitive information, such as geographic location, equipment status, etc. FedL allows various data sources to conduct model training locally without uploading data to a central server, thus protecting data privacy and security.
Through FedL, distributed model training can be conducted using computing resources distributed across different regions, improving the speed and efficiency of data processing. Meanwhile, each data source can independently process local data, reducing data transmission latency and costs.
The global model built by FedL based on a wider dataset helps to improve the model’s generalization ability, enabling it to more accurately adapt to the OPGW fault location requirements under different geographical locations and environmental conditions.
FedL can support real-time model updates, meaning that when new fault data appear, various data sources can update the model locally and upload the updated model parameters to the central server for aggregation. This helps to maintain the real-time and dynamic nature of the model to adapt to constantly changing fault situations.
3.3 Feature fusion based on transformer
In many traditional methods, the process of fusing fault features extracted from the edge is too simple and crude, which cannot effectively capture the mapping relationship between multi-dimensional features.
In OPGW fault localization, the transformer model may learn and understand signal patterns in OPGW optical cables through its powerful feature extraction and pattern recognition capabilities. When a fault occurs, the model can recognize abnormal signals that are different from normal patterns, thereby achieving precise localization of the fault point. In the proposed cloud edge collaboration framework, the model’s role is as follows:
The transformer model, with its self-attention mechanism as its core, can effectively extract key features from fault signals. Under the cloud edge collaborative framework, these features can be extracted and analyzed through collaborative processing between the cloud and edge, which helps to more accurately identify fault modes in OPGW optical cables.
The cloud edge collaboration framework allows for the sharing of data and processing results between the cloud and edge. The transformer model can achieve the fusion of cloud and edge data by learning data features from different sources, enabling the system to respond to fault events more quickly.
In a cloud edge collaborative environment, the transformer model can be trained and optimized in a distributed manner through FedL and other methods. This means that the model can collect data on different edge nodes and conduct local training, and then summarize the training results to the cloud for global updates. This approach not only protects the privacy of data, but also improves the model’s generalization ability and adaptability.
Therefore, the transformer encoder is used to fuse features from different dimensions, and its structure is shown in Figure 4.

Multidimensional feature fusion based on transformer. Source: Created by the authors.
In Figure 4, local and global features are first extracted from the fault data information, and then the multi head self-attention mechanism is used to automatically ignore the noise present in the encoded information, thereby improving the model’s ability to capture important fault features.
By utilizing the multi head self-attention mechanism to fuse the multi-dimensional fault feature information matrix, the isolated row vectors in the matrix can transmit information to each other, establish connections, and adaptively focus on key features on this basis, improving the model’s understanding ability of OPGW fault features.
First, concatenate the fault features obtained from various dimensions together to synthesize the fault feature vector Z:
where
In the process of feature fusion, the obtained fault features from various dimensions are first concatenated together, and then the multi-dimensional features are passed into the transformer encoder to obtain its output result. This process can be represented as follows:
where
Due to the self-attention calculation of each token in multidimensional embedding with other tokens, it can simultaneously capture the internal effects of single dimensional features and the mapping relationships between multi-dimensional features, dynamically adjust the weights of multi-dimensional features, and allocate attention weights more reasonably. Due to the advantages of noise suppression, information redundancy reduction, model computation, and overfitting prevention in pooling operations, we choose to use combination pooling to obtain richer feature layers, choose maximum pooling to capture local features at each time step, and choose average pooling to make the model focus more on global features. Then, combine the results of max pooling and average pooling as the output of the attention module. The calculation process is as follows:
The fused feature vectors cannot be directly used for OPGW fault localization. Therefore, a simple attention layer is used to obtain the final feature representation for classification, as shown below:
where
Applying transformer to OPGW fault location may bring some potential benefits:
OPGW fault location may require processing a series of time series data, and through self-attention mechanism, transformer can capture long-term dependencies in the data, which is very useful for analyzing the historical trends and patterns of fiber optic cable faults.
In OPGW fault location, multiple data from different sensors and systems may be used. transformers can integrate data from different sources into a unified representation space through their powerful feature extraction and representation learning capabilities, thereby gaining a more comprehensive understanding and analysis of fault situations.
Through transformer’s deep learning and analysis of fault data, the model may be able to discover some subtle fault features or patterns that are difficult to capture by traditional methods. This helps to improve the accuracy and precision of fault localization, thus enabling faster localization and repair of faults.
The transformer model can process data streams from sensors in real-time and update the model as new data arrive. This means being able to respond in real-time to fiber optic cable failures and take necessary measures in a timely manner.
3.4 Fault localization process
The fault localization process of OPGW based on transformer and FedL in the proposed cloud edge collaborative environment is shown in Figure 5.

Fault localization process of OPGW. Source: Created by the authors.
4 Experimental analysis
4.1 Dataset and evaluation indicators
To improve the evaluation accuracy of the model, a large amount of data training samples are needed as support. The data collected from OPGW online monitoring devices deployed in Zhejiang, Hebei, Shanxi, and Yunnan provinces of China are used as the experimental simulation and analysis dataset. Due to the significant geographical differences among the four OPGW, their data are representative. These four datasets contain 850,008,000,085,000 and 90,000 monitoring data of OPGW operating status characterization under on-site time series, and each dataset is divided into three datasets. First, the data of each dataset is fused to obtain data fusion labels. Then, the monitoring data and data fusion labels are divided into training, testing, and testing sets in a 6:2:2 ratio. The detailed information of the dataset is shown in Table 1.
Detailed information of the dataset
| Training set | Test set | Verification set | |
|---|---|---|---|
| Dataset 1 | 51,000 | 17,000 | 17,000 |
| Dataset 2 | 48,000 | 16,000 | 16,000 |
| Dataset 3 | 51,000 | 17,000 | 17,000 |
| Dataset 4 | 54,000 | 18,000 | 18,000 |
In the dataset used for health assessment, different feature quantities have different dimensions. For example, the temperature and environmental temperature and humidity of OPGW vary greatly in order of magnitude. Direct calculation increases complexity and also leads to a decrease in the accuracy of the assessment results. Normalization is used here to preprocess the data.
where
The experiment uses the absolute error, relative error, and fault location time of OPGW fault location to determine the effectiveness of the proposed model.
The hardware environment of the experiment is given in Table 2.
Hardware environment
| Hardware | |
|---|---|
| CPU | AMD EPYC |
| Memory | 64GB DDR4 ECC |
| Capacity | SSD |
| GPU | NVIDIA RTX |
The parameters of the experiment are shown in Table 3.
Experimental parameters
| Parameter | Value |
|---|---|
| Learning rate | 0.001 |
| Number of transformer layers | 4 |
| Number of attention heads | 8 |
| Embedding dimension | 256 |
4.2 Comparative analysis
4.2.1 Experimental analysis
The following is a comparison between the proposed OPGW fault localization model based on transformer and FedL in the cloud edge collaborative environment and various other models under the same experimental conditions, including DBSCAN [26], BFS [28], multisource breadth-first search (M-BFS) [30], and WFBGA [31]. Comparative analysis is done using four different datasets.
The relative error of using different models for fault localization on different datasets is shown in Figure 6 and Table 4.

Comparison of relative errors in fault localization of different models. Source: Created by the authors.
Comparison of relative errors in fault localization of different models
| Model | Dataset 1 (%) | Dataset 2 (%) | Dataset 3 (%) | Dataset 4 (%) |
|---|---|---|---|---|
| Proposed model | 0.85 | 0.78 | 0.82 | 0.93 |
| DBSCAN | 1.79 | 1.65 | 1.74 | 1.96 |
| BFS | 2.86 | 2.62 | 2.76 | 3.12 |
| M-BFS | 2.16 | 1.98 | 2.09 | 2.35 |
| WFBGA | 1.39 | 1.28 | 1.35 | 1.52 |
The absolute results of using different models for fault localization on different datasets are given in Figure 7 and Tables 5 and 6.

Comparison of fault localization results of different models. Source: Created by the authors.
Comparison of fault localization results of different models
| Fault distance (km) | Dataset 1 | Dataset 2 | Dataset 3 | Dataset 4 |
|---|---|---|---|---|
| Actual | 3.800 | 3.800 | 3.800 | 3.800 |
| Proposed model | 3.7676 | 3.7703 | 3.7687 | 3.7646 |
| DBSCAN | 3.7318 | 3.7375 | 3.7341 | 3.7256 |
| BFS | 3.9085 | 3.8995 | 3.9050 | 3.9185 |
| M-BFS | 3.7180 | 3.7248 | 3.7207 | 3.7105 |
| WFBGA | 3.8529 | 3.8485 | 3.8511 | 3.8577 |
Comparison of absolute errors in fault localization of different models
| Absolute error (km) | Dataset 1 | Dataset 2 | Dataset 3 | Dataset 4 |
|---|---|---|---|---|
| Proposed model | 0.0324 | 0.0297 | 0.0313 | 0.0354 |
| DBSCAN | 0.0682 | 0.0625 | 0.0659 | 0.0744 |
| BFS | 0.1085 | 0.0995 | 0.1050 | 0.1185 |
| M-BFS | 0.0820 | 0.0752 | 0.0793 | 0.0895 |
| WFBGA | 0.0529 | 0.0485 | 0.0511 | 0.0577 |
The time required for fault localization using different models on different datasets is shown in Figure 8 and Table 7.
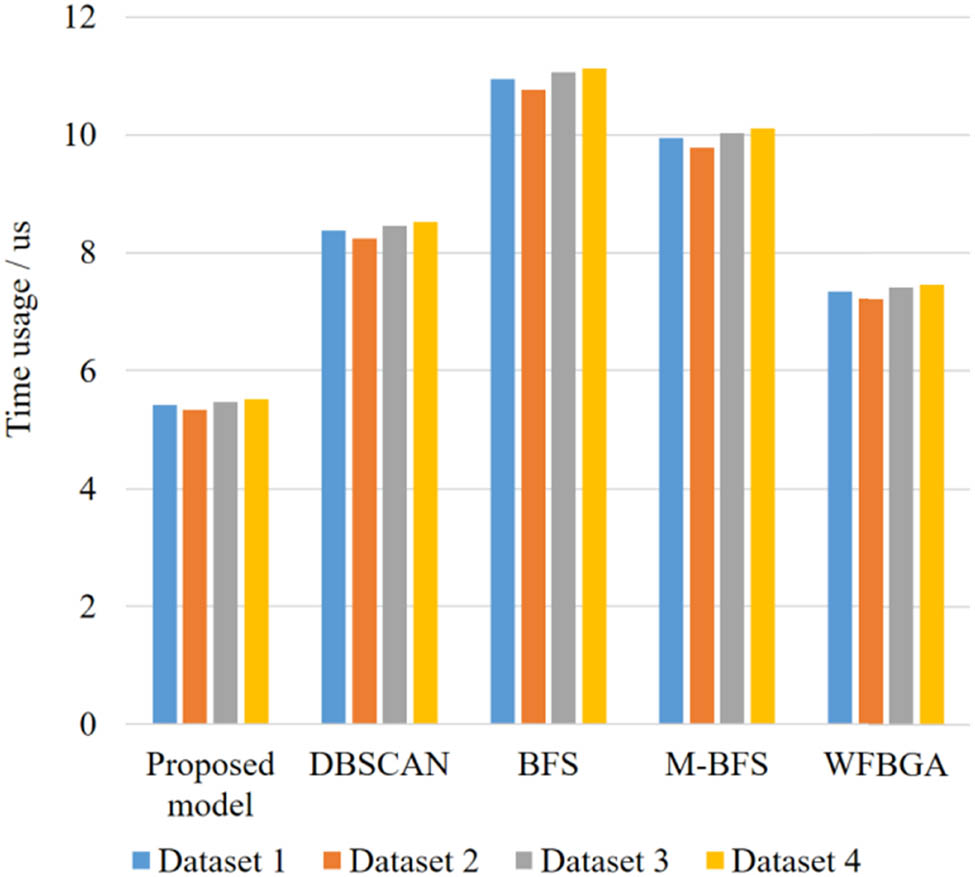
Comparison of time used for fault localization of different models. Source: Created by the authors.
Comparison of time used for fault localization of different models
| Time usage (µs) | Dataset 1 | Dataset 2 | Dataset 3 | Dataset 4 |
|---|---|---|---|---|
| Proposed model | 5.42 | 5.33 | 5.47 | 5.51 |
| DBSCAN | 8.38 | 8.25 | 8.46 | 8.52 |
| BFS | 10.95 | 10.77 | 11.05 | 11.14 |
| M-BFS | 9.95 | 9.78 | 10.04 | 10.11 |
| WFBGA | 7.34 | 7.22 | 7.41 | 7.47 |
4.2.2 Discussion
This study presents the OPGW fault localization results of five models, including the proposed model, under the same experimental conditions using four different OPGW operating datasets. It can be seen that the relative error, absolute error, and fault location time of the proposed model’s OPGW fault location are the smallest. On the four datasets, their relative errors were as low as 0.85, 0.78, 0.82, and 0.93%, respectively. In the case of an actual fault distance of 3.8 km, the fault localization results are 3.7676, 3.7703, 3.7687, and 3.7646 km, with absolute errors as low as 0.0324, 0.0297, 0.0313, and 0.0354 km, respectively. The fault location took 5.42, 5.33, 5.47, and 5.51 µs, respectively. This is due to the use of cloud edge collaboration framework and FedL technology in the model. Training local models at the edge can provide redundancy and fault tolerance, improving the reliability and stability of the fault localization system. The introduction of FedL in the model can perform fault localization without leaking raw data. By integrating data from different sources into a unified model for learning, it helps to improve the model’s generalization ability and better coping capacity with fault localization problems in various practical scenarios. In addition, the transformer network introduced in the model can maintain efficient performance in processing large-scale fault data, effectively capturing global information in the fault signal, thereby more accurately locating the fault location.
4.3 Hyperparameter analysis
4.3.1 Learning rate analysis
The change in learning rate is a key factor affecting the faster convergence of model accuracy to maximum accuracy. Next we will analyze the impact of learning rate on model performance. The experiment set the learning rates to 0.01, 0.001, 0.0001, and 0.00001, respectively. The model was trained using dataset 1 and the test results were recorded.
Figure 9 shows the experimental content recorded from two aspects: updating the number of rounds during the model training process and the relative error of fault localization. It can be seen that when the learning rate is set to 0.001, the relative error of fault localization can reach the minimum with the increase in epoch, so setting the learning rate to 0.001 is the optimal value.

Relative error of fault localization obtained under different learning rates. Source: Created by the authors.
4.3.2 Transformer layer analysis
The encoder and decoder in transformer are both stacked with multiple layers. The number of layers determines the depth of the model. Increasing the number of layers can improve the representation ability of the model, but it also increases the number of parameters and computational complexity of the model. Therefore, different levels of transformer will have a significant impact on the fault localization results. The experimental results under different transformer layers are given in Figure 10.

The influence of different transformer layers on fault location results. Source: Created by the authors.
In Figure 10, the performance of the model varies when the number of layers in the transformer encoder is set to different values. When its value is 4, the model exhibits the best performance.
5 Conclusion
A method for OPGW fault localization and analysis based on transformer and FedL in a cloud edge collaborative environment is proposed to address the problem of low localization accuracy and susceptibility to noise and outliers in traditional OPGW fault localization methods with large amounts of data and high dimensions. The experimental verification results show that constructing an OPGW fault location model based on cloud edge collaborative architecture can reduce a large amount of data transmission process, effectively reducing network load and bandwidth costs. FedL can effectively handle abnormal imbalanced data by merging model parameters from multiple data sources to improve the performance and accuracy of fault localization. The transformer network can greatly improve the processing efficiency of fault data through parallel computing, and can greatly improve the accuracy and credibility of fault localization by understanding the focus and decision-making basis of the model in processing fault data.
The advantage of the proposed method lies in the fact that the OPGW fault localization framework based on cloud edge collaborative environment can improve data processing efficiency by dispersing large-scale computing tasks to edge nodes, and achieve efficient training and rapid updates of the model on the basis of distributed learning characteristics, thereby achieving fast and accurate OPGW fault localization in cloud edge collaborative environment. But it also has certain drawbacks, such as relatively weak analysis and processing of operational data. The next step of work will focus on researching more advanced signal processing and data analysis techniques, and improving the accuracy of fault location by conducting more in-depth analysis and processing of OPGW transmission signals. And consider applying the fault location method of OPGW to more fields and scenarios to improve the reliability and stability of the entire power communication system.
Acknowledgement
The authors would like to thank the editor and anonymous reviewers for their contributions toward improving the quality of this article.
-
Funding information: This research was supported by the Inner Mongolia Power (Group) Co., Ltd (No. nmgdlkjxm20240408).
-
Author contributions: Zhigang Yan: methodology, writing – original draft, and writing – review and editing; Min Cui: conceptualization, writing – original draft, and writing – review and editing; Xinyue Su: validation; Jinrui Wang: formal analysis; Xiao Ma: investigation; and Lijun Wu: data curation.
-
Conflict of interest: The authors declare that there is no conflict of interest regarding the publication of this article.
-
Data availability statement: The data used to support the findings of this study are included within the article.
References
[1] Zeng Y, Kang Z, Shi Z. Secure data processing technology of distribution network OPGW line with edge computing. EAI Endorsed Trans Scalable Inf Syst. 2023;12(5):88–98. 10.4108/eetsis.v10i3.2837.Suche in Google Scholar
[2] Liu X, Zhang Z, Du B. Two-way data processing technology for OPGW line of distribution power communication networks. EAI Endorsed Trans Scalable Inf Syst. 2022;10(2):328–39. 10.4108/eetsis.v10i1.2575.Suche in Google Scholar
[3] Li B, Huang M, Zhang H, Lin M, He S, Chen L. Research on communication technology of OPGW line in distribution network under interference environment. EAI Endorsed Trans Scalable Inf Syst. 2023;10(3):57–68. 10.4108/eetsis.v10i3.2780.Suche in Google Scholar
[4] Hu K, Tong F, Lian W, Li W. Model and experimental verification of SOP transient in OPGW based on direct strike lightning. Opt Express. 2023;31(23):39102–20. 10.1364/oe.502978.Suche in Google Scholar PubMed
[5] Han Y, Wang X, Leung VC, Niyato DT, Yan X, Chen X. Convergence of edge computing and deep learning: A comprehensive survey. IEEE Commun Surv Tutor. 2023;22(2):869–904. 10.1109/COMST.2020.2970550.Suche in Google Scholar
[6] An Y, Zhang Z. A noval optical time domain reflectometer and fiber bragg grating optical cable line interruption monitoring and transformer temperature warning system. 2021 the 4th International Conference on Energy, Electrical and Power Engineering, China; 2021. p. 284–8. 10.1109/CEEPE51765.2021.9475687.Suche in Google Scholar
[7] Carvalho RV, Bonfim M, Ussuaa DA, Toledo LF, Martin RS, Filho VS. Distributed temperature sensing in OPGW with multiple optical fibers. IET Sci Meas Technol. 2022;13(8):1219–23. 10.1049/iet-smt.2018.5319.Suche in Google Scholar
[8] Lu L, Sun X, Bu X, Li B. Study on passive, wide area and multi⁃state parameter monitoring and diagnosis for power transmission lines. 2020 International Conference on Power System Technology (POWERCON). New York; 2020. p. 3903–7. 10.1109/POWERCON.2018.8601868.Suche in Google Scholar
[9] Liu L, Ouyang W, Wang X, Fieguth PW, Chen J, Liu X, et al. Deep learning for generic object detection: A survey. Int J Computer Vis. 2020;128(2):261–318. 10.1007/s11263-019-01247-4.Suche in Google Scholar
[10] Xia M, Tang XH, Wang Y, Zhang SH, Jiang H, Dong YK. Comparative analysis of strain monitoring of the installed optical fiber composite overhead ground wire using BOTDA/R. Acta Optica Sin. 2020;40(15):36–42. 10.3788/AOS202040.1506001.Suche in Google Scholar
[11] Oliveira RV, Schroeder MA, Moura RA, Lima AC, Silveira EG. Influence on short-circuit of substation grounding grids by the use of OPGW cables. IEEE Lat Am Trans. 2021;19(3):466–73. 10.1109/TLA.2021.9447696.Suche in Google Scholar
[12] Ali S, Taweekun J, Techato K, Waewsak J, Gyawali S. GIS based site suitability assessment for wind and solar farms in Songkhla, Thailand. Renew Energy. 2021;3(5):132–43. 10.1016/j.renene.2018.09.035.Suche in Google Scholar
[13] Caletka M, Michalková MS, Koli M, Trizna M. Quality of flood extents delineated by a non-hydrodynamic GIS tool. Catena. 2022;8(2):175–86. 10.1016/j.catena.2018.12.032.Suche in Google Scholar
[14] Cheng C, Xu D, Wang X. Least square smoothing algorithm and gauss decomposition spectral analysis method in spectral gamma ray logging. 2022 Symposium on Piezoelectricity, Acoustic Waves, and Device Applications (SPAWDA). Chengdu, China; 2022. p. 458–62. 09/SPAWDA.2017.8340380.Suche in Google Scholar
[15] Seraji FE, Emami A, Chaghazardi E. To optimize fiber lay length in OPGW cables used in power transmission networks. Opt Quantum Electron. 2022;54(5):251–60. 10.1007/s11082-022-03664-1.Suche in Google Scholar
[16] Zhu YC, Shu X, Tian Y, Xie S, Zhang Y, Liu Y. Research on the improvement method of OPGW ground uneven icing calculation model under micro-terrain. Electr Power. 2022;56(3):55–63. 10.11930/j.issn.1004-9649.202210098.Suche in Google Scholar
[17] Ding Z, Zhang X, Zou N, Xiong F, Song J, Fang X, et al. Phi⁃OTDR based on⁃line monitoring of overhead power transmission line. J Lightwave Technol. 2021;39(15):5163–9. 10.1109/JLT.2021.3078747.Suche in Google Scholar
[18] He X, Tu Z, Xu X, Wang Z. Programming framework and infrastructure for self-adaptation and optimized evolution method for microservice systems in cloud-edge environments. Future Gener Computer Syst. 2021;118(4):263–81. 10.1016/j.future.2021.01.008.Suche in Google Scholar
[19] Zhou Z, Wang H, Wang Y, Chen L, Bao X. Distributed acoustic wave sensing in a Brillouin random fiber laser. 2021 Optical Fiber Communications Conference and Exhibition (OFC). NewYork; 2021. p. 1–3. https://ieeexplore.ieee.org/abstract/document/9489446.10.1364/OFC.2021.W7C.6Suche in Google Scholar
[20] Kwon G, Lee YH, Bang SS, Ji GH, Lee GS, Tamus ZÁ, et al. Assessment of cable aging for nuclear power plants I&C cable via time-frequency domain reflectometry. 2020 IEEE 3rd International Conference on Dielectrics (ICD); 2020. p. 75–80. 10.1109/ICD46958.2020.9341985.Suche in Google Scholar
[21] Ji Y, Shao J, Li S, Zhou Q. Study on distributed OPGW lightning strike location monitoring system based on BOTDR. Meeting Asia Communications and Photonics Conference (ACP)/International Conference on Information Photonics and Optical Communications (IPOC). Shenzhen, Peoples R China; So Univ Sci & Technol; 2022. p. 1978–80. 10.1109/ACP55869.2022.10088908.Suche in Google Scholar
[22] Liu X, Shi Z, Zeng Y, Zhang Z, Luo Y. Influence of structural characteristics for optical fiber composite overhead ground wire on current density distribution under lightning strikes. Meeting 12th International Conference on Power and Energy Systems (ICPES). Guangzhou, Peoples R China: 2022. p. 111–5. 10.1109/ICPES56491.2022.10072493.Suche in Google Scholar
[23] Minto C, Rochat E. Towards 1 billion sensors: distributed fiber sensing as a pervasive IOT Contributor. 2019 Optical Fiber Communications Conference and Exhibition (OFC). NewYork; 2019. p. 15–20. 10.1364/OFC.2019.Tu3D.1.Suche in Google Scholar
[24] Xie B. Gamma spectrum diagnosing method based on improved wavelet threshold. Nucl Eng Technol. 2020;52(8):1771–6. 10.1016/j.net.2020.01.025.Suche in Google Scholar
[25] Zheng J, Du J, Liang Y, Wang C, Liao Q, Zhang H. Deep pipe: theory-guided LSTM method for monitoring pressure after multi product pipeline shutdown. Process Saf Environ Prot. 2021;155:518–31. 10.1016/j.psep.2021.09.046.Suche in Google Scholar
[26] Meng X, Tang X, Wang Y, Li C, Jiang T, Guan P, et al. Fault warning and analysis of power OPGW optical cables based on BOTDR/A. 2021 International Conference on Optical Instruments and Technology: Optical Sensors and Applications, Virtual, Online. China: 2022. p. 124–8. 10.1117/12.2616504.Suche in Google Scholar
[27] Yunxin Z, Kai Y, Baichuan X, Yuhao H, Chaoyueling L, Li L. An OPGW lightning strike locating method based on Φ OTDR technology. 4th International Conference on Information Science, Electrical, and Automation Engineering, ISEAE 2022. Hangzhou, China; 2022. p. 25–9. 10.1117/12.2640181.Suche in Google Scholar
[28] Li C, Wang Y, Ning Y, Zhang S. Accurate and fast fault location method for power OPGW. J Beijing Univ Posts Telecommun. 2022;45(3):32–7. 10.13190/j.jbupt.2021-238.Suche in Google Scholar
[29] Lu L, Bu X, Wang Q. An optical fiber composite power cable panoramic state monitoring system for typical scene application. 2021 International Conference on Power System Technology (POWERCON). Haikou, China; 2021. p. 42–7. 10.1109/POWERCON53785.2021.9697772.Suche in Google Scholar
[30] Xia M, Tang X, Wang Y, Zhang S, Jiang H, Zhang Q, et al. Connection tower and fiber breakpoint location method for OPGW based on brillouin frequency shift characteristics. Acta Optica Sin. 2022;41(19):28–39. 10.3788/AOS202141.1906003.Suche in Google Scholar
[31] Feng XB, Hou J, Yu Q, Li X, Wu J, Liu L, et al. Research on optical fiber composite overhead wire (OPGW) lightning monitoring technology based on weak fiber Bragg grating array. J Nanoelectron Optoelectron. 2022;17(1):170–6. 10.1166/jno.2022.3182.Suche in Google Scholar
[32] Li J, Li Y. Application of environmental disaster monitoring of OPGW corridor based on BOTDR technology. Sci Technol Rev. 2022;40(15):104–12. 10.3981/j.issn.1000-7857.2022.15.010.Suche in Google Scholar
[33] Xia M, Tang X, Wang Y, Li C, Wei Y, Zhang J, et al. OPGW positioning and early warning method based on a Brillouin distributed optical fiber sensor and machine learning. Appl Opt. 2023;62(6):1557–66. 10.1364/ao.479772.Suche in Google Scholar
© 2025 the author(s), published by De Gruyter
This work is licensed under the Creative Commons Attribution 4.0 International License.
Artikel in diesem Heft
- Research Articles
- Synergistic effect of artificial intelligence and new real-time disassembly sensors: Overcoming limitations and expanding application scope
- Greenhouse environmental monitoring and control system based on improved fuzzy PID and neural network algorithms
- Explainable deep learning approach for recognizing “Egyptian Cobra” bite in real-time
- Optimization of cyber security through the implementation of AI technologies
- Deep multi-view feature fusion with data augmentation for improved diabetic retinopathy classification
- A new metaheuristic algorithm for solving multi-objective single-machine scheduling problems
- Estimating glycemic index in a specific dataset: The case of Moroccan cuisine
- Hybrid modeling of structure extension and instance weighting for naive Bayes
- Application of adaptive artificial bee colony algorithm in environmental and economic dispatching management
- Stock price prediction based on dual important indicators using ARIMAX: A case study in Vietnam
- Emotion recognition and interaction of smart education environment screen based on deep learning networks
- Supply chain performance evaluation model for integrated circuit industry based on fuzzy analytic hierarchy process and fuzzy neural network
- Application and optimization of machine learning algorithms for optical character recognition in complex scenarios
- Comorbidity diagnosis using machine learning: Fuzzy decision-making approach
- A fast and fully automated system for segmenting retinal blood vessels in fundus images
- Application of computer wireless network database technology in information management
- A new model for maintenance prediction using altruistic dragonfly algorithm and support vector machine
- A stacking ensemble classification model for determining the state of nitrogen-filled car tires
- Research on image random matrix modeling and stylized rendering algorithm for painting color learning
- Predictive models for overall health of hydroelectric equipment based on multi-measurement point output
- Architectural design visual information mining system based on image processing technology
- Measurement and deformation monitoring system for underground engineering robots based on Internet of Things architecture
- Face recognition method based on convolutional neural network and distributed computing
- OPGW fault localization method based on transformer and federated learning
- Class-consistent technology-based outlier detection for incomplete real-valued data based on rough set theory and granular computing
- Detection of single and dual pulmonary diseases using an optimized vision transformer
- CNN-EWC: A continuous deep learning approach for lung cancer classification
- Cloud computing virtualization technology based on bandwidth resource-aware migration algorithm
- Hyperparameters optimization of evolving spiking neural network using artificial bee colony for unsupervised anomaly detection
- Classification of histopathological images for oral cancer in early stages using a deep learning approach
- A refined methodological approach: Long-term stock market forecasting with XGBoost
- Enhancing highway security and wildlife safety: Mitigating wildlife–vehicle collisions with deep learning and drone technology
- An adaptive genetic algorithm with double populations for solving traveling salesman problems
- EEG channels selection for stroke patients rehabilitation using equilibrium optimizer
- Influence of intelligent manufacturing on innovation efficiency based on machine learning: A mechanism analysis of government subsidies and intellectual capital
- An intelligent enterprise system with processing and verification of business documents using big data and AI
- Hybrid deep learning for bankruptcy prediction: An optimized LSTM model with harmony search algorithm
- Construction of classroom teaching evaluation model based on machine learning facilitated facial expression recognition
- Artificial intelligence for enhanced quality assurance through advanced strategies and implementation in the software industry
- An anomaly analysis method for measurement data based on similarity metric and improved deep reinforcement learning under the power Internet of Things architecture
- Optimizing papaya disease classification: A hybrid approach using deep features and PCA-enhanced machine learning
- Handwritten digit recognition: Comparative analysis of ML, CNN, vision transformer, and hybrid models on the MNIST dataset
- Multimodal data analysis for post-decortication therapy optimization using IoMT and reinforcement learning
- Predicting early mortality for patients in intensive care units using machine learning and FDOSM
- Uncertainty measurement for a three heterogeneous information system based on k-nearest neighborhood: Application to unsupervised attribute reduction
- Genetic algorithm-based dimensionality reduction method for classification of hyperspectral images
- Power line fault detection based on waveform comparison offline location technology
- Assessing model performance in Alzheimer's disease classification: The impact of data imbalance on fine-tuned vision transformers and CNN architectures
- Hybrid white shark optimizer with differential evolution for training multi-layer perceptron neural network
- Review Articles
- A comprehensive review of deep learning and machine learning techniques for early-stage skin cancer detection: Challenges and research gaps
- An experimental study of U-net variants on liver segmentation from CT scans
- Strategies for protection against adversarial attacks in AI models: An in-depth review
- Resource allocation strategies and task scheduling algorithms for cloud computing: A systematic literature review
- Latency optimization approaches for healthcare Internet of Things and fog computing: A comprehensive review
- Explainable clustering: Methods, challenges, and future opportunities