Synergistic effect of artificial intelligence and new real-time disassembly sensors: Overcoming limitations and expanding application scope
-
Li Bozhou
 ,
Ju Dajiang
,
Ju Dajiang

Abstract
With the acceleration of industrialization and the increase in the complexity of equipment, it is particularly important to accurately predict and effectively maintain equipment failures. In response to the problem of difficulty in accurately achieving predictive maintenance and the severely limited application range of new real-time disassembly sensors, this article conducts research on the synergistic effect of the new real-time disassembly sensors and artificial intelligence technology. First, relevant parameter data of a certain enterprise’s generator can be collected on-site, and the Pearson correlation coefficient method can be used to calculate the correlation between the generator data parameters and the target fault type, ensuring the degree of correlation in extracting data features. Then, based on the gated recurrent unit (GRU) model, the article applied the particle swarm optimization (PSO) algorithm to optimize the parameters of the GRU network and used the support vector machine (SVM) model to optimize the classification function of the network output. Finally, the optimized GRU model can be applied to predict the fault types of generators, and based on this, it can be applied to the energy industry, agriculture, medical and health, and transportation industries to verify the application scalability of artificial intelligence and new real-time disassembly sensors. The experimental results show that the optimized GRU model combined with the new real-time disassembly sensor achieved an average accuracy of 0.94 in generator fault prediction, with a cost loss rate of only 3.03%, a decrease of 5.91% compared to the single new real-time disassembly sensor. The combination of artificial intelligence technology for precise predictive maintenance of generators greatly reduces maintenance costs and overcomes the limitations of individual real-time sensor disassembly. This has to some extent expanded the application scope and promoted the intelligent development of various industries.
1 Introduction
As industrial technology keeps advancing, the real-time disassembly of sensors plays an important and increasing role in the maintenance of equipment. Such sensors monitor the operational status of equipment and provide real-time data to support follow-up fault prediction and maintenance. The challenges faced by traditional sensors are becoming more pronounced as the sophistication and size of industrial equipment grows. Existing solutions provide inaccurate and untimely data, which results in low failure prediction accuracy and low maintenance efficiency. In addition, the existing new real-time removal sensors are subject to technical constraints that make it difficult to accurately realize predictive maintenance, and their applications are also somewhat limited. Therefore, combining artificial intelligence with new real-time demolition sensors for prediction and exploring their synergies has become the main focus of current research. It helps to raise the operational efficiency of industrial devices, reduce maintenance costs, and contribute to the intelligent development of the industries.
In recent years, with the continuous advancement of national intelligence projects and the rapid development of Industry 4.0, smart sensor technology has become a hot area of concern in academia and industry. Many scholars are committed to the research of new real-time disassembly sensors, trying to improve the performance and application scope of sensors. Through in-depth research on these sensors, many important results have been achieved, showing broad application prospects and technical advantages. To reduce installation complexity, Rana and Mittal [1], Slade et al. [2], and Prasanth et al. [3] applied a wearable sensor for real-time motion analysis [1,2,3]. Qin et al. used a magnetic array-assisted sliding friction electric sensor to sense pulse signals in real time, ensuring the timeliness of data acquisition [4]. Jeong and Park developed a hybrid sensor that combines pressure and distance for real-time pose classification, improving the accuracy of pose classification [5]. Su et al. used highly sensitive temperature sensors for human temperature monitoring, improving monitoring performance and avoiding interference from the surrounding environment [6]. Chopade et al. [7] and Tao et al. [8] adopted an intelligent medical sensor for monitoring patient abnormal features, providing relatively accurate real-time data. The above researchers researched new real-time disassembly sensors, ensuring the real-time accuracy of data provided, effectively solving the problems of complex installation and slow response of traditional sensors, and promoting the advancement of sensor technology. However, they failed to combine artificial intelligence technology, making it difficult to achieve predictive maintenance. This not only limits the intelligent application of sensors but also affects their potential in reducing maintenance costs and improving equipment operating efficiency.
With the rapid development of artificial intelligence technology, many scholars have begun to combine artificial intelligence technology and real-time sensor disassembly to study predictive performance, attempting to overcome its limitations. Pech et al. [9], Chen et al. [10], and Keleko et al. [11] summarized predictive maintenance and intelligent sensors in smart factories, providing a reference for future research. Yu et al. designed a self-powered sensor for stretchable and skin-fitting intelligent sensing and posture recognition, achieving predictive body safety detection [12]. To reduce costs and improve maintenance efficiency, Hoffmann et al. combined new sensors and machine learning for predictive maintenance of power grids [13]. Wahid et al. [14], Cınar et al. [15], and Huang et al. [16] improved the accuracy of machine fault prediction by using a hybrid sensor and convolutional neural network-long short-term memory (CNN-LSTM) model. The research of the above-mentioned scholars has made significant progress in improving prediction performance, especially in combining artificial intelligence technology to improve sensor data processing capabilities and prediction accuracy, which has shown good application effects. However, the above-mentioned scholars have combined artificial intelligence with new real-time sensors. The role is mostly played in industry, and there is a lack of comprehensive discussion in multiple fields and scenarios. Moreover, the research is not in-depth enough and cannot be discussed from multiple application levels.
The article’s contribution:
To solve the problem of difficulty in accurately achieving predictive maintenance and the severely limited application range of the new real-time disassembly sensor, the synergistic effect of the two was experimentally verified by combining artificial intelligence technology.
This article focuses on generator data in the manufacturing industry, fully considering the limitations of new real-time disassembly sensors. The gated recurrent unit (GRU) model optimized by particle swarm optimization (PSO) and support vector machine (SVM) is used for training to ensure the accuracy of generator fault prediction.
To verify the application scope of artificial intelligence technology and new real-time disassembly sensors, the experiment extends its application examples on manufacturing generators to the energy industry, agriculture, medical and health, and transportation industries for experimentation. This ensures the representativeness and feasibility of application scope validation. Experimental verification has shown good predictive performance in all four industries, expanding the application scope.
This study achieved excellent predictive maintenance performance. By processing real-time data of a certain enterprise’s generator, it was found that the optimized GRU model, combined with a new real-time disassembly sensor, showed good performance in prediction accuracy, precision, recall, and F1 value. In terms of cost loss rate, detection efficiency, and other aspects, it is superior to the standalone new real-time disassembly sensor, overcoming its limitations and highlighting the effectiveness of applying artificial intelligence technology.
2 Artificial intelligence and new real-time disassembly sensors
2.1 Reflection of synergistic effect
The new real-time disassembly sensor is a sensor with a real-time monitoring function and can be easily disassembled and installed. It is designed for rapid installation in equipment or systems to monitor various physical or chemical parameters in real time [17,18]. The collaborative cooperation between artificial intelligence and new real-time disassembly sensors has been reflected in various industries in multiple aspects.
First, a large amount of real-time data can be provided through sensors, and corresponding artificial intelligence technologies can use this data for pattern recognition [19], anomaly detection [20], trend analysis [21], and so on. Second, artificial intelligence technology analyzes the historical data collected by sensors to predict potential equipment failures in advance, so that staff can perform maintenance promptly, and reduce equipment downtime and repair costs, which is difficult to achieve with a single sensor. Third, sensors combined with artificial intelligence technology can analyze and mine device operation data, providing intelligent decision support for decision-makers. Fourth, artificial intelligence technology can visually display device data and facilitate real-time monitoring and control by transmitting sensor data in real-time to the system. In summary, the synergistic effect of artificial intelligence and new real-time disassembly sensors can achieve real-time monitoring, prediction, and optimization of equipment status, improve equipment reliability, safety, and efficiency, and bring significant technological progress and economic benefits to industrial production and equipment maintenance.
2.2 Potential applications of artificial intelligence and new real-time disassembly sensors
The application range of individual sensors is often limited, but after combining artificial intelligence technology, they are gradually applied in various industries. The synergistic effect of artificial intelligence and new real-time disassembly sensors has a wide range of potential applications in various fields, mainly manifested in manufacturing, energy, transportation, agriculture, healthcare, and other industries.
In the manufacturing industry, real-time disassembly of sensors and the synergistic effect of artificial intelligence can achieve real-time monitoring and predictive maintenance of equipment. Sensors collect device operation data, and artificial intelligence algorithms can analyze this data to achieve prediction of device status and fault diagnosis, thereby improving production efficiency and product quality. In the energy industry, real-time disassembly of sensors combined with artificial intelligence technology can be used to monitor the operational status of facilities such as power equipment and oil and gas pipelines [22,23]. In transportation, real-time disassembly of sensors and the synergistic effect of artificial intelligence can be used to monitor the operation status and driving environment of vehicles [24].
For agriculture, real-time disassembly of sensors and artificial intelligence technology can be used to monitor agricultural parameters such as soil moisture and crop growth [25]. In healthcare, real-time disassembly of sensors and the synergistic effect of artificial intelligence can be used to monitor the physiological parameters and health status of patients [26].
3 Optimized PSO-GRU-SVM model
3.1 GRU model
GRU is a variant of recurrent neural network (RNN). It solves the problem of exploding and disappearing weight levels in traditional RNN models, as well as the problem of applying too many parameters and making training difficult for long short-term memory (LSTM) models [27,28]. The GRU model combines the forget gate and input gate together, correspondingly reducing the number of gates. This ensures the memory ability of the GRU model while improving the training performance of the network.
The reset gate is mainly used to control the retention of previous memories, and the calculation formula is
Among them,
The calculation formula for updating the door is
Among them,
The calculation formula for hidden doors is
The calculation of the hidden state at time t is
The calculation formula for the output generator fault type is
3.2 PSO
To optimize the GRU model, the particle swarm optimization algorithm is now applied for optimization [29]. The specific steps are as follows:
The parameters of the particle swarm can be initialized and corresponding PSO parameters can be set. In this experiment, the number of particle swarms is set to 100, the number of iterations is 30, and the search dimension is set to 4.
The position and velocity of the particle swarm can be initialized, and the particle position can be set using a random initialization method. The representation of the particle position is shown in formula (6).
(6)Among them,
The representation of particle velocity is
(7)Set the search time step of the GRU model to 1 in this experiment.
The fitness function of PSO can be determined, and the GRU model framework can be constructed using initialized particles. The calculation of its fitness function is
(8)Among them, A represents the number of training batches each time;
Continuing iterative calculation: By calculating the position of particles after each iteration and continuously adjusting the speed and position of the example, the optimal result is output. The calculation of speed update is shown in formula (9), and the calculation of position update is
(9)Among them,
(10)Among them,
The time factor calculation formula is
(11)Finally, the initial parameters were optimized using the PSO algorithm, and the GRU model was trained. After training, the fault types of the generator were classified.
3.3 SVM algorithm
In the GRU model, the output layer uses the traditional Softmax activation function for classification, but can only perform single classification, while the generator fault type in this experiment belongs to multi-classification. To improve the predictive performance of generator fault types, SVM is now applied to optimize the output layer of the GRU model. The calculation formula for SVM is
The penalty term is represented by D, and
The radial basis function is a commonly used kernel function, which is mainly used to map data to a high-dimensional space in SVM so that a linearly separable hyperplane can be found in the high-dimensional space for classification.
In this experiment, the radial basis function was chosen as the kernel function, and its calculation formula is
The calculation formula for the classification function corresponding to the SVM algorithm is
where sgn represents the sign function, c represents the bias term,
4 Generator failure prediction experiment
4.1 Experimental environment
Hardware equipment: 13th Gen Intel (R) Core(TM) i7-13700HX CPU (central processing unit), 32GB memory, memory speed 4800 MHz, NVIDIA GeForce RTX 4080 Laptop GPU (graphics processing unit).
New real-time disassembly sensors: red thermal external imager FLIR T540, MEMS vibration sensor STMicroelectronics LSM6DS3, nano-insulation sensor, acoustic flow sensor Honeywell SmartLine ST75, radio flow sensor AmpSense AS200, and nano dust sensor.
Software equipment: Microsoft Windows 11 operating system, Python software.
4.2 Experimental data
The data for this experiment comes from the generator equipment of a certain enterprise in Beijing. The collected data includes generator bearing vibration value, bearing temperature, noise value, insulation resistance value, winding temperature, rotor vibration value, rotor temperature, coolant flow rate, coolant temperature, current value, internal carbon powder accumulation degree of the generator, historical fault frequency, oil temperature, environmental temperature, fuel consumption rate, output voltage, output power, etc. The experiment collected data every 10 s, and a total of 2,340 pieces of data were collected through the new real-time disassembly sensor. The data partitioning method is to use the tenfold cross-validation method [30] to partition the generator equipment data. The experiment takes turns conducting experiments and taking the average of the results as the final result. Part of the experimental data is shown in Table 1.
Part of the original collected data
| A | B (m) | C (°C) | D (dB) | E (Ω) | F (°C) | G (mm) | H (°C) | I (m³/h) | J (°C) | K (A) | L (%) |
|---|---|---|---|---|---|---|---|---|---|---|---|
| 1 | 0.1 | 70.5 | 75.2 | 150.4 | 75.4 | 0.08 | 70.4 | 6.3 | 35.3 | 220.4 | 1.9 |
| 2 | 0.08 | 68.2 | 95.0 | 155.6 | 72.2 | 0.36 | 88.3 | 5.5 | 32.5 | 210.5 | 2.1 |
| 3 | 0.12 | 72.4 | 80.9 | 140.9 | 78.5 | 0.1 | 75.5 | 7.2 | 38.0 | 230.9 | 3.3 |
| 4 | 0.06 | 65.5 | 72.8 | 165.2 | 70.6 | 0.05 | 65.8 | 5.9 | 30.3 | 268.2 | 4.9 |
| 5 | 0.15 | 75.6 | 82.5 | 120.6 | 80.9 | 0.12 | 78.9 | 7.5 | 40.8 | 340.4 | 6.8 |
| 6 | 0.07 | 67.8 | 76.0 | 180.5 | 71.1 | 0.07 | 67.2 | 5.2 | 31.6 | 205.3 | 0.8 |
| 7 | 0.05 | 78.0 | 84.8 | 110.3 | 82.4 | 0.14 | 80.7 | 6.6 | 42.4 | 250.5 | 4.3 |
| 8 | 0.01 | 91.1 | 88.2 | 160.5 | 75.7 | 0.09 | 70.4 | 6.5 | 36.3 | 225.5 | 2.5 |
| 9 | 0.08 | 68.8 | 77.4 | 155.9 | 72.9 | 0.07 | 68.2 | 4.3 | 40.5 | 215.7 | 1.5 |
| 10 | 0.06 | 66.4 | 74.5 | 170.7 | 71.5 | 0.06 | 66.6 | 3.1 | 52.7 | 210.6 | 1 |
In Table 1, A represents the data set, B represents the bearing vibration value (mm), C represents the bearing temperature (°C), D represents the noise value (dB), E represents the insulation resistance value (Ω), F represents the winding temperature (°C), G represents the rotor vibration value (mm), H represents the rotor temperature (°C), I represents the coolant flow (m3/h), J represents the coolant temperature (°C), K represents the current value (A), and L represents the degree of toner aggregation inside the generator (%).
In Table 1, to better compare the generator fault monitoring results in this experiment, four different fault time data are randomly selected from the original data for display (1–2 is a period, 3–5 is a period, 6–8 is a period, and 9–10 is a period). The normal range of measurement parameters and indicators of the new real-time disassembly sensor is shown in Table 2.
The normal range of measurement parameters and indicators of the new real-time disassembly sensor
| Index | Minimum value | Maximum value | Index | Minimum value | Maximum value |
|---|---|---|---|---|---|
| Bearing vibration value (mm) | 0.05 | 0.2 | Rotor vibration value (mm) | 0.03 | 0.15 |
| Bearing temperature (°C) | 58 | 80 | Rotor temperature (°C) | 60 | 83 |
| Noise value (dB) | 70 | 85 | Coolant flow rate (m³/h) | 4 | 8 |
| Insulation resistance value (MΩ) | 100 | — | Coolant temperature (°C) | 26 | 43 |
| Winding temperature (°C) | 70 | 90 | Current value (A) | 150 | 300 |
| Toner accumulation degree inside the generator (%) | 0 | 5 | |||
From Table 2, it can be seen that the normal range of effective vibration values for bearings is 0.05–0.2 mm, and the normal range of bearing temperature is 58–80°C. The vibration range of noise generated by the generator under normal conditions is 70–85 dB, and the normal temperature range of the winding is 70–90°C. The normal range of rotor vibration values is 0.03–0.15 mm, and the normal range of rotor temperature is 60–83°C. The coolant temperature ranges from 26 to 43°C, and the normal range of current values is 150–300 A. The degree of carbon powder accumulation inside the generator is usually less than 5%.
4.3 Data preprocessing
4.3.1 Missing value handling
To ensure the integrity of the data, the missing values in the experiment can be processed, and the missing values are filled in using the mean values under the corresponding parameters.
4.3.2 Normalization processing
For the convenience of model training, Min–Max normalization can be used to normalize the data, scaling the data from different ranges to between 0 and 1
Among them, x represents the parameter index data of the generator equipment, and
4.3.3 Feature extraction
This experiment is based on independent variable data such as generator bearing vibration value, bearing temperature, noise value, insulation resistance value, winding temperature, rotor vibration value, rotor temperature, coolant flow rate, coolant temperature, current value, internal carbon powder accumulation degree of the generator, historical fault frequency, etc., as well as fault variables such as bearing failure, insulation failure, rotor failure, cooling system failure, carbon brush failure, etc. First, the raw data can be divided into fault types and corresponding feature sets. Then, for each feature, the Pearson correlation coefficient method is used to calculate its correlation with the target fault type. Finally, based on the correlation coefficient results, an absolute value greater than 0.6 can be selected as the feature with the highest degree of correlation with the fault type. The Pearson correlation coefficient calculation formula is
After calculation, the Pearson correlation coefficient results between fault types and characteristics are shown in Table 3.
Pearson correlation coefficient results between fault types and characteristics
| Fault type | Serial number | Feature | Pearson correlation coefficient |
|---|---|---|---|
| Bearing failure | 1 | Bearing vibration value | 0.72 |
| 2 | Bearing temperature | 0.68 | |
| 3 | Noise | 0.65 | |
| Insulation failure | 1 | Insulation resistance value | 0.6 |
| 2 | Winding temperature | 0.68 | |
| Rotor failure | 1 | Rotor vibration value | 0.75 |
| 2 | Rotor temperature | 0.7 | |
| 3 | Noise | 0.68 | |
| Cooling system failure | 1 | Coolant flow | −0.65 |
| 2 | Coolant temperature | −0.81 | |
| Carbon brush failure | 1 | Current value | 0.63 |
| 2 | The degree of carbon dust accumulation inside the generator | 0.65 |
In Table 3, it can be seen that the selected features are as follows: bearing vibration value, bearing temperature, and noise have a higher degree of correlation with bearing faults. The insulation resistance value and winding temperature have the highest correlation with insulation faults, while the rotor vibration value, rotor temperature, and noise have the highest correlation with rotor faults. The coolant flow rate and coolant temperature have the highest correlation with cooling system failures. The current value and the degree of carbon powder accumulation inside the generator have the highest correlation with carbon brush faults.
4.4 Experimental process
This experiment is first based on the collection of new real-time disassembly sensors installed on the generator. The data is processed for missing values, normalized, and feature engineering. Then, the collected data from the sensors is divided and added to the optimized GRU model for training. Finally, the performance of the model is verified on the test set.
4.5 Experimental results
Evaluating indicator:
Among them, accuracy:
precision:
recall:
f1:
TP represents true positive; TN represents true negative; FP represents false positive; FN represents false negative.
After the above experimental steps, the experimental results are shown in Table 4.
Experimental results
| Data group | Actual type | Forecast type | Data group | Actual type | Forecast type |
|---|---|---|---|---|---|
| 1 | Normal | Normal | 6 | Normal | Normal |
| 2 | Rotor failure | Rotor failure | 7 | Normal | Bearing failure |
| 3 | Normal | Normal | 8 | Bearing failure | Bearing failure |
| 4 | Normal | Carbon brush failure | 9 | Normal | Normal |
| 5 | Carbon brush failure | Carbon brush failure | 10 | Cooling system failure | Cooling system failure |
In Table 4, data groups 3–5 show that the actual generator in data group 3 is in a normal state, which is also predicted by this model to be normal. In data group 4, it is actually normal, but the model predicts a carbon brush fault precisely because the model detected a current value of 268.2 A, and the accumulation of carbon powder inside the generator was as high as 4.9%, only 0.1% below the alarm limit. After 10 s, in data group 5, the generator actually experienced a carbon brush fault, and the model predicted it to be a carbon brush fault, with a current value of 340.4 A. The accumulation of carbon powder inside the generator reached 6.8%, which is higher than the normal limit of 1.8%. It can be seen that the new real-time disassembly sensor, with the introduction of artificial intelligence technology, can predict generator faults in advance, repair them promptly, and avoid downtime. In addition, in data groups 6–8, the actual generator in data group 6 is in a normal state. After prediction by this model, it was normal. However, after 10 s, the actual state of the generator was normal, and the model predicted a bearing failure. It is precisely because the model detected that the bearing vibration value reached the minimum limit of 0.05 mm, and the bearing temperature reached 78°C, with a noise value of 84.8 dB. All three values are close to the critical value. After another 10 s, the generator experienced a bearing failure, and the model predicted it to be a bearing failure. The vibration value of the bearings has significantly decreased, only to 0.01 mm. The temperature of the generator bearings reached as high as 91.1°C, and the noise level reached 88.2 dB, seriously exceeding the limit value. Based on the comparison of the above prediction results, it can be concluded that combining artificial intelligence technology with real-time sensors can reduce downtime and enable staff to maintain it promptly.
4.6 Application range expansion results of artificial intelligence and new real-time dismantling sensors
To further explore the application scope of the model, this article studies the synergistic effect of artificial intelligence technology and new real-time disassembly sensors. It is now being applied in the energy industry, transportation, agriculture, and healthcare industries. The specific implementation steps are as follows:
In a certain energy enterprise, a new type of real-time disassembly sensor is deployed to collect real-time vibration, temperature, noise, and other data of generator equipment, and the collected data is transmitted to the data center for storage and analysis. Based on the collected data, the optimized GRU model can be applied to predict the possible types and times of faults that may occur in generator equipment.
New real-time disassembly sensors can be installed on cars to monitor parameters such as vibration, temperature, and noise of the vehicle. It can collect real-time vehicle status data and transmit it to the central control center for analysis. Based on the collected data, an optimized GRU can be used to establish an anomaly detection model for vehicle status, which can verify that when abnormal vehicle status is detected, timely warnings are issued, and corresponding measures are taken to reduce the probability of accidents.
By deploying a new type of real-time dismantling sensor in rural farmland, parameters such as soil moisture, temperature, and crop growth can be monitored in real time. The optimized GRU model can be used to analyze monitoring data in real time, provide real-time status and prediction information on crop growth, and achieve precise irrigation and fertilization of farmland. Water and nutrient supply can be adjusted according to crop demand to improve crop yield and quality.
The medical and health industry chooses a hospital in Nanchang City. New real-time detachable sensors can be used to monitor the physiological parameters of patients, such as heart rate, body temperature, blood pressure, etc., and the monitoring data can be transmitted to the medical system to achieve real-time monitoring of the patient’s health status. Based on patient monitoring data and historical health records, an optimized GRU can be used to establish disease prediction and diagnostic models, timely predict potential disease risks for patients, and provide personalized diagnosis and treatment recommendations.
After the above experiment, the specific effect is shown in Figure 1.

Application range expansion results.
In Figure 1, the application of artificial intelligence and new real-time disassembly sensors in the energy industry, transportation, agriculture, and healthcare industries are shown in sequence. From the perspective of prediction accuracy, the energy industry and healthcare industry have relatively high rates, reaching 97.16 and 95.77%, respectively, while in the transportation industry, they have reached 92.87%, and in agriculture, they have reached 88.34%. From the perspective of prediction efficiency, it is relatively high in the transportation and healthcare industries, both reaching over 80%, while it is also above 75% in the energy and agriculture industries. From the perspective of resource utilization rates in the four industries, the energy industry, transportation, agriculture, and healthcare have all reached over 85%. In summary, the combination of artificial intelligence and new real-time disassembly sensors has been extended to the energy industry, transportation industry, agriculture, and medical and health industries for collaborative effect verification after predicting generator failures in the manufacturing industry. It has been found that the predictive performance has reached good levels, indicating that the application scope has been expanded to a certain extent.
5 Experimental discussion
5.1 Comparison of performance parameters for generator fault prediction
After the above experiment, the accuracy, precision, recall, and F1 value of the generator fault prediction performance are compared and analyzed, as shown in Figure 2.

Performance parameters for predicting generator faults.
From Figure 2, it can be seen that after tenfold cross-validation, the accuracy of this experiment reached an average of 0.94, and the precision reached an average of 0.92. The average recall rate reached 0.96, and the average F1 value reached 0.87. Overall, the generator fault prediction performance has achieved good predictive performance in terms of accuracy, precision, recall, and F1 value.
5.2 Detection and maintenance performance of generator faults
To further verify the synergistic effect of artificial intelligence technology and new real-time disassembly sensors, the detection and maintenance performance of generator faults is now verified as shown in Figure 3. Among them, four types can be selected for comparison, namely optimized GRU – a new real-time disassembly sensor, random forest – a new real-time disassembly sensor, new real-time disassembly sensor, and traditional sensor.
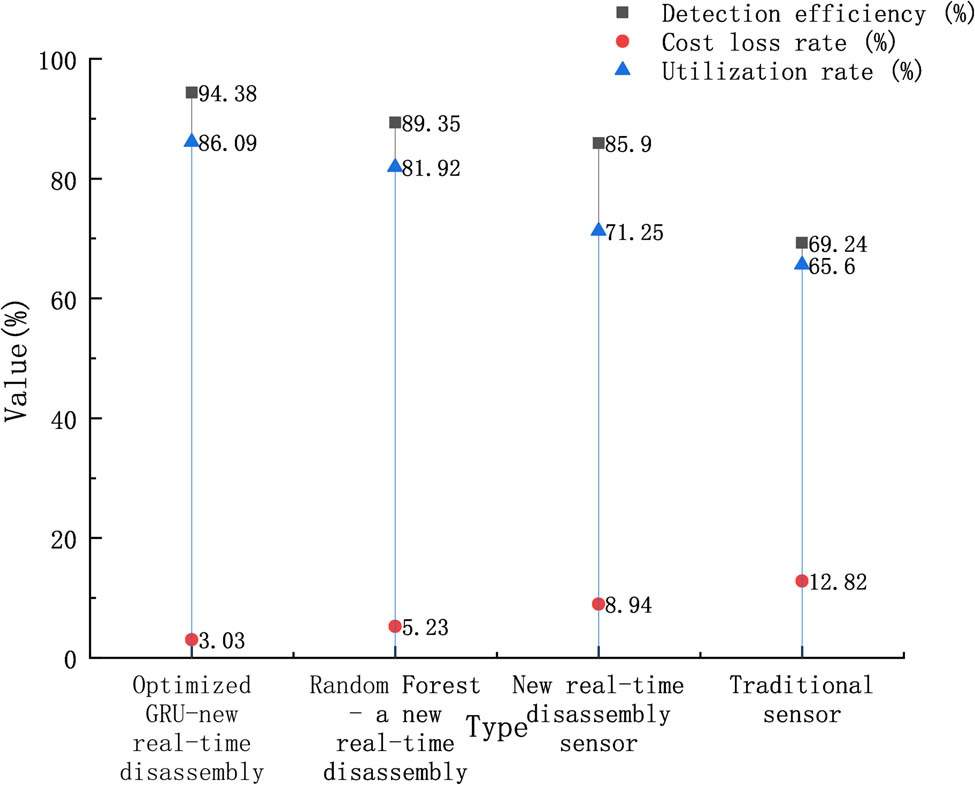
Detection and maintenance performance of generator faults.
In Figure 3, in terms of detection efficiency, the random forest new real-time disassembly sensor achieved 89.35%. After optimization, the GRU new real-time disassembly sensor achieved 94.38%, which is 5.03% higher than the random forest new real-time disassembly sensor. It can be seen that the optimized GRU model in this experiment has a better synergistic effect compared to the random forest model and the new real-time disassembly sensor and has better efficiency in generator fault detection. In addition, the detection efficiency of using the new real-time disassembly sensor alone is only 85.90%, which is 8.48% lower than the optimized GRU new real-time disassembly sensor. It can be seen that without the introduction of artificial intelligence technology models, it is difficult to achieve predictive maintenance, there is a certain delay, and the detection efficiency is seriously reduced. The limitations of traditional sensors are more obvious, with a detection efficiency of only 69.24%. Compared with the optimized GRU new real-time disassembly sensor, it has decreased by 25.14%, with a larger amplitude. From the perspective of cost loss rate, the optimized GRU new real-time disassembly sensor is only 3.03%, while the new real-time disassembly sensor reaches 8.94%. In terms of utilization, the optimized GRU new real-time disassembly sensor reached 86.09%, while the new real-time disassembly sensor only reached 71.25%. Due to serious reasons such as downtime delay, the resource utilization rate has decreased.
Overall, it is difficult to achieve predictive maintenance and significantly increase downtime costs for a single new type of dismantling sensor, which has significant limitations. However, the application of artificial intelligence technology, such as optimized GRU models and random forest models, has to some extent overcome the limitations of a single new type of real-time dismantling sensor.
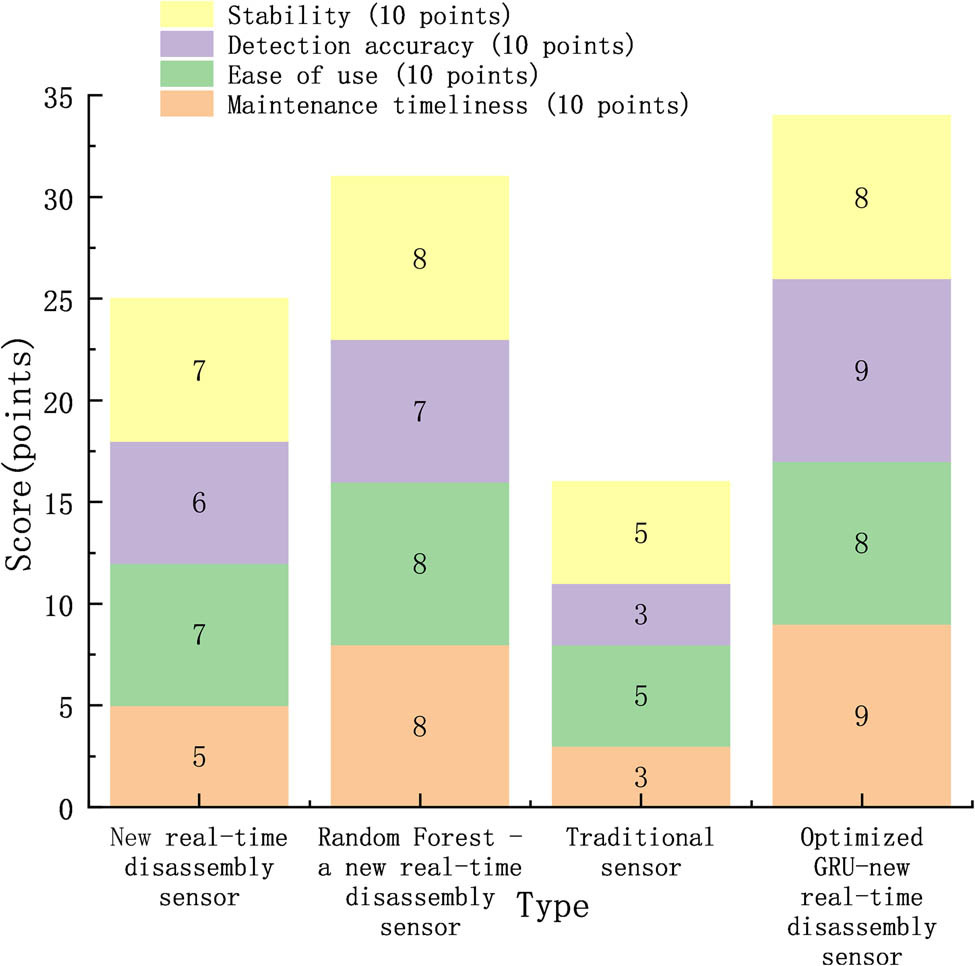
5.3 User satisfaction
User satisfaction analysis is the process of evaluating the level of satisfaction of users with products, services, or experiences. This experiment evaluates the optimized GRU – a new real-time disassembly sensor, random forest – a new real-time disassembly sensor, a new real-time disassembly sensor, and a traditional sensor through the collection of survey questionnaires. The specific evaluation indicators are maintenance timeliness, usability, detection accuracy, and stability. These four indicators are all 10 points, a total of 40 points. A total of 318 questionnaires were collected, and the user satisfaction analysis results after mean processing are shown in Figure 4.
User satisfaction results.
In Figure 4, overall, the optimized GRU new real-time disassembly sensor achieved a score of 34, accounting for 85% of the total score. The total score of the random forest – a new real-time disassembly sensor reached 31 points, accounting for 77.5% of the total score. The new real-time disassembly sensor scored 25 points, accounting for only 62.5% of the total score. Compared to other sensors, traditional sensors are less satisfactory to users, accounting for only 40%. Overall, in the era of artificial intelligence technology, the optimized GRU new real-time disassembly sensor is more favored by users, while individual sensors are gradually withdrawing from the trend of the times.
6 Conclusions
This article explored the synergistic effect of new real-time disassembly sensors and artificial intelligence technology by applying artificial intelligence technology. Using the GRU model as the base, PSO and support vector machine models are applied to construct the PSO-GRU-SVM model. It can be applied to the fault prediction of generators and then expanded to be applied to the energy industry, agriculture, medical and health, and transportation industries for verification. The experimental results show that the combination of artificial intelligence technology and new real-time disassembly sensors reduces maintenance costs, overcomes the limitations of individual real-time disassembly sensors, and expands the application range. However, there are still some shortcomings in this study, and the selection of application scope is not comprehensive enough. In the future, more applications can be expanded for experimentation.
-
Funding information: This study did not receive any funding in any form.
-
Author contributions: L. B. Z. was responsible for the manuscript writing, research framework design, mode creation, and data analysis. J. D. J. was responsible for the cording and liaising as part of the research project, organization research data, proofreading language, and processing images. L. X. W. was responsible for mode creation and data analysis. L. Y. was responsible for the organization research data, proofreading language, and processing images. H. H. R. was responsible for mode creation and data analysis. W. H. was responsible for the organization research data, proofreading language, and processing images. All authors have read and agreed to the published version of the manuscript.
-
Conflict of interest: The authors declare that there is no conflict of interest regarding the publication of this article.
-
Data availability statement: The data used to support the findings of this study are available from the corresponding author upon request.
References
[1] Rana M, Mittal V. Wearable sensors for real-time kinematics analysis in sports: A review. IEEE Sens J. 2020;21(2):1187–207. 10.1109/JSEN.2020.3019016.Suche in Google Scholar
[2] Slade P, Habib A, Hicks JL, Delp SL. An open-source and wearable system for measuring 3D human motion in real-time. IEEE Trans Biomed Eng. 2021;69(2):678–88. 10.1109/TBME.2021.3103201.Suche in Google Scholar PubMed PubMed Central
[3] Prasanth H, Caban M, Keller U, Courtine G, Ijspeert A, Vallery H, et al. Wearable sensor-based real-time gait detection: A systematic review. Sensors. 2021;21(8):2727–54. 10.3390/s21082727.Suche in Google Scholar PubMed PubMed Central
[4] Qin K, Chen C, Pu X, Tang Q, He W, Liu Y, et al. Magnetic array assisted triboelectric nanogenerator sensor for real-time gesture interaction. Nano-Micro Lett. 2021;13(1):1–9. 10.1007/s40820-020-00575-2.Suche in Google Scholar PubMed PubMed Central
[5] Jeong H, Park W. Developing and evaluating a mixed sensor smart chair system for real-time posture classification: Combining pressure and distance sensors. IEEE J Biomed Health Inform. 2020;25(5):1805–13. 10.1109/JBHI.2020.3030096.Suche in Google Scholar PubMed
[6] Su Y, Ma C, Chen J, Wu H, Luo W, Peng Y, et al. Printable, highly sensitive flexible temperature sensors for human body temperature monitoring: a review. Nanoscale Res Lett. 2020;15(1):1–34. 10.1186/s11671-020-03428-4.Suche in Google Scholar PubMed PubMed Central
[7] Chopade SS, Gupta HP, Dutta T. Survey on sensors and smart devices for IoT enabled intelligent healthcare system. Wirel Personal Commun. 2023;131(3):1957–95. 10.1007/s11277-023-10528-8.Suche in Google Scholar PubMed PubMed Central
[8] Tao Q, Liu S, Zhang J, Jiang J, Jin Z, Huang Y, et al. Clinical applications of smart wearable sensors. Iscience. 2023;26(9):1–22. 10.1016%2Fj.isci.2023.107485.Suche in Google Scholar
[9] Pech M, Vrchota J, Bednar J. Predictive maintenance and intelligent sensors in smart factory. Sensors. 2021;21(4):1470–509. 10.3390/s21041470.Suche in Google Scholar PubMed PubMed Central
[10] Chen L, Wei L, Wang Y, Wang J, Li W. Monitoring and predictive maintenance of centrifugal pumps based on smart sensors. Sensors. 2022;22(6):2106–19. 10.3390/s22062106.Suche in Google Scholar PubMed PubMed Central
[11] Keleko AT, Kamsu-Foguem B, Ngouna RH, Tongne A. Artificial intelligence and real-time predictive maintenance in industry 4.0: a bibliometric analysis. AI Ethics. 2022;2(4):553–77. 10.1007/s43681-021-00132-6.Suche in Google Scholar
[12] Yu J, Xian S, Zhang Z, Hou X, He J, Mu J, et al. Synergistic piezoelectricity enhanced BaTiO3/polyacrylonitrile elastomer-based highly sensitive pressure sensor for intelligent sensing and posture recognition applications. Nano Res. 2023;16(4):5490–502. 10.1007/s12274-022-5084-x.Suche in Google Scholar
[13] Hoffmann MW, Wildermuth S, Gitzel R, Boyaci A, Gebhardt J, Kaul H, et al. Integration of novel sensors and machine learning for predictive maintenance in medium voltage switchgear to enable the energy and mobility revolutions. Sensors. 2020;20(7):2099–122. 10.3390/s20072099.Suche in Google Scholar PubMed PubMed Central
[14] Wahid A, Breslin JG, Intizar MA. Prediction of machine failure in industry 4.0: a hybrid CNN-LSTM framework. Appl Sci. 2022;12(9):4221–37. 10.3390/app12094221.Suche in Google Scholar
[15] Cınar ZM, Abdussalam Nuhu A, Zeeshan Q, Korhan O, Asmael M, Safaei B. Machine learning in predictive maintenance towards sustainable smart manufacturing in industry 4.0. Sustainability. 2020;12(19):8211–52. 10.3390/su12198211.Suche in Google Scholar
[16] Huang T, Zhang Q, Tang X, Zhao S, Lu X. A novel fault diagnosis method based on CNN and LSTM and its application in fault diagnosis for complex systems. Artif Intell Rev. 2022;55(2):1289–315. 10.1007/s10462-021-09993-z.Suche in Google Scholar
[17] An JE, Kim KH, Park SJ, Seo SE, Kim J, Ha S, et al. Wearable cortisol aptasensor for simple and rapid real-time monitoring. ACS Sens. 2022;7(1):99–8. 10.1021/acssensors.1c01734.Suche in Google Scholar PubMed
[18] Terse-Thakoor T, Punjiya M, Matharu Z, Lyu B, Ahmad M, Giles GE, et al. Thread-based multiplexed sensor patch for real-time sweat monitoring. NPJ Flex Electron. 2020;4(1):18–7. 10.1038/s41528-020-00081-w.Suche in Google Scholar
[19] Entezami A, Sarmadi H, Behkamal B, Mariani S. Big data analytics and structural health monitoring: a statistical pattern recognition-based approach. Sensors. 2020;20(8):2328–44. 10.3390/s20082328.Suche in Google Scholar PubMed PubMed Central
[20] Erhan L, Ndubuaku M, Di Mauro M, Song W, Chen M, Fortino G, et al. Smart anomaly detection in sensor systems: A multi-perspective review. Inf Fusion. 2021;67(1):64–9. 10.1016/j.inffus.2020.10.001.Suche in Google Scholar
[21] Blasch E, Pham T, Chong CY, Koch W, Leung H, Braines D, et al. Machine learning/artificial intelligence for sensor data fusion–opportunities and challenges. IEEE Aerosp Electron Syst Mag. 2021;36(7):80–3. 10.1109/MAES.2020.3049030.Suche in Google Scholar
[22] Gupta D, Shah M. A comprehensive study on artificial intelligence in oil and gas sector. Environ Sci Pollut Res. 2022;29(34):50984–97. 10.1007/s11356-021-15379-z.Suche in Google Scholar PubMed
[23] Afridi YS, Ahmad K, Hassan L. Artificial intelligence based prognostic maintenance of renewable energy systems: A review of techniques, challenges, and future research directions. Int J Energy Res. 2022;46(15):21619–42. 10.1002/er.7100.Suche in Google Scholar
[24] Fu Y, Li C, Yu FR, Luan TH, Zhang Y. A survey of driving safety with sensing, vehicular communications, and artificial intelligence-based collision avoidance. IEEE Trans Intell transportatiSyst. 2021;23(7):6142–63. 10.1109/TITS.2021.3083927.Suche in Google Scholar
[25] Subeesh A, Mehta CR. Automation and digitization of agriculture using artificial intelligence and internet of things. Artif Intell Agriculture. 2021;5(1):278–91. 10.1016/j.aiia.2021.11.004.Suche in Google Scholar
[26] Tiwari S, Agarwal S. A shrewd artificial neural network-based hybrid model for pervasive stress detection of students using galvanic skin response and electrocardiogram signals. Big Data. 2021;9(6):427–42. 10.1089/big.2020.0256.Suche in Google Scholar PubMed
[27] Zainuddin Z, EA PA, Hasan MH. Predicting machine failure using recurrent neural network-gated recurrent unit (RNN-GRU) through time series data. Bull Electr Eng Inform. 2021;10(2):870–8. 10.11591/eei.v10i2.2036.Suche in Google Scholar
[28] Dangut MD, Jennions IK, King S, Skaf Z. A rare failure detection model for aircraft predictive maintenance using a deep hybrid learning approach. Neural Comput Appl. 2023;35(4):2991–9. 10.1007/s00521-022-07167-8.Suche in Google Scholar
[29] Zang B, Gao H, Liu J, Chen L. Fault prediction of DC charging pile based on improved GRU model . Computer Syst Application. 2022;32(2):356–63. 10.15888/j.cnki.csa.008929.Suche in Google Scholar
[30] Venkata P, Pandya V, Vala K, Sant AV. Support vector machine for fast fault detection and classification in modern power systems using quarter cycle data. Energy Rep. 2022;8(1):92–8. 10.1016/j.egyr.2022.10.279.Suche in Google Scholar
© 2025 the author(s), published by De Gruyter
This work is licensed under the Creative Commons Attribution 4.0 International License.
Artikel in diesem Heft
- Research Articles
- Synergistic effect of artificial intelligence and new real-time disassembly sensors: Overcoming limitations and expanding application scope
- Greenhouse environmental monitoring and control system based on improved fuzzy PID and neural network algorithms
- Explainable deep learning approach for recognizing “Egyptian Cobra” bite in real-time
- Optimization of cyber security through the implementation of AI technologies
- Deep multi-view feature fusion with data augmentation for improved diabetic retinopathy classification
- A new metaheuristic algorithm for solving multi-objective single-machine scheduling problems
- Estimating glycemic index in a specific dataset: The case of Moroccan cuisine
- Hybrid modeling of structure extension and instance weighting for naive Bayes
- Application of adaptive artificial bee colony algorithm in environmental and economic dispatching management
- Stock price prediction based on dual important indicators using ARIMAX: A case study in Vietnam
- Emotion recognition and interaction of smart education environment screen based on deep learning networks
- Supply chain performance evaluation model for integrated circuit industry based on fuzzy analytic hierarchy process and fuzzy neural network
- Application and optimization of machine learning algorithms for optical character recognition in complex scenarios
- Comorbidity diagnosis using machine learning: Fuzzy decision-making approach
- A fast and fully automated system for segmenting retinal blood vessels in fundus images
- Application of computer wireless network database technology in information management
- A new model for maintenance prediction using altruistic dragonfly algorithm and support vector machine
- A stacking ensemble classification model for determining the state of nitrogen-filled car tires
- Research on image random matrix modeling and stylized rendering algorithm for painting color learning
- Predictive models for overall health of hydroelectric equipment based on multi-measurement point output
- Architectural design visual information mining system based on image processing technology
- Measurement and deformation monitoring system for underground engineering robots based on Internet of Things architecture
- Face recognition method based on convolutional neural network and distributed computing
- OPGW fault localization method based on transformer and federated learning
- Class-consistent technology-based outlier detection for incomplete real-valued data based on rough set theory and granular computing
- Detection of single and dual pulmonary diseases using an optimized vision transformer
- CNN-EWC: A continuous deep learning approach for lung cancer classification
- Cloud computing virtualization technology based on bandwidth resource-aware migration algorithm
- Hyperparameters optimization of evolving spiking neural network using artificial bee colony for unsupervised anomaly detection
- Classification of histopathological images for oral cancer in early stages using a deep learning approach
- A refined methodological approach: Long-term stock market forecasting with XGBoost
- Enhancing highway security and wildlife safety: Mitigating wildlife–vehicle collisions with deep learning and drone technology
- An adaptive genetic algorithm with double populations for solving traveling salesman problems
- EEG channels selection for stroke patients rehabilitation using equilibrium optimizer
- Influence of intelligent manufacturing on innovation efficiency based on machine learning: A mechanism analysis of government subsidies and intellectual capital
- An intelligent enterprise system with processing and verification of business documents using big data and AI
- Hybrid deep learning for bankruptcy prediction: An optimized LSTM model with harmony search algorithm
- Construction of classroom teaching evaluation model based on machine learning facilitated facial expression recognition
- Artificial intelligence for enhanced quality assurance through advanced strategies and implementation in the software industry
- An anomaly analysis method for measurement data based on similarity metric and improved deep reinforcement learning under the power Internet of Things architecture
- Optimizing papaya disease classification: A hybrid approach using deep features and PCA-enhanced machine learning
- Handwritten digit recognition: Comparative analysis of ML, CNN, vision transformer, and hybrid models on the MNIST dataset
- Multimodal data analysis for post-decortication therapy optimization using IoMT and reinforcement learning
- Predicting early mortality for patients in intensive care units using machine learning and FDOSM
- Uncertainty measurement for a three heterogeneous information system based on k-nearest neighborhood: Application to unsupervised attribute reduction
- Review Articles
- A comprehensive review of deep learning and machine learning techniques for early-stage skin cancer detection: Challenges and research gaps
- An experimental study of U-net variants on liver segmentation from CT scans
- Strategies for protection against adversarial attacks in AI models: An in-depth review
- Resource allocation strategies and task scheduling algorithms for cloud computing: A systematic literature review
- Latency optimization approaches for healthcare Internet of Things and fog computing: A comprehensive review
- Explainable clustering: Methods, challenges, and future opportunities