A fast and fully automated system for segmenting retinal blood vessels in fundus images
-


Abstract
The problem of segmenting retinal blood vessels in fundus images arises from the challenges of accurately detecting and delineating vessels due to their complex structures, varying sizes, and overlapping features. Manual segmentation is time-consuming and prone to human error, leading to inconsistent results. Additionally, existing automated methods often struggle with low-quality images or variations in illumination, hindering their effectiveness. Therefore, there is a pressing need for an efficient and accurate automated system to improve segmentation outcomes for better diagnosis of retinal diseases. This study proposes a fully automated model for blood vessel segmentation in retinal fundus images, addressing key challenges such as poor image quality, weak vessel detection, and inhomogeneity in contrast. Macular degeneration and diabetic retinopathy are major causes of vision impairment, making accurate retinal analysis crucial. The proposed model enhances image quality through a novel pre-processing pipeline that includes logarithmic contrast enhancement, noise reduction using an improved complex wavelet transform with shrinkage, and anisotropic diffusion filtering for edge enhancement. The segmentation method combines morphological operations with an optimized Canny edge detector, effectively identifying and segmenting blood vessels. This approach aims to improve the accuracy and efficiency of retinal image analysis, overcoming the limitations of manual segmentation and complex vascular structures. The results obtained from the DRIVE dataset achieved high values for accuracy (Acc, 99%), sensitivity (Sen, 95.83%), specificity (Spe, 98.62%), positive predictive value (PPV, 91.34%), and negative predictive value (NPV, 94%). In addition, the results obtained using the high-resolution fundus dataset were equally satisfactory, achieving an Acc., Sen., Spe., PPV, and NPV of 99.11, 97.97, 98.97, 97.98, and 100%, respectively. These results outperform the gold standard and state-of-the-art schemes to date. The proposed approach increases the performance and reliability of the process of vessel detection in fundus images.
1 Introduction
Quantitative analysis of retinal fundus images (RFIs) has proven to be an important tool in the diagnosis and management of heart and eye diseases by this method for many conditions, including macular degeneration, diabetic retinopathy (DR), glaucoma, hypertension, atherosclerosis, venous occlusion, and choroidal neovascularization. Investigated notably, the leading cause of vision loss worldwide is DR [1]. Accurate segmentation of the retinal vasculature is essential for obtaining quantitative parameters, such as vessel tortuosity, thickness, length, and density, which serve as important indicators of eye health. Beyond diagnostic applications, the segmented vascular tree is also crucial in image registration and mosaicking [2]. Other applications are in production, optic disc localization, foveal recognition, and biometric authentication. Figure 1 shows typical RFIs and corresponding manual blood vessels.

DRIVE dataset and RFI with the blood vessel structure manually drawn.
Automatic identification of different segments of blood vessels is a crucial technique in determining the causes of many retinal disorders, including DR and macular degeneration. High density and tortuosity of the retinal vessels, variations in size, form, and degree of overlapping all contribute to difficulties in segmentation and tracing. The conventional way of segmenting documents based on a human expert’s input is also very tedious and is likely to give different results each time. Consequently, the need for advanced segregation procedures that can help diagnose pathological changes in RFIs is becoming increasingly necessary to provide the best means of treatment for patients with a likelihood of vision loss. Novelties in image processing, as well as the area of machine learning, have brought into existence complex automated algorithms whose goal is to enhance both the accuracy and speed of blood vessel identification in retina images. They apply different techniques of pre-processing like noise elimination, contrast stretching, bending, and edge detection on the resultant image. However, current methods still face specific problems in low-quality images, changes in light conditions, and high difficulty of vascular structures. Thus, the requirement for a sound and efficient automated method, which is capable of solving these problems and offering high performance in segmenting retinal blood vessels, has never been before as important as now since it is highly valuable in enhancing patient care and driving the research on retinal disorders.
Manual segmentation is a time-consuming and error-prone process, especially in cases involving complex neural systems or large-scale images. Consequently, automated systems that can accurately segment and extract clinically relevant features from retinal blood vessels are needed to assist ophthalmologists in early diagnosis and treatment evaluation [3]. Nevertheless, there are some disadvantages of segmenting the vascular tree in retinal images manually; these are time consuming and prone to inter-observers’ variability. This is particularly true when the number of images is relatively high and where the structure of the vessel in question is intricate [4], making time consumption the most significant factor in the operating process of the images [5] and tiresome to the specialists due to the complexity of the images. The consequence of processing many images is that humans make mistakes. These are a single group of total errors, which must be eliminated because their occurrence might contribute to diagnostic errors [6,7]. The challenges that are usually accompanied by the manual segmentation of the vascular tree in retinal images may easily detract from the quality of the treatment that the patients receive and, in some extreme circumstances, even cause blindness among these patients. On the other hand, while the field of retinal vessel segmentation has received a significant amount of research much less has been said on the field that is rather focused on the classification of the segmented vessels. However, it reduces the classification of arteries and veins in the automatic model of RFIs because arteries and veins have similar descriptive characteristics, and the contrast and lighting of the fundus image differ [8]. The two main artefacts related to the retinal images are the non-uniform contrast and the light changes that take place in intra- and inter-images.
Veins, arteries, and capillaries can be easily seen on the fundus where no other part of the body can be seen. Diameters of the vessels in the fundus are the primary actionable signs of various retinal and cardiovascular pathological conditions. Hence, there is a necessity of proper delineation of vessels from the retina to diagnose and conduct screening for these diseases. Over the past few years, great efforts have been devoted to the study of retinal vessel segmentation. This study offers a detailed discussion of automated retinal vessel segmentation methods, categorized according to the type of work presented and organized chronologically, ranging from prior methods to those in the deep learning era, including unsupervised and supervised ML classification. Singh et al. solved the difficult problem of blood vessel division in color fundus images by deep learning, which is usually done by experienced clinicians [9]. To improve the effectiveness of this procedure, the researchers used five state-of-the-art deep learning architectures (U-Net, DenseU-Net, LadderNet, R2U-Net, and ATTU-Net) and a new network design known as R2-ATT U-Net for precise delineation of the RBVT. On the STARE dataset, for patch extraction, they considered 10,000 patches per image for processing, 8,000 of them for training, and 2,000 for testing purposes. Besides accuracy (Acc), sensitivity (Sen), specificity (Spe), and AUC were employed for the evaluation of the general performance of the models. These models yielded LadderNet to be the model with the best Acc of 0.971, slightly exceeding the result of the enhanced R2-ATT U-Net. However, there are several limitations in this study: the applicability of the proposed methodologies is only based on the STARE dataset that may not include all possible clinical situations; all the experiments were conducted on fixed resolution images; the proposed methodologies should be validated with more number of datasets in the future studies. Almeida et al. provided an efficient automated technique to segment the blood vessels from the fundus image for diagnosing ROP Plus Form, an eye disease that causes blindness [10]. The pipeline utilizes techniques like CIELAB enhancement and vesselness filtering, attaining an intricate exactness of 0.94 for the Clarity RetCam3, while the DRIVE Database attained 0.95. As a result of the experiments, it has an acceptable level of Spe and Sen demonstrating the clinical relevancy of the presented method. However, the drawback is the dependence on certain types of imaging systems and possible variability of the clinical application of the results. In this way, Das et al. proposed a new framework for extracting the blood vasculature from RFIs by utilizing the Hessian-based Frangi vesselness filter to make thin structures stand out and reduce intensity variations between thick and thin arterial tree partitions [11]. They examine the filter using an experimental design of the U-Net model and determine Acc, recall, Spe, precision, and F1 score on multiple datasets, achieving a high Acc of 99.05–99.84%. Although the finding fairly shows that the proposed filter has achieved good improvement in the vessel segmentation techniques, this study does not adequately assess the filter’s robustness in terms of clinical application, which may reduce its practicality. Altogether, this study extends helpful knowledge for disease diagnosis through automated analysis of retinal images.
Another study by Kaur and Brar proposed a blood vessel segmentation approach that combines the Sine Tree-Seed Algorithm and Fuzzy C-mean for enhanced segmentation in RFIs [12]. This method of image enhancement uses adaptive histogram equalization for the enhancement of contrast and uses average filtration to reduce the amount of noise on an image prior to using STSA and FCM for the extraction of blood vessels. The approach is analyzed on the DRIVE and STARE datasets to show better efficacy than the existing techniques. Yet, the applied specific datasets in the study restrain the generalization of the approaches for a wide range of clinical conditions. Addanki and Sumathi focused on DR, one of the major diabetic complications that cause blindness among diabetic patients, through the advent of a current deep learning model, the DRLeU-Net, to perform segmented blood vessels from RFIs [13]. This method improves the general U-Net structure, which is beneficial in boosting actual time application, bearing in mind that it mitigates time and space dimensions. The evaluation was carried out on a publicly available dataset, and real results were also encouraging: AUC of 0.988, IoU of 0.94, and the equality found the proposed method to be superior to others in a number of ways. However, the work may be constrained and perhaps depend on a particular dataset and may need to be tested on other data sets before being generalized.
The proposed work presents a novel, fully automated system for segmenting blood vessels and quantifying clinical features within RFIs. The segmentation process comprises three primary stages: (1) a new image pre-processing pipeline, (2) a novel, fully automated segmentation method, and (3) a novel blood vessel linking algorithm. The main contributions of this work in every stage can be summarized as follows:
A new pipeline is implemented to optimize RFI quality for enhanced blood vessel visibility. It uses a logarithmic transform, an innovative denoising approach rooted in an improved complex wavelet transform (I-CWT), a shrinkage process, and finally, an anisotropic diffusion filtering.
We present a novel, fully automated segmentation method using an initial morphological filtering step (with linear structuring elements), followed by an advanced and optimized Canny edge detector.
A novel blood vessel linking algorithm is proposed to address the problem of discontinuous vessel segments and branches, enhancing the precision of extracted clinical features, such as vessel length, thickness, and tortuosity.
To assess the performance of the proposed blood vessel segmentation algorithms, the well-known DRIVE and high-resolution fundus (HRF) datasets of RFIs are employed. These datasets have been used because they often contain so-called ground truth (GT) images that were drawn by hand, allowing the proposed approach to be evaluated in terms of the degree of convergence it maintains with these GT images for segmentation results.
The organization of this work is as follows: Section 2 presents the proposed methodology for segmenting blood vessels and quantifying associated clinical parameters. The results and discussion for segmenting blood vessels and quantifying are presented in Section 3. Section 4 shows how the features of vessel blood are calculated, whereas Section 5 deals with the thickness of vessel blood. Finally, conclusions are given in Section 6, followed by some suggested future works.
2 The proposed system
Exploiting the model proposed for the segmentation of retinal blood vessels in fundus images in this study, eye care givers are able to screen diseases such as DR within a short span of time and obtain either the semi-automated or fully automated results. In addition, through telemedicine, providers of the eye can use remote and distributed fundus imaging in mainly local primary care and central ones to enhance the screening, which, in turn, requires the needed treatment. Telemedicine initiatives can, therefore, be supported by automated retinal screening models, of which the recommended model is proposed in this study. The proposed automated model concerns the web-based upload of the images of the retina for a specialist to provide evaluation results after analyzing the reports. There are two areas of contribution to this study: (i) design of a fully automated segmentation model that can boost the different anatomical areas in RFIs and interlink them, and (ii) design of a fully automated hybrid segmentation model for merging the different RFIs.
The novel automated system for segmenting retinal blood vessels and quantifying associated clinical features proposed is presented in Figure 2. Intended to increase diagnostic precision and decrease ophthalmologist burden, the system has three principal stages: image pre-processing, segmentation, and clinical feature extraction. An initial image pre-processing stage was implemented to enhance image quality for subsequent analysis. This involved the application of logarithmic transformation, I-CWT, and anisotropic diffusion filtering to optimize contrast, amplify blood vessel visibility, and reduce noise, respectively. Subsequently, a segmentation process was employed, incorporating morphological operations and an enhanced Canny edge detector to precisely delineate blood vessel structures. To bridge vessel discontinuities, a linking algorithm was applied. Finally, in the clinical feature extraction step, the segmented vessels are characterized to derive essential measures such as vessel roadmap of the proposed method for vessel segmentation and clinical feature extraction tortuosity and thickness and the overall length. These features are essential for the early indication of diseases such as retinopathy and cardiovascular diseases. The extracted clinical features can be used to evaluate the condition of the patient and produce knowledge to diagnose prematurely. This way, the system saves a substantial amount of time that ophthalmologists would otherwise spend diagnosing eye diseases manually, acting much faster and more accurately. This automated approach also enables retinal telemedicine because it enables healthcare professionals to upload images of the retina remotely and analyze them to increase the accessibility of retinal screening programs. Figure 3 illustrates the proposed methodology for connecting blood vessel segments (BVSs), presenting the discontinuities and the process to connect the blood vessel isolated segments.

Automated system proposed for segmenting blood vessels and quantifying associated clinical parameters. Source: Images obtained from DRIVE dataset.

Steps for linking the algorithm: (a) initial segmented image, (b) disconnected vessel endpoints highlighted (red circles), (c) binary circular structures superimposed, and (d) linked blood vessels. Images obtained from DRIVE dataset.
2.1 Image pre-processing stage
The primary objective of this stage is to enhance the retinal image quality by addressing non-uniform illumination, contrast normalization, and background noise reduction. The proposed image pre-processing pipeline consists of the following steps:
Green channel extraction: Isolating the green component from the color retinal image.
Illumination correction and contrast enhancement: Applying a logarithmic transformation to rectify uneven illumination and accentuate edge structures within the retinal image.
Noise reduction: Employing an improved dual-tree complex wavelet transform-based denoising technique to decompose the image and suppress noise through a shrinkage process.
Edge enhancement: Implementing anisotropic diffusion filtering to amplify the visibility of blood vessel edges in the RFI.
Apparently, human observers can identify the blood vessel structures in images of full-color contrast, though the proposed approach entails a computational maze through the three-color bandwidths, thereby protracting time in generating the final images with the segregated blood vessels. To counter this, the presented morphological filtering algorithm begins with the process of selecting the green channel of the input image. This channel offers superior differentiation between background and retinal blood vessels compared to other color channels, as illustrated in Figure 4c.
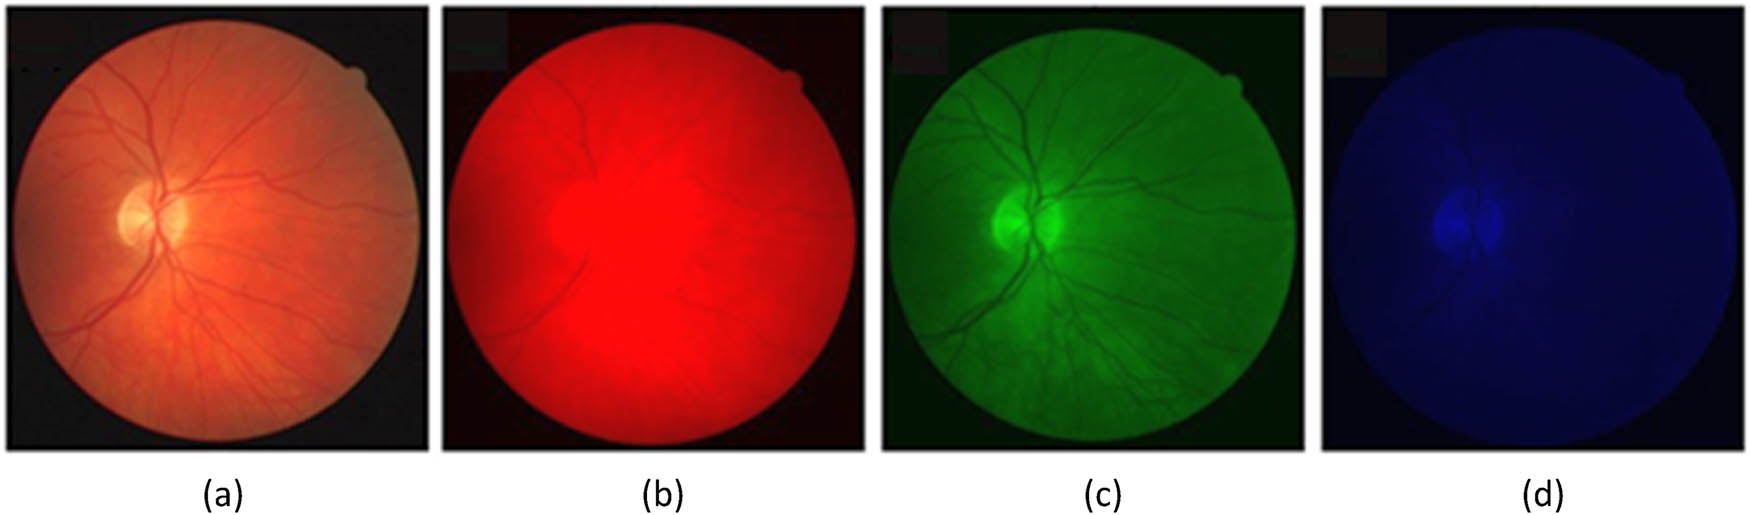
Comparative analysis of a color retinal image with its constituent color channels: (a) original image, (b) red channel, (c) green channel, and (d) blue channel. Images obtained from DRIVE dataset.
The steps followed by the segmentation algorithm are presented for an example image in Figure 5. Logarithmic transformation is a mathematical technique for enhancing contrast in retinal images [15]. This method effectively maps narrow pixel values with low intensities to a broad spectrum of output intensities. As a result, the dark areas of the image are stretched to greater intensity, resulting in a noticeable increase in the overall image contrast and brightness. When logarithmic functions are applied to pixel values, the method compresses high-intensity values, broadens low values, and thus highlights details that are normally not visible in contrast retinal images in a few cases are highlighted (Figure 5c). This technique has shown promise to improve visualization of vital structures in the retina and subsequently facilitates imaging analysis and used for diagnosis. A logarithmic transformation can be applied to the input image within the proposed system as follows:

Sequential overview of the proposed system’s output stages: (a) original input image, (b) isolated green channel, (c) image transformed by the logarithmic method, (d) result of applying the I-CWT, (e) output following adaptive AD filtering, (f) image after undergoing morphological operations, (g) final edge-detected image, and (h) superimposed visualization of the extent of the segmented image on the automated segmented image on the original retinal image. Images obtained from DRIVE dataset.
The modified output image, denoted as r″, is generated through the application of a logarithmic transformation to the green channel of the input image, represented by f. A constant value of 0.5 is assigned to parameter c. Logarithmic transformations are commonly employed to amplify the intensity levels within an image. Its particular efficacy lies in enhancing the visibility of details present in low-intensity regions. This technique is especially valuable for accentuating salient features when the image undergoes subsequent transformational processing.
Then, an I-CWT was carried out as a dependable image denoising method to denoise the retinal image without losing the details of blood vessels, including edges and curves (Figure 5d). Classical methods of denoising based on wavelets are known to have some disadvantages, for example, shift sensitivity, oscillatory artefacts, aliasing, and insufficient directionality [16]. In this work, an I-CWT, including a shrinkage process, was used to reduce the noise and enhance the weak patterns of the retinal blood vessel in the image. Wavelet shrinkage denoising is primarily based on thresholding wavelet coefficients, as for the core idea of wavelet-based shrinkage denoising. A lot of coefficients have small values, and several coefficients may contain very negligible values, which indicate the noises and small features of the images, whereas the coefficients with high amplitudes contain significant features of the images. In order to get enhanced visibility of the blood vessels, an AD filter [17] was applied as follows:
where t is the threshold value used to enable/disable a pixel, which can be optimized in the binary classification process (see Section 3.3), and
The effect of this filtering is shown in Figure 5e, where the blood vessels appear smoother compared to that in Figure 5d, allowing for improved subsequent traceability.
2.2 Image segmentation stage
This phase is composed of two groups of operations. First, morphological operations to extract accurately the image components, and then the detection procedure of edges, which follows the following four steps: noise reduction, vessel segmentation, morphological refinement, and vessel linking.
2.2.1 Morphological operations
Morphological operations have demonstrated efficacy in characterizing and representing the geometric structures within an image, focusing on shape attributes rather than pixel intensities. The key examples of extracted features include boundaries, skeletons, and convex hulls [18]. In this work, the proposed morphological operations consist of a sequential application of several image processing techniques, such as (i) an opening operation utilizing a 3-pixel disk-shaped structuring element, (ii) background subtraction to isolate foreground objects from the image background, (iii) to apply a sigmoid function to the image in order to mitigate the impact of non-uniform illumination, and (iv) an erosion process to enhance the visibility of retinal blood vessels (Figure 5f).
2.2.2 Edge detection
The suggested blood vessel detection approach was designed to meticulously retain the salient structural features of vessel boundaries while effectively suppressing irrelevant artefacts. As illustrated in Figure 5g, the methodology comprises the following sequential steps: (i) noise reduction, (ii) vessel segmentation, (iii) morphological refinement, and (iv) vessel linking.
In relation to noise reduction, the image is subject to another morphological operation of a two-dimensional Gaussian filter, which has the effect of reducing noise, which was produced during earlier morphological operations. The 2D Gaussian filter is a non-uniform low-pass filter whose 2D filter coefficients are computed from the following Gaussian form:
(7)Here, (0,0) is the filter center, and σ refers to the standard deviation of the Gaussian filter.
According to the vessel segmentation, an enhanced Canny edge detector was utilized to precisely delineate the blood vessel network. To enhance image quality prior to edge detection, a Gaussian filter was initially applied to attenuate noise levels. Subsequently, the gradient magnitude and direction were calculated for each pixel within the enhanced image. A non-maxima suppression algorithm was then employed in conjunction with hysteresis thresholding to identify and mark edge pixels based on their gradient characteristics. The primary motivation for implementing the enhanced Canny edge detector was to address several critical limitations inherent in standard edge detection techniques. Specifically, the modified algorithm aimed to reduce false edge responses, minimize the omission of genuine edges, and enhance the Acc of edge localization relative to the GT. By achieving these objectives, the enhanced Canny edge detector is expected to significantly contribute to the precise detection of retinal blood vessels.
In the third step, a closing morphological operation (called morphological refinement) was performed to maintain the real thickness of the detected vessels as well as to remove noise within the segmented image.
Finally, a new blood vessel linking algorithm is performed to overcome the shortcomings in which the segmented blood vessels of the retinal image appear to be discontinuous due to several effects as obscured vessel segments or image noise. This proposed algorithm was executed in three stages: (a) initially, a skeletal representation of the blood vessels within the segmented retinal image was generated, and their endpoints were identified; (b) subsequently, a circular structural element, with a radius equivalent to half the maximum distance between any two vessel segments, was centered at each vessel endpoint, and (c) intersections of these elements defined possible associability to connect the vessel segments. Figure 5c and d shows the effect of applying this algorithm.
In conclusion, the thinning that has been applied to the whole image allowed one-pixel width lines to run through the vessel endpoints only but maintain the structures of the detected vessels, as shown in Figure 5d.
3 Experimental results
This section presents a comprehensive evaluation of the novel, fully automated system designed in this work for retinal blood vessel segmentation. To assess the system’s performance and accuracy, extensive experiments were conducted utilizing the challenging DRIVE [14] and HRF [19] datasets. The methodology involves a detailed description of the employed datasets, followed by a rigorous analysis of the proposed segmentation system, including comparisons to GT data and state-of-the-art methods. The system development and experimentation were executed using MATLAB R2019a on a Windows 10 Pro platform equipped with an Intel(R) Core (TM) i7-4510U CPU and 4 GB RAM.
3.1 DRIVE and HRF datasets
The efficacy of the proposed segmentation approach was evaluated using the publicly accessible DRIVE and HRF RFI datasets. Renowned for their associated GT images, meticulously annotated by multiple human experts, these datasets facilitate rigorous performance assessment. By comparing segmentation results against the GT, the system’s reliability and efficiency can be objectively measured. The objective of these datasets is to foster comparative analyses and advancements in automated blood vessel segmentation within retinal fundus imagery.
The DRIVE dataset [14] constitutes a collection of 40 color retinal images partitioned into training and testing subsets, each containing 20 images. Accompanying each image is a mask delineating the field of view (FOV) and a corresponding GT image. Expert annotations were provided for blood vessels in the training set images, which were subsequently utilized to optimize the proposed segmentation algorithms’ parameters. Conversely, the testing set’s vessel annotations were independently generated by two experts to ensure unbiased performance evaluation. Derived from a cohort of 400 diabetic patients aged 25–90 in the Netherlands, the dataset comprises 33 images without DR and 7 with mild early-stage indications. Taken with a Canon CR5 non-mydriatic 3-CCD camera with an FOV of 45°, the images are 8-bit color and are 768 × 584 pixels in TIFF (Tag Image File Format) format. Some original sample RFIs, along with the GT provided manually from the DRIVE dataset, are shown in Figure 6.

Sample of an image from the DRIVE dataset: (a) original fundus image, (b) FOV mask, (c) manual segmentation by expert 1, and (d) manual segmentation by expert 2.
The HRF dataset [19] comprises 45 RFIs obtained from three distinct patient cohorts: the lowest level of vascular endothelial growth factor expression was observed in healthy controls, intermediate in DR patients, and highest in glaucoma patients. Each group provided 15 monochromatic images obtained with a mydriatic CANON CF-60UVi fundus camera with a 60-degree FOV. These are 24-bit color JPEG images in the size of 3,504 × 2,336 pixels and the size of each pixel is 6.05 μm × 6.46 μm. In this study, the HRF dataset was used for evaluating the proposed model. Some sample images from the HRF dataset are depicted in Figure 7, along with their GT segmentations. For the comparison of the image within the region of interest, the FOV masks are circular binary masks (Figure 7b). All the images were manually segmented for blood vessels by three retinal image interpretation experts for each image.

Samples of the HRF dataset: (a) original image, (b) field of view (FOV) mask, and (c) ground truth segmentation done by human annotator.
3.2 Evaluation matrices
Using a binary classification, the input image is divided into vessel and non-vessel pixels by the proposed algorithm. If a pixel is correctly segmented as a vessel and also exists in the GT image, then it is said to be a true positive. On the other hand, the pixel that is detected by the algorithm as a vessel and is not marked as a vessel in the GT map is considered a false positive (Table 1). To assess the efficacy of the proposed algorithms, five standard quantitative metrics were computed: Acc, Sen, Spe, PPV, and NPV. These metrics are computed as averages across the dataset. The following nomenclature is employed in this work: TP for true positives, TN for true negatives, FP for false positives, and FN for false negatives.
Confusion matrix definition
| Vessel present | Vessel absent | |
|---|---|---|
| Vessel detected | TP | FP |
| Vessel not detected | FN | TN |
Acc is defined as the percentage of correctly classified pixels to the total number of pixels within the FOV mask, given by
Sen is the ratio of TP to the total number of vessels given by
Spe is the ratio of TN to the total number of non-vessels pixels, expressed by
PPV is the proportion of TP pixels out of the whole referred pixels, given by
Finally, the NPV is the ratio of the TN pixels, which is the non-vessel pixels over the total number of pixels predicted as non-vessel, for instance, background. It can be calculated as
The interpretation of the confusion matrix, together with the employed performance metrics, is given in Table 1.
3.3 DRIVE dataset results
Initially, the efficacy of our segmentation system in identifying retinal blood vessels is assessed using the DRIVE dataset. Rigorous experiments were conducted on the training set images to optimize the parameter values for maximizing segmentation accuracy. For example, in the suggested morphological filtering approach (equation (2)), λ and t were established at 0.20 and 5, respectively. A 7 × 7 pixel Gaussian filter was employed, while the low and high thresholds were fixed at 25 and 40, respectively. A binary classification process was employed to categorize each pixel within the image as either a vessel or non-vessel based on a threshold value t. To optimize the threshold, a segmentation accuracy metric was calculated for a series of 100 experiments. In each iteration, the threshold value t was incremented by 0.1. The results for the evaluation metrics considered are given in Table 2 for the testing set of the DRIVE dataset.
Comparative analysis of metrics for the proposed segmentation system using the DRIVE dataset (testing set)
| Matrices | Observer 1 | Observer 2 | Average |
|---|---|---|---|
| Acc | 98.67 | 99.33 | 99 |
| Sen | 95.39 | 96.27 | 95.83 |
| Spe | 99.11 | 98.13 | 98.62 |
| PPV | 90.12 | 92.56 | 91.34 |
| NPV | 92.23 | 95.78 | 94 |
Bold values represent higher value per parameter.
Table 2 shows the qualitative performance of the proposed segmentation system to the testing set of the DRIVE dataset observed by two observers. The system achieves high results, demonstrating 98.67% Acc according to Observer 1 and 99.33% for Observer 2. This means that the system is very efficient in defining true retinal vasculature pixels of an image (av. 99%). The value for Sen, which in a way calculates the TP, is also good with a mean of 95.83%, but as we can see, it is somewhat lower than the Acc of the algorithm. This implies that although the system has high detection of blood vessels, there exists a possibility of some TP being missed.
Another positive result can be observed when it comes to the level of Spe, where there is an average of 98.62%. These results indicate that the system is effective at recognizing areas that are NOT part of the vessel. Observer 1 recorded 99.11% Spe, which is slightly higher than Observer 2 with 98.13%. In the case of PPV, the percentage of correctly identified vessel pixels, we can observe more variation between the observers with the average PPV of 91.34%. This value is not bad and implies that there is a moderate rate of FP for the given data. The NPV, which indicates the overall performance of the algorithm in correctly classifying non-vessel pixels, is also very high, with an average of 94%, thus offering great assurance in classifying non-vessel areas.
Overall, this research demonstrates that the system possesses favorable results in all the metrics for its performance, especially Acc and Spe since these are significant factors when it comes to segmentation in medical image applications. The trade-offs are slightly lower Sen and PPV, which points to the opportunities for optimizing its functioning and decreasing the number of FP and FN results. The differences between the observers mean that while the fully automated system was quite stable in the assessment of the video, it could be improved in its equality for different reliable evaluators. With the objective of evaluating our proposed vessel segmentation against several conventional methods, a comparison of results was performed and is shown in Table 3, using the DRIVE dataset.
Comparison of vessel segmentation algorithms using the DRIVE dataset
| Ref. | Acc | Sen | Spe | PPV | NPV |
|---|---|---|---|---|---|
| Jin et al. [20] | 96.97 | 78.94 | 98.70 | 85.37 | — |
| Dasgupta and Singh [21] | 95.33 | 76.91 | 98.01 | 84.98 | — |
| Yang et al. [22] | 95.83 | 73.93 | 97.92 | 77.70 | 97.53 |
| Kishore and Ananthamoorthy [23] | 94.1 | 69.9 | 95.8 | 85.5 | 94.8 |
| Tamim et al. [24] | 96.07 | 75.42 | 98.43 | 86.34 | 96.53 |
| Yang et al. [25] | 95.22 | 71.81 | 97.47 | 89.23 | 98.5 |
| Yang et al. [26] | 94.21 | 75.60 | 96.96 | 78.54 | 96.44 |
| Keerthiveena et al. [27] | 94.71 | 92.7 | 95.6 | 92.49 | 95.7 |
| This work | 99.33 | 96.27 | 98.13 | 92.56 | 95.78 |
Bold values represent higher value per parameter.
The suggested system performs far better than all the competing methods in terms of almost all the assessment parameters, including Acc (99.33%) and Sen (96.27%). It also proves that we have very high accuracy of the proposed system for the classification of both vessel and non-vessel pixels. This is clearly evident from the outstanding Sen score, as depicted from the capability of the vessel pixels detection; hence, it has a low probability of omission on true vessel pixels.
Compared with Jin et al. [20] and other advanced methods, while the Spec (98.13%) of the proposed system is slightly lower than the rest of the methods compared, the proposed system is superior in other aspects. Here, the Spec score has also remained high so that the proposed system achieves a high level of possibility to detect the non-vessel pixels. The PPV of the proposed system, which is 92.56%, shows that it has a high degree of accuracy in detecting true vessel pixels from the vessel group. This is particularly important in diagnostics, where false alarms are massively detrimental since patients may be subjected to invasive procedures that are not required. Also, the NPV of 95.78% transmits that 95.78% of the negative cases or those that are not associated with the disease also accurately had negative tests. This value also enhances the confidence of the system in detecting the non-vessel pixels and hence reduces the tendency of the system to miss out on some pixels as wrong.
In comparison with the methods worked out at the present state of the art, like Keerthiveena et al. [27], where they have the highest value of 92.7% for Sen, our proposed system provides even higher results both in terms of Sen, Acc, and PPV. This means that the proposed system is fairer and stronger to address the problem of vessel segmentation than previous studies since it reduces comparative results on FP and FN cases. Due to the high accuracy and sensitivity of the proposed system, the suggested approach would be very beneficial where an extremely accurate and sensitive segmentation of the retinal vessels is needed, for example, in the clinical context. In diseases such as DR or macular degeneration, it is very important to be able to distinguish vessels with a relatively low error rate.
3.4 HRF dataset results
This section gives the performance assessment of the proposed vessel segmentation method utilizing the HRF database. The same parameter configuration optimized on the DRIVE dataset was employed for consistency. To assess the performance, the usual five standard evaluation metrics were computed by comparing the algorithm outputs to GT images provided within the HRF dataset. The resulting metrics are tabulated in Table 4.
Comparative assessment of the proposed approach for the HRF dataset
| Matrices | The proposed system |
|---|---|
| Acc | 99.11 |
| Sen | 97.97 |
| Spe | 98.97 |
| PPV | 97.98 |
| NPV | 100 |
Table 4 shows how the proposed segmentation method has a very high level of accuracy and can be considered robust. Specifically, with an Acc of 99.11%, the system works reliably in the detection of the retinal vessels, thus suggesting that it correctly classified most of the pixels contained in the images. A Sen of 97.97% underlines the ability of the system to identify TPs, meaning almost all real-life structures of vessels are detected. This is important in areas such as medicine, where the absence of vessel structures can result in wrong identification. Furthermore, a value of 98.87% for Spe comprises the precise recognition of the non-vessel regions, thus reducing wrong localization or excessive segmentation of the image. The PPV was 97.98%, giving the measure on how accurately detects the vessel pixels by the system, thus showing that in case the system recognizes a pixel as part of a vessel, then it will most probably be right. Last, an ideal NPV of 100% means that none of the pixels, which have been classified as non-vessel, actually contain vessels; thus, there is no possibility of FN results. Following the same strategy of comparison with DRIVE dataset, a comparative analysis of our blood vessel segmentation methods against contemporary state-of-the-art methods was conducted utilizing the HRF dataset. These results are tabulated in Table 5.
Comparison with vessel segmentation methods using the HRF dataset
| Ref. | Acc | Sen | Spe | PPV | NPV |
|---|---|---|---|---|---|
| Kishore and Ananthamoorthy [23] | 99.6 | 76.52 | 98.5 | 87.9 | 96 |
| Yang et al. [26] | 95.17 | 79.15 | 96.76 | 70.79 | 97.90 |
| Yang et al. [22] | 95.49 | 72.65 | 97.40 | 70.03 | 97.71 |
| Yan et al. [28] | 94.37 | 78.81 | 95.92 | 66.47 | – |
| Upadhyay et al. [29] | 95.2 | 75 | 97.2 | 72.7 | – |
| This work | 99.11 | 97.97 | 98.97 | 97.98 | 100 |
Based on Table 5, it is possible to conclude about high general performance level and the best results in Sen and NPV, which are both significant for medical image analysis. The suggested system yields an Acc of 99.11%, which is slightly lower than Kishore and Ananthamoorthy’s method (99.6%), showing that this method yields a high reliability of the classification of vessel and non-vessel pixels. In the case of Sen, the proposed system achieves the best result, which is 97.97%; that is, it can identify TPs at 97%, which means that almost all blood vessels are correctly segmented. This is very important in diagnosis because the next closest figure to the Sen score in the rest of the methods is much lower (72–79%). The system also has a very good Spe of 98.87%, having a correct identification of no-vessel areas with low FPs. Also, a PPV of 97 98% is higher than other compared methods and gives a good level of confidence in the identified vessel pixels into their respective classes. Its perfect NPV of 100% is redoing, especially in the aspect that it guarantees that none of the vessel pixels are obscured as background, which leads to highly fatal diagnostic negligence.
4 Clinical features
Alterations in the retinal blood vessel morphology, such as changes in tortuosity, density, thickness, and length or the emergence of retinal lesions, have been correlated with the development of cardiovascular and retinopathic diseases. Consequently, automated quantitative analysis of these vascular abnormalities holds significant potential for ophthalmologists and eye specialists in early detection, severity assessment, and treatment monitoring of various retinopathies. The primary objective of this study is to establish an automated procedure for comprehensively analyzing the retinal blood vessel network. A crucial component of this process involves the precise and objective extraction of a range of morphological features directly from the detected blood vessels. These features for vessels, indicative of retinal vascular health, include (i) length, (ii) density, (iii) tortuosity, and (iv) thickness.
4.1 Vessel length
To measure the length of each retinal blood vessel segment (RBFVS), the skeleton of the vessel was first identified. Then, the total distance between the consecutive pixels within the segment was computed by the following equation:
where
4.2 Vessel density
The density of the retinal blood vessels was determined by calculating the percentage of the total surface area, which was occupied by the blood vessel pixels given by
where N pix is the total sum of pixels for all the vessels presents in the image, and A IM is the total area of the foveal image (mm2).
4.3 Vessel tortuosity
Its objective is to establish the average tortuosity coefficient of the total retinal vasculature. From the initial framework of the blood vessels, the branch points created in the vascular network were mapped to split the length of each BVS into a total number of b branch segments according to the following summation:
where s i is the length of the ith branch segment within the BVS.
Therefore, the tortuosity BVS coefficient index (TC) is calculated as
where
where
4.4 Vessel thickness
Retinal blood vessel thickness is thus defined as the mean diameter of the retinal vasculature in this work. A distance transform was performed on the inverse of the binary blood vessel image to determine the Euclidean distance of every vessel pixel to the nearest border. Pixels with maximum distance values were identified as the vessel centerlines. A tolerance was applied to account for floating-point computations. The average of all calculated distances represented the vessel's half-width, and the vessel thickness was determined by doubling this value.
5 Conclusion
This work presents a new model for the segmentation of blood vessels in RFIs, where problem areas like low contrast, weak edges’ detection, and inconsistent contrast have been enhanced. Macular degeneration and DR are leading causes of reduced visual acuity; therefore, proper analysis of the retina is important. The proposed model improves the quality of the image through a new pre-processing step that comprises logarithmic image enhancement noise removal by use of an I-CWT, followed by shrinkage and anisotropic diffusion pre-processing for improving intensity at edges. The type of segmentation used in the work employs morphological operation in conjunction with a modified Canny edge detector to segment and classify blood vessels.
Quantitative analysis of the RFIs has been reported for the screening, diagnosis, and therapeutic monitoring of ophthalmologic diseases, including choroidal neovascularization, glaucoma, DR, hypertension and arteriosclerosis, vein occlusion, and macular degeneration. From these diseases, macular degeneration and DR are considered to cause vision loss significantly. Blood vessel segmentation is one of the prerequisites for quantitative analysis of RFIs, and the images of the retinal fundus where several of the most valuable clinical characteristics, such as tortuosity, thickness, length, and density of blood vessels, can be derived from the tree of segmented vessels. The outcomes calculated were Acc, Sen, Spe, PPV, and NPV, with an average value using the DRIVE dataset of 99, 95.83, 98.62, 91.34, and 94%, respectively (Table 2). Moreover, the same outcomes generated with the help of the HRF were Acc, Sen, Spe, PPV, and NPV, with average values of 99.11, 97.97, 98.97, 97.98, and 100%, respectively (Table 4). These results are compared with the gold standard and state of the art, and, in both cases, it seems to be the best as per prominent features.
The limitations of this study can be summarized as follows:
Low-quality images: while the proposed model deals with drawbacks such as low image quality and contrast in fundus images, it is prone to more intensive noise, occlusions, and artefacts in practical clinical applications and may have a limited ability to generalize to other datasets.
Dependency on pre-processing techniques: segmentation reliability mainly concerns the pre-processing methodology, including logarithmic contrast enhancement and anisotropic diffusion filtering. Any distortion in image quality affects the performance of these steps, and the results may not always be uniform, especially when dealing with complicated cases.
Limited dataset validation: it has been tested on DRIVE and HRF sets, but its performance on various other datasets of retinal images or in more diverse pathologies has not been determined, which limits its usefulness for a variety of patients in clinical practice. For future work, it is recommended to use a new swarm optimization algorithm to select the best features and propose new deep/machine learning for classifying the images.
Acknowledgement
We thank Institute of Oceanic Engineering Research (University of Malaga, Malaga, Spain) for its support.
-
Funding information: This research was funded by a grant (PCM-00006) from the Regional Government of Andalusia (Spain) through the Project “CAMSUB3D: Advanced 3D camera for optimized underwater imaging and wireless charging” (Cod.25046, Complementary Plan for Marine Sciences and the Recovery, Transformation and Resilience Plan).
-
Author contributions: Conceptualization: M.A.L.N.; methodology: A.I.M.A. and M.A.L.N.; modelling and simulation: A.I.M.A.; validation: M.A.L.N. and A.I.M.A.; investigation: A.I.M.A.; resources: M.A.L.N.; writing – original draft preparation: A.I.M.A.; writing – review and editing: M.A.L.N.; visualization: A.I.M.A.; supervision: M.A.L.N.; project administration: M.A.L.N.; funding acquisition: M.A.L.N. All authors have read and agreed to the published version of the manuscript.
-
Conflict of interest: The authors declare no competing interests.
-
Declarations: The authors declare that there are no known conflicts of interest associated with this publication, and there has been no significant financial support for this work that could have influenced its outcome. We confirm that the manuscript has been read and approved by all named authors and that there are no other persons who satisfied the criteria for authorship. We further confirm that the order of authors listed in the manuscript has been approved by all authors.
-
Ethics approval and consent to participate: Not applicable.
-
Consent for publication: Not applicable.
-
Data availability statement: Publicly available datasets were used and analyzed in this study: DRIVE and HRF.
References
[1] Al-Fahdawi S, Al-Waisy AS, Zeebaree DQ, Qahwaji R, Natiq H, Mohammed MA, et al. Fundus-deepnet: Multi-label deep learning classification system for enhanced detection of multiple ocular diseases through data fusion of fundus images. Inf Fusion. 2024;102:102059. 10.1016/j.inffus.2023.102059.Suche in Google Scholar
[2] Abdulsahib AA, Mahmoud MA, Aris H, Gunasekaran SS, Mohammed MA. An automated image segmentation and useful feature extraction algorithm for retinal blood vessels in fundus images. Electronics. 2022;11(9):1295. 10.3390/electronics11091295.Suche in Google Scholar
[3] Abdulsahib AA, Mahmoud MA, Mohammed MA, Rasheed HH, Mostafa SA, Maashi MS. Comprehensive review of retinal blood vessel segmentation and classification techniques: intelligent solutions for green computing in medical images, current challenges, open issues, and knowledge gaps in fundus medical images. Netw Model Anal Health Inform Bioinf. 2021;10:1–32. 10.1007/s13721-021-00294-7.Suche in Google Scholar
[4] Lal S, Rehman SU, Shah JH, Meraj T, Rauf HT, Damaševičius R, et al. Adversarial attack and defence through adversarial training and feature fusion for diabetic retinopathy recognition. Sensors. 2021;21(11):3922. 10.3390/s21113922.Suche in Google Scholar PubMed PubMed Central
[5] Seyala N, Abdullah SN. Cluster analysis on longitudinal data of patients with kidney dialysis using a smoothing cubic B-spline model. Int J Math Stat Comput Sci. 2023;2:85–95. 10.59543/ijmscs.v2i.8337.Suche in Google Scholar
[6] Radha K, Karuna Y. Retinal vessel segmentation to diagnose diabetic retinopathy using fundus images: A survey. Int J Imaging Syst Technol. 2024;34(1):e22945. 10.1002/ima.22945.Suche in Google Scholar
[7] Van Eijgen J, Fhima J, Billen Moulin-Romsée MI, Behar JA, Christinaki E, Stalmans I. Leuven-haifa high-resolution fundus image dataset for retinal blood vessel segmentation and glaucoma diagnosis. Sci Data. 2024;11(1):257. 10.1038/s41597-024-03086-6.Suche in Google Scholar PubMed PubMed Central
[8] Prakash SA, Denisha M. Enhancing retinal image analysis through deep learning-based blood vessel segmentation. In 2024 10th International Conference on Communication and Signal Processing (ICCSP). IEEE; 2024. p. 1532–7. 10.1109/ICCSP60870.2024.10543639.Suche in Google Scholar
[9] Singh LK, Khanna M, Thawkar S, Singh R. Deep-learning based system for effective and automatic blood vessel segmentation from Retinal fundus images. Multimed Tools Appl. 2024;83(2):6005–49. 10.1007/s11042-023-15348-3.Suche in Google Scholar
[10] Almeida J, Kubicek J, Penhaker M, Cerny M, Augustynek M, Varysova A, et al. Enhancing ROP plus form diagnosis: an automatic blood vessel segmentation approach for newborn fundus images. Results Eng. 2024;24:103054. 10.1016/j.rineng.2024.103054.Suche in Google Scholar
[11] Das S, Chakraborty S, Mishra M, Majumder S. Assessment of retinal blood vessel segmentation using U-Net model: A deep learning approach. Frankl Open. 2024;8:100143. 10.1016/j.fraope.2024.100143.Suche in Google Scholar
[12] Kaur R, Brar R. Blood Vessel Segmentation Using FCM–STSA Method for Retinal Fundus Images. J Inst Eng (India): Ser B. 2024;105:1–14. 10.1007/s40031-024-01019-w.Suche in Google Scholar
[13] Addanki S, Sumathi D. RLeU-Net: Segmentation of blood vessels in retinal fundus images for diabetic retinopathy screening. Multimed Tools Appl. 2024;1–22. 10.1007/s11042-024-19159-y.Suche in Google Scholar
[14] Korotkova O, Salem M, Dogariu A, Wolf E. Changes in the polarization ellipse of random electromagnetic beams propagating through the turbulent atmosphere. IEEE Trans Med Imaging. 2004;23(4):501–9. 10.1080/17455030500184511.Suche in Google Scholar
[15] Singh N, Bhandari AK. Image contrast enhancement with brightness preservation using an optimal gamma and logarithmic approach. IET Image Process. 2020;14(4):794–805. 10.1049/iet-ipr.2019.0921.Suche in Google Scholar
[16] Raj VNP, Venkateswarlu T. Denoising of medical images using dual tree complex wavelet transform. Procedia Technol. 2012;4:238–44. 10.1016/j.protcy.2012.05.036.Suche in Google Scholar
[17] Perona P, Malik J. Scale-space and edge detection using anisotropic diffusion. IEEE Trans Pattern Anal Mach Intell. 1990;12(7):629–39. 10.1109/34.56205.Suche in Google Scholar
[18] De I, Chanda B, Chattopadhyay B. Enhancing effective depth-of-field by image fusion using mathematical morphology. Image Vis Comput. 2006;24(12):1278–87. 10.1016/j.imavis.2006.04.005.Suche in Google Scholar
[19] Odstrcilik J, Kolar R, Budai A, Hornegger J, Jan J, Gazarek J, et al. Retinal vessel segmentation by improved matched filtering: Evaluation on a new high-resolution fundus image database. IET Image Process. 2013;7(4):373–83. 10.1049/iet-ipr.2012.0455.Suche in Google Scholar
[20] Jin Q, Meng Z, Pham TD, Chen Q, Wei L, Su R. DUNet: A deformable network for retinal vessel segmentation. Knowl Syst. 2019;178(8):149–62. 10.1016/j.knosys.2019.04.025.Suche in Google Scholar
[21] Dasgupta A, Singh S. A fully convolutional neural network based structured prediction approach towards the retinal vessel segmentation. Proc - Int Symp Biomed Imaging. 2017;248–51. 10.1109/ISBI.2017.7950512.Suche in Google Scholar
[22] Yang Y, Shao F, Fu Z, Fu R. Blood vessel segmentation of fundus images via cross-modality dictionary learning. Appl Opt. 2018;57(25):7287. 10.1364/ao.57.007287.Suche in Google Scholar
[23] Kishore B, Ananthamoorthy NP. Glaucoma classification based on intra-class and extra-class discriminative correlation and consensus ensemble classifier. Genomics. 2020;112(5):3089–96. 10.1016/j.ygeno.2020.05.017.Suche in Google Scholar PubMed
[24] Tamim N, Elshrkawey M, Azim GA, Nassar H. Retinal blood vessel segmentation using hybrid features and multi-layer perceptron neural networks. Symmetry (Basel). 2020;12(6):894. 10.3390/SYM12060894.Suche in Google Scholar
[25] Yang J, Huang M, Fu J, Lou C, Feng C. Frangi based multi-scale level sets for retinal vascular segmentation. Comput Methods Prog Biomed. 2020;197:105752. 10.1016/j.cmpb.2020.105752.Suche in Google Scholar PubMed
[26] Yang Y, Shao F, Fu Z, Fu R. Discriminative dictionary learning for retinal vessel segmentation using fusion of multiple features. Signal, Image Video Process. 2019;13(8):1529–37. 10.1007/s11760-019-01501-9.Suche in Google Scholar
[27] Keerthiveena B, Esakkirajan S, Selvakumar K, Yogesh T. Computer-aided diagnosis of retinal diseases using multidomain feature fusion. Int J Imaging Syst Technol. 2020;30(2):367–79. 10.1002/ima.22379.Suche in Google Scholar
[28] Yan Z, Yang X, Cheng KT. Joint segment-level and pixel-wise losses for deep learning based retinal vessel segmentation. IEEE Trans Biomed Eng. 2018;65(9):1912–23. 10.1109/TBME.2018.2828137.Suche in Google Scholar PubMed
[29] Upadhyay K, Agrawal M, Vashist P. Unsupervised multiscale retinal blood vessel segmentation using fundus images. IET Image Process. 2020;14(11):2616–25. 10.1049/iet-ipr.2019.0969.Suche in Google Scholar
© 2025 the author(s), published by De Gruyter
This work is licensed under the Creative Commons Attribution 4.0 International License.
Artikel in diesem Heft
- Research Articles
- Synergistic effect of artificial intelligence and new real-time disassembly sensors: Overcoming limitations and expanding application scope
- Greenhouse environmental monitoring and control system based on improved fuzzy PID and neural network algorithms
- Explainable deep learning approach for recognizing “Egyptian Cobra” bite in real-time
- Optimization of cyber security through the implementation of AI technologies
- Deep multi-view feature fusion with data augmentation for improved diabetic retinopathy classification
- A new metaheuristic algorithm for solving multi-objective single-machine scheduling problems
- Estimating glycemic index in a specific dataset: The case of Moroccan cuisine
- Hybrid modeling of structure extension and instance weighting for naive Bayes
- Application of adaptive artificial bee colony algorithm in environmental and economic dispatching management
- Stock price prediction based on dual important indicators using ARIMAX: A case study in Vietnam
- Emotion recognition and interaction of smart education environment screen based on deep learning networks
- Supply chain performance evaluation model for integrated circuit industry based on fuzzy analytic hierarchy process and fuzzy neural network
- Application and optimization of machine learning algorithms for optical character recognition in complex scenarios
- Comorbidity diagnosis using machine learning: Fuzzy decision-making approach
- A fast and fully automated system for segmenting retinal blood vessels in fundus images
- Application of computer wireless network database technology in information management
- A new model for maintenance prediction using altruistic dragonfly algorithm and support vector machine
- A stacking ensemble classification model for determining the state of nitrogen-filled car tires
- Research on image random matrix modeling and stylized rendering algorithm for painting color learning
- Predictive models for overall health of hydroelectric equipment based on multi-measurement point output
- Architectural design visual information mining system based on image processing technology
- Measurement and deformation monitoring system for underground engineering robots based on Internet of Things architecture
- Face recognition method based on convolutional neural network and distributed computing
- OPGW fault localization method based on transformer and federated learning
- Class-consistent technology-based outlier detection for incomplete real-valued data based on rough set theory and granular computing
- Detection of single and dual pulmonary diseases using an optimized vision transformer
- CNN-EWC: A continuous deep learning approach for lung cancer classification
- Cloud computing virtualization technology based on bandwidth resource-aware migration algorithm
- Hyperparameters optimization of evolving spiking neural network using artificial bee colony for unsupervised anomaly detection
- Classification of histopathological images for oral cancer in early stages using a deep learning approach
- A refined methodological approach: Long-term stock market forecasting with XGBoost
- Enhancing highway security and wildlife safety: Mitigating wildlife–vehicle collisions with deep learning and drone technology
- An adaptive genetic algorithm with double populations for solving traveling salesman problems
- EEG channels selection for stroke patients rehabilitation using equilibrium optimizer
- Influence of intelligent manufacturing on innovation efficiency based on machine learning: A mechanism analysis of government subsidies and intellectual capital
- An intelligent enterprise system with processing and verification of business documents using big data and AI
- Hybrid deep learning for bankruptcy prediction: An optimized LSTM model with harmony search algorithm
- Construction of classroom teaching evaluation model based on machine learning facilitated facial expression recognition
- Artificial intelligence for enhanced quality assurance through advanced strategies and implementation in the software industry
- An anomaly analysis method for measurement data based on similarity metric and improved deep reinforcement learning under the power Internet of Things architecture
- Optimizing papaya disease classification: A hybrid approach using deep features and PCA-enhanced machine learning
- Handwritten digit recognition: Comparative analysis of ML, CNN, vision transformer, and hybrid models on the MNIST dataset
- Multimodal data analysis for post-decortication therapy optimization using IoMT and reinforcement learning
- Predicting early mortality for patients in intensive care units using machine learning and FDOSM
- Uncertainty measurement for a three heterogeneous information system based on k-nearest neighborhood: Application to unsupervised attribute reduction
- Genetic algorithm-based dimensionality reduction method for classification of hyperspectral images
- Power line fault detection based on waveform comparison offline location technology
- Assessing model performance in Alzheimer's disease classification: The impact of data imbalance on fine-tuned vision transformers and CNN architectures
- Hybrid white shark optimizer with differential evolution for training multi-layer perceptron neural network
- Evaluation of computer network data security based on a deep learning algorithm
- Review Articles
- A comprehensive review of deep learning and machine learning techniques for early-stage skin cancer detection: Challenges and research gaps
- An experimental study of U-net variants on liver segmentation from CT scans
- Strategies for protection against adversarial attacks in AI models: An in-depth review
- Resource allocation strategies and task scheduling algorithms for cloud computing: A systematic literature review
- Latency optimization approaches for healthcare Internet of Things and fog computing: A comprehensive review
- Explainable clustering: Methods, challenges, and future opportunities