Comorbidity diagnosis using machine learning: Fuzzy decision-making approach
-
Dheyauldeen M. Mukhlif
 ,
Dhafar Hamed Abd
,
Dhafar Hamed Abd
 ,
Ridha Ejbali
,
Adel M. Alimi
,
Mohammed Fadhil Mahdi
und
Abir Jaafar Hussain
,
Ridha Ejbali
,
Adel M. Alimi
,
Mohammed Fadhil Mahdi
und
Abir Jaafar Hussain

Abstract
Comorbidity, the simultaneous existence of multiple medical conditions in a patient, is a major challenge in healthcare. Comorbidity is highly threatening for healthcare systems, which requires innovative solutions over traditional methods. The medical field is challenged by accurately diagnosing these intertwined diseases of coexisting ailments and anticipating their rise. The current diagnostic approaches are time-consuming and inaccurate, hinder effective treatment, and delay accurate results for the patient. Artificial intelligence can provide an effective method for early prediction of comorbidity risks. In this study, various artificial intelligence models are used, and a clinical dataset of 271 patients is utilized to diagnose comorbidity. In which a hybrid diagnosis model is proposed based on the intersection between machine learning (ML) and feature selection techniques for the detection of comorbidity. Fuzzy decision by opinion score method is utilized as a sophisticated tool to select the most representative ML for prediction. Extensive simulation results showed an accuracy rate of 91.463 using AdaBoost ML. Furthermore, utilizing the fuzzy decision by opinion score technique, we were able to confirm that the best model using all features as well as the chi square and KBest features is the AdaBoost, which scored the smallest value of 0.204 and hence confirm that it is the best selected ML model for comorbidity.
1 Introduction
Comorbidity, the simultaneous existence of multiple medical circumstances in a single patient, is a common healthcare challenge [1]. An accurate and timely diagnosis of comorbid diseases is essential for effective treatment and better patient outcomes. Several clinical tests are performed for early detection of comorbidities [2]. However, they are complicated diagnostic systems and rarely used, except for the significant risk of developing comorbidities. Early detection can provide faster recovery, thus reducing the consumption of resources, such as money and time [3].
With a proportion of 17% projected for 2035 compared to 8.9% in 2015, the frequency of people affected by more than four diseases is expected to nearly double. Furthermore, it has been observed that 2/3 of people experiencing this level of multimorbidity will grapple with mental health issues, such as depression, dementia, and cognitive impairment [4].
Artificial intelligence (AI) can provide a suitable solution in this field of study [5,6]. The future can be empowered by AI to treat patients with comorbidities and surpass the restrictions of siloed care. Through agile algorithms, personalized therapies can be weaved, presenting insights from the complicated tapestry of their interwoven circumstances. Healthcare systems will be revitalized by AI and their cost-saving potential through several benefits for the individual. It is challenging for clinicians to fully understand the demographic features related to comorbidity data and the complexity of detailed clinical information using traditional medical approaches. In addition, it is difficult to accurately predict and diagnose comorbidities [7]. Hence, AI is embraced to deliver optimal healthcare to patients with comorbidities. There are also some challenges for researchers in the field of AI in diagnosing comorbidities including availability of data (demographic and clinical), developing treatment plans, lack of comprehension of comorbidities, and monitoring patients remotely. Such challenges are likely to be overcome via the continued development of AI, which has evolved as a transformative solution to master the fast and precise analysis of complete datasets, such as clinical and demographic characteristics, and testing and diagnostic data. With this advanced diagnostic capability, AI has become a key player in improving the healthcare landscape of people with comorbidities. AI facilitates tailored care, which improves individualized medical treatment, especially for patients with comorbid diseases. Patients engage with online resources, support systems, and interactive platforms to receive customized recommendations and counsel, thereby improving patient care and quality of life. AI also helps reduce healthcare expenditures by creating an integrated health protection system. This paradigm reduces redundant confirmations and testing and streamlines healthcare operations to improve financial efficiency and accountability. Hence, AI applications are considered important in the field of health care [8].
Notable contributions have been made to machine learning (ML) as a subset of AI for the prediction and diagnosis of various diseases. In particular, supervised ML is a technique that includes training models on labeled data for classification or prediction [9].
Timely and accurate diagnosis is critical for effective treatment and improved patient outcomes. Traditional diagnostic methods often struggle with the complexity of comorbid conditions due to overlapping symptoms, leading to misdiagnosis, inappropriate treatment, increased healthcare costs, and higher mortality rates [10]. AI offers a promising solution by leveraging algorithms capable of analyzing complex patient data [11] to develop personalized treatment plans. Beyond diagnosis [12], AI can enhance patient quality of life through personalized care, online support, and improved medication management, empowering patients with informed decision-making capabilities and fostering collaborative healthcare practices [13,14].
For comorbidity disease diagnosis, supervised ML models have emerged as powerful devices, with the potential to improve efficiency and accuracy in healthcare decision-making. Within the context of comorbidity diagnosis, several ML models have been employed (Random Forest [RF], Naive Bayes [NB], K-Nearest Neighbor [KNN], and support vector machines [SVM]) [15,16]. However, the utilization of ML techniques to explore and predict comorbidity showed several challenges. These include data collection difficulties, the appropriate selection of algorithms, and model performance evaluations and interpretation.
In this study, standard ML techniques were used to model comorbidity disease diagnosis. Such models may encounter difficulties in the accurate detection of these relationships with limited data, such as the 271 cases available in this study [17]. Hence, owing to the potential limitations and inherent complexity of our dataset, it is more appropriate to utilize standard ML methods. Ensuring that the model is efficiently developed and deployed, this choice prioritizes implementation speed. Moreover, satisfactory performance is often achieved using ML models at lower computational costs than their deep learning counterparts [18].
Regardless of such attempts, challenges still exist, as accuracy remains a concern in diagnosing comorbidity and suboptimal data selection is based on the affected properties. Therefore, ML methods can assist in the diagnosis of comorbidities, mainly by using datasets tailored specifically to such domains [19].
Fuzzy decision by opinion score method (FDOSM) and AI technologies have emerged in the clinical domain, as pivotal contributors to intelligent decision-making, particularly in disease detection and diagnosis. The measurement and evaluation processes are complex because of multi-criteria decision-making (MCDM). This can be solved by the present contribution proposing a novel dynamic framework designed to assess and benchmark crossover or hybrid diagnostic models for multiple diseases. In such innovation, it is essential to develop a diagnostic model at the intersection of ML algorithms and feature selection (FS) approaches, presenting a multitude of ML models for comprehensive evaluation. The main contributions of this article are as follows:
Hybrid diagnosis model is proposed based on the intersection between ML and FS techniques for the detection of comorbidities.
A dynamic decision-making system is developed to evaluate and benchmark the proposed hybrid mode based on various performance matrix criteria such as precision, recall, F1-score, Kappa, and Jaccard.
Weighting the effective criteria of the proposed hybrid model for disease diagnosis and selecting the best available hybrid model using FDOSM.
The remainder of this article is organized as follows. Section 2 presents a literature review, while Section 3 shows the proposed model with concept of the FDOSM, and Section 4 presents the results and discussion. Finally, Section 5 presents conclusions and future work.
2 Literature review
In this literature review, key advancements and studies are considered. Exemplary studies pertinent to this domain include that introduce an FS algorithm for predicting comorbidity risk based on diagnosis codes in patients through supervised ML techniques. A systematic review was presented in the study of Jovel and Greiner [20], revealing 33 ML models with 80% accuracy in comorbidity prediction.
AI demonstrates outstanding effectiveness in the prediction of latent risks related to depression and the environment of comorbidities. Sánchez-Rico and Alvarado [21] suggested a model trained on data sourced from over 13,270 patients with a commendable accuracy rate of 95% in the prediction of comorbidities. An AI-based model tailored to assess comorbidity risk was developed by a team of university researchers. Training was performed on data encompassing more than 50,000 patients, achieving a considerable accuracy rate of 85% in predicting comorbidities (in relation to COVID-19) [22]. In recent research, the vast potential of AI has been underscored in revolutionization of comorbidity diagnosis. It was demonstrated that AI is effective in predicting comorbidities across diverse diagnoses, thus revealing its extensive applicability. Such an exciting trend is extended to the realm of HIV care leveraging ML techniques to investigate electronic health record (EHR) data and evaluate comorbidity patterns comprehensively [23]. AI can accurately analyze extensive datasets such as medical imaging, genetic data, and healthcare records as an appreciated tool for healthcare professionals to identify patients at risk of comorbidities [24], XGBoost was used [25] along with the explainability method for the prediction of comorbid conditions for chronic diseases such as heart disease and chronic obstructive pulmonary disease (COPD). Patients with higher risk or urgent-care-needing congenital heart disease (CHD) are more likely to experience complications or die. Care for such patients can be improved through classification and prioritization processes [26].
In the study of Shrot et al. [27], the comorbidities of a genetically rare condition were addressed. People diagnosed with psychogenic non-epileptic seizure (PNES) within the EMU were concentrated through previously examined data. Massot-Tarrús et al. [17] tried to recognize baseline characteristics and distinguish PNES patients only from those with comorbid epilepsy. Hence, it is important to understand the models rather than the outcomes of selecting an ML model. In conclusion, diagnostic considerations toward the significance of overlapping features and symptoms were neglected along with their effects and priorities in the lives of patients with comorbid diseases. The imperative for continuous development efforts and research is to focus on a diverse array of methodologies to standardize and improve these models for therapeutic applicability. Ensuring the trustworthiness of AI in comorbidity diagnosis is paramount, as medical decisions in terms of flawed AI outcomes could detrimentally affect patient well-being. Thus, standardized metrics and methodologies are required to evaluate the reliability and accuracy of AI-based healthcare systems and make well-informed medical judgments and, protection to patient health. It should be noted that, as far as the authors are concerned, no evaluation framework has been presented in the literature to benchmark the best hybrid diagnosis models and classify multiple diseases, particularly comorbidities. Therefore, multi-criteria evaluation solutions should be explored in the clinical domain. Therefore, researchers should work on reliable datasets.
In this study, we used a dataset published by the London Health Sciences Centre, which shows the raw dataset of patients diagnosed with PNES in the epilepsy monitoring unit (EMU). This dataset provides a demographic and clinical characterization of patients with PNES and a good model of comorbidity [17]. Furthermore, the literature highlights the need for an evaluation framework to benchmark hybrid diagnosis models used for multiple diseases, especially comorbidity, and multi-criteria evaluation and fuzzy MCDM techniques are proposed to intervene in clinical fields to provide intelligent decision-making, particularly for disease diagnosis and detection. The process of evaluation and benchmarking falls under the MCDM problem. Therefore, this study aims to develop a new dynamic framework for evaluating and benchmarking hybrid diagnosis models for multiple diseases.
3 Proposed model
The methodology used in this study, included six successive phases. In Phases 1 and 2, the data were identified and pre-processed. Then, diagnostic model is developed, which entails the intersection of the two prominent algorithms of FS (Chi 2, KBest) with 11 distinct ML algorithms (these processes are represented in Phases 3 and 4). The evaluation and measurement framework were included in Phases 5 and 6 using the FDSM technique. The methodological approach used in this study is illustrated in Figure 1.

The methodology of evaluation and benchmarking comorbidity diagnosis models. Source: Created by the authors.
3.1 Phase 1: dataset collection
This phase included the collection of dataset to achieve a validated and reliable model comprising comorbidities. The dataset (PNES) [17] utilized in this research contained 160 features characterized by several details. The details of this dataset are listed in Table 1.
Database (PNES)
| Cases | No. of patients |
|---|---|
| PNES-only | 194 |
| Definite epilepsy | 47 |
| Probable | 14 |
| Possible | 16 |
| Total number of patients | 271 |
| The column categories | 160 |
The dataset consists of 271 cases of patients that exist within the recruitment period. In contrast, 194 were classified as PNES-only, (16 + 14) had possible or probable epilepsy, and 47 had definite epilepsy. It is composed by a detailed demographic and clinical data of 271 consecutive patients diagnosed with PNES in our EMU. But it is characterized by having (160) features. Data pre-processing involves the removal of missing values, data coding and cleaning, dataset normalization, and data imbalance.
3.2 Phase 2: Pre-processing
The comorbidities dataset included several sources (public and private). The data were not limited to comorbidity and trauma with chronic diseases. Data pre-processing involves the removal of missing values, data coding and cleaning, dataset normalization, and data imbalance.
3.2.1 Data coding and cleaning
A fundamental pre-processing procedure is represented by data cleansing, which can be used for any dataset to improve data quality, reliability, and accuracy in subsequent analyses. The meticulous handling of unidentified symbols and the identification of outliers have emerged as imperative tasks within the context of the comorbidity dataset, which is pivotal for reinforcing data integrity and cultivating insightful interpretations. The removal of extraneous symbols is undertaken rigorously in the process of data cleansing, which is not limited to characters such as “&,” “?,” “/,” and “-.” In this critical step, the dataset is streamlined, making it more conducive to comprehensive modeling and analysis [28]. Finally, owing to the pivotal role of a strong data-cleansing procedure in refining the comorbidity dataset, its suitability is guaranteed for subsequent ML applications. The precision and efficiency of the analytical process are improved by the removal of superfluous symbols and transformation of textual data into numeric formats.
3.2.2 Handling missing values
Missing values were included in the comorbidity dataset used in this study (Figure 2). Various methods can be used to address this issue by imputing and manipulating missing values. These approaches include model-based imputation (simple tree), random value imputation, distinct value imputation, and mean imputation, which are the most commonly used approaches in the following equation:
where

The percentage of missing values in the comorbidity dataset. Source: Created by the authors.
3.2.3 Dataset normalization
For normalization, the raw data were either modified or re-scaled. The Min-Max normalization approach was used in this study for the comorbidity dataset in the following equation:
where
3.2.4 Data imbalance
It is worth noting that data asymmetry is overlooked by some researchers making the models biased; as such, accuracy cannot represent the model integrity. An imbalance was exhibited by the dataset used in this study, with adverse effects on the accuracy of the diagnosis process. The synthetic minority oversampling technique (SMOTE) method is used to mitigate this issue because a resampling method is frequently utilized in ML to balance data in terms of the target class. By utilizing SMOTE, a higher accuracy can be obtained using the developed ML models in classification, thus providing a more realistic perception of the data.
3.3 Phase 3: FS methods
FS in classification procedures improves classification accuracy, eliminates unnecessary data, and reduces data dimensionality [29]. This study used two filtering methods: Chi 2 and KBest.
3.3.1 Chi 2
Chi 2 is an FS algorithm that can be used to identify the most important features in a dataset. For each feature, the algorithm is based on the chi-squared measure, which indicates how strongly the feature is related to the target feature. For Chi 2, the basic equation (3) is
where
3.3.2 KBest
Another FS algorithm is KBest which identifies the most important properties in a dataset. The algorithm is based on choosing the KBest features from the dataset, where K represents the number of selected features. KBest is determined as follows:
where
The difference between the Chi 2 and KBest algorithms is that Chi 2 indicates a statistical FS algorithm, whereas KBest denotes a non-statistical FS algorithm. Chi 2 is based on the calculation of Chi 2 for each feature, whereas KBest is oriented by selecting the best set of features in terms of a specific function. The dataset and study objectives orient the best selection. In each FS method, there is a size that is different from the others. Moreover, FS is essential in ML and does not always produce precise results owing to a lack of expert judgment opinions. In this stage, pertinent sociodemographic and medical tests are selected considering the class labeled dataset, and these features are scored based on their association with the class. Expert opinion played a key role in determining the significance of each feature. Hence, the subject is labeled by the importance of the influence of the features related to the important feature.
3.4 Phase 4: Construction of ML models
In this section, diagnosis models are built through the intersection of 11 supervised ML algorithms and 2 FS methods. The 11 selected ML algorithms used for the diagnosis of comorbidity represent the best-researched and exhaustive algorithms in the literature including the DT, RF, Gradient Boosting, AdaBoost, Bagging, Extra Tree, KNN, SVM, SGD, Ridge classifier, and ANN, as shown in Table 2. It is essential to assess the models in terms of their performance metrics, as described in the next section.
Algorithm parameters
| Algorithm | Parameters |
|---|---|
| DT | criterion = ‘gini’, splitter = ‘best’, min_samples_split = 2, min_samples_leaf = 1 |
| RF | n_estimators = 100, criterion = ‘gini’, min_samples_split = 2, min_samples_leaf = 1, max_features = ‘sqrt’ |
| Gradient Boost | n_estimators = 100, learning_rate = 0.1, max_depth = 3, subsample = 1.0, min_samples_split = 2, min_samples_leaf = 1 |
| AdaBoost | n_estimators = 50, learning_rate = 1.0, base_estimator = DT |
| Bagging | base_estimator = DT, n_estimators = 10, max_samples = 1.0, max_features = 1.0 |
| ET | n_estimators = 100, criterion = ‘gini’, min_samples_split = 2, min_samples_leaf = 1, max_features = ‘sqrt’ |
| KNN | n_neighbors = 5, weights = ‘uniform’, algorithm = ‘auto’ |
| SVM | C = 1.0, kernel = ‘rbf’, gamma = ‘scale’, degree = 3 |
| SGD | loss = ‘hinge’, penalty = ‘l2’, alpha = 0.0001, max_iter = 1000, tol = 1e-3 |
| Ridge classifier | alpha = 1.0, solver = ‘auto’, tol = 0.001, class_weight = None |
| ANN | hidden = 100, activation = ‘relu’, solver = ‘adam’, alpha = 0.0001, iter = 200 |
3.5 Phase 5: Evaluation criteria for the models
Measurement performance is vital for determining how the objective is effectively met by the diagnosis models. To examine the performance of the 11 diagnosis ML, 8 performance-assessment metrics on the tested comorbidity datasets were used [30] as follows.
3.5.1 Accuracy
Accuracy is a key performance metric for various models such as ML models. Accuracy can be used in comorbidity detection to measure the effectiveness of a model in identifying patients with comorbidities as shown in the following equation:
where TN is the true negative, TP is the true positive, FN is the false negative, and FP is the false positive. However, accuracy is not always a precise measure of the performance. For instance, on a training dataset, the accuracy can be very high; however, it is lower for a test dataset. This is because training datasets are often biased toward the models resulting in imprecise results.
3.5.2 Multi-class classification (MCC)
MCC is a type of evaluation that assigns each data point to one of multiple possible categories. MCC is a powerful tool for classifying data into multiple categories as shown in the following equation:
3.5.3 Sensitivity (TPR/recall)
The number of effectively recognized labels from all positive representations. To compute sensitivity, equation (7) can be used:
3.5.4 Precision
It presents the proportion of appropriately identified tasks among all samples to assess the capacity of the classifier to exclude unrelated data as follows:
3.5.5 F1-score
F1-score shows the weighted average of the precision and recall. The best F1-score was 1, and the lowest was 0, Precision and recall contributed equally to the F1-score. The F1-score is calculated as shown in equation (9) follows:
3.5.6 Kappa
Kappa (
where
3.5.7 Jaccard
The Jaccard index is the amount of the similarity between two sets within the range of 0 to 1, where 0 indicates no similarity and 1 indicates complete similarity. The Jaccard index was computed by dividing the number of common elements between sets by the total number of elements in the sets. The Jaccard index is easy to understand and insensitive to the set size. It can be utilized for the evaluation of various datasets such as text, images, and objects as follows:
where
3.5.8 Hamming loss
The Hamming loss is a measure of the label percentage that is classified incorrectly by an MCC model within the range of 0 to 1, where 0 indicates perfect performance and 1 represents very poor performance. Because Hamming loss considers both false positives and false negatives, it is more sensitive than accuracy as follows:
where
3.6 Phase 6: FDOSM
The FDOSM is a fuzzy technique presented in this study for MCDM [31] and serves as a benchmark for the dimension reduction model. Three principal stages are included in the FDOSM. First, the input unit is intricately linked to the decision matrix (DM), as detailed in Table 3. Second, the data transformation unit as the center stage, facilitates the transfer of the DM into an opinion DM. Finally, within this unit, the conversion of the opinion DM is executed into a fuzzy opinion matrix by the data processing unit using a Likert scale (i.e., the value that would be provided to the model). Subsequently, using direct aggregation, the final rank is established for accessible alternatives (i.e., the model). Both units of the FDOSM are shown in Figure 3. It is essential to benchmark the developed models to choose the best model in terms of the performance evaluation metrics (criteria).
Decision matrix
| Alternatives | Performance evaluation metrics criteria | ||||||||||
|---|---|---|---|---|---|---|---|---|---|---|---|
| Diagnosis models | C1 | C2 | C3 | C4 | C5 | C6 | C7 | C8 | |||
| A1 | KBest-DT | A12 | Chi 2-DT | C1–Ai | C2–Ai | C3–Ai | C4–Ai | C5–Ai | C6–Ai | C7–Ai | C8–Ai |
| A2 | KBest-RF | A13 | Chi 2-RF | C1–Ai | C2–Ai | C3–Ai | C4–Ai | C5–Ai | C6–Ai | C7–Ai | C8–Ai |
| A3 | KBest-GB | A14 | Chi 2-GB | C1–Ai | C2–Ai | C3–Ai | C4–Ai | C5–Ai | C6–Ai | C7–Ai | C8–Ai |
| A4 | KBest-AdaBoost | A15 | Chi 2-AdaBoost | C1–Ai | C2–Ai | C3–Ai | C4–Ai | C5–Ai | C6–Ai | C7–Ai | C8–Ai |
| A5 | KBest-Bagging | A16 | Chi 2-Bagging | C1–Ai | C2–Ai | C3–Ai | C4–Ai | C5–Ai | C6–Ai | C7–Ai | C8–Ai |
| A6 | KBest-ET | A17 | Chi 2-ET | C1–Ai | C2–Ai | C3–Ai | C4–Ai | C5–Ai | C6–Ai | C7–Ai | C8–Ai |
| A7 | KBest-KNN | A18 | Chi 2-KNN | C1–Ai | C2–Ai | C3–Ai | C4–Ai | C5–Ai | C6–Ai | C7–Ai | C8–Ai |
| A8 | KBest-SVM | A19 | Chi 2-SVM | C1–Ai | C2–Ai | C3–Ai | C4–Ai | C5–Ai | C6–Ai | C7–Ai | C8–Ai |
| A9 | KBest-SGD | A20 | Chi 2-SGD | C1–Ai | C2–Ai | C3–Ai | C4–Ai | C5–Ai | C6–Ai | C7–Ai | C8–Ai |
| A10 | KBest-Ridge classifier | A21 | Chi 2-Ridge classifier | C1–Ai | C2–Ai | C3–Ai | C4–Ai | C5–Ai | C6–Ai | C7–Ai | C8–Ai |
| A11 | KBest-ANN | A22 | Chi 2-ANN | C1–Ai | C2–Ai | C3–Ai | C4–Ai | C5–Ai | C6–Ai | C7–Ai | C8–Ai |
C = Criteria, A = Alternative, C1 = Precision, C2 = Recall, C3 = F1-score, C4 = Kappa, C5 = Jaccard, C6 = Hamming loss, C7 = MCC, C8 = Accuracy, i = 1–22.
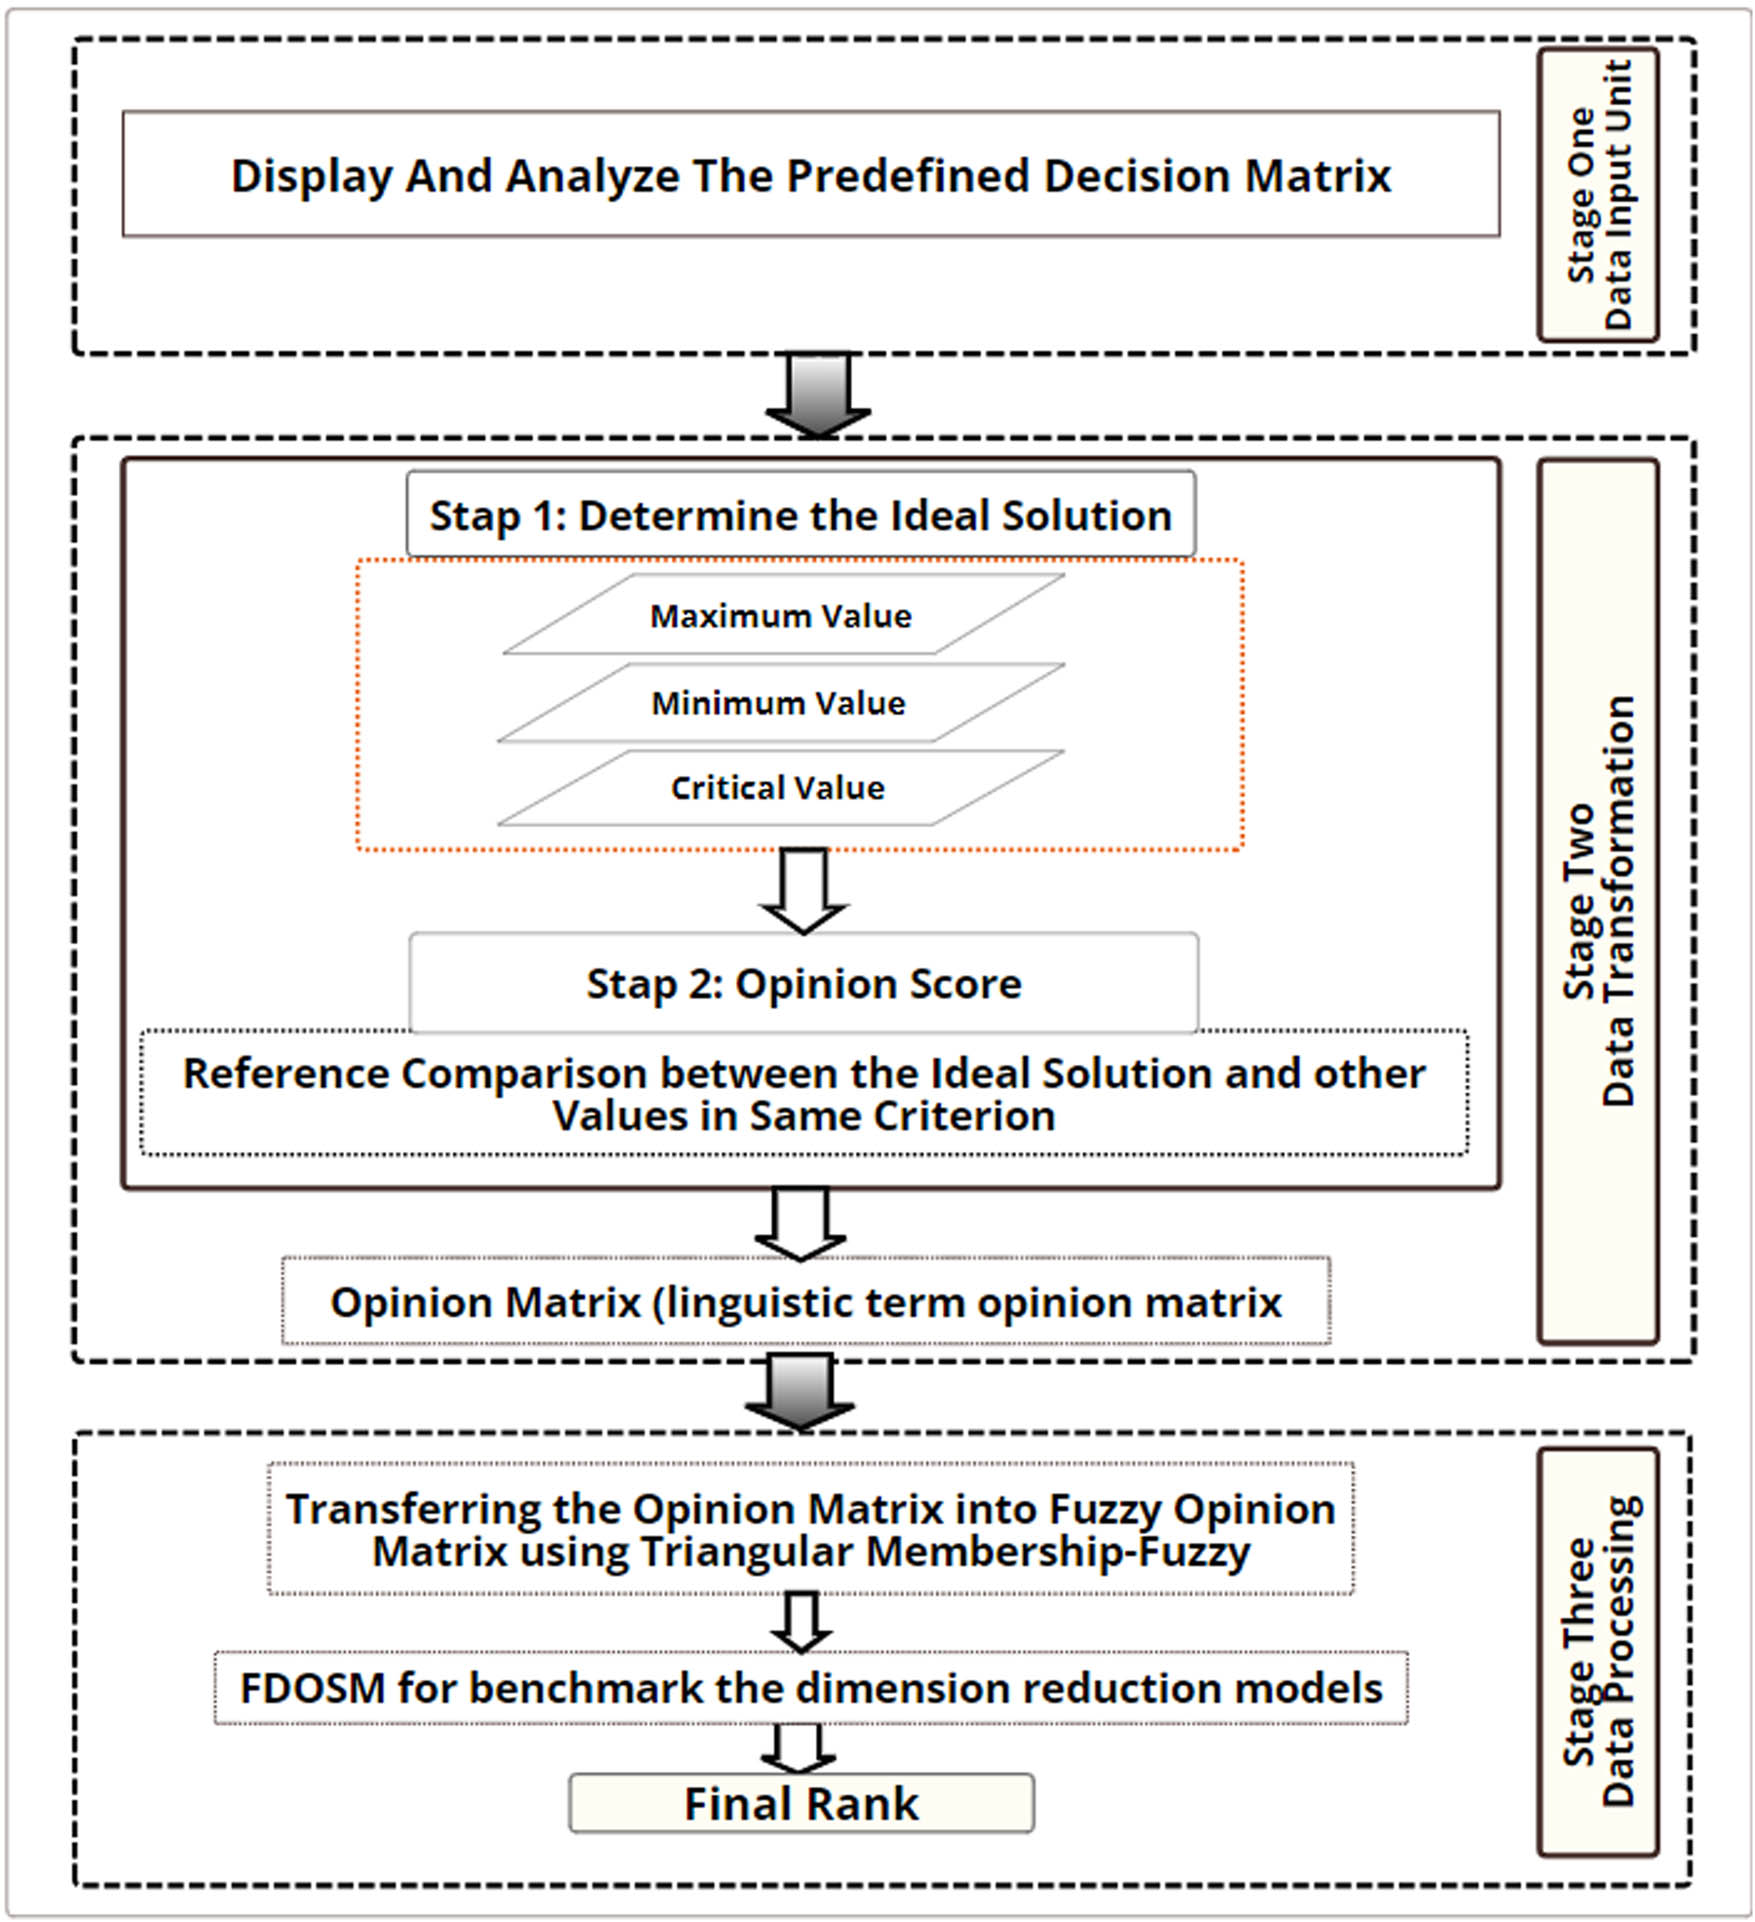
FDOSM stages. Source: Created by the authors.
3.6.1 Input unit
The Data Entry Module is included in the first stage and is closely linked to the DM. This module creates potential solutions (hybrid models
Dynamic DM was used to assess and benchmark the diagnostic models. Recognized as the paramount element in benchmarking and evaluation methodology [26,32], decision-making is based on the interplay between alternatives and choice criteria. The criteria for assessment serve as metrics to benchmark the 11 diagnostic models, symbolizing the alternatives array. Table 3 lists the intricate steps undertaken to create the DM.
Furthermore, the issues are conflicted and traded-off via the evaluation results based on the criteria to determine the best model. Hence, these issues are solved using the benchmarking and evaluation through FDOSM.
3.6.2 Data transformation module
The FDOSM data transformation module is the second stage, with a pivotal role during DM generation in selecting the optimal three-parameter solution (maximum, minimum, and critical values). For the cost criteria, minimum values are considered, and the most advantageous option is signified by the lowest value. Conversely, for benefit criteria, the most beneficial solution had the highest value. The critical value is applied when the optimal response is neither the maximum nor minimum. The message model is then transformed into an opinion matrix, as follows:
Step 1: For each criterion, to determine the optimum solution in the decision matrix, equation (13) is used.
Step 2: Ideal solutions and other values are compared for each criterion by using linguistic terms in the benchmarking process. Five scales were used: “no difference,” “a slight difference,” “a difference,” “a large difference,” and “a very large difference.” The value is compared with alternative subsequent steps after selecting the optimal solution based on the same criterion equation:
3.6.3 Data-processing unit
The opinion matrix represents the output of the transformation unit. The opinion matrix is subjected to the fuzzy value (FV) method to transform it into a fuzzy decision matrix, which initiates the final block. The next step of the procedure uses a direct aggregation operator such as the arithmetic mean [33]. Table 4 shows how the linguistic phrase was transformed into FV. This process was performed after comparing the optimal solution with various DM levels. The order with the highest connection to being the optimal ranking order is probably the one with the lowest mean score value.
Priority and FV
| Priority with acronyms | Fuzzy value |
|---|---|
| Very high (VH) | 0.00–0.10–0.30 |
| High (H) | 0.10–0.30–0.50 |
| Low (L) | 0.30–0.50–0.75 |
| No (N) | 0.50–0.75–0.90 |
4 Results and discussion
In this section, the results of each phase of the study are presented. The results of the proposed models incorporating ML algorithms and FS to identify comorbid disorders are presented. We gathered and pre-processed the PNES dataset to accurately diagnose and predict the presence of comorbid disorders and to create a decision matrix. The weighted output is inserted into the FDOSM for benchmarking.
The outcomes extracted from the suggested models comprise solely ML algorithms to discern the pathological disorders associated with comorbidities. Tables 5, 6, 7 display the performance metrics outcomes for the 11 diagnosis models evaluated using the developed DM. Seventy percentage of the dataset was used in the evaluation of these models for training and the remaining 30% was used for testing.
After extracting the criteria for all features using various evaluation metrics, we utilized the Chi 2 algorithm with different FSs. Hence, an accuracy rate of 91.463% was achieved (using the Gradient Boost and AdaBoost). For both models, this surpasses the accuracy obtained by competing models for the diagnosis of a disease. We utilized (KBest) with various features, and a higher accuracy was obtained than the Gradient Boost algorithm, with an accuracy rate of 92.683%.
All features with various evaluation metrics
| Algorithm | Precision | Recall | F-score | Kappa | Jaccard | Hamming loss | MCC | Accuracy |
|---|---|---|---|---|---|---|---|---|
| DT | 40.000 | 42.308 | 41.071 | 63.229 | 36.842 | 15.854 | 63.384 | 84.146 |
| RF | 41.477 | 48.077 | 44.499 | 67.919 | 40.374 | 12.195 | 69.977 | 87.805 |
| Gradient Boost | 54.947 | 54.231 | 54.423 | 71.228 | 46.439 | 12.195 | 71.297 | 87.805 |
| AdaBoost | 58.904 | 58.077 | 57.293 | 76.771 | 49.590 | 9.756 | 77.234 | 90.244 |
| Bagging | 48.897 | 53.077 | 50.556 | 74.366 | 44.792 | 10.976 | 74.714 | 89.024 |
| Extra tree | 66.457 | 58.077 | 58.676 | 75.820 | 50.476 | 9.756 | 76.797 | 90.244 |
| KNN | 46.678 | 35.353 | 37.719 | 20.212 | 28.182 | 26.829 | 22.939 | 73.171 |
| SVM | 18.293 | 25.000 | 21.127 | 0.000 | 18.293 | 26.829 | 0.000 | 73.171 |
| SGD | 36.607 | 39.808 | 37.792 | 49.612 | 32.001 | 23.171 | 50.048 | 76.829 |
| Ridge classifier | 59.808 | 50.801 | 53.486 | 56.614 | 41.740 | 17.073 | 57.342 | 82.927 |
| ANN | 45.238 | 44.135 | 44.236 | 52.099 | 35.689 | 19.512 | 52.39 | 80.488 |
Chi square with various FS
| Algorithm | Precision | Recall | F-score | Kappa | Jaccard | Hamming loss | MCC | Accuracy |
|---|---|---|---|---|---|---|---|---|
| DT | 55.208 | 59.231 | 56.538 | 74.726 | 49.167 | 10.976 | 74.906 | 89.028 |
| RF | 56.868 | 61.154 | 58.654 | 77.473 | 51.667 | 9.756 | 77.579 | 90.244 |
| Gradient Boost | 58.929 | 63.077 | 60.859 | 80.234 | 54.375 | 8.537 | 80.318 | 91.463 |
| AdaBoost | 57.265 | 66.154 | 60.440 | 80.275 | 53.333 | 8.537 | 80.721 | 91.463 |
| Bagging | 55.529 | 61.154 | 57.692 | 77.645 | 50.833 | 9.756 | 77.706 | 90.244 |
| Extra tree | 65.860 | 58.077 | 58.231 | 76.232 | 49.983 | 9.756 | 77.154 | 90.244 |
| KNN | 42.143 | 46.154 | 44.033 | 66.984 | 39.986 | 13.415 | 67.531 | 86.585 |
| SVM | 40.724 | 48.077 | 44 | 68.498 | 39.744 | 12.195 | 70.26 | 87.805 |
| SGD | 40.476 | 50 | 44.118 | 74.078 | 40.476 | 10.976 | 75.44 | 89.024 |
| Ridge classifier | 40.179 | 42.308 | 41.077 | 54.983 | 35.491 | 15.854 | 58.845 | 84.146 |
| ANN | 40.915 | 50 | 44.703 | 72.636 | 40.915 | 10.976 | 74.17 | 89.024 |
KBest with various FS
| Algorithm | Precision | Recall | F-score | Kappa | Jaccard | Hamming loss | MCC | Accuracy |
|---|---|---|---|---|---|---|---|---|
| DT | 56.336 | 56.154 | 56.072 | 73.586 | 48.524 | 10.976 | 73.792 | 89.024 |
| RF | 56.336 | 56.154 | 56.072 | 73.586 | 48.524 | 10.976 | 73.792 | 89.024 |
| Gradient Boost | 69.506 | 65 | 65.754 | 82.283 | 59.506 | 7.317 | 82.792 | 92.683 |
| AdaBoost | 67.944 | 53.077 | 53.613 | 73.444 | 46.841 | 10.976 | 73.951 | 89.024 |
| Bagging | 56.336 | 56.154 | 56.072 | 73.586 | 48.524 | 10.976 | 73.792 | 89.024 |
| Extra tree | 56.336 | 56.154 | 56.072 | 73.586 | 48.524 | 10.976 | 73.792 | 89.024 |
| KNN | 42.555 | 50 | 45.860 | 72.245 | 42.555 | 10.976 | 73.597 | 89.024 |
| SVM | 39.915 | 46.154 | 42.775 | 64.71 | 38.005 | 13.415 | 66.672 | 86.585 |
| SGD | 41.299 | 50 | 44.903 | 73.193 | 41.299 | 10.976 | 74.388 | 89.024 |
| Ridge classifier | 41.477 | 48.077 | 44.499 | 67.919 | 40.374 | 12.195 | 69.977 | 87.805 |
| ANN | 53.957 | 53.077 | 51.533 | 72.798 | 44.643 | 10.976 | 73.736 | 89.024 |
Tables 8, 9, 10 provide a comprehensive overview of the evaluation of the 11 models, considered as alternatives, across 8 definite performance assessment metrics, each functioning as a criterion. Weighted datasets were incorporated into the evaluation procedure. It should be noted that the FDOSM technique is effective as a guiding mechanism in using algorithms for the comorbidity dataset, leading to considerable enhancements in the performance metric values.
FDOSM with all features
| Algorithm | Precision | Recall | F-score | Kappa | Jaccard | Hamming loss | MCC | Accuracy |
|---|---|---|---|---|---|---|---|---|
| DT | L | L | L | H | L | L | H | H |
| RF | L | L | L | H | H | H | VH | VH |
| Gradient Boost | H | H | H | VH | H | H | VH | VH |
| AdaBoost | H | VH | VH | VH | VH | VH | VH | VH |
| Bagging | L | H | H | VH | H | VH | VH | VH |
| Extra tree | VH | VH | VH | VH | VH | VH | VH | VH |
| KNN | L | N | N | L | N | N | L | L |
| SVM | N | N | N | N | N | N | L | L |
| SGD | N | N | N | N | L | N | H | L |
| Ridge classifier | H | L | H | L | H | L | H | L |
| ANN | L | L | L | H | L | L | H | L |
FDOSM with Chi square
| Algorithm | Precision | Recall | F-score | Kappa | Jaccard | Hamming loss | MCC | Accuracy |
|---|---|---|---|---|---|---|---|---|
| DT | H | H | H | H | H | H | H | H |
| RF | H | H | H | H | H | H | H | VH |
| Gradient Boost | H | VH | VH | VH | VH | VH | VH | VH |
| AdaBoost | H | H | VH | VH | VH | VH | VH | VH |
| Bagging | H | H | H | H | H | H | H | VH |
| Extra tree | VH | VH | H | H | H | H | H | VH |
| KNN | L | L | L | L | L | L | N | H |
| SVM | L | L | L | L | L | L | H | H |
| SGD | L | L | L | H | L | H | H | H |
| Ridge classifier | L | L | L | N | N | N | N | L |
| ANN | L | L | L | L | L | H | H | H |
FDOSM with KBest
| Algorithm | Precision | Recall | F-score | Kappa | Jaccard | Hamming loss | MCC | Accuracy |
|---|---|---|---|---|---|---|---|---|
| DT | H | H | H | H | H | H | H | H |
| RF | H | H | H | H | H | H | H | H |
| Gradient Boost | VH | VH | VH | VH | VH | VH | VH | VH |
| AdaBoost | VH | H | L | H | H | H | H | H |
| Bagging | H | H | H | H | H | H | H | H |
| Extra tree | H | H | H | H | H | H | H | H |
| KNN | L | L | N | H | L | H | H | H |
| SVM | L | N | N | L | L | L | L | L |
| SGD | L | L | N | H | L | H | H | H |
| Ridge classifier | L | L | N | L | L | L | L | L |
| ANN | H | L | L | H | L | H | H | H |
Table 11 presents the ranking outcomes for the 11 models, such as score values and orders to present a clearer perspective of their relative performance. Based on the FDOSM concept, the most preferable alternative is signified by the option with the lowest score, whereas the least desirable choice is represented by the option with the maximum score. Remarkably, the ultimate rankings and scores were reported to contextualize the perspective of DM. According to the tabulated data, the ET algorithm emerges as the optimal choice based on the preferences, when all features are used. In contrast, the AdaBoost algorithm was designated using the Chi 2 algorithm as the most effective ML technique to obtain a top score of 1. In this scenario, KNN ranked the ML method with the least effectiveness with a score of 10. Using the KBest algorithm, Gradient Boost outperforms with a score of 1, whereas the least favorable performance is recorded by SVM, securing a score of 11. As illustrated in Table 11, which shows the final decision (FD), AdaBoost appears as the top-performing algorithm. The ET algorithm is closely based on the second position as shown in Figure 4.
FDOSM results for benchmarking the score and rank of the 11 diagnostic models
| Algorithm | All Features | Chi square | KBest | FD | ||||
|---|---|---|---|---|---|---|---|---|
| Score | Rank | Score | Rank | Score | Rank | Final score | Final rank | |
| DT | 0.435416667 | 6 | 0.300000000 | 6 | 0.300000000 | 2 | 0.345138889 | 6 |
| RF | 0.339583333 | 4 | 0.279166667 | 3 | 0.300000000 | 2 | 0.306250000 | 4 |
| Gradient Boost | 0.437500000 | 7 | 0.291666667 | 5 | 0.250000000 | 1 | 0.326388889 | 5 |
| AdaBoost | 0.154166667 | 2 | 0.154166667 | 1 | 0.30625000 | 6 | 0.204861111 | 1 |
| Bagging | 0.243750000 | 3 | 0.279166667 | 3 | 0.30000000 | 2 | 0.274305556 | 3 |
| ET | 0.133333333 | 1 | 0.258333333 | 2 | 0.30000000 | 2 | 0.230555555 | 2 |
| KNN | 0.616666667 | 10 | 0.514583333 | 10 | 0.433333333 | 8 | 0.521527778 | 10 |
| SVM | 0.750000000 | 11 | 0.462500000 | 9 | 0.566666667 | 11 | 0.593055556 | 11 |
| SGD | 0.589583333 | 9 | 0.408333333 | 7 | 0.433333333 | 8 | 0.477083333 | 8 |
| Ridge classifier | 0.381250000 | 5 | 0.616666667 | 11 | 0.541666667 | 10 | 0.513194445 | 9 |
| ANN | 0.462500000 | 8 | 0.435416667 | 8 | 0.381250000 | 7 | 0.426388889 | 7 |

Plot shows rank and score. Source: Created by the authors.
However, this study has some limitations. First, only data from the London Health Sciences Center (LHSC, London, Canada) were used. This study must be replicated using data from other healthcare systems. The main limitation of this study is its small sample size. However, other features (160) were used to characterize it. The accuracy of the results can be improved using a larger dataset. Further studies are required to enhance the efficiency and accuracy of the AI methods utilized in comorbidity diagnosis. Furthermore, the protection of ML models is essential for vulnerabilities and threats, particularly adversarial attacks. Manipulation of the input data is included in adversarial attacks to fool the model, resulting in imprecise predictions in comorbidity diagnosis. ML models of comorbidities are susceptible to manipulation owing to their reliance on different features, such as demographics, imaging, and laboratory results. Thus, robust models must be developed by our research endeavors with resistance to such attacks using methods such as adversarial training. In addition, we should design a trustworthy framework to ensure reliable measurement and evaluation of these models.
AdaBoost has the highest effectiveness, scoring (0.154166667) and ranking first by leveraging weak classifiers to enhance predictive accuracy. The extra tree closely followed a score of (0.258333333), demonstrating robust performance in ensemble learning. RF and Bagging share the third rank with scores of (0.279166667), showing their ability to improve accuracy through ensemble methods. Gradient Boost ranked fifth with a score of (0.291666667), effectively refining predictions through gradient descent. DT followed with a score of (0.3), while SGD and ANN scored (0.408333333) and (0.435416667), respectively, showing moderate effectiveness. The SVM, KNN, and Ridge Classifier face challenges with scores of (0.4625), (0.514583333), and (0.616666667), respectively, indicating difficulties in leveraging the selected features effectively. Ensemble methods such as AdaBoost and ET prove advantageous for accurate modeling tasks with Chi 2 selected features, whereas more complex models may require additional tuning or alternative FS approaches to improve performance.
Gradient Boost leads with the highest effectiveness, scoring (0.25) and securing the top rank by iteratively improving model weaknesses through gradient descent. DT, RF, Bagging, and ET share the second rank with scores of (0.3), demonstrating robust performance in utilizing the selected features, which was achieved because of the results illustrated in Table 6, in which only two features are selected based on KBest. It should be noted that because these algorithms belong to the same DT family, the results are similar. AdaBoost follows with a score of (0.30625), ranking sixth, leveraging weak classifiers to achieve strong overall accuracy. KNN and SGD share the eighth rank with scores of (0.433333333), indicating moderate effectiveness. ANN ranks seventh with a score of (0.38125), which is effective in capturing complex patterns but require careful tuning. the ridge Classifier and SVM ranked 10th and 11th, respectively, with scores indicating challenges in leveraging the selected features effectively. Ensemble methods such as Gradient Boost and DT are advantageous for accurate modeling tasks with KBest features, whereas more complex models may require additional optimization to enhance performance.
This is calculated by averaging the various quality measures, including all features, chi-square, and KBest. AdaBoost emerged as the top performer with a score of (0.204861111), showcasing its effective combination of weak learners to enhance predictive capability. ET achieves a score of (0.230555555), highlighting its robust performance in ensemble learning with randomized splits. Bagging and RF secure 3rd and 4th ranks, respectively, with scores of (0.274305556) and (0.30625), leveraging bootstrap aggregation and ensemble methods to improve accuracy. Gradient Boost ranked fifth with a score of (0.326388889), refining predictions through gradient descent. DT, although interpretable, ranks sixth with a score of (0.345138889), showing slightly lower accuracy compared to ensemble methods. Furthermore, the ranks, ANN, SGD, Ridge Classifier, KNN, and SVM demonstrated varied performance, with SVM scoring the highest at (0.593055556), indicating challenges in handling complex data. As indicated previously, ensemble methods such as AdaBoost and Extra Tree stand out as optimal choices for tasks requiring robust and accurate ML models.
The performance of the best ML algorithms across various FS methods including all features, chi-square, and KBest ultimately determines their effectiveness through an FD score and rank. AdaBoost consistently emerged as the top performer, achieving the lowest scores across all FS methods with scores of (0.154166667) to (0.30625), resulting in a final score of (0.204861111) and ranking first overall. The extra Tree also demonstrates strong performance initially with a score of (0.133333333), maintaining a second rank consistently across FS. Gradient Boost shows robustness with scores ranging from (0.25) to (0.4375), securing a fifth rank in the FD. The results underscore AdaBoost and Extra Tree as reliable choices for accurate modeling across various feature subsets, while emphasizing the impact of FS methods on algorithm performance and ranking.
The following are the recommendations of this study when using a small dataset with ML algorithms:
Ensemble methods such as ET, AdaBoost, and Bagging dominate the top ranks, showcasing their ability to improve predictive performance by combining multiple models.
AdaBoost is the top-performing algorithm across all FS methods, showing its robustness and consistency in enhancing the prediction accuracy.
More complex models such as ANN and Gradient Boost, while powerful, do not necessarily outperform simpler ensemble methods in this evaluation. This highlights the importance of model selection and tuning based on specific datasets and problems.
Simpler models, such as DT and ridge classifiers perform moderately well, suggesting that while complexity can help, simplicity with the right approach (e.g., ensemble techniques) can often yield competitive results.
More complex models such as SVM, ANN, and ridge classifiers show higher scores and indicate difficulties in effectively utilizing the selected features compared to simpler algorithms. This could be the result of utilizing a small dataset.
Comparison between methods with state of the art for comorbidity diagnosis
| Ref. | Dataset | Method | Results |
|---|---|---|---|
| [25] | COPD (5,061 patients) | XGBoost | AUC (0.817) |
| [27] | Neurocognitive comorbidities (77 patients) | RF | AUC (0.84%) |
| Our proposed model | PNES dataset | AdaBoost and FDOSM | Accuracy (91.463%) |
The integration of AI and fuzzy decision-making into real-time comorbidity diagnosis presents a transformative potential for healthcare. Here are some key implications and future applications: (i) handling uncertainty, (ii) personalized medicine, (iii) enhanced efficiency, and (iv) equitable care delivery. Despite this, various limitations, including the performance of the algorithms may vary with different datasets or additional FS techniques. Moreover, the FD score is an aggregated measure, which might obscure nuanced performance details. Furthermore, the proposed model was not tested on adversarial attacks to verify the generalization ability of the ML algorithms.
5 Conclusion and future work
In this article, we have used 11 distinct AI models with the advanced FDOSM tool for model selection to tackle the challenging problem of detecting comorbidities. Extensive demographic and clinical data are assimilated by AI, leveraging this knowledge to evaluate an individual’s risk of multiple diseases, even those not associated conventionally. Through such early detection capability, physicians are provided with valuable insights to prompt treatment initiation and intervention, thus presenting considerable implications for patient health. Our proposed technique illustrated the power of FDOSM as a model selection tool for the detection of comorbidities. This could allow the AI models to improve diagnosis and refinement of the predictions to tailor treatments with greater precision in which the simulation results showed 91.463% accuracy using AdaBoost technique. However, some of the limitations involving performance variance with different datasets or additional FS techniques. Furthermore, the FD score is an aggregated measure which might obscure nuanced performance details. Future work could involve the use of other FS techniques such as genetic algorithms and gray wolf techniques. Another direction of research is the use of federated learning for training the system to provide security and data integrity.
-
Funding information: The research leading to these results has received funding from the Tunisian Ministry of Higher Education and Scientific Research under the grant agreement number LR11ES48.
-
Author contributions: Dheyauldeen M. Mukhlif and Dhafar Hamed Abd: writing – original draft preparation, visualization. Ridha Ejbali and Adel M. ALIMI: conceptualization, methodology, and investigation. Abir Jaafar Hussain and Mohammed Fadhil Mahdi: resources, validation, and review.
-
Conflict of interest: The authors declare that they have no known competing financial interests or personal relationships that could have appeared to influence the work reported in this article.
-
Data availability statement: The data that support the findings of this study are available from the corresponding author, Abir Jaafar Hussain, upon reasonable request.
References
[1] García-Olmos L, Salvador CH, Alberquilla A, Lora D, Carmona M, Garcia-Sagredo P, et al. Comorbidity patterns in patients with chronic diseases in general practice. PloS One. 2012;7(2):e32141. 10.1371/journal.pone.0032141. Suche in Google Scholar PubMed PubMed Central
[2] Richens JG, Lee CM, Johri S. Improving the accuracy of medical diagnosis with causal machine learning. Nature Commun. 2020;11(1):3923. 10.1038/s41467-020-17419-7. Suche in Google Scholar PubMed PubMed Central
[3] Catacutan DB, Alexander J, Arnold A, Stokes JM. Machine learning in preclinical drug discovery. Nature Chem Biol. 2024;20:1–14. 10.1038/s41589-024-01679-1. Suche in Google Scholar PubMed
[4] Kingston A, Robinson L, Booth H, Knapp M, Jagger C, Project M. Projections of multi-morbidity in the older population in England to 2035: estimates from the Population Ageing and Care Simulation (PACSim) model. Age Ageing. 2018;47(3):374–80. 10.1093/ageing/afx201. Suche in Google Scholar PubMed PubMed Central
[5] Khalaf M, Hussain AJ, Alafandi O, Al-Jumeily D, Alloghani M, Alsaadi M, et al. An application of using support vector machine based on classification technique for predicting medical data sets. Intel Comput Theor Appl. 2019;15:580–91. 10.1007/978-3-030-26969-2_55.Suche in Google Scholar
[6] Khalaf M, Hussain AJ, Keight R, Al-Jumeily D, Keenan R, Chalmers C, et al. Recurrent neural network architectures for analysing biomedical data sets, 2017 10th International Conference on Developments in eSystems Engineering (DeSE), Paris, France, 2017. pp. 232–37. 10.1109/DeSE.2017.12. Suche in Google Scholar
[7] Madububambachu U, Ukpebor A, Ihezue U. Machine learning techniques to predict mental health diagnoses: A systematic literature review. Clin Pract Epidemiol Mental Health. 2024;20(1):e17450179315688. 10.2174/0117450179315688240607052117. Suche in Google Scholar PubMed PubMed Central
[8] Lee D, Yoon SN. Application of artificial intelligence-based technologies in the healthcare industry: Opportunities and challenges. Int J Environ Res Public Health. 2021;18(1):271. 10.3390/ijerph18010271. Suche in Google Scholar PubMed PubMed Central
[9] Jassim MA, Abd DH, Omri MN. A survey of sentiment analysis from film critics based on machine learning, lexicon and hybridization. Neural Comput Appl. 2023;35(13):9437–61. 10.1007/s00521-023-08359-6. Suche in Google Scholar
[10] Neale G, Hogan H, Sevdalis N. Misdiagnosis: analysis based on case record review with proposals aimed to improve diagnostic processes. Clin Med. 2011;11(4):317–21. https://www.sciencedirect.com/science/article/pii/S1470211824043112. 10.7861/clinmedicine.11-4-317Suche in Google Scholar PubMed PubMed Central
[11] Hassen SB, Neji M, Hussain Z, Hussain A, Alimi AM, Frikha M. Deep learning methods for early detection of Alzheimeras disease using structural MR images: a survey. Neurocomputing. 2024;576:127325. https://www.sciencedirect.com/science/article/pii/S0925231224000961. 10.1016/j.neucom.2024.127325Suche in Google Scholar
[12] Ghozzi Y, Mabrouk M, Hamdani TM, Karray H, Alimi AM. Prediction, classification, and diagnosis of Lupus Nephritis in the era of artificial intelligence: a review. In: 2023 IEEE Afro-Mediterranean Conference on Artificial Intelligence (AMCAI); 2023. p. 1–7. 10.1109/AMCAI59331.2023.10431512. Suche in Google Scholar
[13] Bekbolatova M, Mayer J, Ong CW, Toma M. Transformative potential of AI in healthcare: definitions, applications, and navigating the ethical landscape and public perspectives. Healthcare. 2024;12(2):125. https://www.mdpi.com/2227-9032/12/2/125. 10.3390/healthcare12020125Suche in Google Scholar PubMed PubMed Central
[14] Sheu RK, Pardeshi MS. A survey on medical explainable AI (XAI): Recent progress, explainability approach, human interaction and scoring system. Sensors. 2022;22(20):8068. https://www.mdpi.com/1424-8220/22/20/8068. 10.3390/s22208068Suche in Google Scholar PubMed PubMed Central
[15] Saturi S. Review on machine learning techniques for medical data classification and disease diagnosis. Regenerat Eng and Transl Med. 2023;9(2):141–64. 10.1007/s40883-022-00273-y. Suche in Google Scholar
[16] Jassim MA, Abd DH, Omri MN. Machine learning-based opinion extraction approach from movie reviews for sentiment analysis. Multimedia Tools Appl. 2024:1–26. 10.1007/s11042-024-19821-5. Suche in Google Scholar
[17] Massot-Tarrús A, Yu YJ, AlKhateeb M, Mirsattari SM. Risk factors for comorbid epilepsy in patients with psychogenic non-epileptic seizures. Dataset of a large cohort study. Data Brief. 2022;45:108568. 10.1016/j.dib.2022.108568. Suche in Google Scholar PubMed PubMed Central
[18] Sharma S, Chaudhary P. Machine learning and deep learning. Quantum Comput Artif Intell Train Mach Deep Learn Algorithms Quantum Comput. 2023:71–84. 10.1515/9783110791402-004.Suche in Google Scholar
[19] Alsaleh MM, Allery F, Choi JW, Hama T, McQuillin A, Wu H, et al. Prediction of disease comorbidity using explainable artificial intelligence and machine learning techniques: A systematic review. Int J Med Inform. 2023;175:105088. 10.1016/j.ijmedinf.2023.105088. Suche in Google Scholar PubMed
[20] Jovel J, Greiner R. An introduction to machine learning approaches for biomedical research. Front Med. 2021;8:771607. 10.3389/fmed.2021.771607. Suche in Google Scholar PubMed PubMed Central
[21] Sánchez-Rico M, Alvarado JM. A machine learning approach for studying the comorbidities of complex diagnoses. Behav Sci. 2019;9(12):122. 10.3390/bs9120122. Suche in Google Scholar PubMed PubMed Central
[22] Aktar S, Talukder A, Ahamad MM, Kamal A, Khan JR, Protikuzzaman M, et al. Machine learning approaches to identify patient comorbidities and symptoms that increased risk of mortality in COVID-19. Diagnostics. 2021;11(8):1383. 10.3390/diagnostics11081383. Suche in Google Scholar PubMed PubMed Central
[23] Yang X, Zhang J, Chen S, Weissman S, Olatosi B, Li X. Utilizing electronic health record data to understand comorbidity burden among people living with HIV: a machine learning approach. Aids. 2021;35:S39–51. 10.1097/QAD.0000000000002736. Suche in Google Scholar PubMed PubMed Central
[24] Suri JS, Puvvula A, Biswas M, Majhail M, Saba L, Faa G, et al. COVID-19 pathways for brain and heart injury in comorbidity patients: A role of medical imaging and artificial intelligence-based COVID severity classification: A review. Comput Biol Med. 2020;124:103960. 10.1016/j.compbiomed.2020.103960. Suche in Google Scholar PubMed PubMed Central
[25] Liao KM, Liu CF, Chen CJ, Shen YT. Machine learning approaches for predicting acute respiratory failure, ventilator dependence, and mortality in chronic obstructive pulmonary disease. Diagnostics. 2021;11(12):2396. 10.3390/diagnostics11122396. Suche in Google Scholar PubMed PubMed Central
[26] Hamid RA, Albahri AS, Albahri OS, Zaidan A. Dempster-Shafer theory for classification and hybridised models of multi-criteria decision analysis for prioritisation: a telemedicine framework for patients with heart diseases. J Ambient Intel Human Comput. 2022;13(9):4333–67. 10.1007/s12652-021-03325-3. Suche in Google Scholar
[27] Shrot S, Lawson P, Shlomovitz O, Hoffmann C, Shrot A, Ben-Zeev B, et al. Prediction of tuberous sclerosis-associated neurocognitive disorders and seizures via machine learning of structural magnetic resonance imaging. Neuroradiology. 2022;64:1–10. 10.1007/s00234-021-02789-6. Suche in Google Scholar PubMed
[28] Mukhlif DM, Abd DH, Ejbali R, Alimi AM. Comorbidity diseases diagnosis using machine learning methods and chi-square feature selection technique. In: 2023 16th International Conference on Developments in eSystems Engineering (DeSE). IEEE; 2023. p. 144–9. 10.1109/DeSE60595.2023.10469092. Suche in Google Scholar
[29] Saria VF, Mselle LT, Siceloff BA. Parents and nurses telling their stories: the perceived needs of parents caring for critically ill children at the Kilimanjaro Christian Medical Centre in Tanzania. BMC Nursing. 2019;18:1–8. 10.1186/s12912-019-0381-8. Suche in Google Scholar PubMed PubMed Central
[30] Abd DH, Khan W, Khan B, Alharbe N, Al-Jumeily D, Hussain A. Categorization of Arabic posts using artificial neural network and hash features. J King Saud Univ-Sci. 2023;35(6):102733, 10.1016/j.jksus.2023.102733. Suche in Google Scholar
[31] Salih MM, Zaidan B, Zaidan A. Fuzzy decision by opinion score method. Appl Soft Comput. 2020;96:106595. 10.1016/j.asoc.2020.106595. Suche in Google Scholar
[32] Ababneh J. Application of Naïve Bayes, decision tree, and K-nearest neighbors for automated text classification. Modern Appl Sci. 2019;13(11):31. 10.5539/mas.v13n11p31. Suche in Google Scholar
[33] BenSaid F, Alimi AM. Online feature selection system for big data classification based on multi-objective automated negotiation. Pattern Recognit. 2021;110:107629. 10.1016/j.patcog.2020.107629. Suche in Google Scholar
© 2025 the author(s), published by De Gruyter
This work is licensed under the Creative Commons Attribution 4.0 International License.
Artikel in diesem Heft
- Research Articles
- Synergistic effect of artificial intelligence and new real-time disassembly sensors: Overcoming limitations and expanding application scope
- Greenhouse environmental monitoring and control system based on improved fuzzy PID and neural network algorithms
- Explainable deep learning approach for recognizing “Egyptian Cobra” bite in real-time
- Optimization of cyber security through the implementation of AI technologies
- Deep multi-view feature fusion with data augmentation for improved diabetic retinopathy classification
- A new metaheuristic algorithm for solving multi-objective single-machine scheduling problems
- Estimating glycemic index in a specific dataset: The case of Moroccan cuisine
- Hybrid modeling of structure extension and instance weighting for naive Bayes
- Application of adaptive artificial bee colony algorithm in environmental and economic dispatching management
- Stock price prediction based on dual important indicators using ARIMAX: A case study in Vietnam
- Emotion recognition and interaction of smart education environment screen based on deep learning networks
- Supply chain performance evaluation model for integrated circuit industry based on fuzzy analytic hierarchy process and fuzzy neural network
- Application and optimization of machine learning algorithms for optical character recognition in complex scenarios
- Comorbidity diagnosis using machine learning: Fuzzy decision-making approach
- A fast and fully automated system for segmenting retinal blood vessels in fundus images
- Application of computer wireless network database technology in information management
- A new model for maintenance prediction using altruistic dragonfly algorithm and support vector machine
- A stacking ensemble classification model for determining the state of nitrogen-filled car tires
- Research on image random matrix modeling and stylized rendering algorithm for painting color learning
- Predictive models for overall health of hydroelectric equipment based on multi-measurement point output
- Architectural design visual information mining system based on image processing technology
- Measurement and deformation monitoring system for underground engineering robots based on Internet of Things architecture
- Face recognition method based on convolutional neural network and distributed computing
- OPGW fault localization method based on transformer and federated learning
- Class-consistent technology-based outlier detection for incomplete real-valued data based on rough set theory and granular computing
- Detection of single and dual pulmonary diseases using an optimized vision transformer
- CNN-EWC: A continuous deep learning approach for lung cancer classification
- Cloud computing virtualization technology based on bandwidth resource-aware migration algorithm
- Hyperparameters optimization of evolving spiking neural network using artificial bee colony for unsupervised anomaly detection
- Classification of histopathological images for oral cancer in early stages using a deep learning approach
- A refined methodological approach: Long-term stock market forecasting with XGBoost
- Enhancing highway security and wildlife safety: Mitigating wildlife–vehicle collisions with deep learning and drone technology
- An adaptive genetic algorithm with double populations for solving traveling salesman problems
- EEG channels selection for stroke patients rehabilitation using equilibrium optimizer
- Influence of intelligent manufacturing on innovation efficiency based on machine learning: A mechanism analysis of government subsidies and intellectual capital
- An intelligent enterprise system with processing and verification of business documents using big data and AI
- Hybrid deep learning for bankruptcy prediction: An optimized LSTM model with harmony search algorithm
- Construction of classroom teaching evaluation model based on machine learning facilitated facial expression recognition
- Artificial intelligence for enhanced quality assurance through advanced strategies and implementation in the software industry
- An anomaly analysis method for measurement data based on similarity metric and improved deep reinforcement learning under the power Internet of Things architecture
- Optimizing papaya disease classification: A hybrid approach using deep features and PCA-enhanced machine learning
- Handwritten digit recognition: Comparative analysis of ML, CNN, vision transformer, and hybrid models on the MNIST dataset
- Multimodal data analysis for post-decortication therapy optimization using IoMT and reinforcement learning
- Predicting early mortality for patients in intensive care units using machine learning and FDOSM
- Uncertainty measurement for a three heterogeneous information system based on k-nearest neighborhood: Application to unsupervised attribute reduction
- Review Articles
- A comprehensive review of deep learning and machine learning techniques for early-stage skin cancer detection: Challenges and research gaps
- An experimental study of U-net variants on liver segmentation from CT scans
- Strategies for protection against adversarial attacks in AI models: An in-depth review
- Resource allocation strategies and task scheduling algorithms for cloud computing: A systematic literature review
- Latency optimization approaches for healthcare Internet of Things and fog computing: A comprehensive review
- Explainable clustering: Methods, challenges, and future opportunities