Detection of single and dual pulmonary diseases using an optimized vision transformer
-
Naif Almughamisi
 ,
Gibrael Abosamra
,
Gibrael Abosamra

Abstract
Pulmonary diseases rank among the leading causes of mortality worldwide, underscoring the importance of early detection to enhance patient outcomes and reduce fatalities. Chest X-rays (CXRs) serve as a critical diagnostic tool for identifying lung diseases; however, many pulmonary conditions exhibit similar patterns on CXRs, making differentiation challenging even for experienced radiologists. Furthermore, a single CXR may reveal multiple coexisting diseases, such as pneumonia and pleural effusion. Moreover, most existing studies in this field have been constrained to a limited number of classes and datasets, leaving significant gaps in the classification of diverse pulmonary conditions, particularly in remote regions where access to skilled radiologists is scarce. Recently, vision transformers (ViTs) have become a key technique in deep learning, and they have been widely used to detect different diseases from CXRs. This study aimed to adapt and optimize the pre-trained ViT-B16 model to predict and distinguish between single and dual pulmonary diseases whose diagnoses relied only on CXRs. The goal was to discriminate eight classes of evidence, which consisted of individual diseases (COVID-19, pneumonia, pneumothorax, tuberculosis, and pleural effusion), dual diseases (pneumonia and pleural effusion as well as pneumothorax and pleural effusion), and normal status. The experimental results show that the proposed model distinguished more classes than previous methods, with an accuracy of 98.18%. To the best of our knowledge, this is the first study to attempt to discriminate eight classes of evidence concerning pulmonary diseases, including both individual and dual diseases.
1 Introduction
The World Health Organization identifies lung diseases as the fourth leading cause of mortality globally and the primary cause of death among children under five in certain developing countries. In 2019 alone, pulmonary diseases claimed the lives of 2.6 million people [1]. Common pulmonary conditions include asthma, chronic obstructive pulmonary disease, pneumonia, tuberculosis, lung cancer, and COVID-19. Since the emergence of COVID-19 in late 2019, the virus has resulted in nearly seven million fatalities worldwide [2]. Early and accurate diagnosis of lung diseases is essential to improve treatment outcomes and patient survival. In the case of COVID-19, early detection is also critical for implementing isolation measures to limit the spread of the virus.
Traditionally, physicians have relied on manual examination of chest X-ray (CXR) images to differentiate between various pulmonary conditions. However, many lung diseases, including COVID-19, exhibit overlapping features on CXRs, posing significant challenges to accurate diagnosis, even for highly experienced radiologists. This is an example of the problem of inter-class similarity. In addition, it is possible to see more than one disease in a single CXR, such as in a patient with pneumothorax and pleural effusion, which requires more attention from the radiologist. Many studies have focused on categorizing a limited number of lung disease classes. Most existing research fails to sufficiently address the needs of physicians, who rely on artificial intelligence (AI) for pulmonary disease detection, particularly given the complexity of cases where multiple diseases may coexist in patients. Moreover, limited attention has been devoted to dual diseases, where CXRs display multiple conditions within a single image. These cases are often underrepresented in datasets, which may explain why this issue has been inadequately addressed in the literature. Additionally, some researchers have attempted to identify diseases without fully determining whether detection can be achieved using CXRs alone or if computed tomography (CT) scans are also required.
AI, particularly deep learning, has been successfully applied in the healthcare sector and has overcome limitations in diagnosing numerous diseases [3]. Deep learning generates a model that has the ability to learn and make judgments based on an extensive number of data sets. Deep learning approaches, which are a subset of machine learning tools, have been shown to be helpful and effective in the analysis of medical imaging and the classification of diseases, including neurological and cardiovascular diseases [4]. In many fields, deep learning can outperform humans; for instance, deep learning can be used to predict patient outcomes and detect cancer with greater accuracy and efficiency. Convolutional neural networks (CNNs), which are a type of deep learning model, automate and improve medical image analysis, increasing diagnosis accuracy and processing performance. CNNs have been used to predict and classify different types of pulmonary diseases, such as lung cancer [5], tuberculosis (TB) [6], pneumonia [7], and recently, COVID-19 [8], using CT and CXR images without human intervention.
Vision transformers (ViTs), which rely on self-attention mechanisms, are promising new neural network-based models [9]. They have been widely used in the field of natural language processing and include, for example, generative pretrained transformer (GPT) [10] and bidirectional encoder representations based on transformers (BERT) [11]. In 2021, a ViT, which was an extension of the transformer architecture, was introduced by Dosovitskiy et al. [12]. ViTs utilize self-attention mechanisms and treat images as sequences of parallel patches, leading to noteworthy speed improvements. This enables ViTs to outperform most state-of-the-art CNNs when dealing with huge datasets. ViTs have demonstrated their effectiveness across various tasks in prior studies. However, a significant challenge in using ViTs for CXR image classification lies in the limited availability of large datasets and the imbalance in existing datasets for different diseases. This issue becomes even more pronounced when a single CXR is classified with multiple labels. This study developed a model that could classify seven pulmonary diseases based on existing research, including combinations of these diseases (e.g., pleural effusion and pneumonia) in CXRs. Dataset limitations, especially for single images showing two diseases, were overcome by using a global dataset (Chest X-ray14 [13]) in addition to a local dataset and by using different techniques to balance the datasets. The efficiency and accuracy of the proposed model were compared to well-known pre-trained CNN models, including VGG16, VGG19, ResNet50, InceptionV3, and DenseNet121, and state-of-the-art models used in disease classification.
1.1 Problem statement
Manual methods for using CXRs to detect and distinguish between pulmonary diseases can be challenging and time-consuming. Furthermore, low-resource nations lack skilled radiologists, especially in remote areas. Several scholars have used CNN-supported computer vision to detect and diagnose pneumonia, tuberculosis, COVID-19, and lung cancer without the intervention of a radiology expert. However, in some studies, the focus has been on a narrow range of diseases, and physicians’ needs have not been considered, which restricts the clinical relevance of this literature. In addition, some researchers have relied on small datasets, and they have not paid attention to identifying more than one disease in a single image, which reduces model robustness and generalizability. The challenge is to develop a model that can predict and discriminate pulmonary diseases with high accuracy, given that some of these diseases have similar footprints in CXRs, which are difficult to distinguish for human experts (an instance of the interclass similarity problem). ViTs are the most promising tools to solve this problem but they require vast datasets to produce good results. This is one of the obstacles in classifying single- and dual-disease CXR images using a ViT.
1.2 Main contributions of this study
The main contributions of this study are as follows:
The selection, adaptation, and optimization of a model that can help radiology experts detect and classify the most common pulmonary diseases from CXR images without the need for further examination, such as with CT or MRI.
A system that will classify eight pulmonary diseases based on studies, including combination classes involving effusion, pneumonia, tuberculosis, pneumothorax, COVID-19, and normal status, as diagnosed by CXR.
The use of a large balanced dataset of 70,228 frontal view CXR images. This dataset has been collected from a global source and combined with a local source from a Saudi Hospital.
Conducting several experiments to compare state-of-the-art models, such as well-known CNN pre-trained models, ViTs, and combined pre-trained CNN models with vision transforms, in the development of an optimal model that can predict and discriminate between pulmonary diseases with high accuracy.
An optimized model based on ViTs that outperforms state-of-the-art models.
The use of advanced data pre-processing techniques to overcome imbalanced datasets, multi-label issues, and low contrast has been carefully considered and demonstrated to positively impact accuracy.
1.3 Article outline
The rest of this article is organized as follows: The relevant literature on the image classification techniques based on CNN and ViTs is presented in Section 2. Section 3 discusses disease selection, dataset preparation, model comparison conditions, and the proposed model architecture. Section 4 presents the results and their evaluation metrics and a comparison with other state-of-the-art models. The study’s limitations are given in Section 5. The conclusions are offered in Section 6.
2 Related work
In recent years, CNNs have significantly improved the ability to detect and classify a disease from CXR and CT scans. Their high degree of accuracy in detecting diseases has encouraged researchers to rely on deep learning techniques. Yari et al. fine-tuned a deep learning model using two pre-trained CNN models, DenseNet121 and ResNet50 – with a deep classifier to distinguish three pulmonary disease types: COVID-19, viral pneumonia, and normal. The selected model achieved 97.83% accuracy. The authors used the pre-trained model due to the limited size of the dataset [14]. In another study, Tekere and Al-Rawe classified pulmonary diseases into three categories: viral pneumonia, COVID-19, and normal status, relying on CXR for the diagnosis. In their research, the authors employed two deep learning models: MobileNet and DenseNet. The optimized approach based on MobileNet and DenseNet performed well at 96% accuracy and an area under the curve (AUC) value of 94%, producing an outcome that demonstrated a remarkable level of achievement [15].
Pranav et al. compared the performance of three CNN architectures, DenseNet121, ResNet50, and VGG19, to identify and detect COVID-19, viral pneumonia, and a normal status through CXR. DenseNet121 achieved a better sensitivity rate of 95% and a better specificity rate of 97% in comparison to the other models [16]. Gupta et al. introduced a technique for detecting COVID-19 from CXR images. To more precisely detect the COVID-19 disease, the authors used lung segmentation, preprocessing techniques, and deep learning models (InceptionV3 and U-Net). Lung segmentation was used during preprocessing to remove irrelevant surrounding details that could generate inaccurate outcomes. The accuracy achieved in this study was very high, approximately 99%. Despite the high level of accuracy achieved in detecting COVID-19, the authors emphasized the impact of lung segmentation and visual noise in minimizing bias and ensuring consistency [17].
Chowdhury et al. conducted a study utilizing transfer learning techniques using different CNN architectures, namely, SqueezeNet, CheXNet, MobileNetV2, ResNet101, ResNet18, DenseNet201, VGG19, and InceptionV3 – with ImageNet trained weights. The aim of their study was to classify two schemes. The first scheme included normal status and COVID-19 pneumonia; this scheme achieved 99.7% accuracy, 99.7% precision, 99.7% sensitivity, and 99.55% specificity. The second scheme encompassed normal, viral, and COVID-19 pneumonia and achieved an accuracy level of 97.90%, a precision level of 97.95%, a sensitivity level of 97.90%, and a specificity level of 98.80%[18]. Moreover, Jasmine Pemeena Priyadarsini et al., in their research, implemented a model to detect and classify lung cancer, tuberculosis, and pneumonia from CTs and CXRs using three types of CNNs: functional, pre-train transfer learning VGG-16 as features extraction, and sequential models. Lung cancer was detected with an accuracy of 99.9%, surpassing the rate achieved for the detection of other diseases. Specifically, the model achieved an accuracy level of 98.43% for the detection of pneumonia, and the accuracy level for detecting tuberculosis was 99.40% [19].
In another study, Cheah compared the following five CNN architectures with respect to diagnosing lung disease: AlexNet, GoogLeNet, ResNet18, ShuffleNet, and SqueezeNet. The author organized lung disease into two categories: the first category included a diagnosis of normal tuberculosis, viral pneumonia, and COVID-19, while the second category excluded a normal diagnosis. For the three-class model, the highest level of accuracy was 97.89%, achieved using the AlexNet model, whereas, for the four-class model, ResNet18 performed very well, achieving 97.14% accuracy [20]. Furthermore, Perumal et al. demonstrated the power of using transfer learning and Haralick texture features to detect lung diseases from a CT and CXR. The implementation of transfer learning revealed that a machine trained to identify viral pneumonia may also be able to identify COVID-19. Hence, Haralick texture features may be helpful in feature extraction. Additionally, transfer learning produces more significant outcomes than traditional classifications [21].
In their study, Narin et al. compared the performance of five pre-trained CNN architecture models, ResNet155, ResNet101, ResNet50, Inception-ResNetV2, and InceptionV3, for the early diagnosis of COVID-19 from CXRs. These models can be used as a support system to aid radiologists in their clinical decision-making. The pre-trained ResNet50 model employed in this study achieved a very high accuracy of 96.1% in the first dataset; however, the dataset was especially limited [22]. AI-Issa et al. presented a model to distinguish between some pulmonary diseases and to compare the performance of four popular pre-trained networks: VGG16, DenseNet201, XceptionNet, and Darknet19. The XceptionNet model surpassed other network models and achieved a 94.77% accuracy level [23]. As part of another study, Alshmrani et al. selected and optimized the pre-trained model VGG19 to classify lung conditions from CXR, specifically lung opacity, pneumonia, lung cancer, COVID-19, and tuberculosis. The dataset for these diseases was normalized and resized to match the architecture requirements of CNN. The accuracy of the proposed model surpassed the 96.48% level achieved by an existing technique [24].
2.1 State-of-the-art ViTs for image classification
The use of ViTs with powerful self-attention mechanisms in medical imaging-based disease diagnosis has seen significant development recently. Jiang and Lin proposed a method that combines Swin transformer and transformer in transformer for classifying individuals as having normal conditions, pneumonia, or COVID-19 based on CXR images. Their model was trained using a dataset of 22,585 and achieved a notable accuracy of 94.75%, a sensitivity of 94.75%, and a specificity of 95.09% [25]. Meanwhile, Duong et al. developed a hybrid model based on EfficientNet and ViT to address concerns about the use of heterogeneous datasets when classifying individuals as having tuberculosis, pneumonia, or normal conditions. Their hybrid model demonstrated an accuracy of 97.72%, indicating a significant improvement in disease diagnosis [26]. To enhance lung disease diagnosis, Ko et al. developed a model using various ViT models (i.e., ViT, FastViT, and CrossViT) combined with various optimizers. The combination of ViT and the RAdam optimizer, forming a model that had a balanced dataset, achieved the highest accuracy of 95.87% [27]. Angara et al. also presented a hybrid framework based on ResNet34 and ViT to detect normal conditions and pneumonia based on CXR images. This hybrid framework demonstrated a notable accuracy of 94.87% [28]. Some state-of-the-art studies on pulmonary disease classification accuracies are presented in Table 1. Table 2 presents the comparison of these works considering the percentage of the dataset size used in the training, validation, and testing phases.
Comparative analysis of existing classification deep learning models based on accuracy
| Disease | Study | Models | Medical imaging | Accuracy (%) |
|---|---|---|---|---|
| COVID-19 and viral pneumonia | [14] | DenseNet121 and ResNet50 | CXR | 97.83 |
| Viral pneumonia, COVID-19, and normal | [15] | MobileNet and DenseNet | CXR | 96 |
| COVID-19, viral pneumonia, and normal | [16] | DenseNet121, ResNet50, and VGG19 | CXR | 97 |
| COVID-19 | [17] | InceptionV3 and U-Net | CXR | 99 |
| COVID-19 and pneumonia | [18] | SqueezeNet, CheXNet, MobileNetV2, ResNet101, ResNet18, DenseNet201, VGG19, and InceptionV3 | CXR | 99.7 |
| Normal, COVID-19, and viral pneumonia | [18] | SqueezeNet, CheXNet, MobileNetV2, ResNet101, ResNet18, DenseNet201, VGG19, and InceptionV3 | CXR | 97.90 |
| Pneumonia, normal | [19] | CNN, sequential models | CXR | 98.43 |
| Tuberculosis, normal | [19] | CNN, sequential models | CXR | 99.40 |
| Lung cancer and normal | [19] | CNN and sequential models | CT | 99.90 |
| Normal, tuberculosis, viral pneumonia, and COVID-19 | [20] | AlexNet, GoogLeNet, ResNet18, ShuffleNet, and SqueezeNet | CXR | 97.89 |
| Viral pneumonia, and COVID-19 | [21] | VGG16, Resnet50, and InceptionV3 | CXR and CT | 93 |
| COVID-19, viral pneumonia, bacterial pneumonia, and normal | [22] | ResNet50, ResNet101, ResNet152, InceptionV3, and Inception-ResNetV2 | CXR | 96.1 |
| COVID-19, viral pneumonia, lung opacity, and normal | [23] | VGG16, DenseNet201, XceptionNet, DarkNet19, and XceptionNet | CXR | 94 |
| Lung opacity, pneumonia, lung cancer, COVID-19, and tuberculosis | [24] | VGG19 + CNN | CXR | 96.48 |
| Normal, pneumonia, and COVID-19 | [25] | Swin transformer and transformer in transformer | CXR | 94.75 |
| Tuberculosis, pneumonia, and normal | [26] | Hybrid model based on EfficientNet and ViT | CXR | 97.72 |
| Normal, COVID-19, viral pneumonia, and bacterial Pneumonia | [27] | ViT, FastViT, and CrossViT with different optimizers: Adam, AdamW, NAdam, RAdam, SGDW, and Momentum | CXR | 95.87 |
| Normal and Pneumonia | [28] | Hybrid model based on ResNet34 and ViT | CXR | 94.87 |
Comparative analysis of the previous work considering the dataset size, training, validation, and testing
| Study | Dataset size | Training (%) | Validation (%) | Testing (%) | Accuracy (%) |
|---|---|---|---|---|---|
| [14] | 2,905 | 61 | 25 | 14 | 97.83 |
| [15] | 40,000 | 70 | 30 | 96 | |
| [16] | 3,700 | 60 | 40 | 97 | |
| [17] | 2,480 | 60 | 20 | 20 | 99 |
| [18] | 1,908 | 80 | 10 | 10 | 99.7 |
| [18] | 3,487 | 80 | 10 | 10 | 97.90 |
| [19] | 5,856 | 35 | 65 | 98.43 | |
| [19] | 662 | 87 | 13 | 99.40 | |
| [19] | 907 | 76 | 24 | 99.9 | |
| [20] | 1,185 | 70 | 30 | 97.89 | |
| [21] | 5,232 | 70 | 30 | 93 | |
| [22] | 7,406 | 80 | 20 | 96.10 | |
| [23] | 14,777 | 70 | 30 | 94 | |
| [24] | 80,000 | 80 | 20 | 96.48 | |
| [25] | 22,585 | 80 | 15 | 5 | 94.75 |
| [26] | 28,840 | 80 | 10 | 10 | 97.72 |
| [27] | 19,003 | 80 | 20 | 95.87 | |
| [28] | 5,216 | 70 | 20 | 10 | 94.87 |
Although significant studies on the classification of pulmonary diseases have been published, there are still numerous critical gaps in existing research. First, one of the limitations discovered during this literature review was that most scholars have not looked for a solution to the medical problem of classifying pulmonary diseases based on the relationship between the disease and the type of radiology used in the diagnosis process. To develop a complete system for the classification of such diseases based on CXRs, only diseases that can be diagnosed using solely CXRs, without the need for CT or MRI scans, should be studied. For instance, a CT image should be considered for the diagnosis of lung cancer or asthma, whereas COVID-19, pneumonia, pneumothorax, tuberculosis, and pleural effusion can be fully diagnosed from only a CXR. Second, some of the reviewed studies did not give prominence to image quality improvements by using techniques, such as the contrast-limited adaptive histogram equalization (CLAHE) technique, before applying the deep learning model. Third, a few scholars have discussed the possibility of multilabel classification in pulmonary imaging, where more than one disease is present in a single CXR image.
Fourth, the training datasets used in previous state-of-the-art research are small. Also, some researchers examined vast training datasets but provided very limited testing datasets. Using data that have not been previously employed and do not exhibit systems scalability can lead to partial results. Model performance and accuracy are significantly impacted by the size of the dataset. To improve the model’s generalization, robustness, and efficacy, it is important to have a large dataset to let the model learn well. This study addressed these gaps by adapting and optimizing the pre-trained ViT-B16 model to categorize eight classes of evidence concerning pulmonary diseases that can be identified using CXRs, which are inexpensive and can be used anywhere, even in remote areas. To overcome the limitations of the dataset, global and local datasets were employed, and data preprocessing techniques were utilized to solve the imbalanced dataset problem. By taking these measures, the proposed model outperformed other state-of-the-art models in terms of accuracy and generalizability, as will be demonstrated below.
3 Methodology
This section outlines the steps involved in the proposed approach; each step addressed specific challenges in the model.
Step 1: Disease selection based only on CXR images
Step 2: Dataset collection from different sources
Step 3: Solving the problem of imbalanced datasets
Step 4: Expert-guided data cleaning
Step 5: Improving image quality using CLAHE
Step 6: Improving the model’s generalization via data augmentation
Step 7: Minimizing data imbalance with the class weight technique
Step 8: Experimental setup of the model’s comparison conditions
Step 9: Customization of the proposed architecture
3.1 Disease selection based only on CXR images
The study’s main aim was to propose a model that could detect pulmonary diseases based on CXRs without the need for CT images, which are more expensive and less available in developing countries and remote areas. Even in the absence of experts, this would help novice physicians achieve early detection and distinguish between pulmonary illnesses with high accuracy. After several meetings with the physician in the ICU of the National Guard Hospital and based on several existing studies, we selected the most common diseases seen in CXRs. One of the studies we consulted, an article by Mishra et al., described some cases of patients diagnosed as positive for COVID-19 with evidence of pneumonia [29]. The study by Xu et al. investigated a case of COVID-19 and pneumothorax observed in a CXR [30]. Grafakou et al. examined pneumonia and pleural effusion [31] in the CXRs of children. Another study, discussed in Imaging in Pediatric Pulmonology, highlights the possibility of observing both pleural effusion and pneumothorax in children [32]. To solve the problem of two diseases existing in the same image, we dealt with each combination as a new single class; however, this increased the number of classes and, hence, the difficulty of the inter-class similarity problem. According to the above literature, the proposed model classified classes of evidence as follows:
Class 1: Pleural effusion
Class 2: Pneumonia
Class 3: Pneumothorax
Class 4: Tuberculosis
Class 5: COVID-19
Class 6: Pleural effusion and pneumonia
Class 7: Pneumothorax and pleural effusion
Class 8: Normal status
3.2 Dataset collection from different sources
The dataset used in this study was collected from a global source: the National Institutes of Health CXR Dataset (ChestX-ray8), Stanford University Medical Center Shared Dataset, and Kaggle and combined with the local dataset from Saudi Hospital. This dataset included 51,889 frontal CXR images classified into eight categories: COVID-19, pneumonia, pneumothorax, tuberculosis, pleural effusion, pleural effusion and pneumonia, pneumothorax and pleural effusion, and normal. Table 3 shows the size, source, and description of each disease used in the dataset. The dataset was split randomly into 75% training, 5% validation, and 20% testing, as presented in Table 4.
Dataset file sizes and sources
| Disease | Dataset size | Description |
|---|---|---|
| Pleural effusion | 8,567 | The dataset contains 8,567 frontal view CXR images for effusion disease |
| Pneumonia | 8,198 | The dataset contains 8,198 frontal view CXR images for pneumonia disease |
| Pneumothorax | 3,460 | The dataset contains 3,460 frontal view CXR images for pneumothorax disease |
| Tuberculosis | 2,336 | The dataset contains 2,336 frontal view CXR images for tuberculosis disease |
| COVID-19 | 12,739 | The dataset contains 12,739 frontal view CXR images for COVID-19 disease |
| Pleural effusion and pneumonia | 3,058 | The dataset contains 3,058 frontal view CXR images for pleural effusion and pneumonia diseases together |
| Pneumothorax and pleural effusion | 1,998 | The dataset contains 1,998 frontal view CXR images for pneumothorax and pleural effusion diseases together |
| Normal | 11,533 | The dataset contains 11,533 frontal view CXR images for normal status |
Dataset distribution across training, validation, and testing sets
| Training | 75% | The file contains the frontal view of CXR images with a description of all pulmonary diseases and is used to train the model |
| Validation | 5% | The file contains the frontal view of CXR images to evaluate the performance of the model during training |
| Testing | 20% | The file contains an unseen frontal view of the CXR images to test performance and accuracy |
3.3 Solving the problem of imbalanced datasets
One of the greatest challenges in developing and optimizing a ViT model to detect pulmonary diseases is finding a balanced large dataset that includes both CXR images with single diseases (e.g., tuberculosis) and images with two conditions (e.g., pneumothorax and pleural effusion). To overcome the limitations of imbalanced datasets, avoid overfitting, and improve model performance, we applied the data augmentation technique (i.e., the resampling technique) to minority classes, as shown in Figure 1.
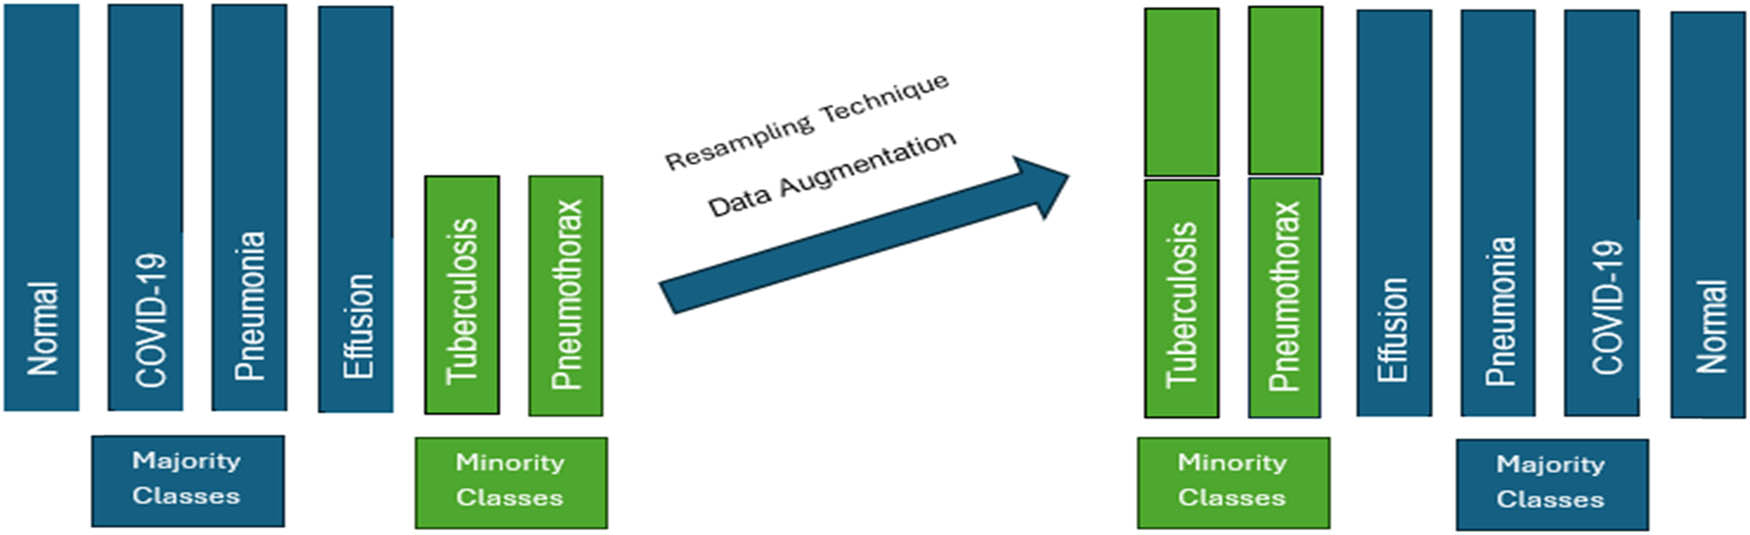
Resampling proposed technique (created by the authors).
Before applying data augmentation to the minority classes, it was necessary to define the target number of images that had to be reached in such classes; this was the average of the number of images in all the classes, which is defined as follows:
where N is the total number of classes, and Class Count ⅈ is the number of images in each Class (i).
After obtaining the target count, we obtained the number of images needed for each minority Class (i), as follows:
Table 5 shows the total number of images for each class before and after the data balancing process.
Number of images in each class before and after the dataset balancing process
| Imbalanced datasets | Balanced datasets | ||
|---|---|---|---|
| Class | No. of images | Class | No. of images |
| Pleural effusion | 8,567 | Pleural effusion | 8,567 |
| Pneumonia | 8,198 | Pneumonia | 8,198 |
| Pneumothorax | 3,460 | Pneumothorax | 7,490 |
| Tuberculosis | 2,336 | Tuberculosis | 7,961 |
| COVID-19 | 12,739 | COVID-19 | 12,739 |
| Pleural effusion and pneumonia | 3,058 | Pleural effusion and pneumonia | 6,205 |
| Pneumothorax and pleural effusion | 1,998 | Pneumothorax and pleural effusion | 7,535 |
| Normal | 11,533 | Normal | 11,533 |
| Total number of imbalanced datasets | 51,889 | Total number of balanced datasets | 70,228 |
3.4 Expert-guided data cleaning
Because of uncertainties concerning certain diseases in some data sources, we reviewed, cleaned, and corrected the dataset with radiologists from the National Guard Hospital and a consultant physician from the Pulmonary Medicine Department to ensure accuracy and remove any incorrect data or unclear images.
3.5 Improving image quality using CLAHE
The CXR image dataset was collected from various sources. To achieve a high prediction accuracy for the classification, the images had to be clean, balanced, and enhanced. We utilized the CLAHE technique in the data preprocessing phase to enhance the images and improve their contrast [33]. CLAHE is an enhancement technique based on adaptive histogram equalization that can improve the visual contrast by expanding the intensity range or stretching out the most common intensity value found in the image [34]. The CLAHE technique splits the image into sub-images called “blocks” and then equalizes the histogram of each block separately, which helps to improve the contrast and the results in a very visible way. Figure 2 shows an example of the enhancement gained when using the CLAHE technique.
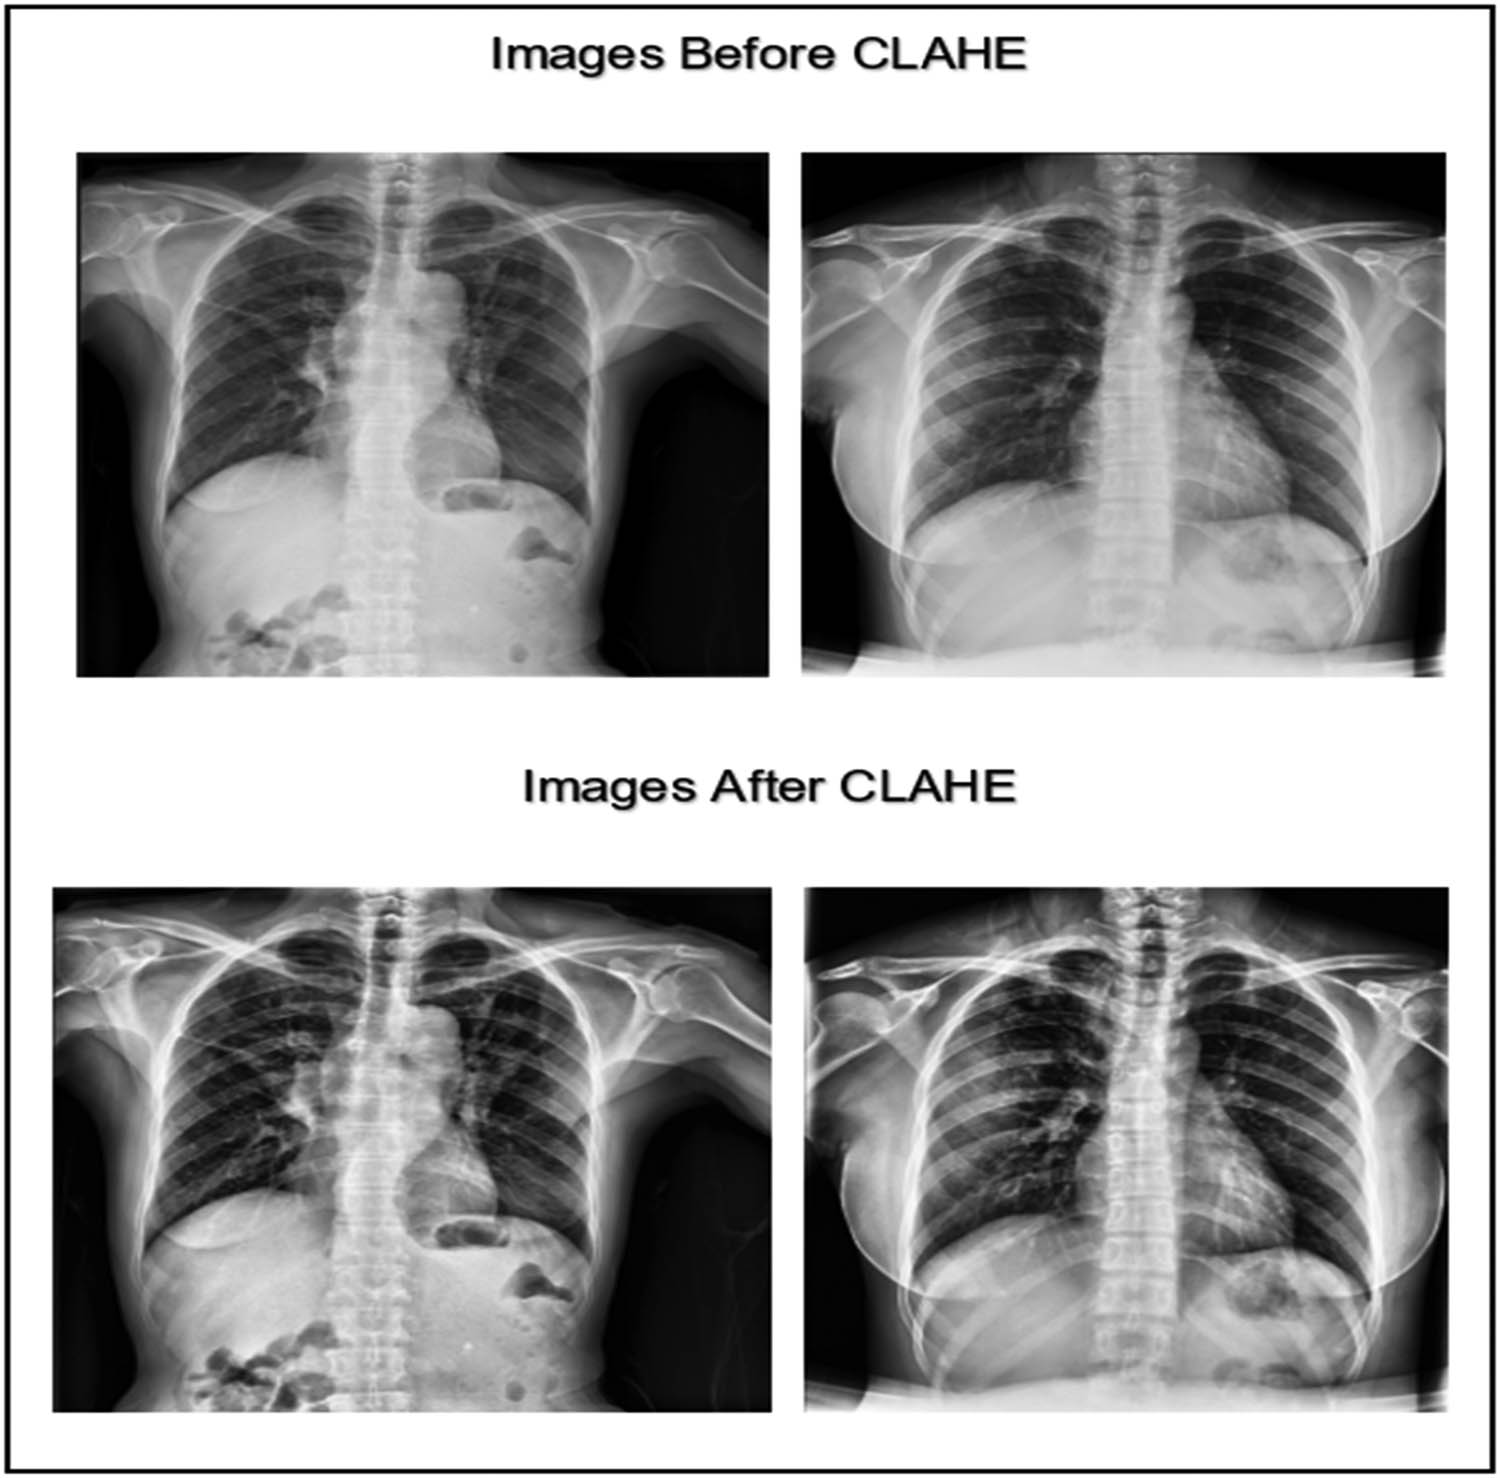
CXR images before and after applying the CLAHE enhancement technique (created by the authors).
Figure 3 displays the chart of the histogram of pixel distribution versus the gray levels in an image after applying the CLAHE technique. The chart shown indicates that the image has good contrast and high visibility because the pixel intensities are approximately evenly distributed across the range from 0 to 255.
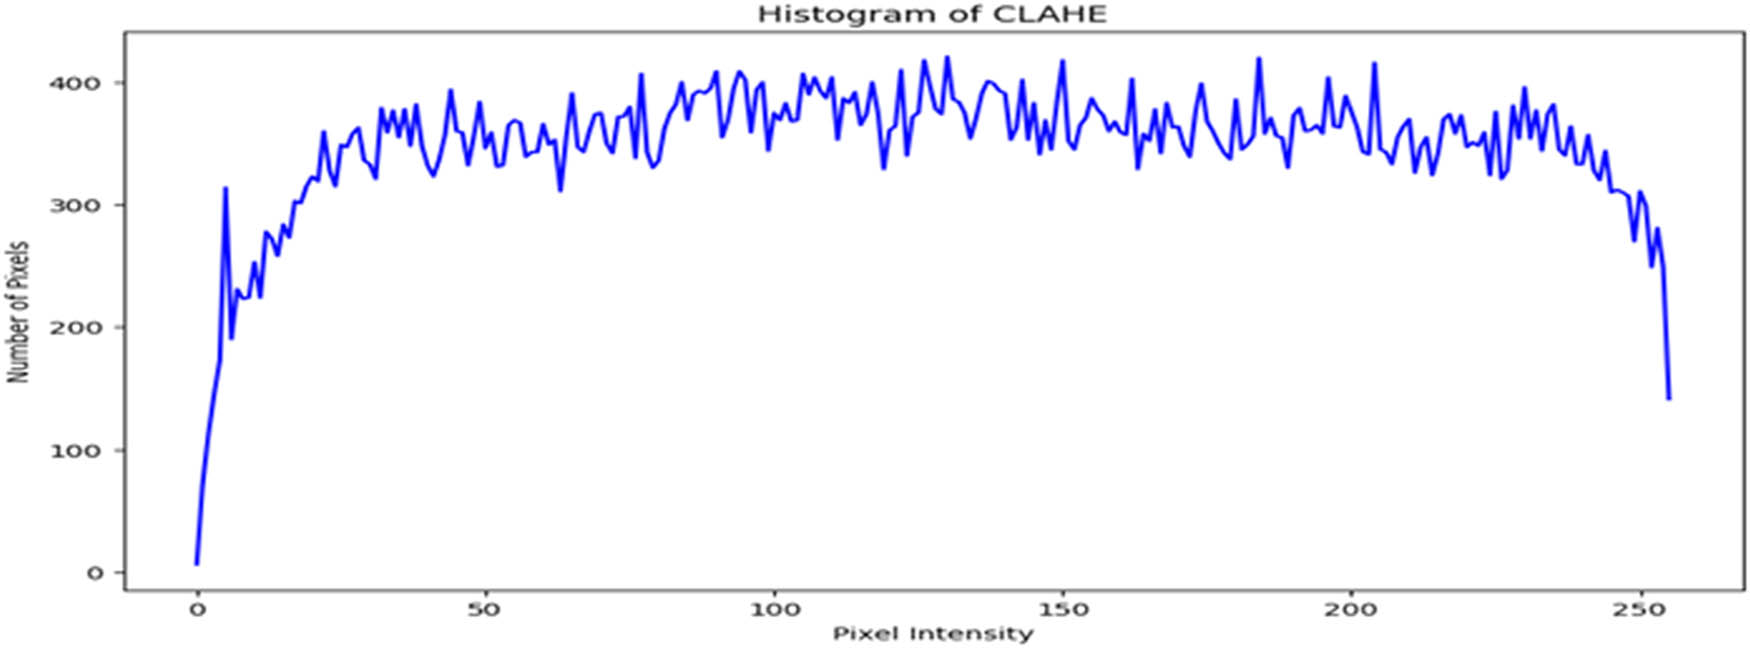
Intensity distribution histogram after applying the CLAHE enhancement technique (created by the authors).
3.6 Improving the model’s generalization via data augmentation
To make the model more robust and improve its generalization, we utilized the data augmentation training options to increase the size of the training dataset. Table 6 shows the parameters we used for data augmentation during the training of our model.
Data augmentation parameters
| Augmentation type | Parameter values |
|---|---|
| Image random horizontal direction | flip left right |
| Image random vertical direction | flip up down |
| Random brightness | max_delta = 0.1 |
| Image random contrast | lower = 0.9, upper = 1.1 |
| Image random hue (color component) | max_delta = 0.1 |
| Image random saturation | lower = 0.9 and upper = 1.1 |
3.7 Minimizing data imbalance with the class weight technique
In the model, class weights were calculated before training using the compute_class_weight function from the sklearn.utils.class_weight module to address class imbalance in the dataset. The formula used is:
Where:
N is the total number of samples in the dataset,
is the number of samples in classi,
C is the total number of classes.
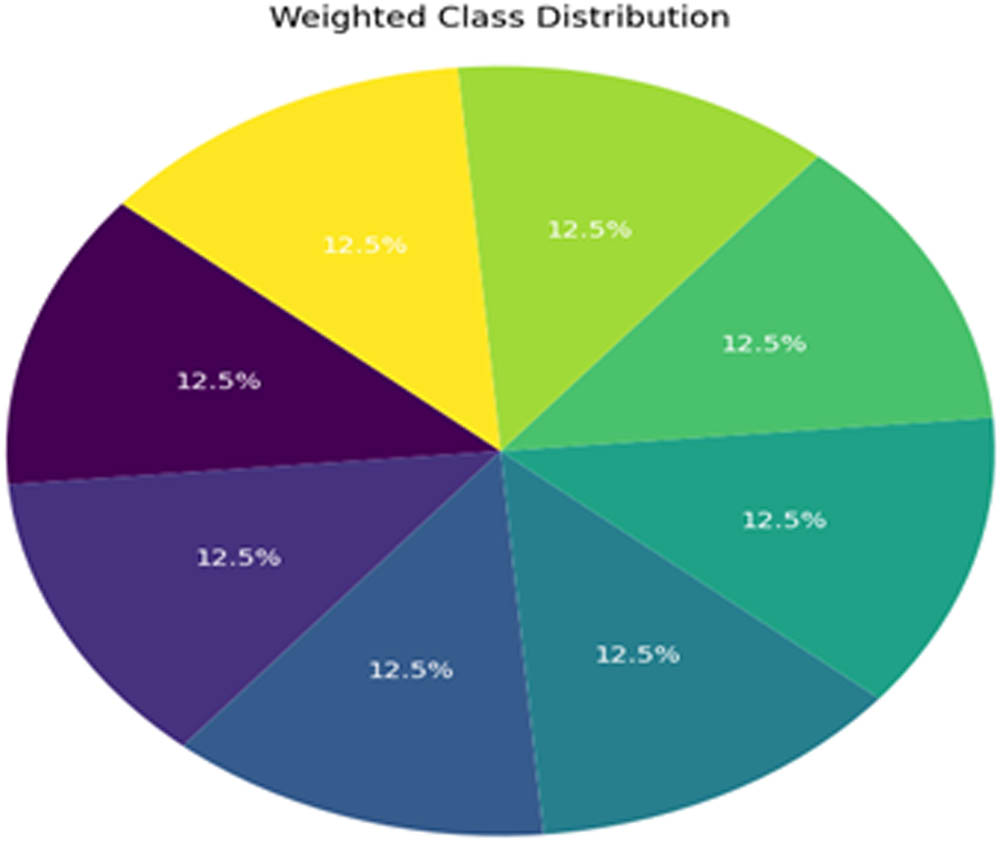
Computed weight distribution for each class (created by the authors).
These calculated weights were then incorporated into the training phase through the fit function. The class_weight parameter adjusts the loss function dynamically to impose higher penalties for errors involving underrepresented classes.
This modification penalizes misclassifications of minority classes more heavily, thereby encouraging the model to learn from these underrepresented instances.
3.8 Experimental setup of the model comparison conditions
To prove its performance and robustness, the proposed model was compared with the well-known CNN pre-trained models (VGG16, VGG19, ResNet50, InceptionV3, and DenseNet121). The same data were used, and all the abovementioned techniques were applied, including balancing the dataset, applying class weights to avoid bias, utilizing CLAHE, and performing data augmentation. During the comparison, it was observed that applying the same hyperparameters used for the Vision Transformer (ViT-B16) model (e.g., a learning rate of 10⁻6) led to difficulties for the CNN models in effectively adapting to the dataset. To address this challenge, the hyperparameters for the CNN models were adjusted. Specifically, the learning rate was increased to 10⁻³, the batch size was set to 120, and the training epochs were extended to 100. These adjustments provided the CNN models with sufficient time and capacity to adapt to the large and diverse dataset.
3.9 Customizing the proposed architecture
In these experiments, the powerful pre-trained ViT was utilized, and fine-tuning was performed to improve the accuracy of the classification of pulmonary diseases. The hyperparameters and model architecture were meticulously fine-tuned for optimal results. Nearly 50 experiments were conducted to adjust the model.
3.9.1 Preliminary experiments on single-disease classification
The initial phase of the study focused on classifying five individual pulmonary diseases – pleural effusion, pneumonia, pneumothorax, tuberculosis, and COVID-19 – alongside a normal status using a pre-trained ViT. During this stage, the encoder layers of the ViT were frozen, and only the top layer was replaced to perform head classification. With a learning rate of 10⁻4 and the application of data augmentation, the model achieved a test accuracy of 86%. However, significant overfitting was observed, as the test accuracy was notably lower than the training accuracy, underscoring the need for better generalization strategies.
To address this, subsequent experiments involved fine-tuning the ViT encoder and optimizing the hyperparameters. Over the course of 20 additional experiments, configurations were systematically adjusted by unfreezing between 2 and 10 encoder layers while experimenting with learning rates of 10⁻4, 10⁻5, and 10⁻6. The test accuracy improved, ranging from 88% to 95%, with some configurations performing better than others. These results demonstrated enhanced performance compared to the initial approach of keeping all encoder layers frozen.
Despite this progress, further optimization was required to achieve ideal results. The learning rate of 10⁻6 was considered optimal for single-disease classification, and it was kept fixed in subsequent experiments. Regarding patch size, the experimental patch sizes were 64 × 64, 32 × 32, and 16 × 16. The choice of 16 × 16 was driven by the need to address inter-class similarity in pulmonary diseases with overlapping radiological features. Smaller patches enabled the model to capture finer details, enhancing generalization and classification performance. The peak accuracy achieved was 95%; this result was obtained after implementing several techniques, including k-fold cross-validation, the use of hyperdense layers as a feature-extraction method with the pre-trained ViT, and ResNet50 combined with ViT. Even with these strategies, 95% test accuracy could not be surpassed. Next, the expertise of radiologists from the National Guard Hospital was sought to refine the dataset, as mentioned in the “Expert-Guided Data Cleaning” section. Additional experiments were then conducted, which involved training the model with 10 and 12 unfrozen encoder layers. This led to a remarkable 98% accuracy in single-disease classification.
3.9.2 Experimental setup for single- and dual-disease classification
Next, two additional classes were created for dual diseases: Class 7 (pleural effusion and pneumonia) and Class 8 (pneumothorax and pleural effusion). While the proposed methodology achieved high performance in classifying single diseases, the same parameters, when applied to dual-disease classification, resulted in a reduction in accuracy to approximately 93%. This highlights the added complexity of distinguishing overlapping features in multi-disease scenarios.
To improve the accuracy of dual-disease classification, we conducted a series of experiments totaling nearly 13 experiments. The following paragraphs summarize the specific modifications and methodologies employed to address the complexities of this task.
First, we started to fine-tune the learning rate using equation (4) to obtain the best initial learning rate for this model:
where a is the initial learning rate, b is the final learning rate, and t is the time step. We concluded that for single-disease and dual-disease classification, the learning rate of 10⁻5 was optimal. Table 7 shows the fine-tuned hyperparameters used to optimize the output model of the training process.
Fine-tuned hyperparameters of the proposed model
| Hyperparameter | Value |
|---|---|
| Image size | 224 |
| Number of channels | 3 |
| Batch size | 16 |
| Learning rate | 1 × 10⁻⁶ |
| Number of epochs | 100 |
| Number of classes | 8 |
| Class name | Pleural effusion |
| Pneumonia | |
| Pneumothorax | |
| Tuberculosis | |
| COVID-19 | |
| Pleural effusion and pneumonia | |
| Pneumothorax and pleural effusion | |
| Normal status |
The data balancing techniques and the fine-tuned parameters for the data augmentation were the same as explained in the preceding section. Regarding the training parameters of the ViT model, initially, to retain the low-level feature weights learnt from the huge ImageNet dataset, we froze the first five encode layers, which are the input layer, embedding layer, reshape layer, class token, and position embedding layer; this means that these layer weights will not be updated during the training, as illustrated in Figure 5.
![Figure 5
Initial phase of the proposed model architecture (adapted from the study of Dosovitskiy et al. [12]).](/document/doi/10.1515/jisys-2024-0419/asset/graphic/j_jisys-2024-0419_fig_005.jpg)
Initial phase of the proposed model architecture (adapted from the study of Dosovitskiy et al. [12]).
Since a large number of datasets were used to train the proposed model, it was important to unfreeze the remaining 12 transformer encoder blocks to allow the model to learn the high-level relationships among the patches and the new image classes. This resulted in an increase in classification accuracy through the multi-head self-attention mechanism and the feedforward multi-layer perceptron function in each encoder block. This contributed to the overall enhancements of the different elements interacting in the training of the proposed model shown in Figure 6.
![Figure 6
Middle and top phases of the proposed model architecture (adapted from the study of Dosovitskiy et al. [12]).](/document/doi/10.1515/jisys-2024-0419/asset/graphic/j_jisys-2024-0419_fig_006.jpg)
Middle and top phases of the proposed model architecture (adapted from the study of Dosovitskiy et al. [12]).
Next, a fully connected dense layer with 512 units and a ReLU activation function were added. Also, to reduce overfitting, a dropout layer with a rate of 50% was inserted. Afterward, another dense layer of 256 units was added; an activation layer was introduced, and another dropout layer of 50% was inserted. At the top of the model, the following components were added: a flattened layer, another dropout layer (with a 50% dropout rate), a final dense layer with a number of output neurons equal to the number of classes (eight), and a SoftMax layer to generate relative priorities for multiclassification. Figure 7 shows the modified ViT-B16 architecture.
![Figure 7
The complete architecture of the proposed model (adapted from the study of Dosovitskiy et al. [12]).](/document/doi/10.1515/jisys-2024-0419/asset/graphic/j_jisys-2024-0419_fig_007.jpg)
The complete architecture of the proposed model (adapted from the study of Dosovitskiy et al. [12]).
To improve the efficiency of the training and the model’s performance, callback and learning rate scheduling were used. During the process of training, callback helps to save the model at a specific checkpoint to obtain the best version of the model and avoid any loss or deterioration because of overfitting. Additionally, EarlyStopping was employed to monitor the loss and stop the training if there was no improvement after a specific number of epochs. This helped to reduce overfitting. Finally, the ReduceLROnPlateau parameter was utilized to monitor the loss. If there was no improvement after three epochs, the learning rate was reduced by multiplying it by 0.2 (Table 8).
Callbacks for the proposed model
| Model checkpoint | Monitor: Accuracy and save best only |
|---|---|
| Early stopping | Loss |
| Patience | 5 |
| Reduce LR on the plateau | Monitor: Loss |
| Factor | 0.2 |
| Patience | 3 |
| Min_lr | 1 × 10⁻⁷ |
| Verbose | 1 |
4 Results and evaluation
4.1 Results
This section presents the results of each experiment and shows how our model accurately classified various pulmonary diseases. We compared our model with the well-known CNN models and state-of-the-art models. We describe below the final experiments and present their purpose and relevant findings.
4.2 ROC–AUC scores of the models for all disease classes
The receiver operating characteristic (ROC) curve and its AUC score indicate how well a model can produce relative scores to discriminate between positive and negative cases across classification thresholds. The ROC–AUC scores range from 0 to 1, with 0.5 indicating random guessing and 1 indicating the perfect performance.
To assess the performance of the proposed ViT-B16 model compared to pre-trained CNNs, the classification of eight pulmonary disease classes was analyzed. The models’ ability to differentiate each disease class against all other conditions was evaluated. Table 9 summarizes the ROC–AUC scores for each class and the overall performance of each model. Figures 8–13 provide the ROC curves for visual comparison.
ROC–AUC scores of the models for each class
| Pathology | VGG16 (Figure 8) | VGG19 (Figure 9) | InceptionV3 (Figure 10) | DenseNet121 (Figure 11) | ResNet50 (Figure 12) | ViT-B16 (proposed model) (Figure 13) |
|---|---|---|---|---|---|---|
| Normal | 0.97 | 0.96 | 0.94 | 0.95 | 0.95 | 1.00 |
| Pleural effusion | 0.95 | 0.94 | 0.93 | 0.92 | 0.91 | 1.00 |
| Pneumonia | 0.99 | 0.98 | 0.99 | 0.99 | 0.98 | 1.00 |
| Pneumothorax | 0.97 | 0.94 | 0.93 | 0.93 | 0.86 | 1.00 |
| Tuberculosis | 0.99 | 0.99 | 0.98 | 0.98 | 0.98 | 1.00 |
| COVID-19 | 0.98 | 0.98 | 0.94 | 0.94 | 0.95 | 1.00 |
| Pleural effusion and pneumonia | 0.98 | 0.98 | 0.98 | 0.98 | 0.97 | 1.00 |
| Pneumothorax and pleural effusion | 0.98 | 0.98 | 0.98 | 0.98 | 0.98 | 1.00 |
| Overall AUC | 0.96 | 0.95 | 0.96 | 0.96 | 0.94 | 1.00 |
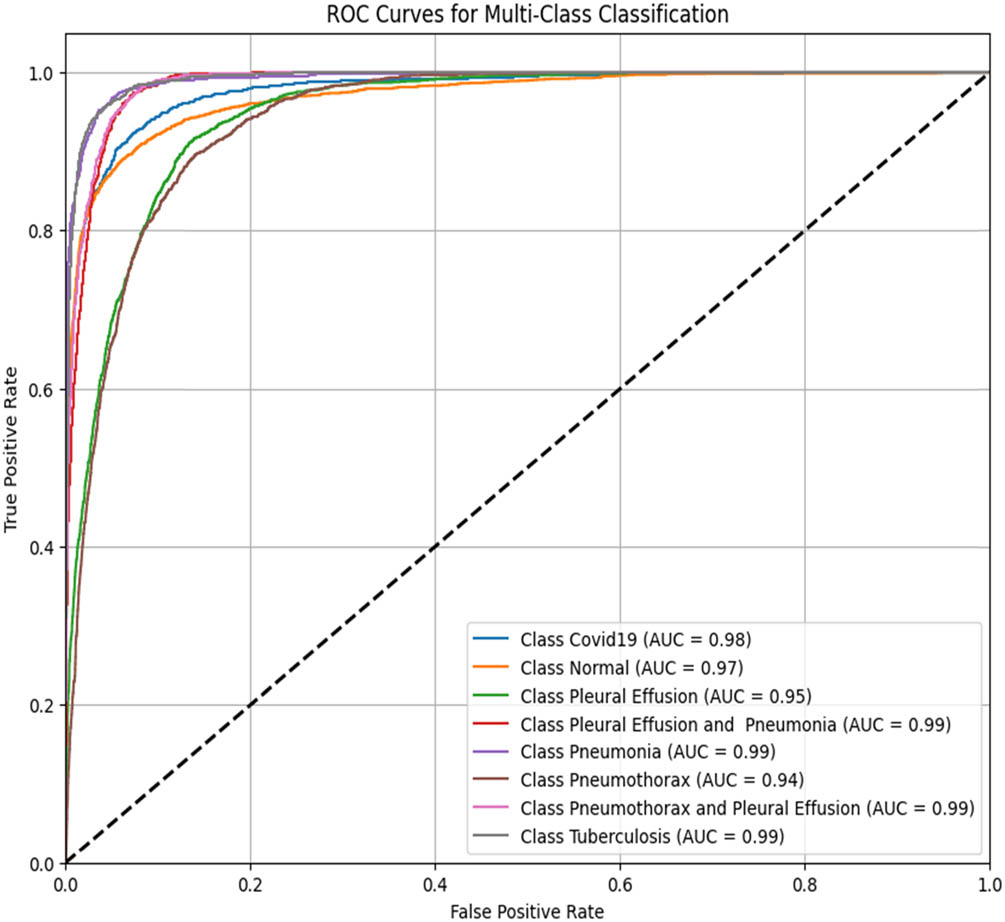
ROC–AUC for the VGG16 model (created by the authors).
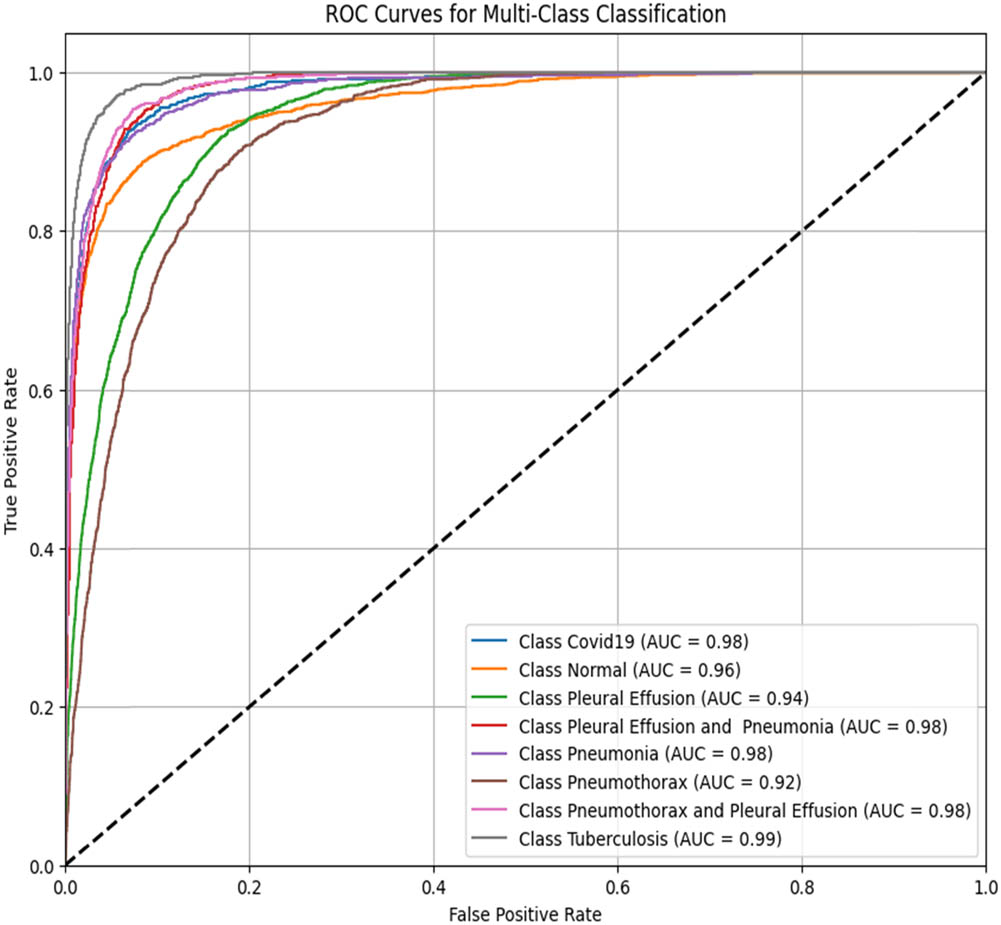
ROC–AUC for the VGG19 model (created by the authors).
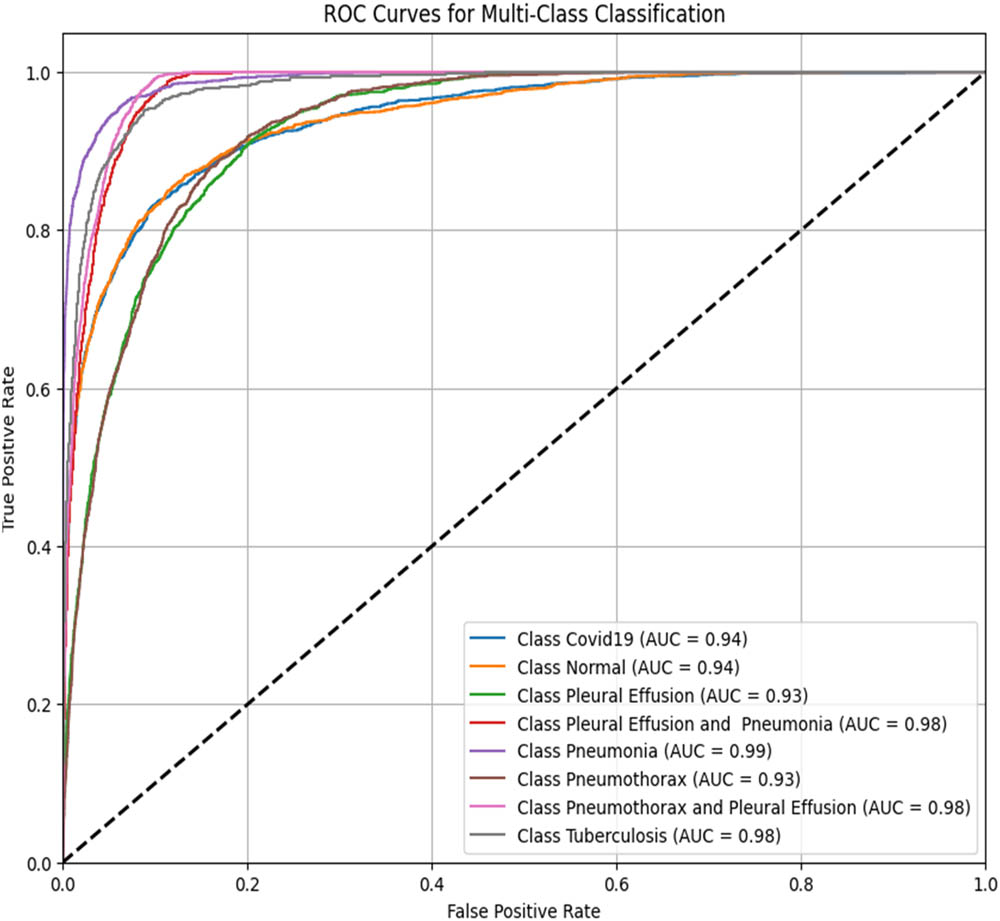
ROC–AUC for the InceptionV3 (created by the authors).
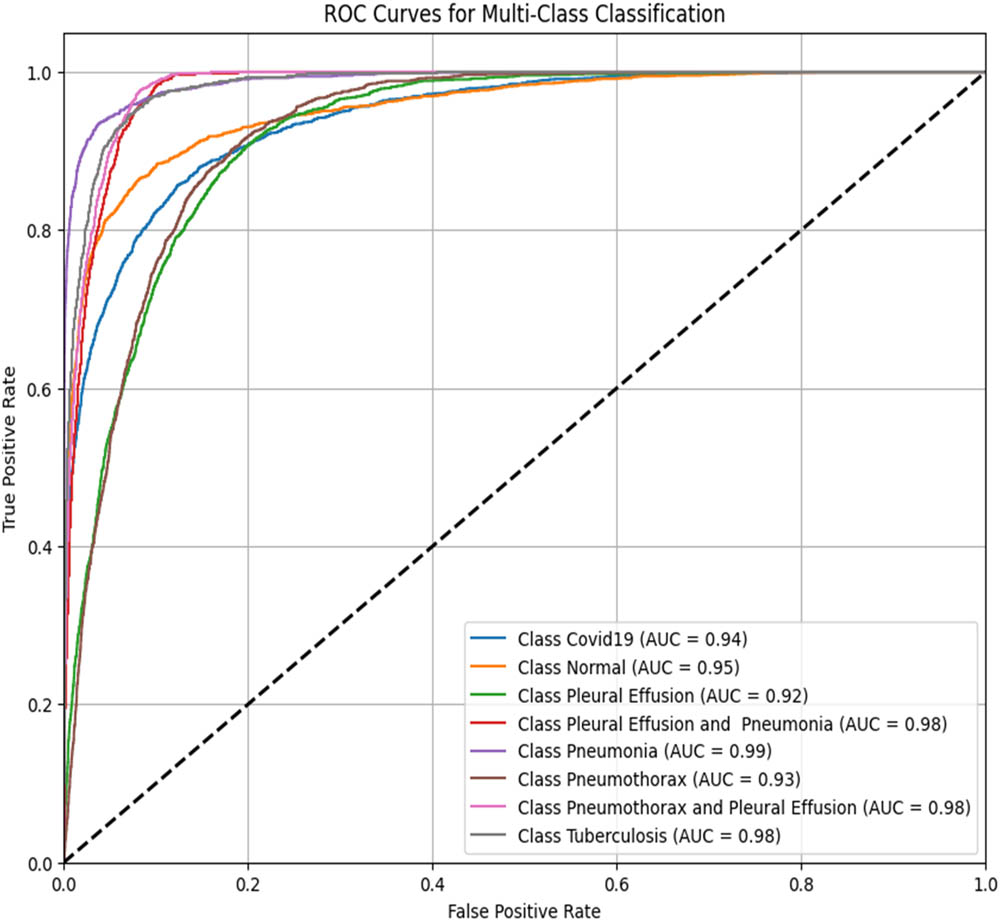
ROC–AUC for the DenseNet121 (created by the authors).
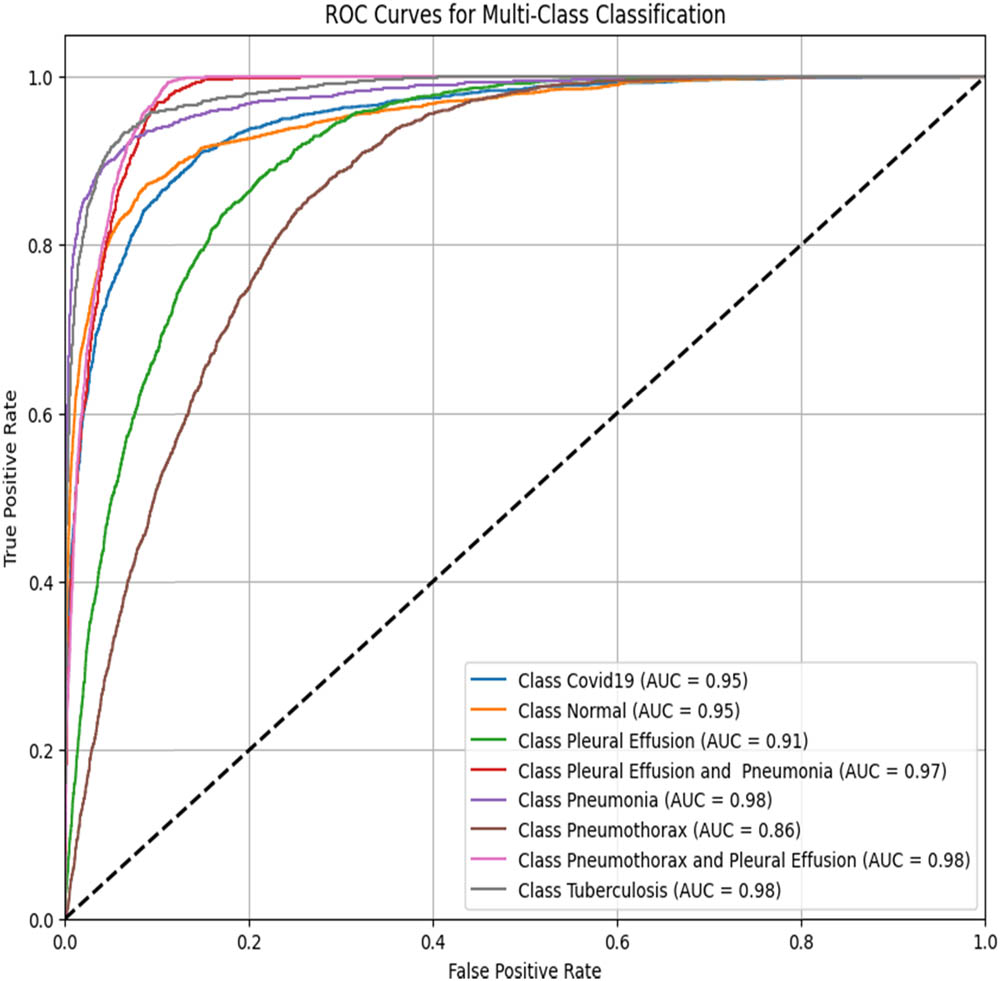
ROC–AUC for the ResNet50 (created by the authors).
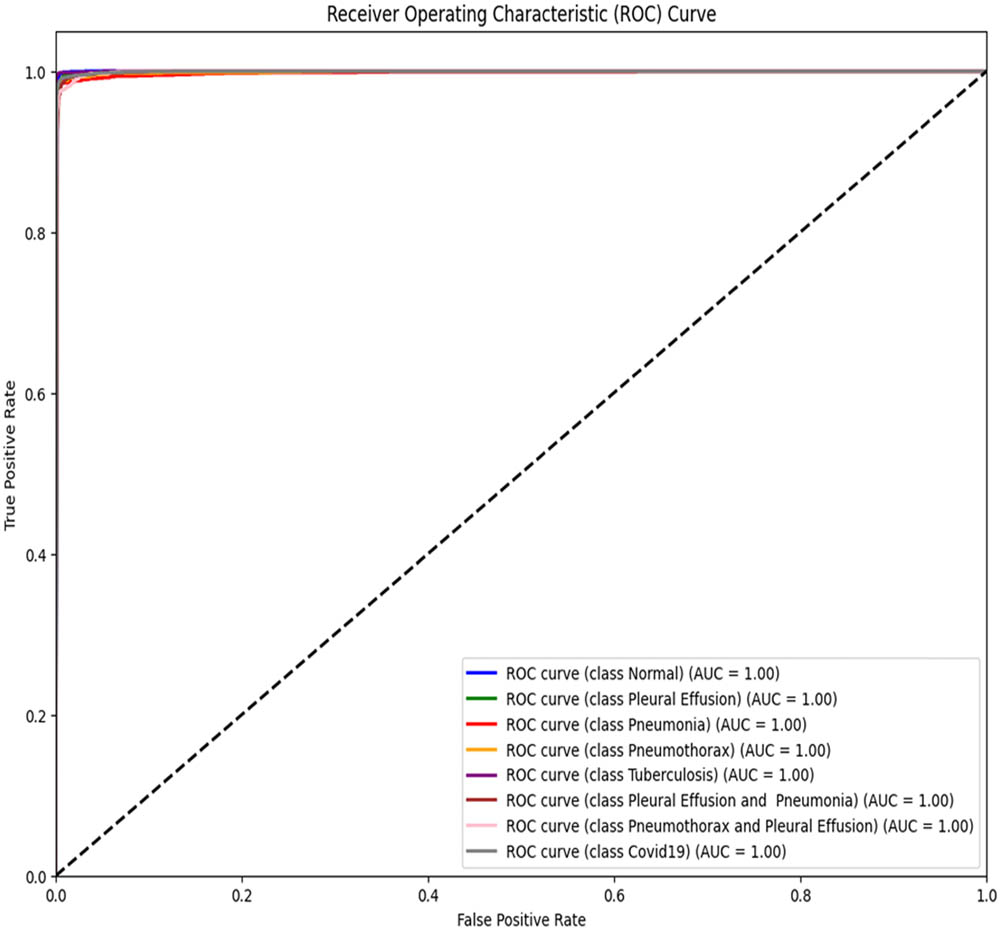
ROC–AUC for the proposed model architecture (created by the authors).
The proposed ViT-B16 model achieved a perfect overall AUC score of 1.00, demonstrating exceptional classification accuracy across all pulmonary disease classes and outperforming pre-trained CNN models such as VGG16, InceptionV3, and DenseNet121, whose overall AUC scores ranged from 0.94 to 0.96. This superior performance can be attributed to the advanced feature extraction capabilities of the ViT, which effectively handles complex patterns in medical imaging data. Figures 8–13 illustrate the performance differences, with the ROC curve for the ViT-B16 model (Figure 13) demonstrating its ability to achieve perfect classification for all classes. These results highlight the efficacy of ViTs as a robust solution for medical imaging tasks, addressing the limitations of traditional CNN models and paving the way for further exploration and clinical deployment.
4.3 Comparison of the performances of the models
The performances of the proposed model for multi-class classification were compared against those of the pre-trained CNN models (VGG16, VGG19, InceptionV3, DenseNet121, and ResNet50). Six experiments were conducted, and the results are presented in Table 10.
Comparison of the performances of different models
| Model | Accuracy (%) | Precision (%) | Recall (%) | F1-score (%) |
|---|---|---|---|---|
| VGG16 | 87.78 | 87.57 | 87.50 | 87.55 |
| VGG19 | 86.47 | 86.34 | 86.11 | 86.22 |
| InceptionV3 | 71.43 | 72.71 | 70.75 | 70.94 |
| DenseNet121 | 71.61 | 72.23 | 70.67 | 71.62 |
| ResNet50 | 68.65 | 69.77 | 66.59 | 67.33 |
| ViT-B16 (proposed model) | 98.18 | 98.11 | 98.10 | 98.18 |
Table 10 shows that the proposed ViT-B16 model significantly outperformed all other models across all metrics, achieving an impressive accuracy of 98.18%, precision of 98.11%, recall of 98.10%, and F1-score of 98.18%. The results show that the proposed model strikes a balance between recall and precision. Among the pre-trained CNN models, VGG16 showed the highest performance, achieving an accuracy of 87.78%, followed by VGG19 with 86.47%. Models such as InceptionV3, DenseNet121, and ResNet50 struggled to achieve comparable performance, with their accuracy ranging between 68.65 and 71.61%. These models exhibited lower recall and F1-scores, reflecting their challenges in balancing false positives and false negatives in multi-class pulmonary disease classification, as shown in Figures 14–18. The results highlight the superior feature extraction and classification capabilities of the ViT-B16 model, which effectively handled the complexity of multi-class classification tasks.

The confusion matrix illustrates the classification results on the test dataset using the VGG16 model. Each cell represents the number of samples classified into the corresponding predicted category (created by the authors).

The confusion matrix illustrates the classification results on the test dataset using the VGG19 model. Each cell shows the number of samples predicted for each class (created by the authors).
The confusion matrix illustrates the classification results on the test dataset using the InceptionV3 model. Each cell shows the number of correctly and incorrectly classified instances for each class (created by the authors).

The confusion matrix presents the classification results on the test dataset using the DenseNet121 model. Each cell shows the number of true versus predicted labels for each class (created by the authors).
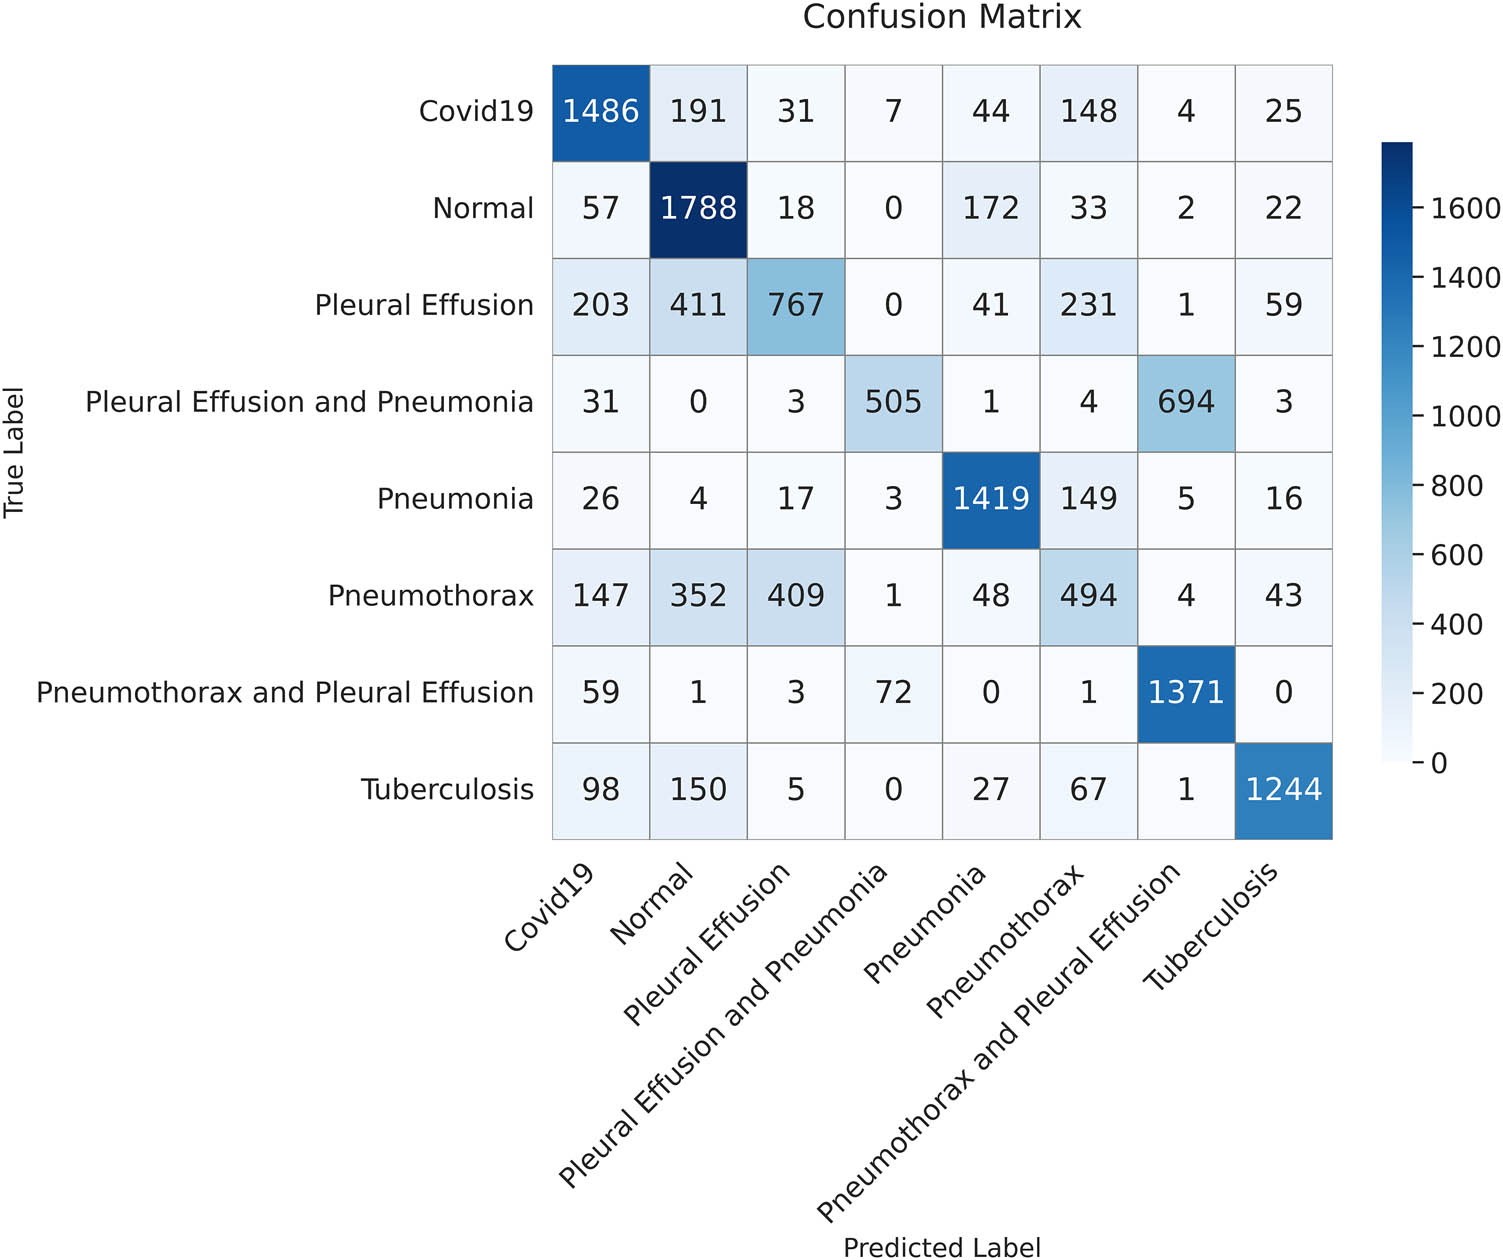
The confusion matrix displays the classification outcomes for the test dataset using the ResNet50 model. Each value represents the number of samples predicted for each class (created by the authors).
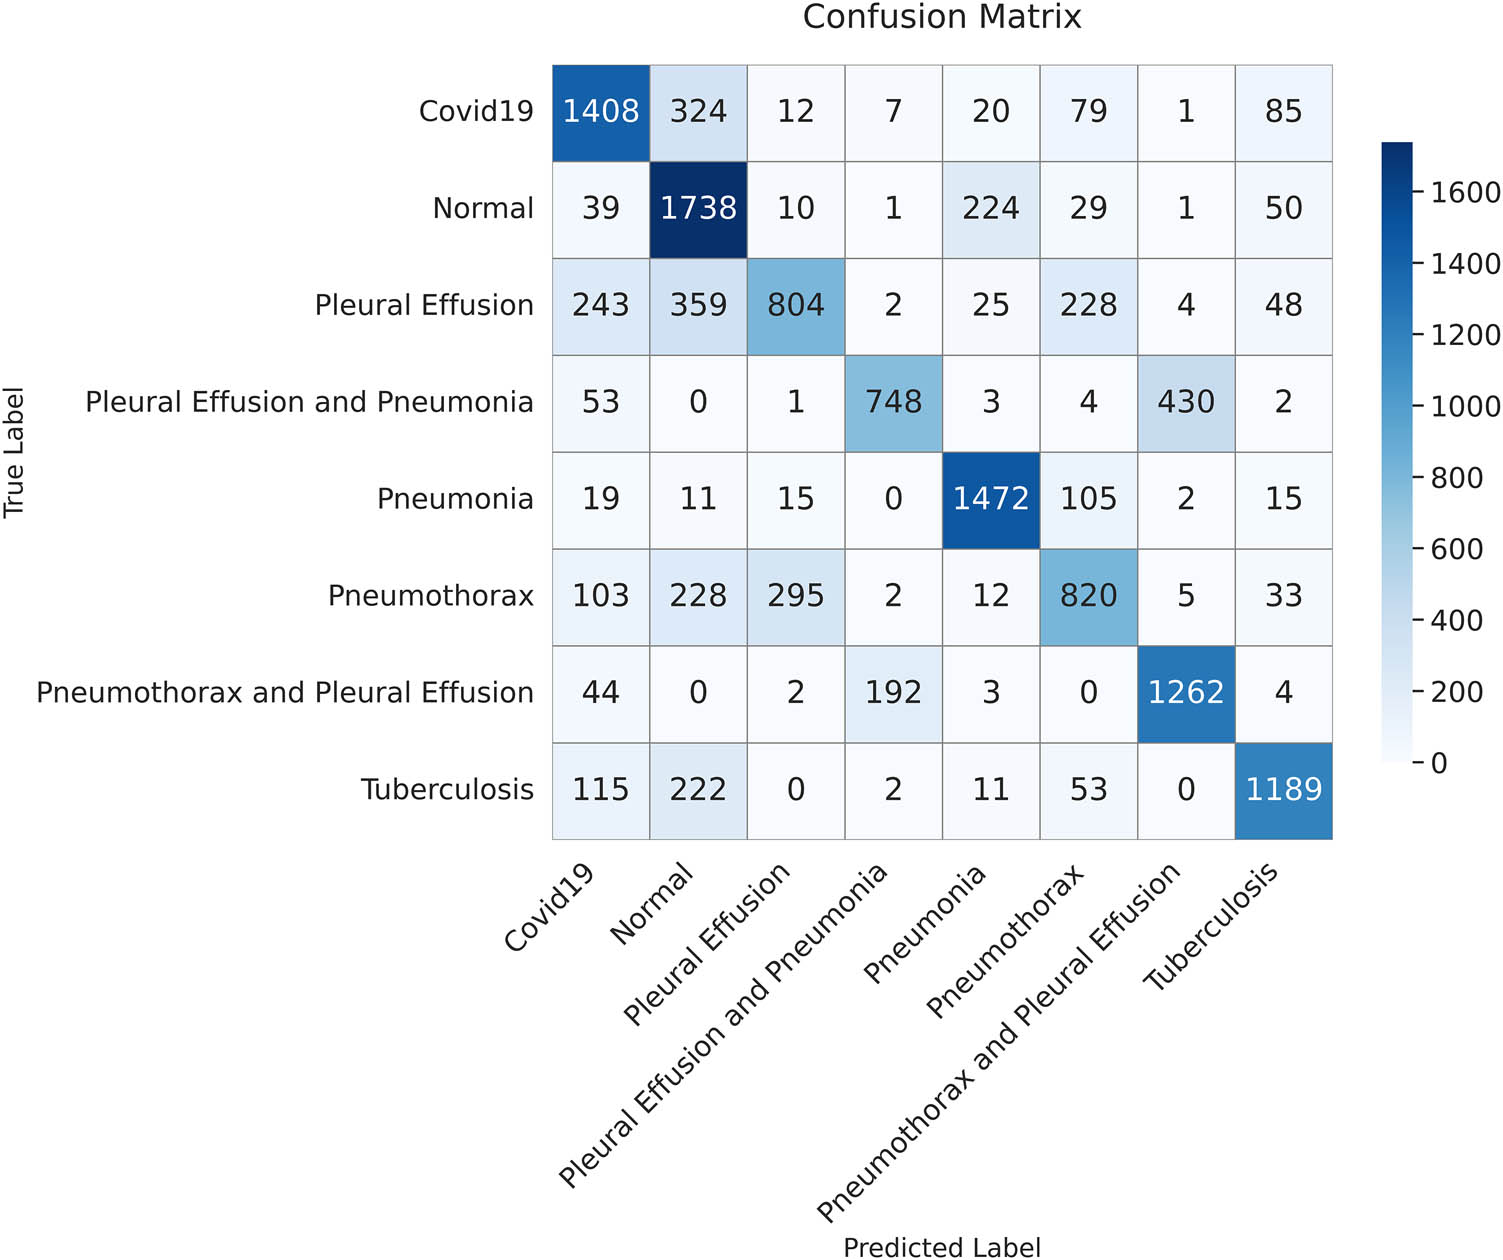
In the medical field, minimizing false negatives is important, especially in serious cases, as predictions affect a patient’s life and might lead to erroneous diagnoses. The confusion matrix in Figure 19 demonstrates how our model minimizes false negatives while maximizing the true positives, which is its strength. Moreover, our model demonstrated a high recall (sensitivity) even in cases where pleural effusion co-existed with either pneumonia or pneumothorax, indicating its ability for accurate disease detection.
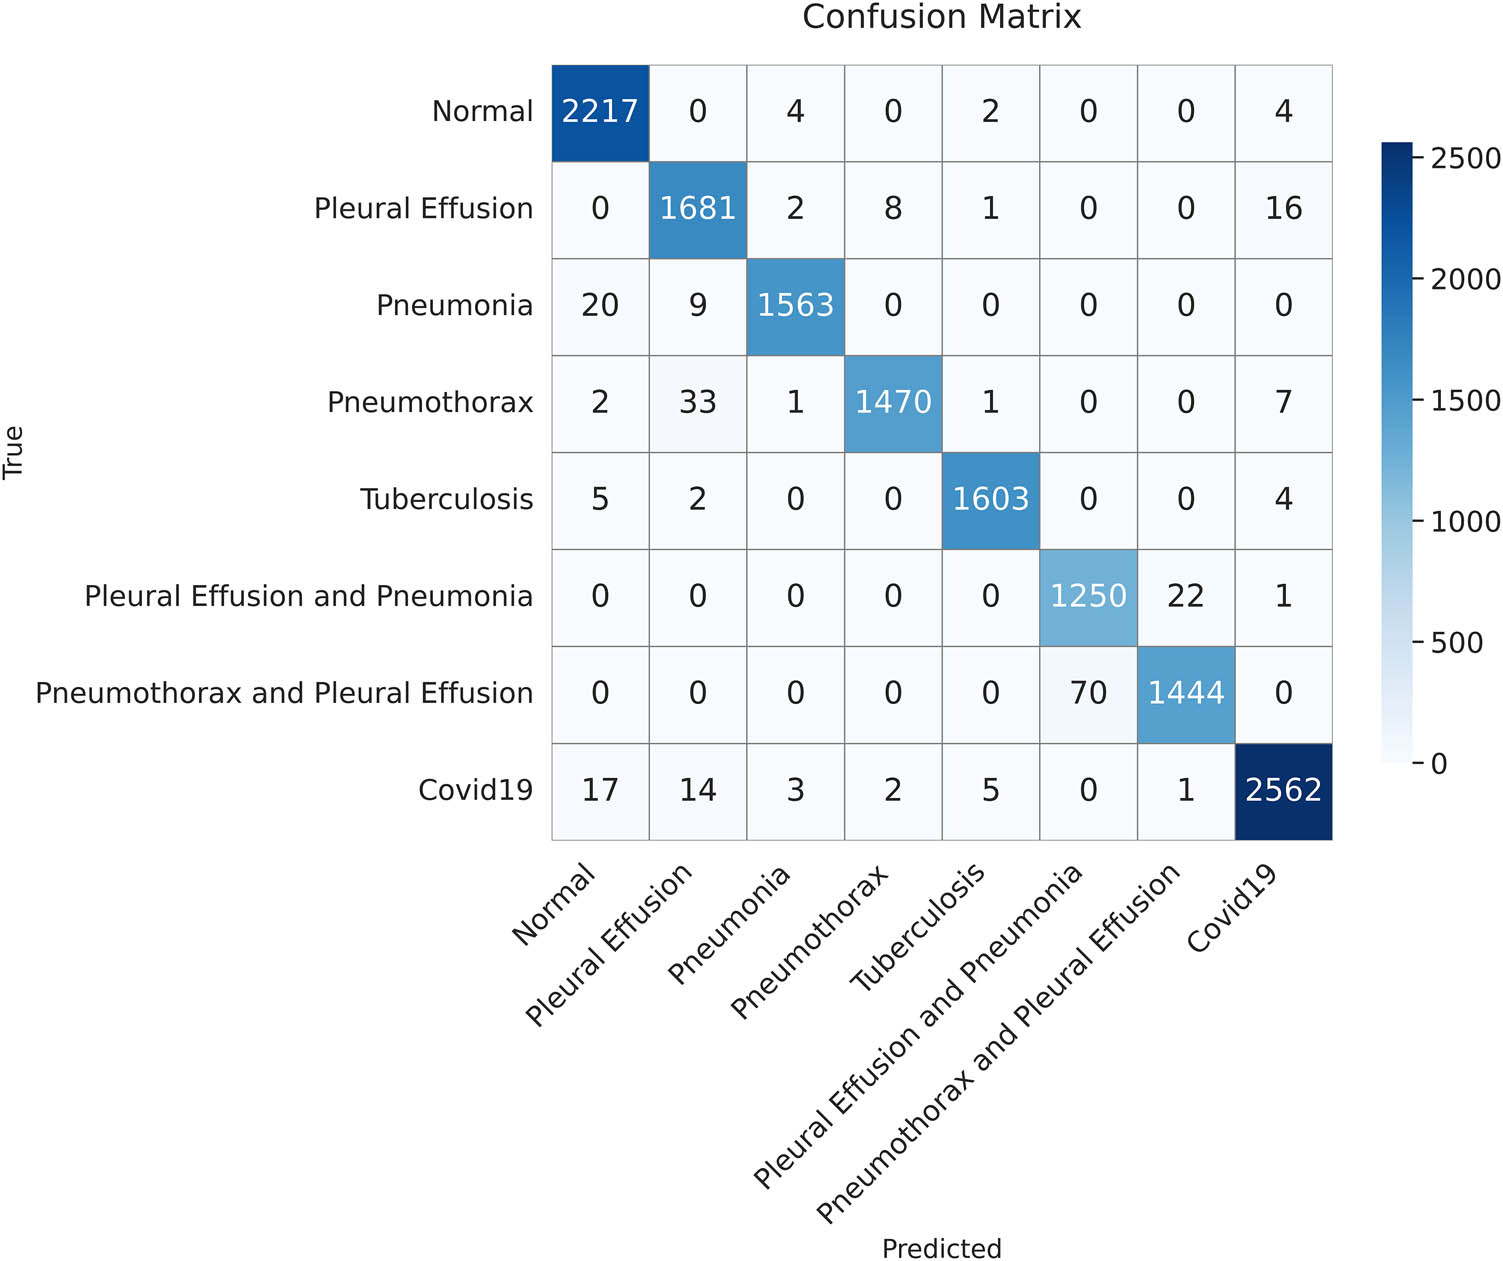
The confusion matrix summarizes the classification performance of the proposed model on the test dataset. Each cell represents the number of instances predicted for each class (created by the authors).
4.4 Class-wise performance evaluation
The ability of the proposed model to correctly classify each class in a multi-class classification was examined. Its performance was evaluated in relation to the output confusion matrix, which was constructed based on the results achieved by the model in classifying the test data.
As shown in Table 11, the highest scores for precision (i.e., the highest percentage of correct labels) were noted in pneumonia, pneumothorax, tuberculosis, and COVID-19. By contrast, a low precision score of 95% was observed when pleural effusion and pneumonia co-existed. As for recall, the highest score was noted in normal cases, indicating the proposed model’s sensitivity in identifying normal conditions. The second highest recall was 99% for tuberculosis, followed by 95% for cases in which pneumothorax and pleural effusion co-existed. The proposed model achieved a good balance between precision and recall for normal cases, pneumonia, tuberculosis, and COVID-19, achieving a high F1-score of 99%.
Class-wise performance evaluation
| Class | Precision (%) | Recall (%) | F1-score (%) |
|---|---|---|---|
| Normal | 98 | 100 | 99 |
| Pleural effusion | 97 | 98 | 98 |
| Pneumonia | 99 | 98 | 99 |
| Pneumothorax | 99 | 97 | 98 |
| Tuberculosis | 99 | 99 | 99 |
| Pleural effusion and pneumonia | 95 | 98 | 96 |
| Pneumothorax and pleural effusion | 98 | 95 | 97 |
| COVID-19 | 99 | 98 | 99 |
4.5 Comparison with other state-of-the-art models
In this subsection, we compare the performance of the proposed model against the recent state-of-the-art models based on the previous results achieved by our model and the reported results for each SOTA case. To ensure a comprehensive and fair comparison, we excluded the models with a dataset of less than 10,000 images. This threshold would ensure that all the other models have sufficient datasets for training and that the evaluation is reliable. Table 12 presents the pulmonary disease classification results of the proposed model along with the different SOTA models involving different techniques.
Comparison of the proposed model with other state-of-the-art models
| Class | Sources | Model | Dataset size | Training (%) | Testing (%) | Accuracy (%) |
|---|---|---|---|---|---|---|
| Viral pneumonia, COVID-19, and normal | [15] | MobileNet and DenseNet | 40,000 | 70 | 30 | 96 |
| Normal, COVID-19, viral pneumonia, and lung opacity (result for the Xception model | [23] | VGG16, DenseNet201, XceptionNet, DarkNet19, and XceptionNet | 14,777 | 70 | 30 | 94.77 |
| Pneumonia, lung cancer, lung opacity, COVID-19, tuberculosis (TB), and normal | [24] | VGG19 + CNN | 80,000 | 80 | 20 | 96.48 |
| Normal, pneumonia, and COVID-19 | [25] | Swin transformer and transformer in transformer | 22,585 | 80 | 5 | 94.75 |
| Pneumonia, tuberculosis, and normal | [26] | Hybrid model based on EfficientNet and ViT | 28,840 | 80 | 10 | 97.72 |
| Normal, COVID-19, viral pneumonia, and bacterial pneumonia | [27] | ViT, FastViT, and CrossViT with different optimizers: Adam, AdamW, NAdam, RAdam, SGDW, and momentum | 19,003 | 80 | 20 | 95.87 |
| Pleural effusion, pneumonia, pneumothorax, tuberculosis, COVID-19, pleural effusion and pneumonia, pneumothorax and pleural effusion, and normal | Proposed | Fine-tuning Pre-train ViT-B16 Model | 70,228 | 80 | 20 | 98.18 |
As shown in Table 12, our model demonstrated a greater classification accuracy than the other models, although it analyzed the highest number of classes. To the best of our knowledge, this study is the first to distinguish between eight classes, including normal conditions and seven pulmonary diseases, which occur either alone or in combination with another disease (i.e., COVID-19, pneumonia, pneumothorax, tuberculosis, pleural effusion, pneumonia, and pleural effusion, and pneumothorax and pleural effusion). Our model demonstrated an accuracy of 98.18%, and it outperformed even those that classified fewer classes and those that included fewer datasets. The models using various ViT architectures [25,26,27] achieved high accuracy, indicating the significant improvement of ViTs in medical imaging-based disease diagnosis. However, our tuned ViT model demonstrated higher accuracies than the shown ViT-based techniques, although distinguishing between more classes due to the well-suited data pre-processing techniques and the perfect tuning of our model’s architecture and its hyperparameters.
5 Limitations
This work attempted to classify eight classes, including normal conditions and seven pulmonary diseases that occur either alone (i.e., COVID-19, pneumonia, pneumothorax, tuberculosis, and pleural effusion) or in combination with another disease (i.e., pneumonia and pleural effusion and pneumothorax and pleural effusion). More effort and additional research are warranted to enhance the ability of the proposed model to accurately identify more pulmonary diseases based on a single CXR image. The availability of a large number of CXR images that exhibit two or more diseases is the main limitation of this study.
The proposed model is optimized for classifying pulmonary diseases based on CXR images only. However, the classification of some pulmonary diseases, such as lung cancer, requires other imaging modalities (e.g., CT scans).
6 Conclusion
Early identification of lung diseases is crucial for stabilizing deteriorating patient health. Manual methods for using CXRs to detect and distinguish between pulmonary diseases can be challenging and time-consuming. Furthermore, low-resource nations lack skilled radiologists, especially in remote areas. In this study, the powerful ViT technique was used to address the critical problems associated with handling inter-class similarities and small datasets. A model was developed that could discriminate eight classes of evidence concerning pulmonary diseases; these classes comprised individual diseases (COVID-19, pneumonia, pneumothorax, tuberculosis, and pleural effusion), combinations of these diseases (pneumonia and pleural effusion, and pneumothorax and pleural effusion), and normal status. This model was based only on CXRs, which are available everywhere. The study employed a large dataset containing 60,358 CXR images collected from a global and a local source to make the model learn diverse patterns and reduce the risk of overfitting. In the data preprocessing phase, different techniques were utilized, such as CLAHE, which enhanced the quality of the images. Data augmentation was employed to help the model recognize diseases in different orientations. To ensure that the model learned effectively from all the classes and to overcome the problem of imbalanced datasets, different approaches were used, including the class weight technique (to avoid bias toward the majority classes) and the oversampling technique (to expand the sizes of the images in the minority classes). The proposed model outperformed most well-known CNN models, such as VGG16, VGG19, ResNet50, InceptionV3, and DenseNet121. While the model showed promising results in classifying multiple pulmonary diseases from single CXR images, limitations remain. The scarcity of large-scale datasets containing images of multiple diseases and overlapping features hindered optimal model training. Additionally, the model’s reliance on CXRs may limit its applicability to diseases requiring additional imaging tools, such as lung cancer. They could extend the proposed framework to pulmonary diseases requiring other imaging technologies, such as lung cancer, which calls for the use of CT scans. Finally, there is still a need to investigate the proposed model in a real-world clinical setting to check the performance of the model in real-world clinical scenarios
Acknowledgments
The authors acknowledge the dean of the FCIT faculty, the head of the IS department, and all the IS members for facilitating a suitable environment for completing this research.
-
Funding information: This research did not receive any specific grant or funding from public, commercial, or not-for-profit agencies.
-
Author contributions: All authors contributed equally to the conceptualization and the methodology compilation of the research in addition to the reviewing of the search results and the process of proofreading either in the first draft of the manuscript or the intermediate review process. The first author individually carried out the process of software building. The first and second authors participated in the verification of the research results. Finally, all authors participated in guiding the research and in the critical review of the research documents and data.
-
Conflict of interest: The authors declare no conflicts of interest associated with this work.
-
Ethical approval: This study was conducted using publicly available and fully anonymized datasets, including the NIH Chest X-ray and other publicly released datasets. As the data do not include any personally identifiable information and were previously collected and released with appropriate approvals, further ethical approval was not required for this study. All research activities are in compliance with institutional guidelines and the Helsinki Declaration.
-
Data availability statement: The datasets used in this study are publicly available and can be accessed at the following sources: Worldometer COVID-19 Death Toll: https://www.worldometers.info/coronavirus/coronavirus-death-toll/. Kaggle X-ray Report Dataset: https://www.kaggle.com/datasets/gauravduttakiit/x-ray-report. Stanford AIMI Dataset: https://stanfordaimi.azurewebsites.net/datasets/8cbd9ed4-2eb9-4565-affc-111cf4f7ebe2. Kaggle Chest X-Ray Dataset (Pneumonia, COVID-19, Tuberculosis): https://www.kaggle.com/datasets/jtiptj/chest-xray-pneumoniacovid19tuberculosis. Kaggle COVID-19 Radiography Database: https://www.kaggle.com/datasets/tawsifurrahman/covid19-radiography-database. Kaggle Chest X-ray (COVID-19 & Pneumonia): https://www.kaggle.com/datasets/prashant268/chest-xray-covid19-pneumonia. Kaggle Pneumothorax Binary Classification Task: https://www.kaggle.com/datasets/volodymyrgavrysh/pneumothorax-binary-classification-task. Kaggle Tuberculosis Chest X-rays (Shenzhen): https://www.kaggle.com/datasets/raddar/tuberculosis-chest-xrays-shenzhen. The Cancer Imaging Archive (TCIA) COVID-19-AR Collection: https://www.cancerimagingarchive.net/collection/covid-19-ar/. All datasets are publicly available for research purposes. Users should refer to the respective dataset sources for any licensing or usage restrictions.
References
[1] “The top 10 causes of death.” Accessed: Sep. 13, 2024. [Online]. Available: https://www.who.int/news-room/fact-sheets/detail/the-top-10-causes-of-death.Search in Google Scholar
[2] “Coronavirus Death Toll and Trends - Worldometer.” Accessed: Sep. 13, 2024. [Online]. Available: https://www.worldometers.info/coronavirus/coronavirus-death-toll/.Search in Google Scholar
[3] Wang X, Peng Y, Lu L, Lu Z, Bagheri M, Summers RM. ChestX-ray8: Hospital-scale chest X-ray database and benchmarks on weakly-supervised classification and localization of common thorax diseases. Proceedings – 30th IEEE Conference on Computer Vision and Pattern Recognition, CVPR 2017, vol. 2017-Janua; 2017. p. 3462–71. 10.1109/CVPR.2017.369.Search in Google Scholar
[4] Zhang X, Gu K, Miao S, Zhang X, Yin Y, Wan C, et al. Automated detection of cardiovascular disease by electrocardiogram signal analysis: A deep learning system. Cardiovasc Diagn Ther. 2020;10(2):227–35. 10.21037/CDT.2019.12.10.Search in Google Scholar PubMed PubMed Central
[5] Goyal S, Singh R. Detection and classification of lung diseases for pneumonia and Covid-19 using machine and deep learning techniques. J Ambient Intell Humaniz Comput. 2023;14(4):3239–59. 10.1007/s12652-021-03464-7.Search in Google Scholar PubMed PubMed Central
[6] Nafisah SI, Muhammad G. Tuberculosis detection in chest radiograph using convolutional neural network architecture and explainable artificial intelligence. Neural Comput Appl. 2024;36(1):111–31. 10.1007/s00521-022-07258-6.Search in Google Scholar PubMed PubMed Central
[7] Rahimzadeh M, Attar A. A modified deep convolutional neural network for detecting COVID-19 and pneumonia from chest X-ray images based on the concatenation of Xception and ResNet50V2. Inform Med Unlocked. 2020;19:100360. 10.1016/j.imu.2020.100360.Search in Google Scholar PubMed PubMed Central
[8] Jia G, Lam HK, Xu Y. Classification of COVID-19 chest X-Ray and CT images using a type of dynamic CNN modification method. Comput Biol Med. 2021;134:104425. 10.1016/j.compbiomed.2021.104425.Search in Google Scholar PubMed PubMed Central
[9] Mohiuddin K, Alam MA, Alam MM, Welke P, Martin M, Lehmann J, et al. Attention is all you need. International Conference on Information and Knowledge Management Proceedings; 2017. p. 4752–8. 10.1145/3583780.3615497.Search in Google Scholar
[10] Radford A. Improving language understanding by generative pre-training. Homol Homotopy Appl. 2018;9(1):399–438. 10.4310/HHA.2007.v9.n1.a16.Search in Google Scholar
[11] Mohammed AH, Ali AH. Survey of BERT (bidirectional encoder representation transformer) types. J Phys Conf Ser. 2021;1963(1):012173. 10.1088/1742-6596/1963/1/012173.Search in Google Scholar
[12] Dosovitskiy A, Beyer L, Kolesnikov A, Weissenborn D, Zhai X, Unterthiner T, et al. An image is worth 16X16 words: Transformers for image recognition at scale. Proceedings of the 9th International Conference on Learning Representations (ICLR), 2021. [Online]. Available: https://arxiv.org/abs/2010.11929.Search in Google Scholar
[13] “CXR8 | Powered by Box.” Accessed: Sep. 22, 2024. [Online]. https://nihcc.app.box.com/v/ChestXray-NIHCC.Search in Google Scholar
[14] Yari Y, Nguyen TV, Nguyen H. Accuracy improvement in detection of COVID-19 in chest radiography. 2020 14th Int. Conf. Signal Process. Commun. Syst. ICSPCS 2020 - Proc; 2020. p. 2–7. 10.1109/ICSPCS50536.2020.9310066.Search in Google Scholar
[15] Tekerek A, Al-Rawe IAM. A novel approach for prediction of lung disease using chest X-ray images based on DenseNet and MobileNet. Wirel Pers Commun. 2023;1–15. 10.1007/s11277-023-10489-y.Search in Google Scholar PubMed PubMed Central
[16] Pranav JV, Anand R, Shanthi T, Manju K, Veni S, Nagarjun S. Detection and identification of COVID -19 based on chest medical image by using convolutional neural networks. Int J Intell Netw. 2020;1:112–8. 10.1016/j.ijin.2020.12.002.Search in Google Scholar
[17] Gupta A, Mishra S, Sahu SC, Srinivasarao U, Naik KJ. Application of convolutional neural networks for COVID-19 detection in X-ray images using InceptionV3 and U-Net. N Gener Comput. 2023;41(2):475–502. 10.1007/s00354-023-00217-2.Search in Google Scholar PubMed PubMed Central
[18] Chowdhury ME, Rahman T, Khandakar A, Mazhar R, Kadir MA, Mahbub ZB, et al. Can AI help in screening viral and COVID-19 pneumonia? IEEE Access. 2020;8:132665–76. 10.1109/ACCESS.2020.3010287.Search in Google Scholar
[19] Jasmine Pemeena Priyadarsini M, Kotecha K, Rajini GK, Hariharan K, Utkarsh Raj K, Bhargav Ram K, et al. Lung diseases detection using various deep learning algorithms. J Healthc Eng. 2023;2023:3563696. 10.1155/2023/3563696.Search in Google Scholar PubMed PubMed Central
[20] Cheah YF. Chest X-ray classification of lung diseases using deep learning. Green Intell Syst Appl. 2021;1(1):12–8. 10.53623/gisa.v1i1.32.Search in Google Scholar
[21] Perumal V, Narayanan V, Rajasekar SJS. Detection of COVID-19 using CXR and CT images using Transfer Learning and Haralick features. Appl Intell. 2021;51(1):341–58. 10.1007/s10489-020-01831-z.Search in Google Scholar PubMed PubMed Central
[22] Narin A, Kaya C, Pamuk Z. Automatic detection of coronavirus disease (COVID-19) using X-ray images and deep convolutional neural networks. Pattern Anal Appl. 2021;24(3):1207–20. 10.1007/s10044-021-00984-y.Search in Google Scholar PubMed PubMed Central
[23] Al-Issa Y, Alqudah AM, Alquran H, Al Issa A. Pulmonary diseases decision support system using deep learning approach. Comput Mater Contin. 2022;73(1):311–26. 10.32604/cmc.2022.025750.Search in Google Scholar
[24] Alshmrani GMM, Ni Q, Jiang R, Pervaiz H, Elshennawy NM. A deep learning architecture for multi-class lung diseases classification using chest X-ray (CXR) images. , Alex Eng J. 2023;64:923–35. 10.1016/j.aej.2022.10.053.Search in Google Scholar
[25] Jiang J, Lin S. COVID-19 detection in chest X-ray images using swin-transformer and transformer in transformer. 9th International Conference on Learning Representations (ICLR). Baghdad, Iraq; 2021. p. 17–20. http://arxiv.org/abs/2110.08427.Search in Google Scholar
[26] Duong LT, Le NH, Tran TB, Ngo VM, Nguyen PT. Detection of tuberculosis from chest X-ray images: Boosting the performance with vision transformer and transfer learning. Expert Syst Appl. 2021;184:115519. 10.1016/j.eswa.2021.115519.Search in Google Scholar
[27] Ko J, Park S, Woo HG. Optimization of vision transformer-based detection of lung diseases from chest X-ray images. BMC Med Inf Decis Mak. 2024;24(1):4–11. 10.1186/s12911-024-02591-3.Search in Google Scholar PubMed PubMed Central
[28] Angara S, Mannuru NR, Mannuru A, Thirunagaru S. A novel method to enhance pneumonia detec1on via a model-level ensembling of CNN and vision transformer. arXiv preprint, arXiv:2401.02358, 2024. [Online]. Available: https://arxiv.org/abs/2401.02358.Search in Google Scholar
[29] Mishra AK, Lal A, Sahu KK, Kranis M, Sargent J. Quantifying and reporting cardiac findings in imaging of COVID-19 patients. Monaldi Arch Chest Dis. 2020;90(4):627–32. 10.4081/MONALDI.2020.1394.Search in Google Scholar PubMed
[30] Xu W, Luo X, Wang H, Shen C, Song Y, Sun T, et al. Pulmonary emphysema, bullae, and pneumothorax in COVID-19 pneumonia. Radiol Case Rep. 2021;16(5):995–8. 10.1016/j.radcr.2021.01.055.Search in Google Scholar PubMed PubMed Central
[31] Grafakou O, Moustaki M, Tsolia M, Kavazarakis E, Mathioudakis J, Fretzayas A, et al. Can chest X-ray predict pneumonia severity? Pediatr Pulmonol. 2004;38(6):465–9. 10.1002/ppul.20112.Search in Google Scholar PubMed
[32] Cleveland RH, Lee EY. Imaging in pediatric pulmonology. 2nd edn. Cham: Springer; 2019. 10.1007/978-3-030-23979-4.Search in Google Scholar
[33] Tjoa EA, Yowan Nugraha Suparta IP, Magdalena R, Nor Kumalasari CP. The use of CLAHE for improving an accuracy of CNN architecture for detecting pneumonia. SHS Web Conf. 2022;139:03026. 10.1051/shsconf/202213903026.Search in Google Scholar
[34] Siddhartha M, Santra A. COVIDLite: A depth-wise separable deep neural network with white balance and CLAHE for detection of COVID-19. 2020;1–25, http://arxiv.org/abs/2006.13873.Search in Google Scholar
© 2025 the author(s), published by De Gruyter
This work is licensed under the Creative Commons Attribution 4.0 International License.
Articles in the same Issue
- Research Articles
- Synergistic effect of artificial intelligence and new real-time disassembly sensors: Overcoming limitations and expanding application scope
- Greenhouse environmental monitoring and control system based on improved fuzzy PID and neural network algorithms
- Explainable deep learning approach for recognizing “Egyptian Cobra” bite in real-time
- Optimization of cyber security through the implementation of AI technologies
- Deep multi-view feature fusion with data augmentation for improved diabetic retinopathy classification
- A new metaheuristic algorithm for solving multi-objective single-machine scheduling problems
- Estimating glycemic index in a specific dataset: The case of Moroccan cuisine
- Hybrid modeling of structure extension and instance weighting for naive Bayes
- Application of adaptive artificial bee colony algorithm in environmental and economic dispatching management
- Stock price prediction based on dual important indicators using ARIMAX: A case study in Vietnam
- Emotion recognition and interaction of smart education environment screen based on deep learning networks
- Supply chain performance evaluation model for integrated circuit industry based on fuzzy analytic hierarchy process and fuzzy neural network
- Application and optimization of machine learning algorithms for optical character recognition in complex scenarios
- Comorbidity diagnosis using machine learning: Fuzzy decision-making approach
- A fast and fully automated system for segmenting retinal blood vessels in fundus images
- Application of computer wireless network database technology in information management
- A new model for maintenance prediction using altruistic dragonfly algorithm and support vector machine
- A stacking ensemble classification model for determining the state of nitrogen-filled car tires
- Research on image random matrix modeling and stylized rendering algorithm for painting color learning
- Predictive models for overall health of hydroelectric equipment based on multi-measurement point output
- Architectural design visual information mining system based on image processing technology
- Measurement and deformation monitoring system for underground engineering robots based on Internet of Things architecture
- Face recognition method based on convolutional neural network and distributed computing
- OPGW fault localization method based on transformer and federated learning
- Class-consistent technology-based outlier detection for incomplete real-valued data based on rough set theory and granular computing
- Detection of single and dual pulmonary diseases using an optimized vision transformer
- CNN-EWC: A continuous deep learning approach for lung cancer classification
- Cloud computing virtualization technology based on bandwidth resource-aware migration algorithm
- Hyperparameters optimization of evolving spiking neural network using artificial bee colony for unsupervised anomaly detection
- Classification of histopathological images for oral cancer in early stages using a deep learning approach
- A refined methodological approach: Long-term stock market forecasting with XGBoost
- Enhancing highway security and wildlife safety: Mitigating wildlife–vehicle collisions with deep learning and drone technology
- An adaptive genetic algorithm with double populations for solving traveling salesman problems
- EEG channels selection for stroke patients rehabilitation using equilibrium optimizer
- Influence of intelligent manufacturing on innovation efficiency based on machine learning: A mechanism analysis of government subsidies and intellectual capital
- An intelligent enterprise system with processing and verification of business documents using big data and AI
- Hybrid deep learning for bankruptcy prediction: An optimized LSTM model with harmony search algorithm
- Construction of classroom teaching evaluation model based on machine learning facilitated facial expression recognition
- Artificial intelligence for enhanced quality assurance through advanced strategies and implementation in the software industry
- An anomaly analysis method for measurement data based on similarity metric and improved deep reinforcement learning under the power Internet of Things architecture
- Optimizing papaya disease classification: A hybrid approach using deep features and PCA-enhanced machine learning
- Handwritten digit recognition: Comparative analysis of ML, CNN, vision transformer, and hybrid models on the MNIST dataset
- Multimodal data analysis for post-decortication therapy optimization using IoMT and reinforcement learning
- Predicting early mortality for patients in intensive care units using machine learning and FDOSM
- Uncertainty measurement for a three heterogeneous information system based on k-nearest neighborhood: Application to unsupervised attribute reduction
- Genetic algorithm-based dimensionality reduction method for classification of hyperspectral images
- Power line fault detection based on waveform comparison offline location technology
- Assessing model performance in Alzheimer's disease classification: The impact of data imbalance on fine-tuned vision transformers and CNN architectures
- Hybrid white shark optimizer with differential evolution for training multi-layer perceptron neural network
- Review Articles
- A comprehensive review of deep learning and machine learning techniques for early-stage skin cancer detection: Challenges and research gaps
- An experimental study of U-net variants on liver segmentation from CT scans
- Strategies for protection against adversarial attacks in AI models: An in-depth review
- Resource allocation strategies and task scheduling algorithms for cloud computing: A systematic literature review
- Latency optimization approaches for healthcare Internet of Things and fog computing: A comprehensive review
- Explainable clustering: Methods, challenges, and future opportunities