Re-investigating the Impact of Economic Growth, Energy Consumption, Financial Development, Institutional Quality, and Globalization on Environmental Degradation in OECD Countries
-
Junyan OuYang
 ,
Muhammad Kamran Khan
,
Muhammad Kamran Khan

Abstract
This study attempts to quantify various macroeconomic variables’ influences on environmental quality. Being significantly negative in character, the impacts of economic growth (EG), energy consumption (EC) levels, financial development (FD) tools, changes in institutional qualities (IQUs), and globalization (GLO) on environmental degradation are regarded worthy of research. The dynamic panel model reports robust results using quantile regression and generalized moment method approaches. Renewable EC, GLO, and IQU significantly reduce the negative impacts on the natural environment across all quantiles. In contrast, electricity consumption has a significant deleterious impact across all quantiles, except at the 95% level, where the impact is not detrimental. EG and FD produce significantly positive injurious effects on the environment across all quantiles. Our findings reveal that callous indifference to global environmental degradation should not be tolerated for economic and ethical reasons, and it falls on the OECD countries to show leadership and take the initiative. OECD countries can mitigate environmental degradation by sharing knowledge and experience of balancing growth to promote sustainable development and responsible consumption globally.
1 Introduction
The recent deterioration in global climatic conditions, caused by an increasing concentration of greenhouse gases (GHGs), has been posing increasingly severe threats to human life and significant concerns for biodiversity. Because of the issue of environmental degradation (Bilgili & Ulucak, 2018), regulators, policymakers, and environmentalists have constantly been searching for the most feasible solutions to the problem of how to achieve the long-term objective of sustainable economic development (ED). Climate change and natural-environment problems such as global warming, deforestation, and desertification have started exerting adverse economic and social consequences for societies. The disruptions in the balance of our ecosystems due to unfavorable climate change can cause climatic disasters and pollution (Charfeddine & ben Khediri, 2016).
The causes and effects of environmental degradation have been extensively analyzed empirically for the last three decades. According to Rehman et al. (2019), economic growth (EG) and energy consumption (EC) have been cited as the most significant factors impacting the environment. An important issue in environmental arguments worldwide is the rise in GHGs, which are seen as a price to pay for economic progress and the use of fossil fuels (Dong et al., 2018). In the existing literature, environmental degradation has also been examined from several angles; among them, one of the most widely used ways is the environmental Kuznets curve (EKC) hypothesis (Aydoğan & Vardar, 2020). Aydin (2019) analyzed using a newly built panel smooth-transition regression model, showing that EKC does not hold for most of the 26 European nations studied over a 1990–2013 time period.
Destek et al. (2018) reported the existence of the traditional EKC nexus between ecological footprint (ECF) and national income in the context of EU economies. Extant research has rarely analyzed these dynamics, particularly from the perspective of institutional quality (IQU), to examine their effects on the degradation of the environment. Figure 1 shows various primary sources of energy usage by OECD and non-OECD countries in the last decade and the projected usage to 2050 (in quadrillion British thermal units on the Y-axis[1]).
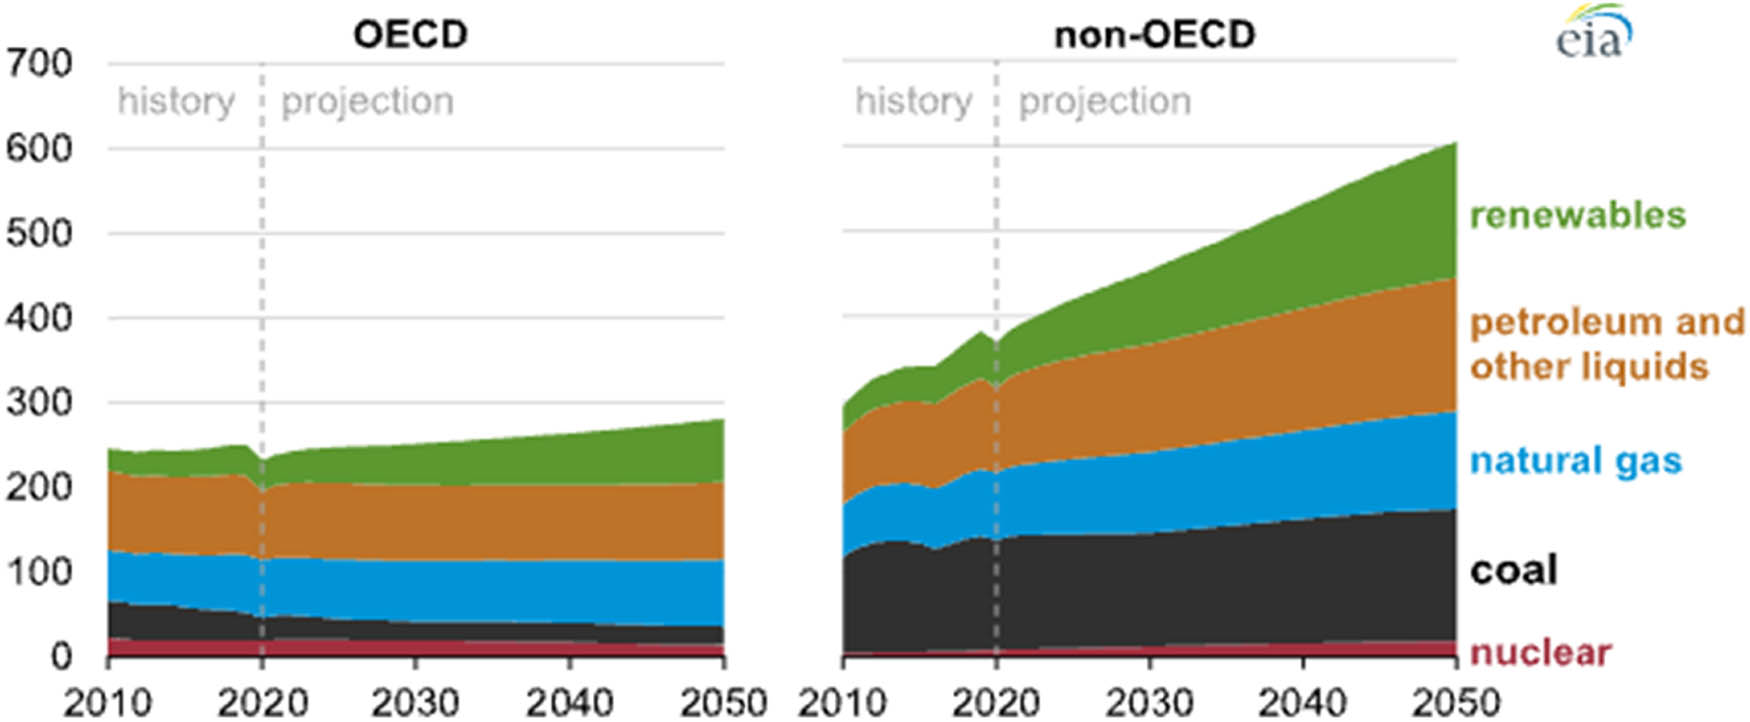
The usage of primary energy sources. Source: US Energy Information Administration, International Energy Outlook 2021.
Figure 2 shows the actual and projected carbon-based emissions caused by energy usage in OECD and non-OECD countries (in quadrillion British thermal units on the Y-axis[2]).

Energy-based CO2 emissions. Source: US Energy Information Administration, International Energy Outlook 2021.
The current research article attempts to analyze the impact of IQU, financial development (FD), globalization (GLO), usage of renewable energy sources (REC), EC, and EG on environmental degradation in the context of OECD economies for the period from 1972 to 2016. (Note: these acronyms are used throughout this article for purposes of parsimony).
This research relies on dynamic panel-data models, i.e., system generalized moment method (GMM) and difference GMM, for analysis. Moreover, further robustness was checked with quantile regression modeling. For the first time, this study combines IQU and GLO with other macroeconomic variables to examine their impacts on environmental degradation in OECD countries. The economies of OECD countries are developing very rapidly. They extensively use energy resources for industrial usage and are hubs of production and consumption. Therefore, the current pattern of economic activities and the ambition to maintain high growth are severe threats to the natural environment in OECD countries.
2 Literature Review
Climate change has become an alarming issue in recent years (Shahbaz et al., 2019). Climate change badly affects both human lives and property. Although a number of factors contribute to climate change, CO2 emissions have received much attention in the literature (Tiba & Omri, 2017). Extensive use of fossil fuels to maintain EG and achieve new heights in development is considered one of the main contributors to climate change (Shahbaz et al., 2019). Zhan et al. (2021) employed a quantile auto-regressive distributed lag parameter approach with quarterly data from 1995 to 2018 and found that IQU and GDP can affect CO2-based emissions. Their findings suggest that CO2 emission increases with an increase in IQU. On the other hand, information communication technology (ICT) and FD negatively impact CO2 emissions. This shows that the CO2 emission level decreases with growth in the ICT and ED.
Islam et al. (2021) analyzed Bangladesh’s growth and attributed it to the contributions and influences of different factors such as IQU, innovation, EC, urbanization, EG, trade volume, FDI, and GLO that also impact its natural environment. Their results show that innovation, FD, and GLO affect the levels of CO2 emissions negatively, thereby helping in improving the quality of environmental indicators, while urbanization, EC, trade volume, and EG increase CO2-based emissions, thereby hastening the degradation of environmental indicators in the short and long-run. The study also reported positive impacts of IQU, measured in terms of the political terror scale (PTS), on CO2-based emissions in the short and long run. Godil et al. (2021) suggested policy implications to encourage innovation, FD, and GLO and carefully utilize institutions’ strengths, urbanization, trade potential, income growth, and EC to ensure optimum quality of environmental indicators amongst the OECD nations.
According to Khan et al. (2021), environmental degradation has posed serious challenges for most developing countries that use energy primarily from sources such as fossil fuels. Consumption of renewable energy (REC) is now highly recommended to mitigate the problem and effects of environmental degradation; however, these economies need the desired policies and efforts to switch towards REC and ensure environmental quality. Khan et al. (2021) used data from 1970 to 2018 and examined the relevance of FD. They found that different energy sources improve environmental quality. Since their findings show that economic expansion degrades environmental quality, governments are encouraged to safeguard environmental quality while pursuing EG using environmentally friendly tactics, proper equipment, and the REC (Khan et al., 2020).
In another environmental study by Le and Ozturk (2020), the changes in environmental indicators were analyzed under the influence of IQU, FD, government spending, and GLO. Researchers incorporated GDP per capita and EC into the EKC model for the 47 emerging markets and developing economies (EMDEs) from 1990 to 2014. They used dynamic common correlated effects, mean group, and the common correlated effects mean group estimator models for their analyses. According to their findings, FD, energy use, government oversight, financial accruals, and GLO enhanced the levels of CO2-based emissions, supporting the EKC theory. In the context of EMDEs, the study revealed the nature of the trade-off between EG and environmental quality. They also proposed vital policy implications for balancing FD, EG, and EC, vis-à-vis the environmental sustainability in a globalized world.
The nexuses among the CO2-based emissions, EG and EC, have garnered considerable research during the last few decades. Yilanci and Pata (2020) used an endogenous structural break to examine the impact of GLO and FD on environmental deterioration and reported that while FD helps curtail the pollution levels in Japan, it significantly improves the ECF in Italy and Canada. EC and GLO increase environmental deterioration, and compared to FD, GLO appears to be a more influential factor in managing environmental footprints in the G-7 countries. However, in the UK, Japan, and France, EG worsens the country’s environmental impact. While EC is critical for economic progress, it also contributes to environmental damage (Owusu et al., 2021). EC continues to degrade the environment in a variety of countries (Ahmad et al., 2016), and therefore, GLO opportunities should be exploited to solve environmental problems.
2.1 EG and CO2-Based Emissions
Using the EKC idea, the literature sheds light on the link between environmental contamination and economic expansion. According to the EKC, the environment deteriorates as output increases till a definite level of EG is reached, at which point pollution decreases as per capita and gross domestic product increase, generating an inverted U-shaped relationship (Grossman & Krueger, 1995).
This occurs when citizens demand that governments enact strict environmental rules to promote a healthy environment. Individuals with higher incomes become more worried about their health. Hence, typically demand a quality environment, which results in policy actions to reduce radiation and encourage a healthy environment. At a more outstanding mark of development, the economic structure is generally changed away from highly polluting industries toward creative and service-oriented output that is largely pollution-free. Since that time, several further studies have been conducted to determine the existence or absence of the EKC, utilizing various contaminants and approaches. Environmental degradation was initially associated with economic expansion, but ecological degradation declined after a specific threshold was reached. Numerous research studies have found contradictory associations between CO2-based emissions and EG (Haseeb et al., 2018; Khan et al., 2021). In light of the above discussion, we formulate the following hypothesis:
H1: EG causes the CO 2 -based emissions to reduce.
2.2 The Linkage between REC and CO2-Based Emissions
Global CO2-based emissions are linked to several different aspects of the economy. Assessment of growth-energy-emissions pollution has moved beyond looking at the link between EG and pollution. When it comes to climate change, REC helps reduce CO2-based emissions while also creating a friendlier environment (Charfeddine & Kahia, 2019). REC is now at the forefront of fighting environmental deterioration, being among the environmental policies incorporated into the strict environmental policy index, a composite measure of relative policy stringency (Gielen et al., 2019). Increased renewable energy supply reduces CO2-based emissions in the BRICS (Chen et al., 2019), but according to Sebri and Ben-Salha (2014), the evidence is different as increased CO 2 emissions diminish the REC in South Africa and India. In Turkey, Bölük and Mert (2015) observed that REC reduces CO2-based emissions; however, Pata (2018) reported a piece of evidence to the contrary. In Turkey, Salim and Rafiq (2012) demonstrated that power generation from RE reduces CO 2 -based emissions significantly and favorably; in Indonesia, Sugiawan and Managi (2016) discovered the same. For Brazil, China, Russia, and India, reported a significantly negative nexus between REC and CO2-based emissions but a positive and insignificant relationship in the context of South Africa. In addition, Acheampong et al. (2019) discovered that increasing REC reduces CO2 emissions for a group of 46 African countries. Because of the discussions mentioned above, we formulated the following hypothesis:
H2: REC causes the CO 2 -based emissions to be reduced.
2.3 FD and CO2-Based Emissions
The link between FD, EG, and CO2-based emissions has been a hot topic in energy economics research during the last few years. Foreign direct investment is critical because it provides the financial resources necessary for EG and ecological quality (Khan et al., 2019c). However, it is unknown if FD has a detrimental effect on ecosystems or a beneficial impact. There are no censuses in the previous studies; some researchers (Khan, 2019b) assert that FD encourages EG but results in CO2-based emissions. GLO facilitates institutional development and changes that encourage further FD and economic progress. Without question, FD furthers and enables countries to utilize their finite resources more efficiently and boost their EG by increasing overall investment (Li & Ramanathan, 2020). As such, the GLO regime encourages both emerging and developed countries to reform their financial sectors, promoting economic advancement (Khan et al., 2019a). Customers might also get more convenient loans as a result of FD. However, no single country can effectively solve energy, and environmental concerns on its own (Kohl, 2019) GLO harms environmental quality via a variety of networks (Xu et al., 2018).
Different nations have unique chances to lead the world in contributing to the growth of new energy technologies. The indication presented above is abundantly evident that FD is critical for advancing further innovation in energy usage and related strategies. Given the discussion above, we formulate the following hypothesis:
H3: An increase in FD causes the CO 2 -based emissions to reduce.
2.4 Electricity Consumption and CO2
Energy is utilized as an input in manufacturing products and services, and it is vital for the economy’s growth and development. As emerging economies develop, energy demand rises, posing a threat to environmental quality. FD is essential for EG and is seen as a significant force behind increased energy demand. FD decreases financial risk and borrowing costs, improves transparency, and stimulates energy demand as a source of investment and FD (Sadorsky, 2010).
Chen et al. (2016) examined the nexuses among the economy, GDP, and carbon-based emissions for the period between 1993 and 2010 for 188 nations. The results demonstrated a one-way causality between economy and carbon emission when the vector error correction model was used. EC was also linked to the CO2-based emissions in 34 nations. Consequent to their findings, the researchers concluded that EC contributes significantly to carbon dioxide emissions. India’s long- and short-term relationships between EC, GDP, and CO2-based emissions have been examined. At both aggregated and disaggregated levels, the presence of EKC was validated using the ARDL approach. EC also contributes to greenhouse gas emissions. Thus, Riti et al. (2018) examined the effect of EC and FC on CO2-based emissions in 90 countries.
According to the dynamic ordinary least squares study, environmental degradation is primarily caused by the EC and GDP. Some researchers have also studied the relationship between EC and carbon emissions; they concluded that EC is the primary cause of CO2-based emissions. Because of the discussions mentioned above, we formulate the following hypothesis:
H4: An increase in electricity consumption causes the CO 2 -based emissions to increase.
2.5 GLO and CO2 Emissions
EG is promoted through GLO, which connects countries and economies worldwide through commerce, investment, and financial transactions. Working together to close innovation gaps, exchange best practices, and extend access to sustainable energy solutions allows countries to speed up the innovation process (Shahbaz et al., 2018). GLO is good for many countries on a macro level. However, there may be pockets of workers who suffer from the competitive pressures from other countries with comparative advantages in their industries. Investment opportunities, capital flows, trade, and cultural linkages worldwide help drive EG and integration. It also aids countries in speeding up the innovation process by emphasizing shared issues and goals, collaborating to close innovation gaps, exchanging best practices, and making clean energy technologies more widely available (Shahbaz et al., 2018).
As a result of GLO, institutions are being reformed, resulting in financial progress and increased economic output. With FD, nations may use their limited resources more efficiently, encourage investment, and increase EG. Apart from the studies mentioned above, the EKC proposition in the Chinese economy was evaluated and found that the GLO regime index and the sub-indices lower the level of CO2-based emissions, thereby increasing environmental quality (Shahbaz et al., 2017). Research on the trade-CO2-based emissions nexus focuses primarily on “trade openness” (Hasanov et al., 2018). Following the discussions above, we formulate the following hypothesis:
H5: GLO causes the CO 2 -based emissions to reduce.
2.6 IQU and CO2
Lau et al. (2014) suggested that competent and unbiased domestic organizations are critical for economic success and carbon release mitigation. Abid (2017) incorporated IQU into the growth emission model for the 41 EU and 58 of the economies sampled from Africa and Middle East countries using a 1990–2011 dataset. He found IQU a critical factor in many economies for lowering CO2-based emissions and raising the targeted EG.
Additionally, according to Sarkodie and Adams (2018), IQU reduced CO2-based emissions by 0.1% in South Africa. Further, Salman et al. (2019) discovered that national institutions contribute significantly to EG and CO2-based emissions reduction. This shows that sound and effective environmental regulations are likely to be a significant determinant. Thus, state institutions must ensure the development and implementation of sound environmental regulation regimes and rules, which, if appropriately applied, will address the global economy’s ecological concerns. Because of the discussions mentioned above, we formulated the following hypothesis:
H6: IQU causes the CO 2 -based emissions to reduce.
3 Methodology
We employ various panel co-integration test equations. The primary function and model equations for the variables considered with the GMM-system estimator in this empirical study are as follows:
| Variables (all except the first are independent) | Description | Data source |
|---|---|---|
| CO2-based emissions (dependent) | Metric tons/capita | OECD |
| Consumption of renewable energy (REC) | Total percentage of primary energy | OECD |
| Consumption of electricity (EC) | Total gigawatt-hours | OECD |
| Growth of economy (EG) | GDP (constant 2010 USD) | WDI |
| FD | The volume of domestic credit extended by the formal sector (% of GDP) | WDI |
| IQU | The law-and-order situation, corruption, the quality of the bureaucracy framework, the accountability of democratic institutions, and government stability | ICRG |
| GLO regime | KOFI GLO Index | KOFI |
We have to verify whether co-integration exists among these variables with differences I (1). Employing the methodology of Phillips and Perron (1988), Fisher Chi-square, and augment Dickey–Fuller (ADF), a panel unit root test was conducted to check if the variables are stationary at level. The Westerlund (2007) co-integration test, the Kao (1999) residual co-integration test, and the Pedroni (2001, 2004) co-integration test were employed before the long-run analysis. The econometric model was used to estimate the GMM model equations for one-step difference GMM, one-step system GMM, and two-step system GMM.
In the case of the between-dimension (mean panel), the group ADF-statistic, group PP-statistic, and the rho-statistics are considered for the testing of the residuals. The system estimator (GMM, one-step system) proposed by Arellano and Bover (1995) and Blundell and Bond (1998) serves as an alternative to GMM-DIF and helps resolve the problems of endogeneity of the independent variables and serial correlation.
The econometric model based on the system GMM approach used in the analysis is as follows:
3.1 Pedroni and Kao Test Equations
This research study uses the logarithm of CO2-based emissions in total metric tons/capita as the dependent variable to assess environmental degradation. The data were sourced from the online sources of the World Development Indicators, while i represents the number of OECD economies sampled in the analysis, and t represents the time framework. The explanatory variables are given and explained in the table above.
Kao (1999) and Pedroni (1999) co-integration estimators estimate the variables’ long-run relationship. Pedroni’s (1999) test is appropriate for variables with a panel unit root or heterogeneous panels. The study applies the Pedroni (1999) test to determine the long-run relationships between CO2, REC, EC, FD, EG, GLO, and IQU. The Kao test is a complementary test that helps analyze whether or not co-integration exists in the residuals’ data series. The Pedroni (1999) test model equation is as follows:
where
Pedroni’s (1999) test contains seven statistics. Four statistics are within a dimension (panels V, Q, PP, and ADF), and three are between the dimensions (panel ADF-static, panel PP-statistic, and panel-rho statistics), and panel v-statistic (nonparametric for variance ratio). These statistics are constructed based on residuals from equation (5).
The Kao (1999) test is concerned with the cross-section of unique intercepts and homogenous coefficients in the first stage of the explanatory variables. Equation (6) presents the Kao (1999) regression test:
where
For the ADF test, estimated residuals are constructed from the following equation:
There is no co-integration, and the ADF test is constructed as presented in the following equation:
and the covariance of
We determine the long-run covariance by using the Kernel estimator as from equation (12)
where K represents the supported kernel function, and “b” represents the bandwidth.
3.2 GMM Model Equations
Difference and system GMM estimators are appropriate for the dynamic panel data. These models perform better in the presence of endogeneity, autocorrelation, and heteroskedasticity.
The difference model equation is
where
We can rewrite equation (12) as
where x′ is a set of explanatory variables.
SYS-GMM Model
3.3 Panel Quantile Regression Equation (PQRE)
The PQRE accounts for the panel data’s unobserved heterogeneity and heterogeneous covariate effects. It is estimated from the following equation:
where
3.4 Westerlund Co-Integration Test
The Westerlund test is appropriate for data that have cross-dependency. It investigates the presence of an error correction for an individual panel or the entire panel. It can be computed from the following equation (17):
where
For the panel-mean statistics, the rejection of the null hypothesis signifies no co-integration for the entire panel. On the other hand, the Westerlund group mean statistics can be calculated as follows:
where
3.5 Cross-Sectional Dependence Test
This test is imperative in the empirical investigation involving panel data, especially in countries with similar economic characteristics like transition, development, and emerging economies. Since widespread GLO may make any economy subject to shock in other countries, testing the cross-sectional dependency (CSD) is required with four widely used tests. For example, the Lagrange multiplier (LM) test is proposed in a situation when the cross-section (N) is smaller than time (T).
4 Results and Discussion
The values for each variable with minimum and maximum values are given in Table 1.
Mean, Std. Dev, Min, and Max statistics
| Variable | Obs. | Mean | Std. Dev. | Min. | Max. |
|---|---|---|---|---|---|
| CO2 emission | 684 | 8.301 | 4.084 | 2.800 | 24.700 |
| REC | 684 | 15.421 | 16.069 | 0.400 | 89.750 |
| EC | 684 | 4.930 | 0.674 | 3.054 | 6.622 |
| EG | 684 | 2.536 | 3.189 | −14.814 | 25.163 |
| IQU | 684 | 0.110 | 1.636 | 0.205 | 2.089 |
| GLO | 684 | 1.908 | 0.037 | 1.774 | 1.961 |
| FD | 684 | 96.018 | 46.039 | 0.186 | 304.575 |
The matrix of correlation shows the link among the variables. Referring to Table 2, a negative as the well insignificant relation has become evident between REC, IQU, and GLO with the emissions of CO2. On the other hand, a positive and insignificant link occurs among EC, EG, and FD with the emissions of CO2. However, the value of the correlation coefficients is relatively low for predictors that are less than 0.70, which indicates that there is no issue of multicollinearity, and this finding is further endorsed by the results of variance inflation factor (VIF), which are lower than the cutoff value of 10, as suggested by an author like Wooldridge (2014). The VIF results are shown in Table 3. Panel unit root (PUR) tests were run with the outcomes of the Levin–Lin–Chu unit root and Harris and Tzavalis (1999) unit root tests, respectively. Results show that the variables employed in our study at the level are not stationary, even though they become stationary when inspecting their first difference, therefore assimilated at I (1).
Correlations matrix
| Variables of the study | CO2 emission | REC | EC | EG | IQU | GLO | FD |
|---|---|---|---|---|---|---|---|
| CO2 emission | 1.000 | ||||||
| REC | −0.284 | 1.000 | |||||
| EC | 0.169 | −0.293 | 1.000 | ||||
| EG | 0.014 | −0.003 | −0.150 | 1.000 | |||
| IQU | −0.301 | 0.306 | −0.030 | −0.111 | 1.000 | ||
| GLO | −0.213 | −0.058 | 0.058 | −0.221 | 0.534 | 1.000 | |
| FD | 0.234 | 0.186 | 0.351 | −0.233 | 0.390 | 0.290 | 1.000 |
VIF
| Study variables | VIF | 1/VIF |
|---|---|---|
| REC | 1.390 | 0.720 |
| EC | 1.370 | 0.729 |
| EG | 1.100 | 0.911 |
| IQU | 1.770 | 0.565 |
| GLO | 1.590 | 0.627 |
| FD | 1.530 | 0.655 |
| Mean VIF | 1.460 |
Thus, all variables in the study are integrated at the level for the common unit root and also for Levin–Lin–Chu and Harris Tzavalis tests, except for the emissions of CO2 and REC. This means that at the level of the PUR test, the null hypothesis cannot be precluded.
Therefore, the variables of the study have a non-stationary unit root. In our study, we have taken the difference at a significance level of 1%, where they all are static. Then, the null hypothesis is precluded (Table 4).
Panel unit root tests
| Levin–Lin–Chu | Harris–Tzavalis | |||
|---|---|---|---|---|
| At level | At difference | At level | At difference | |
| CO2 emission | 1.2672 | −9.7707*** | 3.1093 | −35.9044*** |
| REC | 4.2016 | −8.7335*** | 2.2541 | −40.8294*** |
| EC | −4.5495*** | −12.6984*** | 0.3378 | −31.2775*** |
| EG | −9.6771*** | −18.4656*** | −20.1397*** | −38.5611*** |
| IQU | −11.3454*** | −20.0433*** | −5.1844*** | −26.9416*** |
| GLO | −4.1790*** | −13.6999*** | 1.3502 | −30.9600*** |
| FD | −4.2565*** | −7.1406*** | −2.5345** | −28.4731*** |
**p = <0.01; ***p = <0.001.
As time-series data were employed, it is helpful to assess the CSD using the Pesaran (2004) test. The results are given in Table 5. The null hypothesis is not accepted. Accordingly, among the units, there is a presence of CSD at the CS level.
CSD test
| Study variables | CD test | p-Value | Corr | abs(corr) |
|---|---|---|---|---|
| CO2 emission | 39.33 | 0.000 | 0.360 | 0.662 |
| REC | 63.80 | 0.000 | 0.583 | 0.729 |
| EC | 27.23 | 0.000 | 0.249 | 0.515 |
| EG | 64.94 | 0.000 | 0.594 | 0.595 |
| IQU | 12.33 | 0.000 | 0.113 | 0.428 |
| GLO | 86.17 | 0.000 | 0.788 | 0.814 |
| FD | 16.35 | 0.000 | 0.149 | 0.444 |
As the issue of stationarity has been examined, we now proceed to employ the cointegration tests like Kao (1999), Pedroni (1999), as well as Westerlund and Edgerton (2008) tests. Based on the application of the test results, there is cointegration among the study variables, and the null hypothesis is rejected (Table 6).
Panel cointegration tests
| Statistic | p-Value | |
|---|---|---|
| Kao cointegration test | ||
| Modified Dickey–Fuller t | 1.5822 | 0.0568 |
| Dickey–Fuller t | 1.543 | 0.0650 |
| Augmented Dickey–Fuller t | 3.5243 | 0.0002 |
| Unadjusted modified Dickey–Fuller t | −0.4471 | 0.3274 |
| Unadjusted Dickey–Fuller t | −0.1980 | 0.4215 |
| Pedroni cointegration test | ||
| Modified Phillips–Perron t | 5.4598 | 0.0000 |
| Phillips–Perron t | −8.0410 | 0.0000 |
| Augmented Dickey–Fuller t | −8.0129 | 0.0000 |
| Westerlund cointegration test | ||
| Variance ratio | −1.4114 | 0.0791 |
Dynamic panel model outcomes are shown in Table 7. This study used one-step difference GMM, one-step and two-step systems GMM, respectively, to examine the impact of the independent variables on the dependent variable. The lagged dependent coefficient variable is linked positively with CO2 emission at a 1% significance level in all steps of GMM. In the one-step difference, the REC, as well as GLO, has a significant negative coefficient, whereas EC, EG, and IQU have a meaningful and positive influence on CO2 emissions at the 1% significance level. Further, in the one-step system GMM, the REC, GLO, and IQU have negative significant coefficients at the 5% and 10% levels, respectively, whereas EG, FD, and EC have a substantial and meaningful influence on CO2 emissions at the significance levels of 1 and 10%, respectively. Moreover, in the GMM two-step system, the REC has a significant negative coefficient at a 5% significance level. Thus, the REC contributes to lessening the emissions of CO2. In addition, the results are compatible with the studies of Aydoğan and Vardar (2020), Bilgili et al. (2016), and Shafiei and Salim (2014), but the analyses of Jamel and Derbali (2016) and Ozcan et al. (2020) disagree with the conclusions of our study, as they said that EC produces a positive influence on degradation in the environment. Furthermore, GLO has a significant harmful coefficient at a 5% significance level. As per our study results, GLO can lead to decreasing CO2 emissions. These outcomes are consistent with Muhammad and Khan (2021) and Sahu and Kumar (2020), while the results are not in accord with the findings of the Nathaniel et al. (2021), Nguyen and Le (2020), and Sethi et al. (2020) studies.
Dynamic panel model results
| One-step difference GMM | One-step system GMM | Two-step system GMM | |
|---|---|---|---|
| CO2 | CO2 | CO2 | |
| L. CO2 emission | 0.731*** | 0.999*** | 0.978*** |
| (23.60) | (174.29) | (175.94) | |
| REC | −0.580*** | −0.764** | −0.179** |
| (−4.88) | (−3.47) | (−4.16) | |
| EC | 3.295*** | 1.326* | 0.228*** |
| (6.78) | (2.41) | (11.40) | |
| EG | 0.0452*** | 0.0393*** | 0.0378*** |
| (6.87) | (5.81) | (21.68) | |
| IQU | 0.198*** | −0.166* | 0.222*** |
| (4.95) | (−2.07) | (−5.50) | |
| GLO | −14.63*** | −0.760** | −1.367** |
| (−5.68) | (−3.45) | (−2.84) | |
| FD | 0.202** | 0.499*** | 0.191*** |
| (4.69) | (15.35) | (5.96) | |
| _cons | 1.164* | 2.570** | |
| (2.56) | (2.70) | ||
| N | 612 | 648 | 648 |
**p = <0.05; **p = <0.01; ***p = <0.001.
EC, EG, IQU, and FD have a meaningful impact on the emission of CO2 at a 1% significance level. Accordingly, built on the results, it can be said that EC, EG, and IQU can lead to an increase in the emissions of CO2, and the outcomes agree with the results of Le and Ozturk (2020), Shahbaz et al. (2020), and Usman et al. (2020). FD has a substantial positive impact on the emission of CO2 at a 5% significance level. Thus, FD contributes to higher emissions of CO2. Therefore, the results of Sehrawat et al. (2015) and Shahbaz et al. (2020) are compatible with our study results. Thus, it can be suggested that the effects are strong, based on the dynamic panel model with quantile estimations at the 10, 25, 50, 75, and 90% levels for the study variables for REC, EC, EG, IQU, GLO, and FD.
Table 8 shows the quantile regression results, which indicate that all variables in the study substantially influence the environment across the varying quantiles. For instance, REC produces adverse significant effects on the environment across all quantiles, and the outcomes are consistent with the results of the Mbarek et al. (2018) and Zaman et al. (2021) studies but not in accord with the outcomes of the studies by Ozcan et al. (2020), Raza et al. (2019), and Saboori and Sulaiman (2013). Further, across all quantiles, GLO shows adverse significant effects on the environment in terms of emissions of CO2. However, these results are not in accord with the Adebayo and Acheampong (2022) and Sethi et al. (2020) studies.
Robustness checks quantile regression results
| Simultaneous quantile regression | QRPD | ||||
|---|---|---|---|---|---|
| Q25 | Q50 | Q75 | Q95 | ||
| REC | −0.8832** | −0.0740*** | −0.1040*** | −0.152*** | −0.0553*** |
| (−3.99) | (−11.14) | (−3.00) | (−11.39) | (−26.95) | |
| EC | 0.5812** | 0.6020* | 1.5420*** | −1.095** | 0.5973*** |
| (3.72) | (2.38) | (7.07) | (−2.31) | (23.85) | |
| EG | 0.8123** | 0.2343*** | 0.1600** | 0.2350*** | 0.0460*** |
| (3.69) | (5.21) | (2.25) | (3.58) | (5.09) | |
| IQU | −1.255*** | −1.1920*** | −0.9130* | −1.1290*** | −1.0528*** |
| (−7.84) | (9.75) | (−1.87) | (−10.60) | (−74.68) | |
| GLO | −5.3010*** | −4.582** | −25.9260* | −12.5090*** | −6.9866*** |
| (−5.12) | (−3.98) | (−2.38) | (−4.41) | (−13.46) | |
| FD | 1.0020* | 1.7212*** | 0.0330** | 0.054*** | 0.0035*** |
| (1.98) | (4.25) | (2.21) | (7.80) | (5.52) | |
| _cons | 17.5790* | 14.2560*** | 54.8600* | −6.6490*** | |
| (2.13) | (7.71) | (2.36) | (−15.98) | ||
| Pseudo R 2 | 0.1895 | 0.1593 | 0.1110 | 0.3158 | |
| N | 684 | 684 | |||
t statistics in parentheses. * p < 0.05, ** p < 0.01, *** p < 0.001.
IQU showed a negative and noteworthy influence on CO2 emissions across all quantiles. This means that IQU does add to the reduction of CO2 emissions, and the results are in accord with Salman et al. (2019) studies but not consistent with the findings of studies like Azam et al. (2021) and Teng et al. (2021). EC has a significant positive impact across the quantiles of 25, 50, and 75, but the 95th quantile returned a negative impact. This means that EC generally leads to an increase in the emissions of CO2. This finding agrees with the studies of Al-Mulali and Che Sab (2018), Lean and Smyth (2010), and Shahbaz et al. (2014).
Moreover, EG and FD produce positive and significant environmental effects across all quantiles. This means that the major contributors to CO2 emissions are EG and FD. The results are in line with the findings of Sehrawat et al. (2015) for both variables, and, for EG alone, the results are in line with Khan (2019b), and Saboori and Sulaiman (2013). However, the results of our study on FD and CO2 emissions are not in accord with those of Khan et al. (2019a).
The graphical representation of the variables in the quantile regression is shown in Figure 3.
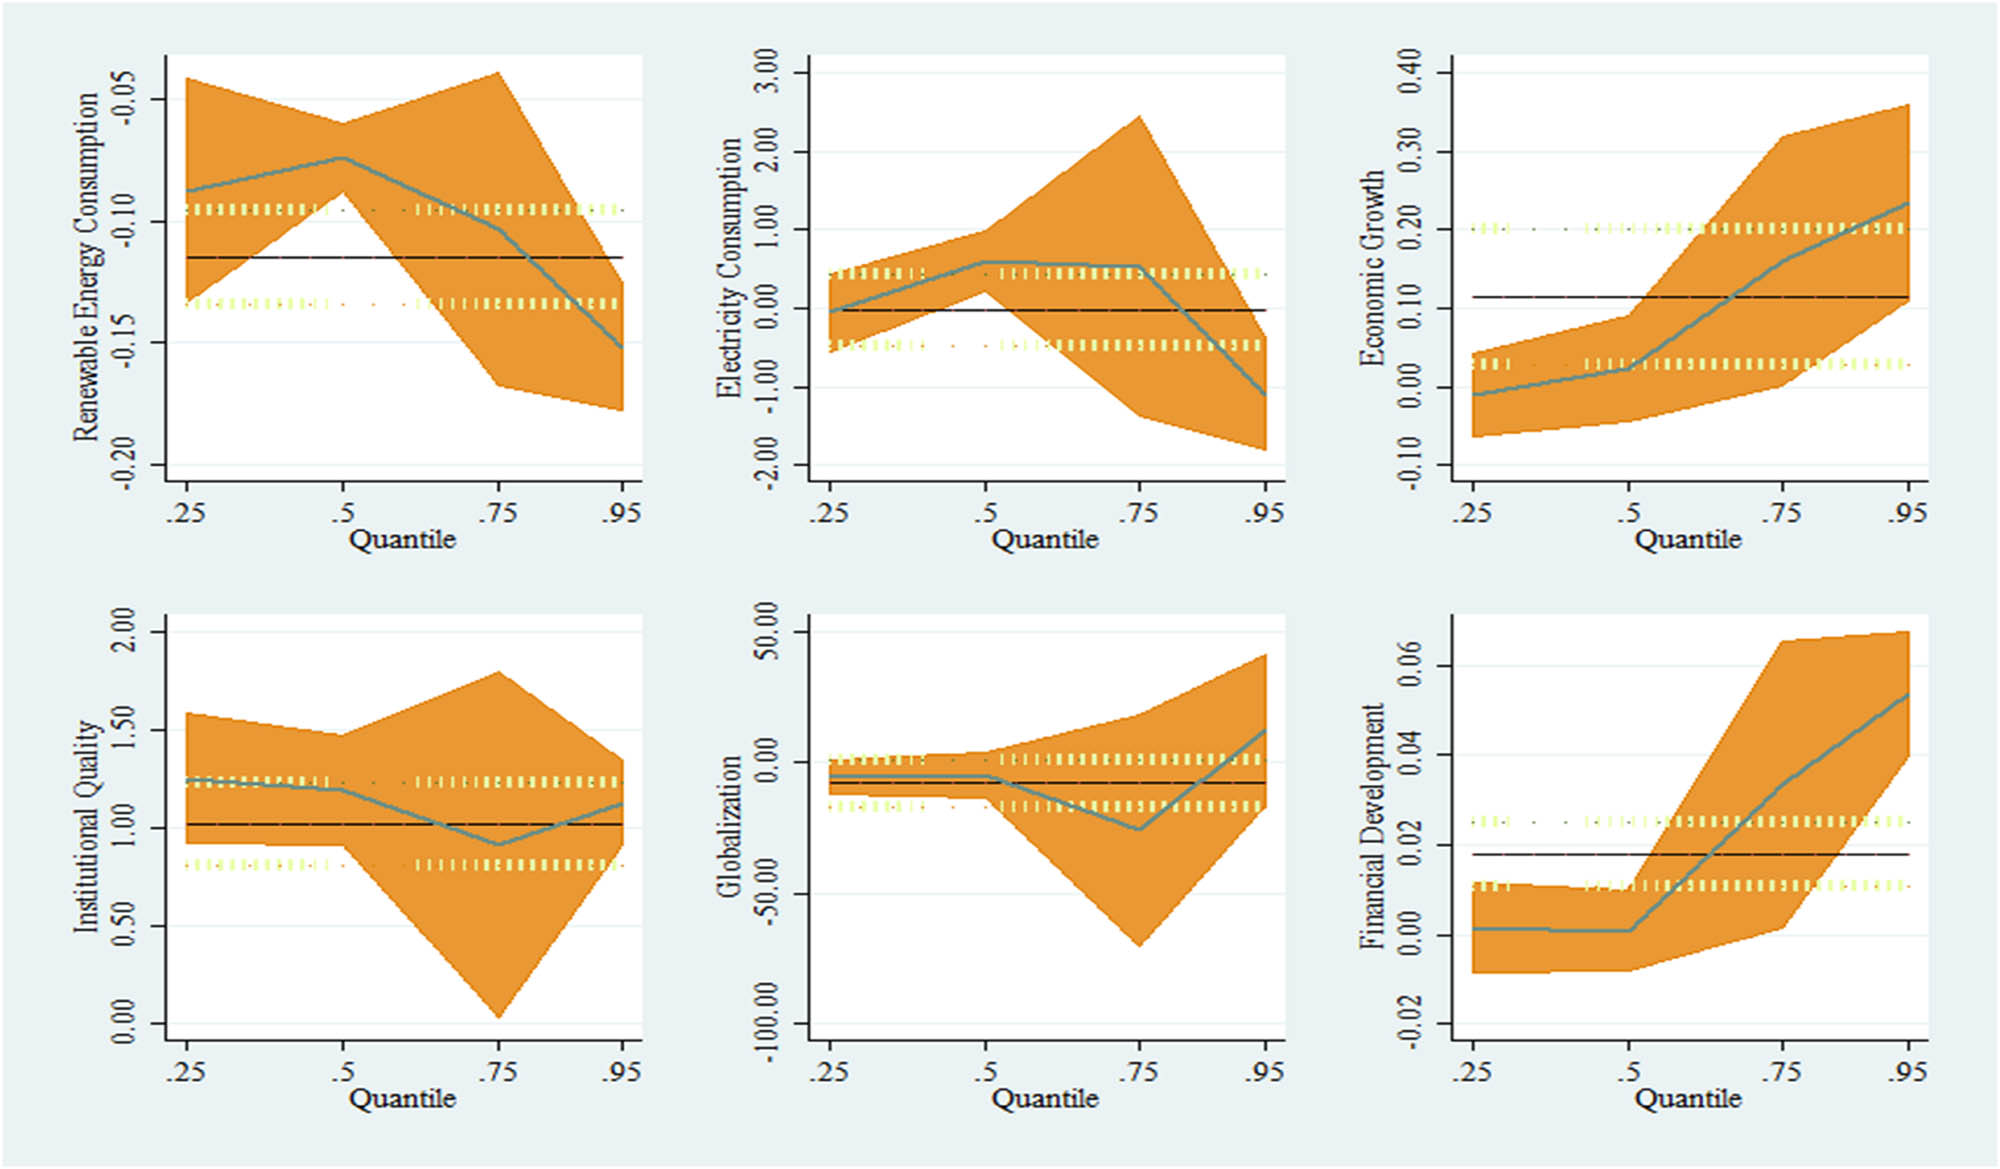
Quantiles regression graphs.
5 Conclusion and Implications
Environmental concern is increasing due to the effects of economic activities involved in producing and exchanging goods and services at national and international levels. This study has attempted to assess the ways in which EG, EC, REC, FD, IQU, and GLO make a significant contribution to the degradation of the environment in OECD countries from 1996 to 2019 via quantile regression and the GMM approach. All the models in this study support the findings that REC, GLO, and IQU reduce emissions of CO2, while EG, EC, and FD tend to lead to increases in CO2 emissions and injurious impacts on the natural environment.
Therefore, based on the results of our study, the following policy recommendations are proposed: the production of electricity with fossil fuels must be replaced with the use of REC, which eventually pose less harm to the environment. Liberalizing trade may be one way to support EG during the transition period. Maximizing REC can safeguard ED yet also protect environmental quality. In addition, pertinent policies must be framed to link FD to facilitate technological advances in low-carbon machinery and batteries. As a result of this, the emissions of CO2 will be reduced in OECD countries. This study has opened up prospects that can be augmented by future researchers through examining the proposed link with the other proxy of environmental degradation, that is, the ECF.
-
Funding information: The authors state no funding involved.
-
Author contributions: SHS and MKK conceived and designed this study. MUQ finalized the introduction and literature review. Data were collected by MB. The results were run by MKK. Discussion and conclusion were written by MUQ, SHS. References and allied resources were prepared and finalized by MB, AAS, and MUQ. JO organized the revisions and provision of resources.
-
Conflict of interest: The authors report no conflict of interest.
-
Consent to participate: Not applicable
-
Consent to publish: All the authors agree to publish this article in the Economics Journal.
-
Ethical approval: Not applicable.
-
Data availability statement: The data that support the findings of this study are available on request from the corresponding author upon reasonable request.
-
Article note: As part of the open assessment, reviews and the original submission are available as supplementary files on our website.
References
Abid, M. (2017). Does economic, financial, and institutional developments matter for environmental quality? A comparative analysis of EU and MEA countries. Journal of Environmental Management, 188, 183–194. doi: 10.1016/j.jenvman.2016.12.007.Suche in Google Scholar
Acheampong, A. O., Adams, S., & Boateng, E. (2019). Do globalization and renewable energy contribute to carbon emissions mitigation in Sub-Saharan Africa? Science of the Total Environment, 677, 436–446. doi: 10.1016/j.scitotenv.2019.04.353.Suche in Google Scholar
Adebayo, T. S., & Acheampong, A. O. (2022). Modelling the globalization-CO2 emission nexus in Australia: Evidence from quantile-on-quantile approach. Environmental Science and Pollution Research, 29(7), 9867–9882.10.1007/s11356-021-16368-ySuche in Google Scholar
Ahmad, A., Zhao, Y., Shahbaz, M., Bano, S., Zhang, Z., Wang, S., & Liu, Y. (2016). Carbon emissions, energy consumption, and economic growth: An aggregate and disaggregate analysis of the Indian economy. Energy Policy, 96. doi: 10.1016/j.enpol.2016.05.032.Suche in Google Scholar
Al-Mulali, U., & Che Sab, C. N. B. 2018. Electricity consumption, CO2 emission, and economic growth in the Middle East. Energy Sources, Part B: Economics, Planning, and Policy, 13(5), 257–263.10.1080/15567249.2012.658958Suche in Google Scholar
Arellano, M., & Bover, O. (1995). Another look at the instrumental variable estimation of error-components models. Journal of Econometrics, 68(1), 29–51. doi: 10.1016/0304-4076(94)01642-D.Suche in Google Scholar
Aydin, M. (2019). Renewable and non-renewable electricity consumption–economic growth nexus: Evidence from OECD countries. Renewable Energy, 136, 599–606.10.1016/j.renene.2019.01.008Suche in Google Scholar
Aydoğan, B., & Vardar, G. (2020). Evaluating the role of renewable energy, economic growth and agriculture on CO2 emission in E7 countries. International Journal of Sustainable Energy, 39(4), 335–348.10.1080/14786451.2019.1686380Suche in Google Scholar
Azam, M., Liu, L., & Ahmad, N. (2021). Impact of institutional quality on environment and energy consumption: Evidence from developing world. Environment, Development and Sustainability, 23(2), 1646–1667.10.1007/s10668-020-00644-xSuche in Google Scholar
Bilgili, F., Koçak, E., & Bulut, Ü. (2016). The dynamic impact of renewable energy consumption on CO2 emissions: A revisited Environmental Kuznets Curve approach. Renewable and Sustainable Energy Reviews, 54, 838–845.10.1016/j.rser.2015.10.080Suche in Google Scholar
Bilgili, F., & Ulucak, R. (2018). The nexus between biomass – footprint and sustainable development. Reference module in materials science and materials engineering. 699, 10600–9.Suche in Google Scholar
Blundell, R., & Bond, S. (1998). Initial conditions and moment restrictions in dynamic panel data models. Journal of Econometrics, 87(1), 115–143. doi: 10.1016/S0304-4076(98)00009-8.Suche in Google Scholar
Bölük, G., & Mert, M. (2015). The renewable energy, growth and environmental Kuznets curve in Turkey: An ARDL approach. Renewable and Sustainable Energy Reviews, 52, 587–595. doi: 10.1016/j.rser.2015.07.138.Suche in Google Scholar
Charfeddine, L., & ben Khediri, K. (2016). Financial development and environmental quality in UAE: Cointegration with structural breaks. Renewable and Sustainable Energy Reviews, 55, 1322–1335. doi: 10.1016/j.rser.2015.07.059.Suche in Google Scholar
Charfeddine, L., & Kahia, M. (2019). Impact of renewable energy consumption and financial development on CO2 emissions and economic growth in the MENA region: A panel vector autoregressive (PVAR) analysis. Renewable Energy, 139, 198–213. doi: 10.1016/j.renene.2019.01.010.Suche in Google Scholar
Chen, C., Xianfeng, W., Chenguang, L., Wei, L., Dedong Ma Qi, Z., & Leilei, D. (2019). The effect of air pollution on hospitalization of individuals with respiratory and cardiovascular diseases in Jinan, China. Medicine, 98(22), e15634.10.1097/MD.0000000000015634Suche in Google Scholar
Chen, S., Hua, Y., Hong-Mei, L., Qiong, W., Chun-Fang, L., & André, S. (2016). Conservation and sustainable use of medicinal plants: Problems, progress, and prospects. Chinese Medicine, 11(1), 1–10.10.1186/s13020-016-0108-7Suche in Google Scholar
Destek, M. A., Ulucak, R., & Dogan, E. (2018). Analyzing the environmental Kuznets curve for the EU countries: The role of ecological footprint. Environmental Science and Pollution Research, 25(29), 29387–29396.10.1007/s11356-018-2911-4Suche in Google Scholar
Dong, K., Sun, R., & Dong, X. (2018). CO2 emissions, natural gas and renewables, economic growth: Assessing the evidence from China. Science of the Total Environment, 640, 293–302. doi: 10.1016/j.scitotenv.2018.05.322.Suche in Google Scholar
Gielen, D., Boshell, F., Saygin, D., Bazilian, M. D., Wagner, N., & Gorini, R. (2019). The role of renewable energy in the global energy transformation. Energy Strategy Reviews, 24, 38–50. doi: 10.1016/j.esr.2019.01.006.Suche in Google Scholar
Godil, D. I., Sharif, A., Ali, M. I., Ozturk, I., & Usman, R. (2021). The role of financial development, R&D expenditure, globalization, and institutional quality in energy consumption in India: New evidence from the QARDL approach. Journal of Environmental Management, 285, 1–11. doi: 10.1016/j.jenvman.2021.112208.Suche in Google Scholar
Grossman, G. M., & Krueger, A. B. 1995. Economic growth and the environment. The Quarterly Journal of Economics, 110(2), 353–377.10.2307/2118443Suche in Google Scholar
Harris, R. D. F., & Tzavalis, E. (1999). Inference for unit roots in dynamic panels where the time dimension is fixed. Journal of Econometrics, 91(2), 201–226.10.1016/S0304-4076(98)00076-1Suche in Google Scholar
Hasanov, F. J., Liddle, B., & Mikayilov, J. I. (2018). The impact of international trade on CO2 emissions in oil exporting countries: Territory vs consumption emissions accounting. Energy Economics, 74, 343–350. doi: 10.1016/j.eneco.2018.06.004.Suche in Google Scholar
Haseeb, A., Xia, E., Danish, Baloch, M. A., & Abbas, K. (2018). Financial development, globalization, and CO2 emission in the presence of EKC: Evidence from BRICS countries. Environmental Science and Pollution Research, 25(31), 31283–31296. doi: 10.1007/s11356-018-3034-7.Suche in Google Scholar
Islam, M. M., Khan, M. K., Tareque, M., Jehan, N., & Dagar, V. (2021). Impact of globalization, foreign direct investment, and energy consumption on CO2 emissions in Bangladesh: Does institutional quality matter? Environmental Science and Pollution Research, 28(35), 48851–48871. doi: 10.1007/s11356-021-13441-4.Suche in Google Scholar
Jamel, L., & Derbali, A. (2016). Do energy consumption and economic growth lead to environmental degradation? Evidence from Asian economies. Cogent Economics & Finance, 4(1), 1170653.10.1080/23322039.2016.1170653Suche in Google Scholar
Kao, C. (1999). Spurious regression and residual-based tests for cointegration in panel data. Journal of Econometrics, 90(1), 1–44. doi: 10.1016/S0304-4076(98)00023-2.Suche in Google Scholar
Khan, I., Han, L., Khan, H., & Kim Oanh, L. T. (2021). Analyzing renewable and nonrenewable energy sources for environmental quality: Dynamic investigation in developing countries. Mathematical Problems in Engineering, 2021, 1–12. doi: 10.1155/2021/3399049.Suche in Google Scholar
Khan, M. K., Khan, M. I., & Rehan, M. (2020). The relationship between energy consumption, economic growth and carbon dioxide emissions in Pakistan. Financial Innovation, 6(1), 1–13. doi: 10.1186/s40854-019-0162-0.Suche in Google Scholar
Khan, M. K., Teng, J. Z., Khan, M. I., & Khan, M. O. (2019a) Impact of globalization, economic factors and energy consumption on CO2 emissions in Pakistan. Science of the Total Environment, 688, 424–436.10.1016/j.scitotenv.2019.06.065Suche in Google Scholar
Khan, S. A. R. (2019b). The nexus between carbon emissions, poverty, economic growth, and logistics operations-empirical evidence from southeast Asian countries. Environmental Science and Pollution Research, 26(13), 13210–13220. doi: 10.1007/s11356-019-04829-4.Suche in Google Scholar
Khan, S., Peng, Z., & Li, Y. (2019c). Energy consumption, environmental degradation, economic growth and financial development in globe: Dynamic simultaneous equations panel analysis. Energy Reports, 5, 1089–1102.10.1016/j.egyr.2019.08.004Suche in Google Scholar
Kohl, W. L. (2019). The international energy agency: The political context. Oil, The Arab-Israel Dispute, And The Industrial World, 246–257.10.4324/9780429050688-17Suche in Google Scholar
Lau, L. S., Choong, C. K., & Eng, Y. K. (2014). Investigation of the environmental Kuznets curve for carbon emissions in Malaysia: DO foreign direct investment and trade matter? Energy Policy, 68, 490–497. doi: 10.1016/j.enpol.2014.01.002.Suche in Google Scholar
Le, H. P., & Ozturk, I. (2020). The impacts of globalization, financial development, government expenditures, and institutional quality on CO2 emissions in the presence of environmental Kuznets curve. Environmental Science and Pollution Research, 27(18), 22680–22697. doi: 10.1007/s11356-020-08812-2.Suche in Google Scholar
Lean, H. H., & Smyth, R. (2010). CO2 emissions, electricity consumption and output in ASEAN. Applied Energy, 87(6), 1858–1864. doi: 10.1016/j.apenergy.2010.02.003.Suche in Google Scholar
Li, R., & Ramanathan, R. (2020). Can environmental investments benefit environmental performance? The moderating roles of institutional environment and foreign direct investment. Business Strategy and the Environment, 29(8), 3385–3398. doi: 10.1002/bse.2578.Suche in Google Scholar
Mbarek, M. B., Saidi, K., & Rahman, M. M. (2018). Renewable and non-renewable energy consumption, environmental degradation and economic growth in Tunisia. Quality & Quantity, 52(3), 1105–1119.10.1007/s11135-017-0506-7Suche in Google Scholar
Muhammad, B., & Khan, S. (2021). Understanding the relationship between natural resources, renewable energy consumption, economic factors, globalization and CO2 emissions in developed and developing countries. Paper presented at the Natural Resources Forum.10.1111/1477-8947.12220Suche in Google Scholar
Nathaniel, S. P., Nwulu, N., & Bekun, F. (2021). Natural resource, globalization, urbanization, human capital, and environmental degradation in Latin American and Caribbean countries. Environmental Science and Pollution Research, 28(5), 6207–6221.10.1007/s11356-020-10850-9Suche in Google Scholar
Nguyen, T., & Le, Q. (2020). Impact of globalization on CO2 emissions in Vietnam: An autoregressive distributed lag approach. Decision Science Letters, 9(2), 257–270.10.5267/j.dsl.2019.10.001Suche in Google Scholar
Owusu, V., Ma, W., Renwick, A., & Emuah, D. (2021). Does the use of climate information contribute to climate change adaptation? Evidence from Ghana. Climate and Development, 13(7); 616–629. doi: 10.1080/17565529.2020.1844612.Suche in Google Scholar
Ozcan, B., Tzeremes, P. G., & Tzeremes, N. G. (2020). Energy consumption, economic growth and environmental degradation in OECD countries. Economic Modelling, 84, 203–213.10.1016/j.econmod.2019.04.010Suche in Google Scholar
Pata, U. K. (2018). Renewable energy consumption, urbanization, financial development, income and CO2 emissions in Turkey: Testing EKC hypothesis with structural breaks. Journal of Cleaner Production, 187, 770–779. doi: 10.1016/j.jclepro.2018.03.236.Suche in Google Scholar
Pedroni, P. (1999). Critical values for cointegration tests in heterogeneous panels with multiple regressors. Oxford Bulletin of Economics and Statistics, 61(S1), 653–670.10.1111/1468-0084.61.s1.14Suche in Google Scholar
Pedroni, P. (2001). Purchasing power parity tests in cointegrated panels. Review of Economics and Statistics, 83(4), 727–731. doi: 10.1162/003465301753237803.Suche in Google Scholar
Pedroni, P. (2004). Panel cointegration: Asymptotic and finite sample properties of pooled time series tests with an application to the PPP hypothesis. Econometric Theory, 20(3), 597–625. doi: 10.1017/S0266466604203073.Suche in Google Scholar
Pesaran, M. H. (2004). General diagnostic tests for cross-sectional dependence in panels. Empirical Economics, 60(1), 13–50.10.1007/s00181-020-01875-7Suche in Google Scholar
Phillips, P. C. B., & Perron, P. (1988). Testing for a unit root in time series regression. Biometrika, 75(2), 335–346. doi: 10.1093/biomet/75.2.335.Suche in Google Scholar
Raza, S. A., Shah, N., & Sharif, A. (2019). Time frequency relationship between energy consumption, economic growth and environmental degradation in the United States: Evidence from transportation sector. Energy, 173, 706–720.10.1016/j.energy.2019.01.077Suche in Google Scholar
Rehman, A., Rauf, A., Ahmad, M., Chandio, A. A., & Deyuan, Z. (2019). The effect of carbon dioxide emission and the consumption of electrical energy, fossil fuel energy, and renewable energy, on economic performance: Evidence from Pakistan. Environmental Science and Pollution Research, 26(21), 21760–21773.10.1007/s11356-019-05550-ySuche in Google Scholar
Riti, J. S., Song, D., Shu, Y., Kamah, M., & Atabani, A. A. (2018). Does renewable energy ensure environmental quality in favour of economic growth? Empirical evidence from China’s renewable development. Quality and Quantity, 52(5), 2007–2030. doi: 10.1007/s11135-017-0577-5.Suche in Google Scholar
Saboori, B., & Sulaiman, J. (2013). Environmental degradation, economic growth and energy consumption: Evidence of the environmental Kuznets curve in Malaysia. Energy Policy, 60, 892–905.10.1016/j.enpol.2013.05.099Suche in Google Scholar
Sadorsky, P. (2010). The impact of financial development on energy consumption in emerging economies. Energy Policy, 38(5), 2528–2535. doi: 10.1016/j.enpol.2009.12.048.Suche in Google Scholar
Sahu, N. C., & Kumar, P. (2020). Impact of globalization, financial development, energy consumption, and economic growth on CO2 emissions in India: Evidence from ARDL approach. Journal of Economics Business and Management, 8(3), 257–270.10.18178/joebm.2020.8.3.644Suche in Google Scholar
Salim, R. A., & Rafiq, S. (2012). Why do some emerging economies proactively accelerate the adoption of renewable energy? Energy Economics, 34(4), 1051–1057. doi: 10.1016/j.eneco.2011.08.015.Suche in Google Scholar
Salman, M., Long, X., Dauda, L., & Mensah, C. N. (2019). The impact of institutional quality on economic growth and carbon emissions: Evidence from Indonesia, South Korea and Thailand. Journal of Cleaner Production, 241, 118331. doi: 10.1016/j.jclepro.2019.118331.Suche in Google Scholar
Sarkodie, S. A., & Adams, S. (2018). Renewable energy, nuclear energy, and environmental pollution: Accounting for political institutional quality in South Africa. Science of the Total Environment, 643, 1590–1601. doi: 10.1016/j.scitotenv.2018.06.320.Suche in Google Scholar
Sebri, M., & Ben-Salha, O. (2014). On the causal dynamics between economic growth, renewable energy consumption, CO2 emissions and trade openness: Fresh evidence from BRICS countries. Renewable and Sustainable Energy Reviews, 39, 14–23. doi: 10.1016/j.rser.2014.07.033.Suche in Google Scholar
Sehrawat, M., Giri, A., & Mohapatra, G. (2015). The impact of financial development, economic growth and energy consumption on environmental degradation: Evidence from India. Management of Environmental Quality: An International Journal, 26(5), 666–682.10.1108/MEQ-05-2014-0063Suche in Google Scholar
Sethi, P., Chakrabarti, D., & Bhattacharjee, S. (2020). Globalization, financial development and economic growth: Perils on the environmental sustainability of an emerging economy. Journal of Policy Modeling, 42(3), 520–535.10.1016/j.jpolmod.2020.01.007Suche in Google Scholar
Shafiei, S., & Salim, R. A. (2014). Non-renewable and renewable energy consumption and CO2 emissions in OECD countries: A comparative analysis. Energy Policy, 66, 547–556.10.1016/j.enpol.2013.10.064Suche in Google Scholar
Shahbaz, M., Balsalobre-Lorente, D., & Sinha, A. (2019). Foreign direct Investment–CO2 emissions nexus in Middle East and North African countries: Importance of biomass energy consumption. Journal of Cleaner Production, 217, 603–614. doi: 10.1016/j.jclepro.2019.01.282.Suche in Google Scholar
Shahbaz, M., Haouas, I., Sohag, K., & Ozturk, I. (2020). The financial development-environmental degradation nexus in the United Arab Emirates: The importance of growth, globalization and structural breaks. Environmental Science and Pollution Research, 1–15.10.1007/s11356-019-07085-8Suche in Google Scholar
Shahbaz, M., Nasir, M. A., & Roubaud, D. (2018). Environmental degradation in France: The effects of FD, financial development, and energy innovations. Energy Economics, 74, 843–857. doi: 10.1016/j.eneco.2018.07.020.Suche in Google Scholar
Shahbaz, M., Salah Uddin, G., Rehman, I. U., & Imran, K. (2014). Industrialization, electricity consumption and CO2 emissions in Bangladesh. Renewable and Sustainable Energy Reviews, 31, 575–586. doi: 10.1016/j.rser.2013.12.028.Suche in Google Scholar
Shahbaz, M., van Hoang, T. H., Mahalik, M. K., & Roubaud, D. (2017). Energy consumption, financial development and economic growth in India: New evidence from a nonlinear and asymmetric analysis. Energy Economics, 63, 199–212. doi: 10.1016/j.eneco.2017.01.023.Suche in Google Scholar
Sugiawan, Y., & Managi, S. (2016). The environmental Kuznets curve in Indonesia: Exploring the potential of renewable energy. Energy Policy, 98, 187–198. doi: 10.1016/j.enpol.2016.08.029.Suche in Google Scholar
Teng, J.-Z., Khan, M. K., Khan, M. I., Chishti, M. Z., & Khan, M. O. (2021). Effect of foreign direct investment on CO2 emission with the role of globalization, institutional quality with pooled mean group panel ARDL. Environmental Science and Pollution Research, 28(5), 5271–5282.10.1007/s11356-020-10823-ySuche in Google Scholar
Tiba, S., & Omri, A. (2017). Literature survey on the relationships between energy, environment and economic growth. Renewable and Sustainable Energy Reviews, 69, 1129–1146. doi: 10.1016/j.rser.2016.09.113.Suche in Google Scholar
Usman, O., Olanipekun, I. O., Iorember, P. T., & Abu-Goodman, M. (2020). Modelling environmental degradation in South Africa: The effects of energy consumption, democracy, and globalization using innovation accounting tests. Environmental Science and Pollution Research, 27(8), 8334–8349.10.1007/s11356-019-06687-6Suche in Google Scholar
Westerlund, J. (2007). Testing for error correction in panel data. Oxford Bulletin of Economics and Statistics, 69(6), 709–748. doi: 10.1111/j.1468-0084.2007.00477.x.Suche in Google Scholar
Westerlund, J., & Edgerton, D. L. (2008). A simple test for cointegration in dependent panels with structural breaks. Oxford Bulletin of Economics and Statistics, 70(5), 665–704.10.1111/j.1468-0084.2008.00513.xSuche in Google Scholar
Wooldridge, J. M. (2014). Introduction to econometrics. Andover: Cengage Learning.Suche in Google Scholar
Xu, Z., Baloch, M. A., Danish, Meng, F., Zhang, J., & Mahmood, Z. (2018). Nexus between financial development and CO2 emissions in Saudi Arabia: Analyzing the role of globalization. Environmental Science and Pollution Research, 25(28), 28378–28390. doi: 10.1007/s11356-018-2876-3.Suche in Google Scholar
Yilanci, V., & Pata, U. K. (2020). Investigating the EKC hypothesis for China: The role of economic complexity on ecological footprint. Environmental Science and Pollution Research 27(26), 32683–3269410.1007/s11356-020-09434-4Suche in Google Scholar
Zaman, Q. U., Wang, Z., Zaman, S., & Rasool, S. F. (2021). Investigating the nexus between education expenditure, female employers, renewable energy consumption and CO2 emission: Evidence from China. Journal of Cleaner Production, 127824.10.1016/j.jclepro.2021.127824Suche in Google Scholar
Zhan, Z., Ali, L., Sarwat, S., Godil, D. I., Dinca, G., & Anser, M. K. (2021). A step towards environmental mitigation: Do tourism, renewable energy and institutions really matter? A QARDL approach. Science of the Total Environment, 778, 146209. doi: 10.1016/j.scitotenv.2021.146209.Suche in Google Scholar
© 2024 the author(s), published by De Gruyter
This work is licensed under the Creative Commons Attribution 4.0 International License.
Artikel in diesem Heft
- Regular Articles
- Political Turnover and Public Health Provision in Brazilian Municipalities
- Examining the Effects of Trade Liberalisation Using a Gravity Model Approach
- Operating Efficiency in the Capital-Intensive Semiconductor Industry: A Nonparametric Frontier Approach
- Does Health Insurance Boost Subjective Well-being? Examining the Link in China through a National Survey
- An Intelligent Approach for Predicting Stock Market Movements in Emerging Markets Using Optimized Technical Indicators and Neural Networks
- Analysis of the Effect of Digital Financial Inclusion in Promoting Inclusive Growth: Mechanism and Statistical Verification
- Effective Tax Rates and Firm Size under Turnover Tax: Evidence from a Natural Experiment on SMEs
- Re-investigating the Impact of Economic Growth, Energy Consumption, Financial Development, Institutional Quality, and Globalization on Environmental Degradation in OECD Countries
- A Compliance Return Method to Evaluate Different Approaches to Implementing Regulations: The Example of Food Hygiene Standards
- Panel Technical Efficiency of Korean Companies in the Energy Sector based on Digital Capabilities
- Time-varying Investment Dynamics in the USA
- Preferences, Institutions, and Policy Makers: The Case of the New Institutionalization of Science, Technology, and Innovation Governance in Colombia
- The Impact of Geographic Factors on Credit Risk: A Study of Chinese Commercial Banks
- The Heterogeneous Effect and Transmission Paths of Air Pollution on Housing Prices: Evidence from 30 Large- and Medium-Sized Cities in China
- Analysis of Demographic Variables Affecting Digital Citizenship in Turkey
- Green Finance, Environmental Regulations, and Green Technologies in China: Implications for Achieving Green Economic Recovery
- Coupled and Coordinated Development of Economic Growth and Green Sustainability in a Manufacturing Enterprise under the Context of Dual Carbon Goals: Carbon Peaking and Carbon Neutrality
- Revealing the New Nexus in Urban Unemployment Dynamics: The Relationship between Institutional Variables and Long-Term Unemployment in Colombia
- The Roles of the Terms of Trade and the Real Exchange Rate in the Current Account Balance
- Cleaner Production: Analysis of the Role and Path of Green Finance in Controlling Agricultural Nonpoint Source Pollution
- The Research on the Impact of Regional Trade Network Relationships on Value Chain Resilience in China’s Service Industry
- Social Support and Suicidal Ideation among Children of Cross-Border Married Couples
- Asymmetrical Monetary Relations and Involuntary Unemployment in a General Equilibrium Model
- Job Crafting among Airport Security: The Role of Organizational Support, Work Engagement and Social Courage
- Does the Adjustment of Industrial Structure Restrain the Income Gap between Urban and Rural Areas
- Optimizing Emergency Logistics Centre Locations: A Multi-Objective Robust Model
- Geopolitical Risks and Stock Market Volatility in the SAARC Region
- Trade Globalization, Overseas Investment, and Tax Revenue Growth in Sub-Saharan Africa
- Can Government Expenditure Improve the Efficiency of Institutional Elderly-Care Service? – Take Wuhan as an Example
- Media Tone and Earnings Management before the Earnings Announcement: Evidence from China
- Review Articles
- Economic Growth in the Age of Ubiquitous Threats: How Global Risks are Reshaping Growth Theory
- Efficiency Measurement in Healthcare: The Foundations, Variables, and Models – A Narrative Literature Review
- Rethinking the Theoretical Foundation of Economics I: The Multilevel Paradigm
- Financial Literacy as Part of Empowerment Education for Later Life: A Spectrum of Perspectives, Challenges and Implications for Individuals, Educators and Policymakers in the Modern Digital Economy
- Special Issue: Economic Implications of Management and Entrepreneurship - Part II
- Ethnic Entrepreneurship: A Qualitative Study on Entrepreneurial Tendency of Meskhetian Turks Living in the USA in the Context of the Interactive Model
- Bridging Brand Parity with Insights Regarding Consumer Behavior
- The Effect of Green Human Resources Management Practices on Corporate Sustainability from the Perspective of Employees
- Special Issue: Shapes of Performance Evaluation in Economics and Management Decision - Part II
- High-Quality Development of Sports Competition Performance Industry in Chengdu-Chongqing Region Based on Performance Evaluation Theory
- Analysis of Multi-Factor Dynamic Coupling and Government Intervention Level for Urbanization in China: Evidence from the Yangtze River Economic Belt
- The Impact of Environmental Regulation on Technological Innovation of Enterprises: Based on Empirical Evidences of the Implementation of Pollution Charges in China
- Environmental Social Responsibility, Local Environmental Protection Strategy, and Corporate Financial Performance – Empirical Evidence from Heavy Pollution Industry
- The Relationship Between Stock Performance and Money Supply Based on VAR Model in the Context of E-commerce
- A Novel Approach for the Assessment of Logistics Performance Index of EU Countries
- The Decision Behaviour Evaluation of Interrelationships among Personality, Transformational Leadership, Leadership Self-Efficacy, and Commitment for E-Commerce Administrative Managers
- Role of Cultural Factors on Entrepreneurship Across the Diverse Economic Stages: Insights from GEM and GLOBE Data
- Performance Evaluation of Economic Relocation Effect for Environmental Non-Governmental Organizations: Evidence from China
- Functional Analysis of English Carriers and Related Resources of Cultural Communication in Internet Media
- The Influences of Multi-Level Environmental Regulations on Firm Performance in China
- Exploring the Ethnic Cultural Integration Path of Immigrant Communities Based on Ethnic Inter-Embedding
- Analysis of a New Model of Economic Growth in Renewable Energy for Green Computing
- An Empirical Examination of Aging’s Ramifications on Large-scale Agriculture: China’s Perspective
- The Impact of Firm Digital Transformation on Environmental, Social, and Governance Performance: Evidence from China
- Accounting Comparability and Labor Productivity: Evidence from China’s A-Share Listed Firms
- An Empirical Study on the Impact of Tariff Reduction on China’s Textile Industry under the Background of RCEP
- Top Executives’ Overseas Background on Corporate Green Innovation Output: The Mediating Role of Risk Preference
- Neutrosophic Inventory Management: A Cost-Effective Approach
- Mechanism Analysis and Response of Digital Financial Inclusion to Labor Economy based on ANN and Contribution Analysis
- Asset Pricing and Portfolio Investment Management Using Machine Learning: Research Trend Analysis Using Scientometrics
- User-centric Smart City Services for People with Disabilities and the Elderly: A UN SDG Framework Approach
- Research on the Problems and Institutional Optimization Strategies of Rural Collective Economic Organization Governance
- The Impact of the Global Minimum Tax Reform on China and Its Countermeasures
- Sustainable Development of Low-Carbon Supply Chain Economy based on the Internet of Things and Environmental Responsibility
- Measurement of Higher Education Competitiveness Level and Regional Disparities in China from the Perspective of Sustainable Development
- Payment Clearing and Regional Economy Development Based on Panel Data of Sichuan Province
- Coordinated Regional Economic Development: A Study of the Relationship Between Regional Policies and Business Performance
- A Novel Perspective on Prioritizing Investment Projects under Future Uncertainty: Integrating Robustness Analysis with the Net Present Value Model
- Research on Measurement of Manufacturing Industry Chain Resilience Based on Index Contribution Model Driven by Digital Economy
- Special Issue: AEEFI 2023
- Portfolio Allocation, Risk Aversion, and Digital Literacy Among the European Elderly
- Exploring the Heterogeneous Impact of Trade Agreements on Trade: Depth Matters
- Import, Productivity, and Export Performances
- Government Expenditure, Education, and Productivity in the European Union: Effects on Economic Growth
- Replication Study
- Carbon Taxes and CO2 Emissions: A Replication of Andersson (American Economic Journal: Economic Policy, 2019)