Analysis of Multi-Factor Dynamic Coupling and Government Intervention Level for Urbanization in China: Evidence from the Yangtze River Economic Belt
-
Wenchao Bao
 und
Minghui Yan
und
Minghui Yan

Abstract
Effective coordination of urbanization dynamics and influencing factors is crucial for achieving balanced development. This study analyzes urbanization, economic, and environmental data of the Yangtze River Economic Belt from 2005 to 2019 using the Coupling Degree model and Entropy Method with the Analytic Hierarchy Process, focusing on the coordination between urbanization development, economic development, and environmental protection (EP). It highlights the significance of government interventions and the necessary level of government engagement in environmental matters for harmonized development across regions. Findings show that higher urbanization and economic levels align with robust environmental safeguards facilitated by active government interventions. Conversely, lower levels may lead to reduced EP, influenced by government actions. The study enhances understanding of the interplay between urbanization, economic growth, and environmental conservation, underlining the government’s role in coordination. Different development stages reveal the importance of government environmental interventions for policy formulation. Introducing the relatively unexplored variable of government policy, the study establishes a comprehensive framework for interventions, enriching coordination analysis and insights.
1 Introduction
The coordination of urbanization, economic development (ED), and environmental protection (EP) is a significant research topic. Urbanization serves as a microcosm of societal processes. After several decades of GDP growth, China has entered a new era of development, shifting from pursuing high-speed growth to high-quality development. However, the current scenario depicts urbanization evolving without sufficient coordination. This lack of coordination has yielded consequences, including hindering economic growth and environmental degradation. The Chinese government is actively implementing measures to address this situation, notably climate change, by committing to peak carbon emissions around 2030 and striving to achieve this goal sooner (Zhou et al., 2019a,b). The pursuit of higher-quality urbanization has become imperative. On December 29, 2014, China officially announced the list of national pilot zones for new-type urbanization, emphasizing the need to comprehensively implement regional coordinated development strategies, optimize significant productivity layouts, and construct a regional economic structure and territorial spatial system featuring complementary strengths and high-quality development (Chen et al., 2018). As a vector for regional coordinated development, the environment constrains further urbanization and economic advancement. In this context, harmonizing urbanization, ED, and EP is pivotal for achieving more comprehensive, balanced, and inclusive development.
Previous research has shown certain limitations. First, there needs to be more exploration of government environmental policy decisions as a focal point for enhancing the coordination among urbanization development (UD), ED, and EP. Such investigation is essential for providing practical recommendations to address the real-world challenge of disharmony among these factors. Second, a comprehensive and systemic analysis of the interactions between UD, ED, and the environment needs to be improved. These gaps provide opportunities for further study in our research. The details of this aspect will receive further elaboration in the upcoming chapter of the article.
Building upon previous research, this study has gathered urbanization, economic, and environmental data spanning from 2005 to 2019. The data will be utilized for a multifactor coordination analysis using the CD model. As performance improves with strategic planning (Osintsev & Khalilian, 2023), this article aims to comprehensively analyze the interregional coordination between UD, ED, and the environment, employing government environmental policy as a focal point. The study will stratify the coordination abilities of urbanization, economy, and environment within regions and correlate these results with government environmental policies. This approach explores the possibility of government intervention strategies targeting highly coordinated urbanization, ED, and environmental preservation. Stratifying coordination abilities within regions offers a clearer understanding of the varying levels of coordination between urbanization, ED, and the environment across different regions. Correlating these results with government environmental policies will aid in crafting precise environmental policies that foster highly coordinated urbanization, economic growth, and environmental preservation, striving for a balanced approach. The study’s findings will provide valuable insights for governmental decisions, academic research, and regional development practices, fostering synergistic development among regional elements and promoting a win–win situation for economic prosperity and EP.
In the following sections of this article, we delve into various aspects of UD and its intricate relationship with ED, the environment, and the role played by government environmental policies. In Sec. 2, our Literature Review scrutinizes these relationships, shedding light on the interconnected dynamics. Section 3, Materials and Methods, is dedicated to investigating the influence of ED, environmental preservation, and government policies on urbanization. We employ a comprehensive analytical approach, utilizing the Coupling Degree (CD) model, the Entropy Method (EM), and the Analytic Hierarchy Process (AHP), to meticulously analyze data from 2005 to 2019 in the Yangtze River Economic Belt (YREB). Section 4, Results, provides an in-depth analysis of the coupling outcomes between urbanization and ED, environmental factors, and government environmental policies. Section 5, the Discussion, extends our exploration by integrating our research findings with existing studies, fostering a more profound understanding of the interplay between urbanization, ED, the environment, and government environmental policies. Finally, in Section 6, our Conclusions section offers a comprehensive summary of our research findings, highlights their innovative significance, and outlines potential avenues for future research.
2 Literature Review
2.1 Urbanization and ED
The necessity of coordinating urbanization and ED is evident in two aspects. The first reason lies in the adverse impact rapid urbanization poses on economic growth. Issues stemming from population urbanization and land urbanization, such as surging urban population, degradation of water and soil resources, reduction in arable land, and uncontrolled land use, hinder further economic advancement. Specifically, urbanization triggers changes in land use types, leading to severe ecological and environmental problems and jeopardizing the harmonious relationship between humans and nature (Arneth et al., 2017; Yin et al., 2020). The second reason is the mutually beneficial relationship between the urbanization process and ED. Economic progress provides essential material foundations, technical support, and institutional safeguards for urbanization. Urbanization enhances population quality, labor productivity, and resource allocation efficiency, facilitating solutions to critical ED challenges, including industrial transformation and upgrading, economic structural optimization, and enhanced developmental vigor (Vurur, 2022).
The coordination between urbanization and ED has become an urgent issue requiring resolution. Previous research in this area can be categorized into three main streams. The first stream has explored the coordination between population urbanization and land urbanization from the perspective of urbanization (Lu, 2007; Zhang & Shunfeng, 2003), interactions (Liu et al., 2012), as well as the negative impacts and influencing mechanisms of imbalance (Wei & Ye, 2014). Furthermore, it has focused on rational land resource utilization to propel the urbanization process (Choi & Wang, 2017; Lin et al., 2015; Siciliano, 2012; Yu et al., 2019), mitigate adverse effects on ED (Yang et al., 2020; Zhou et al., 2019b), and achieve sustainable development (Jaeger et al., 2010). The second stream centers on scientifically and reasonably promoting ED. Researchers have sought to explore pathways for coordinating urbanization and ED from perspectives such as trade openness, financial development, healthcare expenditures (Ahmad et al., 2021), transportation infrastructure (Maparu & Mazumder, 2017), urban transportation (Apostolopoulos & Kasselouris, 2022), energy consumption (Wang et al., 2018), and globalization (Wu et al., 2017). The third stream examines the role and function of government in coordinating urbanization and ED through policy lenses. It focuses on policy decision-making and implementation phases. Jin et al. (2009) modeled the decision-making framework for UD using scenario analysis. Shi and Gill (2005) constructed a system dynamics model to assess the effectiveness of government measures. To address conflicts arising from rapid urbanization, China implemented an urban containment strategy. Zhao evaluated the reliability of China’s urban containment strategy (Zhao, 2011).
2.2 Urbanization and Environment
Coordinating urbanization and environmental development represents a significant task driven by the mutual constraints between urbanization and the environment. These constraints manifest in two main aspects. First, urbanization can bring benefits like economic growth, social progress, and cultural prosperity, yet it can also lead to resource depletion, environmental pollution, and ecological degradation. Second, the environment provides the foundation for urban development while imposing limitations, such as disaster risks, carrying capacity constraints, and ecological security concerns.
Regarding the research theme of coordinating urbanization and the environment, we categorized scholars into the following three groups. First, some study the adverse impacts of urban land use expansion and transformation on the environment. Abass and Xu examined the influence of urbanization on arable land loss (Abass et al., 2018; Xu et al., 2013). Malek and Verburg found that increasing urban land use affects crop yield, the environment, and water resources (Malek & Verburg, 2020). Asabere et al. (2020) and Yang et al. (2020) conducted theoretical, methodological, and empirical analyses on the environmental impact of regional land use transitions. Second, there are discussions on environmental constraints and their effects on urbanization, primarily focusing on the influence of geographical location on changes in land use types. Godschalk (1975) asserted that environmental factors influencing land planning and urban development include local physical conditions and environmental carrying capacity. Zhao and Chen (2018) observed that geographical location affects green space changes due to significant variations in thermal conditions. Third, some directly investigate the coordination between urbanization and the environment, often employing dynamic coupling coordination models to estimate the relationship. Zhao et al. (2017) investigated the global coupling relationship between urbanization and the environment by analyzing World Bank data from 209 countries and regions worldwide. Wang et al. (2014) conducted a relationship study using data on urbanization and the environment in the Beijing–Tianjin–Hebei region.
2.3 ED and Environment
The tension between ED and EP is a prominent contradiction. On the one hand, socio-economic progress drives urbanization, resulting in increased urban construction land and environmental degradation (Abidin et al., 2011). On the other hand, environmental carrying capacity constrains the extent of ED. Environmental carrying capacity is defined as the ability of an area’s environmental resources to sustain maximum human activities within a specific timeframe. It is a robust reference and tool for economic policy formulation and management during ED (Liu & Borthwick, 2011). Specht’s study on the environmental carrying capacity of forest resources (1993) indicates that resource scarcity and environmental pollution can impact regional ED. A comprehensive analysis of China’s water resource-carrying capacity led Yang et al. (2015) to conclude that water resource crises can restrict regional economic growth. Therefore, coordinating ED and EP is increasingly vital for sustainable development.
Summarize research on coordinating ED and EP from the following perspectives. First, the scope of research encompasses the coordination relationships between resources (Bass et al., 2010), the environment (Saveriades, 2000), ecosystems (Liu et al., 2021), ED (Li & Yi, 2020; Sun & Cui, 2018), land urbanization (Ariken et al., 2020), and population urbanization (Liu et al., 2012). Second, sample selection primarily involves cities (Fan et al., 2019; Li & Yi, 2020) and city clusters (Wang et al., 2014; Wu et al., 2020), followed by regions (Li et al., 2022), and ultimately the national scale (Liu et al., 2018) and global scale (Zhao et al., 2017). Third, the research focus underscores EP, mainly driven by regional resources and environmental conditions to promote regional economic sustainability (Santoso et al., 2014).
In summary, while existing research has provided valuable insights into coordinating urbanization, ED, and the environment, certain limitations remain. We observe that researchers have sought to bridge urbanization and ED by enhancing ecological and environmental quality, focusing on the impacts of natural resource integration (Ahmad et al., 2021), environmental pollution (Liang & Yang, 2019; Zhang and Chen, 2021), and ecological environment protection on urbanization and ED. However, previous studies still need to improve. First, research perspectives often lean towards one dimension, mostly analyzing the relationships from an economic, social, or environmental standpoint, needing more comprehensive and holistic considerations. Second, the scope of study tends to be confined to specific regions or cities for case analysis, with limited cross-national or cross-regional comparative studies. Third, researchers often emphasize exploring the disharmony between urbanization, ED, and the environment rather than directly addressing the issues. This approach offers practical methodologies for mitigating the real-world challenges of their discord. Fourth, fewer studies have centered on government public policies and decision mechanisms as the focal point for intertwining urbanization, ED, and the environment. The government’s role is predominantly explored solely in studies related to urbanization and ED. Therefore, our approach will encompass government environmental policies in our analysis, investigating the coordination among urbanization, ED, and EP. This approach aims to identify optimal levels of government environmental intervention aligned with regional developmental stages, offering novel perspectives for research in regionally coordinated development.
3 Materials and Methods
3.1 Study Area
Figure 1 illustrates the study area. The YREB is a burgeoning region along the Yangtze River in China. Encompassing 11 provinces and cities – Shanghai, Jiangsu, Zhejiang, Anhui, Jiangxi, Hubei, Hunan, Chongqing, Sichuan, Yunnan, and Guizhou – the YREB spans an estimated 2,052,300 square kilometers, constituting 21.4% of the entire nation. With its expansive waterways, extensive economic hinterland, abundant resources, and robust foundation in sectors like agriculture, transportation, information, and technology, the YREB displays considerable developmental promise. It is noteworthy that the YREB’s growth aligns with the Chinese government’s strategic initiatives. In September 2016, the YREB Development Plan Outline was promulgated, ushering in a fresh development paradigm for the region (Chen et al., 2017). This plan seeks to foster economic progress while concurrently safeguarding the ecological integrity of the Yangtze River. Spanning both the eastern and western reaches of China, the YREB unites the Chengdu-Chongqing and Wuhan areas, prominent inland centers, with the coastal economic belt anchored by Zhejiang, Jiangsu, and Shanghai. By 2019, the YREB’s regional GDP had surged to 4,578.5 billion yuan, marking a 6.9% year-on-year increase. Within this, the Yangtze River Delta’s regional GDP reached 2,725.3 billion yuan, signifying a 6.4% expansion. While one of China’s most economically vibrant zones, the YREB also grapples with the tension between ED and ecological preservation.
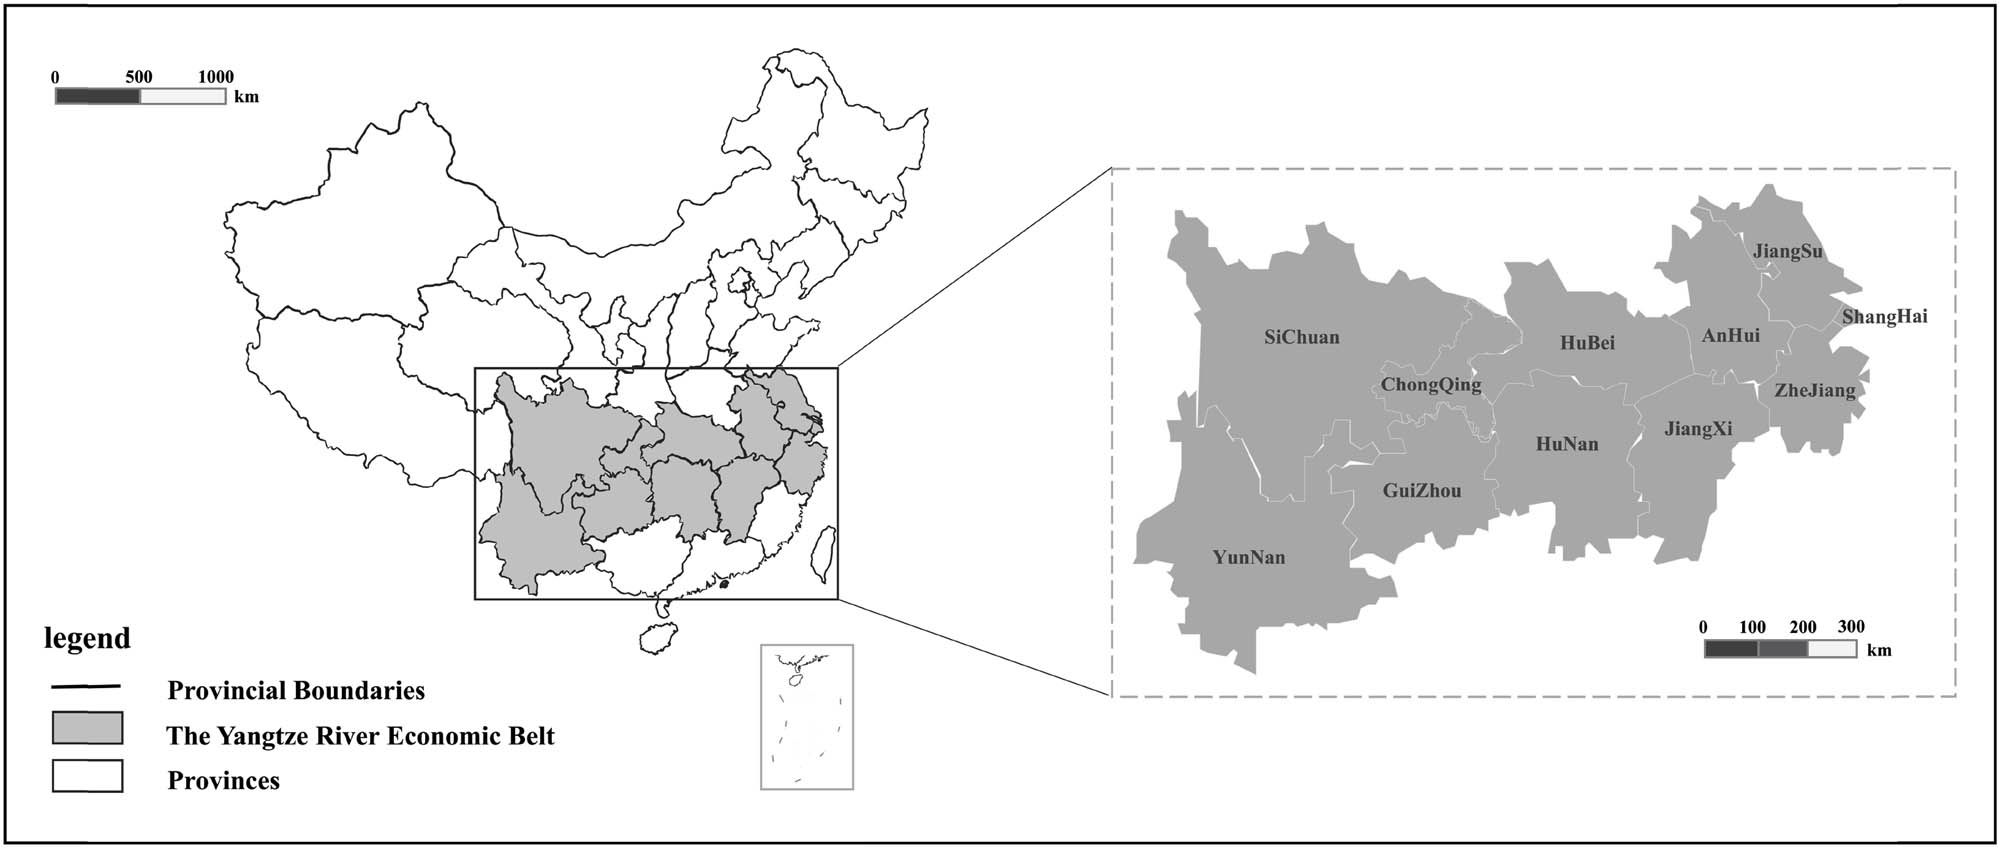
Location of study area.
3.2 Methods
The rationale for employing the CD model in this study is to investigate the intricate interactions among ED, environmental conservation, and government policies impacting urbanization. We select the CD model for its capacity to facilitate a comprehensive analysis of these multifaceted and interconnected variables.
To effectively utilize the CD model, it is imperative to establish an index system for evaluating the progress in urbanization, economic growth, environmental preservation, and government strategies. This step is pivotal in ensuring research is grounded in objective and readily accessible data. By harnessing the CD model and a well-defined index system, the study offers a systematic, data-driven comprehension of the relationships among these pivotal elements. Such insights can prove invaluable for shaping policies and making informed decisions within urbanization.
After reviewing established evaluation indicators (Chen et al., 2017; Li et al., 2021) and considering data availability and accuracy, we selected refined indicators to measure UD, ED, EP, and government policy (GP). The finalized indicator system includes four indicators, each for population and land urbanization dimensions to assess UD, four indicators for ED and fiscal growth dimensions, and five indicators across the greenery, water resources, and pollutant emissions dimensions to evaluate EP efforts. Additionally, we use the number and proportion of government interventions in EP policies to gauge the government’s role in balancing diverse development processes. We sourced data from 30 statistical yearbooks spanning 2005–2019 in the YREB region, and policy data were collected and processed from 11 provincial government websites. Table 1 provides detailed information on the specific indexes employed.
Evaluation indicator system
| Target layer | Domain level | Criterion layer | Index layer | AHP | EM | Weight |
|---|---|---|---|---|---|---|
| Multiple Factors of Urbanization Change in China | UD | Population Urbanization | Urban Population | 0.2104 | 0.2807 | 0.2489 |
| Proportion of Urban Population | 0.2241 | 0.2783 | 0.2557 | |||
| Land Urbanization | Area of Land Used for Urban Construction | 0.2693 | 0.2919 | 0.2814 | ||
| Land Used for Urban Construction as Percentage of Urban Area | 0.2962 | 0.1491 | 0.2140 | |||
| ED | ED | Gross Domestic Product (GDP) | 0.2313 | 0.2029 | 0.2169 | |
| Per Capita GDP | 0.2641 | 0.2357 | 0.2498 | |||
| Gross Regional Product Index (Previous year = 100) | 0.2836 | 0.2691 | 0.2788 | |||
| Financial Growth | General Budgetary Local Government Revenue | 0.221 | 0.2923 | 0.2545 | ||
| EP | Greenery | Green Coverage | 0.3014 | 0.2618 | 0.2851 | |
| Water Resources | Per Capita Water Resource | 0.2871 | 0.2945 | 0.2902 | ||
| Pollutant Emissions | Total Emissions of Carbon Dioxide | 0.1247 | 0.1188 | 0.1203 | ||
| Total Emissions of Waste Water | 0.1332 | 0.2107 | 0.1700 | |||
| Volume of Industrial Solid Wastes Discharged | 0.1536 | 0.1141 | 0.1344 | |||
| GP | Administrative Intervention | Number of Regional Environmental Policies | 0.4854 | 0.5088 | 0.4972 | |
| Regional Environmental Policies as Percentage of Regional Total Policies | 0.5146 | 0.4912 | 0.5028 |
The nature of evaluation indicators dictates variations in dimensionality and magnitude. In cases of differing dimensions, direct comparison of indicators is inappropriate. When indicator data exhibit substantial numerical variance, more considerable numerical indicators gain prominence, potentially overshadowing the impact of more minor numerical indicators. Hence, the normalization of raw index data is paramount to ensure the precision and reliability of evaluation outcomes. To achieve this goal, the study employs the min-max scaling technique, which uniformly maps evaluation data onto the [0,1] interval. Outline the method as follows:
where
In order to ascertain index weights in a scientifically rigorous manner and circumvent the pitfalls associated with relying solely on objective or subjective approaches, this article employs a hybrid methodology that combines the EM with the AHP. By integrating subjective and objective analyses, this approach aims to achieve a well-balanced and accurate determination of index weights.
The AHP was initially employed. The team comprises three authors and six experts. Author 1, along with Expert 1 and Expert 4, specializes in public policy. Author 2, in collaboration with Expert 2 and Expert 3, focuses on public administration. Author 3, together with Expert 5 and Expert 6, specializes in environmental economics. They constructed an analysis matrix and calculated the weights for each indicator
First, since the minimum value after standardization will appear as a zero, the zero cannot participate in the entropy calculation. It is necessary to perform translation processing on the normalization results of various data and then standardize the indicators.
Second, the standardized indicators need to be normalized again.
Third, calculate the entropy value of each indicator for the normalized data.
Fourth, through the results of entropy calculations, the redundancy of various indicators is further calculated.
Finally, calculate the weights of various indicators.
For the weights derived by the AHP and EM, we combine the subjective weight
After obtaining the final weights, we use the weights to calculate the evaluation results of the UD, ED, EP, and GP in each statistical period.
Among them, UD, ED, EP, and GP are the measured UD level, ED level, EP level, and GP intervention level within the prescribed years.
Following the CD model, the value of ‘n’ is set to 2 when assessing the CD between UD level and ED level or between any other two factors. When evaluating the CD among UD level, ED level, and EP level, ‘n’ is set to 3. For a comprehensive evaluation of UD, ED, EP, and GP levels, ‘n’ is set to 4, and ‘INDEX’ represents the respective measured index value.
For a clearer understanding of the CD model’s calculation outcomes and a more intuitive grasp of the degree of coupling exhibited by different provinces across various indicators, we have categorized the CD into four levels. A CD value below 0.3 indicates “Severe Imbalance” (SI). When the CD value falls between 0.3 and 0.5, we label the outcome “Low Coordination” (LC). Similarly, CD values ranging from 0.5 to 0.8 result in “Medium Coordination” (MC), while values exceeding 0.8 signify “High Coordination” (HC [Liao et al., 2012]). In total, we have calculated five CDs across three categories. Please refer to Table 2 for specific classification criteria.
Classification criteria for CD
| CD |
|
|
|
|
|---|---|---|---|---|
| Coordination level | High Coordination (HC) | Medium Coordination (MC) | Low Coordination (LC) | Severe Imbalance (SI) |
| Specific Type | CD2(UD–ED) | If UD > ED, ED lag | UD–ED | |
| If ED > UD, UD lag | ED–UD | |||
| CD2(ED–EP) | If UD > EP, EP lag | UD–EP | ||
| If EP > UD, UD lag | EP–UD | |||
| CD2(ED–EP) | If ED > EP, EP lag | ED–EP | ||
| If EP > ED, ED lag | EP–ED | |||
| CD3(UD–ED–EP) | If UD > ED > EP, EP lag | UD–ED–EP | ||
| If UD > EP > ED, ED lag | UD–EP–ED | |||
| If ED > UD > EP, EP lag | ED–UD–EP | |||
| If ED > EP > UD, UD lag | ED–EP–UD | |||
| If EP > UD > ED, ED lag | EP–UD–ED | |||
| If EP > ED > UD, UD lag | EP–ED–UD | |||
We link each specific type to a CD. For example, when UD > ED and the CD between them ranges from 0.8 to 1, it is labeled HC–UD–ED.
4 Results
4.1 CD of UD & ED, UD & EP, ED & EP
By employing the CD model, this article presents three coupling evaluation outcomes: the connection between UD and ED, the link between UD and EP, and the relationship between ED and EP. We compute CD values for the 11 provinces within the YREB over three distinct periods: 2005–2009, 2010–2014, and 2015–2019. The detailed results are available in Table 3.
CD without variable GP
| Provinces | Sichuan | Guizhou | Yunnan | Chongqing | Hubei | |
|---|---|---|---|---|---|---|
| 2005–2009 | ED | 0.23 | 0.17 | 0.15 | 0.23 | 0.23 |
| EP | 0.52 | 0.51 | 0.62 | 0.42 | 0.46 | |
| UD | 0.24 | 0.07 | 0.1 | 0.18 | 0.23 | |
| CD2(ED–EP) | 0.71 | 0.57 | 0.4 | 0.84 | 0.78 | |
| CD2(UD–ED) | 0.99 | 0.68 | 0.92 | 0.97 | 0.99 | |
| CD2(UD–EP) | 0.76 | 0.18 | 0.23 | 0.7 | 0.79 | |
| CD3(UD–ED–EP) | 0.51 | 0.06 | 0.06 | 0.55 | 0.59 | |
| Specific type | MC–EP–UD–ED | SI–EP–ED–UD | SI–EP–ED–UD | MC–EP–ED–UD | MC–EP–UD–ED | |
| 2010–2014 | ED | 0.3 | 0.23 | 0.22 | 0.31 | 0.29 |
| EP | 0.57 | 0.55 | 0.58 | 0.5 | 0.46 | |
| UD | 0.32 | 0.07 | 0.13 | 0.22 | 0.34 | |
| CD2(ED–EP) | 0.81 | 0.68 | 0.65 | 0.9 | 0.91 | |
| CD2(UD–ED) | 0.99 | 0.51 | 0.88 | 0.94 | 0.99 | |
| CD2(UD–EP) | 0.85 | 0.15 | 0.38 | 0.71 | 0.96 | |
| CD3(UD–ED–EP) | 0.67 | 0.06 | 0.19 | 0.59 | 0.85 | |
| Specific type | MC–EP–UD–ED | SI–EP–ED–UD | SI–EP–ED–UD | MC–EP–ED–UD | HC–EP–UD–ED | |
| 2015–2019 | ED | 0.29 | 0.21 | 0.21 | 0.26 | 0.31 |
| EP | 0.57 | 0.59 | 0.64 | 0.51 | 0.5 | |
| UD | 0.45 | 0.14 | 0.2 | 0.29 | 0.39 | |
| CD2(ED–EP) | 0.8 | 0.61 | 0.55 | 0.8 | 0.89 | |
| CD2(UD–ED) | 0.91 | 0.91 | 0.99 | 0.99 | 0.97 | |
| CD2(UD–EP) | 0.97 | 0.38 | 0.52 | 0.85 | 0.97 | |
| CD3(UD–ED–EP) | 0.71 | 0.18 | 0.24 | 0.66 | 0.84 | |
| Specific type | MC–EP–UD–ED | SI–EP–ED–UD | SI–EP–ED–UD | MC–EP–UD–ED | HC–EP–UD–ED | |
| Average CD2(ED–EP) | 0.77 | 0.62 | 0.53 | 0.85 | 0.86 | |
| Average CD2(UD–ED) | 0.96 | 0.7 | 0.93 | 0.97 | 0.98 | |
| Average CD2(UD–EP) | 0.86 | 0.24 | 0.38 | 0.75 | 0.91 | |
| Average CD3(UD–ED–EP) | 0.63 | 0.1 | 0.16 | 0.6 | 0.76 | |
| Provinces | Hunan | Jiangxi | Anhui | Shanghai | Jiangsu | Zhejiang | |
|---|---|---|---|---|---|---|---|
| 2005–2009 | ED | 0.23 | 0.2 | 0.2 | 0.3 | 0.34 | 0.27 |
| EP | 0.49 | 0.59 | 0.49 | 0.41 | 0.42 | 0.46 | |
| UD | 0.24 | 0.16 | 0.24 | 0.61 | 0.44 | 0.34 | |
| CD2(ED–EP) | 0.75 | 0.57 | 0.68 | 0.96 | 0.98 | 0.88 | |
| CD2(UD–ED) | 0.99 | 0.98 | 0.98 | 0.79 | 0.97 | 0.98 | |
| CD2(UD–EP) | 0.78 | 0.45 | 0.79 | 0.92 | 0.99 | 0.95 | |
| CD3(UD–ED–EP) | 0.56 | 0.21 | 0.5 | 0.69 | 0.95 | 0.81 | |
| Specific type | MC–EP–UD–ED | LC–EP–ED–UD | MC–EP–UD–ED | MC–UD–EP–ED | HC–UD–EP–ED | HC–EP–UD–ED | |
| 2010–2014 | ED | 0.27 | 0.23 | 0.26 | 0.35 | 0.48 | 0.33 |
| EP | 0.51 | 0.62 | 0.47 | 0.47 | 0.43 | 0.49 | |
| UD | 0.3 | 0.22 | 0.3 | 0.55 | 0.58 | 0.39 | |
| CD2(ED–EP) | 0.82 | 0.62 | 0.84 | 0.95 | 0.99 | 0.93 | |
| CD2(UD–ED) | 0.99 | 0.99 | 0.99 | 0.9 | 0.98 | 0.99 | |
| CD2(UD–EP) | 0.87 | 0.59 | 0.9 | 0.99 | 0.96 | 0.98 | |
| CD3(UD–ED–EP) | 0.7 | 0.32 | 0.74 | 0.85 | 0.94 | 0.89 | |
| Specific type | MC–EP–UD–ED | LC–EP–ED–UD | MC–EP–UD–ED | HC–UD–EP–ED | HC–UD–ED–EP | HC–EP–UD–ED | |
| 2015–2019 | ED | 0.27 | 0.23 | 0.26 | 0.49 | 0.61 | 0.46 |
| EP | 0.53 | 0.63 | 0.51 | 0.5 | 0.47 | 0.51 | |
| UD | 0.37 | 0.29 | 0.39 | 0.48 | 0.68 | 0.45 | |
| CD2(ED–EP) | 0.79 | 0.62 | 0.81 | 0.99 | 0.96 | 0.99 | |
| CD2(UD–ED) | 0.94 | 0.98 | 0.93 | 0.99 | 0.99 | 0.99 | |
| CD2(UD–EP) | 0.94 | 0.74 | 0.97 | 0.99 | 0.94 | 0.99 | |
| CD3(UD–ED–EP) | 0.7 | 0.42 | 0.73 | 0.99 | 0.9 | 0.98 | |
| Specific type | MC–EP–UD–ED | LC–EP–UD–ED | MC–EP–UD–ED | HC–EP–ED–UD | HC–UD–ED–EP | HC–EP–ED–UD | |
| Average CD2(ED–EP) | 0.79 | 0.6 | 0.78 | 0.97 | 0.98 | 0.93 | |
| Average CD2(UD–ED) | 0.97 | 0.98 | 0.97 | 0.89 | 0.98 | 0.99 | |
| Average CD2(UD–EP) | 0.86 | 0.59 | 0.89 | 0.97 | 0.96 | 0.97 | |
| Average CD3(UD–ED–EP) | 0.65 | 0.32 | 0.66 | 0.84 | 0.93 | 0.89 | |
We combine each Specific Type with the CD. For example, If EP > UD > ED, and the CD among EP, UD, and ED is between 0.8 and 1, it is recorded as HC–EP–UD–ED.
Table 3 clearly illustrates that, except for Shanghai, Yunnan, and Guizhou, all provinces have CD values exceeding 0.9, signifying a high level of coordination. Notably, Guizhou exhibited its lowest CD value (0.51) during the 2010–2014. Provinces with intermediate CD values are ranked as follows: Zhejiang, Hubei, Jiangxi, Jiangsu, Hunan, Chongqing, Anhui, Sichuan, Yunnan, Shanghai, and Guizhou.
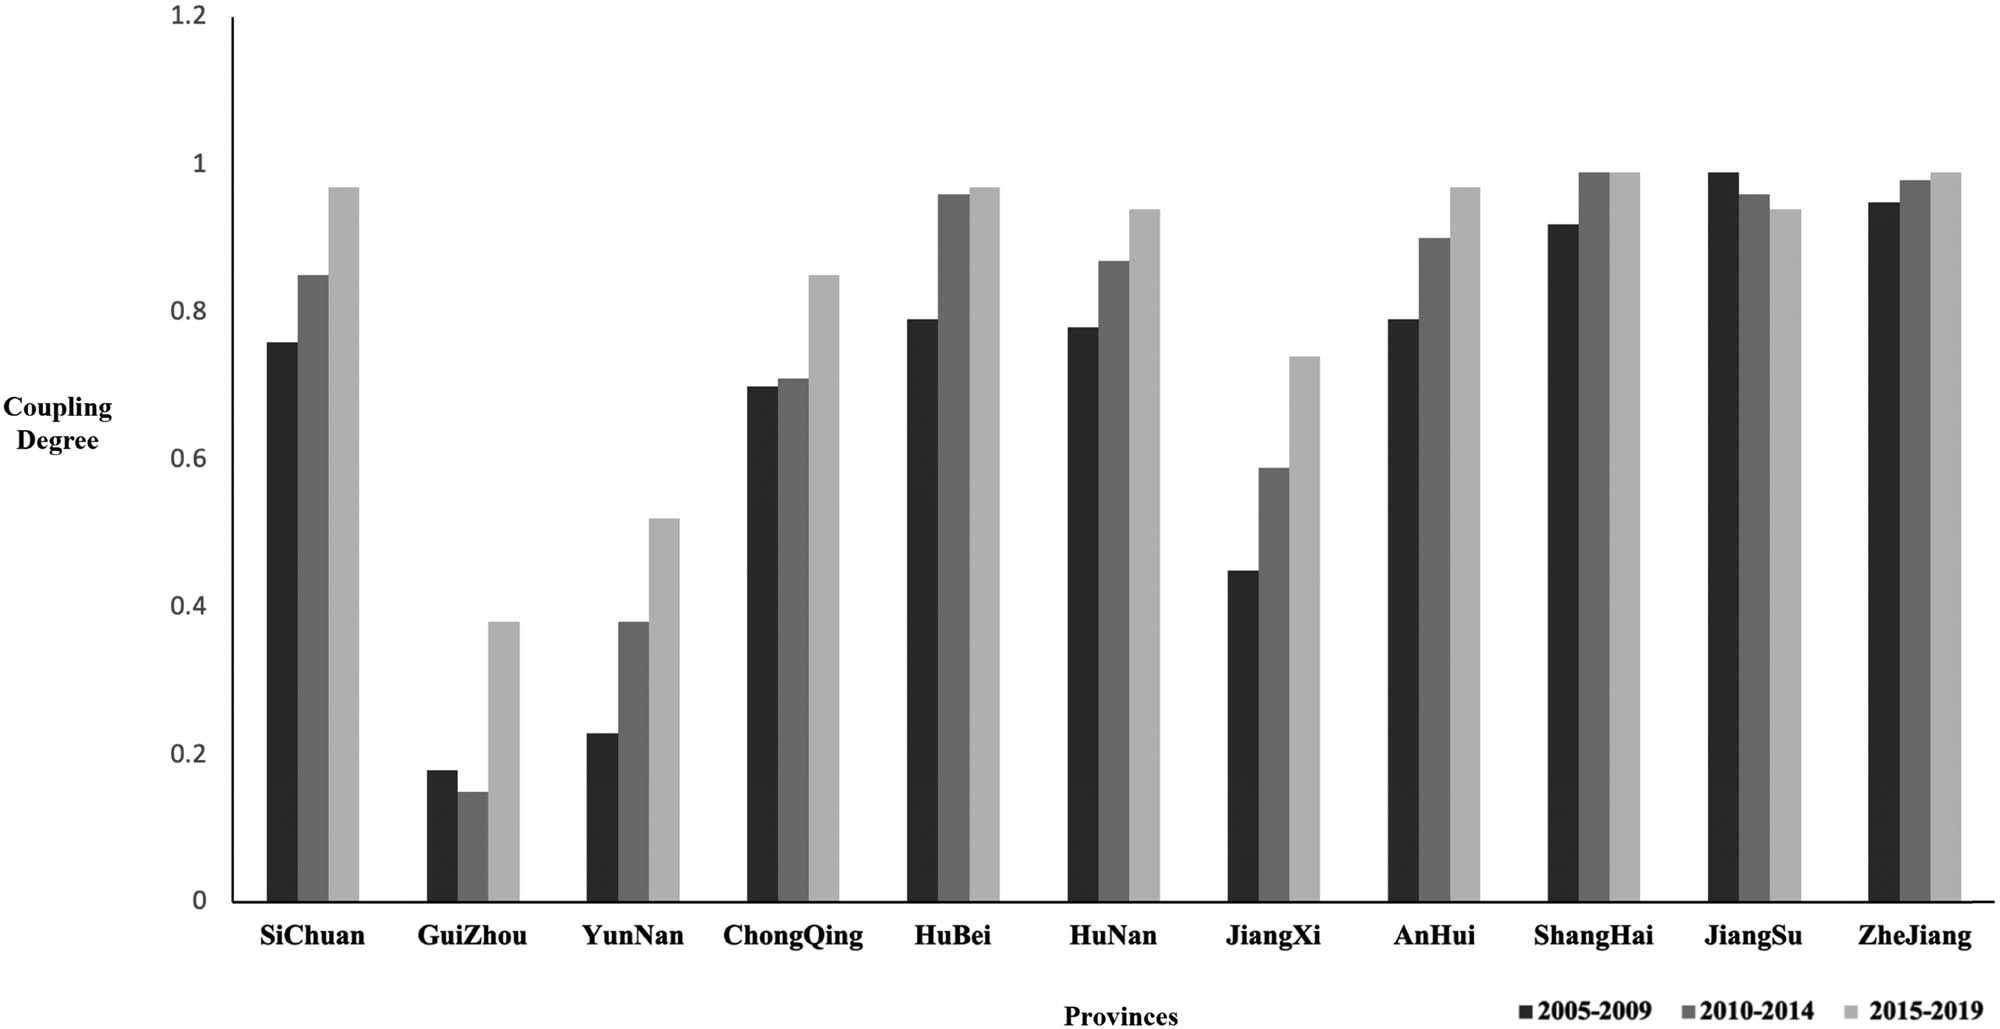
Shanghai, Yunnan, and Guizhou exhibit lower CD values in certain stages, with Guizhou having the lowest CD value of 0.51 during 2010–2014. The average CD values follow a descending order: Zhejiang, Hubei, Jiangxi, Jiangsu, Hunan, Chongqing, Anhui, Sichuan, Yunnan, Shanghai, and Guizhou. Regarding CD trends, Shanghai, Jiangsu, and Zhejiang display upward trends, while Sichuan, Hubei, Hunan, and Anhui exhibit declining trends (Figure 2).

Changes in the CD of UD and ED.
To illustrate the spatial distribution and trends of UD and ED in the YREB, the spatial distribution of UD and ED in the YREB (Figure 5) reveals a growing number of provinces with CD values exceeding 0.8. Full coverage was achieved during 2010–2014, indicating a high coordination level. Guizhou, located in the western part of the YREB, initially exhibited a lagging trend with a CD value of 0.68 in 2005–2009, significantly below the average. However, it attained a high CD value of 0.91 in 2014–2019.
The data concerning the CD of UD and EP (Table 3) indicate notable trends. Zhejiang, Shanghai, and Jiangsu exhibit CD values exceeding 0.9, reflecting a high coordination level. Hubei, with a low CD value during 2005–2009, shows an upward trajectory, reaching CD values above 0.9 in 2010–2014 and 2014–2019. Conversely, Jiangxi, Yunnan, and Guizhou demonstrate low CD values, signifying a lower coordination degree. Among these, Jiangxi displays an ascending trend, escalating from a low CD value of 0.45 during 2005–2009 to a medium coordination level of 0.74 during 2014–2019. Guizhou, however, registered a low CD value of 0.15 in 2010–2014. Generally, the ranking of the average CD values, from high to low, is as follows: Zhejiang, Shanghai, Jiangsu, Hubei, Anhui, Hunan, Sichuan, Chongqing, Jiangxi, Yunnan, and Guizhou. All provinces, except Jiangsu, demonstrate increasing trends (Figure 3).
Changes in the CD of UD and EP.
The spatial distribution of the CD between UD and EP (Figure 5) reveals that, on the whole, the CD values of UD and EP during 2005–2009 generally fall within a medium coordination level, with significant disparities between the two ends of the spectrum. Specifically, Zhejiang, Shanghai, and Jiangsu in the eastern part of the YREB exhibit a high level of coordination, whereas Yunnan and Guizhou in the western region record CD values below 0.3, indicative of severe imbalance in coordination. In 2010–2014, there was an upward trend in provinces with CD values surpassing 0.8. By the interval 2014–2019, most provinces in the YREB attained CD values exceeding 0.8 for both UD and EP, except for Jiangxi, Yunnan, and Guizhou, which achieved a high coordination level.
The CD data between ED and EP (Table 3) indicate that Shanghai and Jiangsu exhibit CD values exceeding 0.9. At the same time, Zhejiang maintains values above 0.9 except for a CD value of 0.88 during 2005–2009, showcasing a consistently high coordination level. Hubei and Chongqing closely trail behind, with average CD values surpassing 0.8, signifying a solid level of coordination. Conversely, Guizhou, Jiangxi, and Yunnan possess lower CD values, with Yunnan recording a low coordination level of 0.4 from 2005 to 2009. Regarding CD value ranking, the order from high to low is as follows: Jiangsu, Shanghai, Zhejiang, Hubei, Chongqing, Hunan, Anhui, Sichuan, Guizhou, Jiangxi, and Yunnan. Regarding trend changes (Figure 4), Jiangxi, Shanghai, and Zhejiang experienced an upward trajectory. Sichuan, Guizhou, Yunnan, Chongqing, Hubei, Hunan, Anhui, and Jiangsu all reached their peak CD values during 2010–2014, followed by a subsequent decline.

Changes in the CD of ED and EP.
The spatial distribution of CD between ED and EP (Figure 5) illustrates that the average CD values of ED and EP in the eastern YREB region (encompassing Shanghai, Jiangsu, and Zhejiang) consistently exceed 0.9 from 2005 to 2019, indicating a consistent high level of coupling. Furthermore, provinces situated in the northern part of the YREB tend to exhibit higher coordination compared to their counterparts in the south. Overall, the southern provinces, including Yunnan, Guizhou, and Jiangxi, display notably lower CD values than the other provinces within the YREB.

Spatial pattern of the CD of UD & ED, UD & EP, ED & EP.
4.2 CD of UD & ED & EP
Considering the three elements of urban development, ED, and EP in combination, rather than just two of them, is to provide a more comprehensive and integrated perspective. Table 3 presents the comprehensive CD outcomes for UD&ED&EP across the 11 provinces within the YREB during the three timeframes: 2005–2009, 2010–2014, and 2015–2019. We obtain these results through the utilization of the CD model.
Table 3 presents the comprehensive CD data for the three relationship groups. Only Jiangsu consistently maintains a high level of coordination, with CD values exceeding 0.9 across all three periods. Similarly, Zhejiang exhibits CD values above 0.8 in each period. Shanghai and Hubei provinces demonstrate a medium coordination level, with CD values below 0.7 in 2005–2009, but these values increased to above 0.84 in 2010–2014 and 2015–2019. Notably, Shanghai’s CD value reached 0.99 in 2015–2019.
Conversely, Jiangxi, Yunnan, and Guizhou present much lower CD values. Among these, Jiangxi records the lowest mean CD value of 0.32, indicating a low coordination level. Yunnan and Guizhou have CD values below 0.3, with Guizhou’s mean CD value at 0.1, classifying it as a severe imbalance. Ranking by mean CD values, the order of the relationship groups is Jiangsu, Zhejiang, Shanghai, Hubei, Anhui, Sichuan, Chongqing, Jiangxi, Yunnan, and Guizhou. Apart from Jiangsu and Anhui, most YREB provinces demonstrate an increasing trend. Notably, Jiangsu experienced a decreasing trend, while Anhui reached its highest value in 2010–2014 before declining (Figure 6).

Changes of the CD of UD, ED & EP.
Figure 7 depicts the spatial distribution of the CD across the three relationship groups. In the eastern region of the YREB, Jiangsu and Zhejiang consistently exhibit CD values exceeding 0.8 across 2005–2009, 2010–2014, and 2015–2019, indicating a sustained high coordination level. Moving to the central YREB area, Wuhan experienced a transition from a medium coordination level in 2005–2009 to a high coordination level in 2010–2014. Notably, Jiangxi progressed from a severe imbalance, with CD values below 0.3 in 2005–2009, to a low coordination level starting from 2010–2014. Conversely, in the western YREB zone, Yunnan and Guizhou consistently maintain CD values below 0.3 across all three time periods, indicating a severe imbalance level.
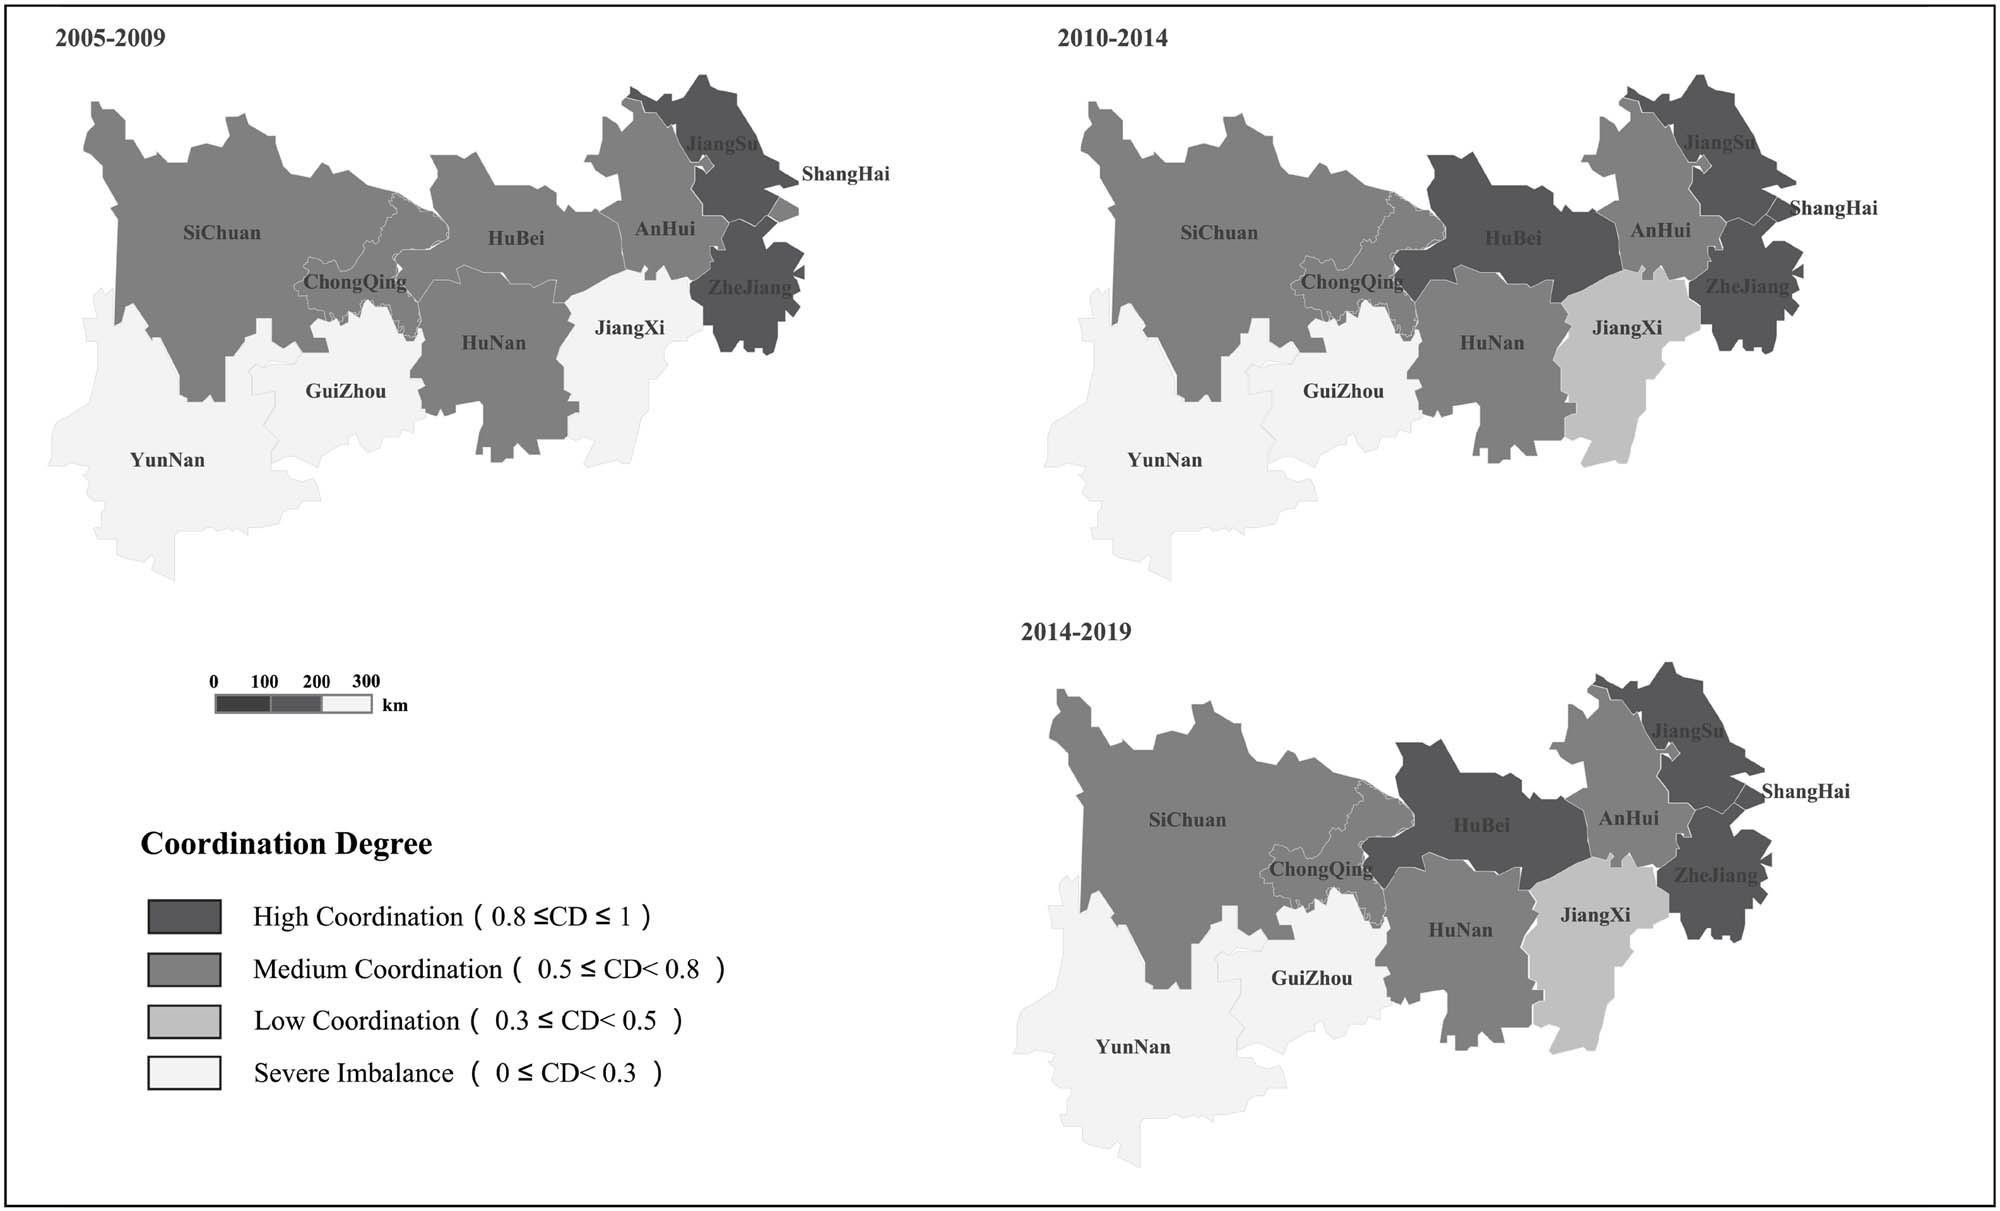
Spatial pattern of the CD of UD, ED & EP.
4.3 CD of UD & ED & EP & GP
Table 4 provides the comprehensive results of the CD across UD&ED&EP&GP from 2005 to 2019. The findings from the data encompassing the four relationships (Table 4) indicate that Jiangsu, Zhejiang, Hubei, Hunan, Shanghai, and Anhui all possess CD values surpassing 0.3, representing provinces with synchronized development. Among them, Jiangsu stands out with notably high CD values exceeding 0.9. On the other hand, Jiangxi, Sichuan, Yunnan, Guizhou, and Chongqing exhibit CD values below 0.3, indicative of a severe imbalance level. Notably, Guizhou and Chongqing possess the lowest CD values, measuring 0.0037 and 0.0001, respectively. The ranking of YREB provinces, from highest to lowest CD values, is as follows: Jiangsu, Zhejiang, Hubei, Hunan, Shanghai, Anhui, Jiangxi, Sichuan, Yunnan, Guizhou, and Chongqing.
CD of UD&ED& EP&GP
| Provinces | 2005–2019 | ||||
|---|---|---|---|---|---|
| ED | EP | UD | GP | CD4 | |
| Sichuan | 0.3277 | 0.5538 | 0.3371 | 0.1405 | 0.1731 |
| Guizhou | 0.227 | 0.5509 | 0.0927 | 0.9829 | 0.0037 |
| Yunnan | 0.2244 | 0.6127 | 0.1445 | 0.4865 | 0.0806 |
| Chongqing | 0.2979 | 0.4776 | 0.2278 | 0.01 | 0.0001 |
| Hubei | 0.3323 | 0.4722 | 0.3195 | 0.5748 | 0.6156 |
| Hunan | 0.3014 | 0.5088 | 0.306 | 0.233 | 0.509 |
| Jiangxi | 0.2499 | 0.614 | 0.2228 | 0.4497 | 0.2489 |
| Anhui | 0.2874 | 0.4879 | 0.3091 | 0.6465 | 0.4078 |
| Shanghai | 0.4183 | 0.4596 | 0.5442 | 0.2354 | 0.4868 |
| Jiangsu | 0.5915 | 0.4416 | 0.5653 | 0.4966 | 0.9017 |
| Zhejiang | 0.4233 | 0.4859 | 0.3915 | 0.3001 | 0.7876 |
CD4 indicates the CD of UD&ED& EP&GP.
The regional distribution of CD across the four relationships (Figures 5 and 8) highlights coupling centers in the upper, middle, and lower reaches of the YREB, with varying levels of coupling strength. Notably, these three centers, situated in the downstream, midstream, and upstream, respectively, exhibit a gradient of coupling strength from high to low. For instance, despite its CD value of 0.1731, placing it within the severe imbalance range, Sichuan is the coupling center for the upper Yangtze River. Interestingly, there exists a significant 0.17 difference between the CD values of Sichuan and Guizhou, which records the lowest CD value in the region. In the middle Yangtze River, Hubei emerges as the regional coupling hub with a CD value of 0.6156, signifying a medium coordination level. The CD value disparity between Hubei and Jiangxi amounts to 0.37, while Jiangxi displays the lowest CD value in the region, thus showcasing a substantial gap. Finally, in the lower Yangtze River, Jiangsu is the coupling center, with a substantial 0.49 CD value difference from Anhui, implying significant disparities.

Spatial pattern of the CD of UD&ED& EP&GP.
5 Discussion
Our research findings reveal a high CD between the UD and ED levels across the 11 provinces within the YREB, corroborating previous studies conducted on certain cities within the YREB (Han et al., 2019). Moreover, this coupling strength exhibits an overall increasing trend throughout the three study periods. Notably, during the phase of 2015–2019, CD values for all provinces exceeded 0.9, signifying a substantial elevation to a high coordination level. This trend holds irrespective of China’s ED model. During developmental phases, the advantages of urbanization become evident. Local administrations can secure additional funds through land sales, bolstering economic growth.
Additionally, the influx of urban population contributes to the demand for land urbanization. Nevertheless, it is worth highlighting that Guizhou, situated in the upper reaches of the YREB, stands out with distinct disparities during the initial two stages. The CD lags behind the average by 30%, indicating that the synchronization of UD and economic advancement could be more consistent. Guizhou’s case underscores the limited influence of ED on urbanization progression.
Our research demonstrates a gradual increase in the CD between UD and EP. This finding aligns with existing studies on water environment and urbanization. Particularly after 2015, changes in the central government’s EP policies and strengthened supervision have contributed to significant environmental improvement. The downstream coastal regions of the YREB, namely Shanghai, Jiangsu, and Zhejiang, often called the “Jiangsu–Zhejiang–Shanghai” sector, consistently maintain an extremely high coordination level. This area is recognized as China’s “developed” sector. However, other regions exhibit variations. Hunan and Hubei, situated in the midstream of the YREB, lag behind the Jiangsu–Zhejiang–Shanghai regions.
Further upstream, Yunnan and Guizhou fall even further behind the midstream provinces. Of note, Jiangxi Province, adjacent to Jiangsu and Zhejiang, demonstrates a coordinated “low-lying land” in the middle and lower reaches of the YREB. Analysis of specific data concerning UD and EP in Jiangxi reveals a considerable gap between its UD and EP scores (Lv et al., 2019). This discrepancy stems from the influence of neighboring developed areas and the resource drain caused by larger cities, impeding Jiangxi’s ability to support its urbanization expansion.
Upon analyzing the ED & EP data results, it becomes evident that the regions of Jiangsu, Zhejiang, and Shanghai are leading the way compared to other areas. However, some instances exist where ED needs to align with EP efforts. A significant contributing factor to this disparity is the substantial degree of policy inertia observed in China’s development approach (Mikalef et al., 2018). In the trajectory of China’s urbanization process, the role of the government holds paramount importance. The unitary nature of the government grants it unparalleled authority in designing and executing development strategies. Throughout numerous years, government entities at various levels have prioritized rapid GDP growth, often at the expense of environmental considerations, emblematic of China’s earlier development paradigm. However, it is noteworthy that Sichuan and Chongqing emerged as positive examples in the upper reaches of the YREB. The high level of coordination observed between their ED and EP underscores that, despite not attaining notably high ED scores, local governments still need to adopt a model that sacrifices the environment.
An intriguing observation is that, despite a high level of coordination between UD and ED, the coordination between ED and EP consistently surpasses that of UD and EP. While the YREB increasingly emphasizes EP alongside ED, the region’s UD must align with environmental preservation efforts wholly.
A comprehensive analysis of the YREB’s development CD across UD, EP, and ED reveals a distinct stair-like pattern in coordination levels. This trend is observable as downstream > midstream > upstream. Moreover, there are variations in coordination within each region. Hubei Province stands out in the midstream of the YREB, while Jiangxi Province lags behind its neighboring provinces. Notably, Sichuan and Chongqing exhibit superior comprehensive coordination in the upper Yangtze River region compared to Yunnan and Guizhou. This discrepancy in stepped equilibrium reflects the uneven development of China’s regions, aligning with previous studies that have comprehensively explored aspects such as population, economy, society, and spatial urbanization in the region and reached similar conclusions about the hierarchy of the eastern, central, and western parts.
One of the innovative aspects of this study is the inclusion of government behavior within the analytical framework. As indicated by the analysis above, governments contend with both general ED pressures and the ingrained policy inertia prioritizing economic growth. To assess the government’s ability to balance diverse developmental and EP initiatives, we utilize the characteristics of the government’s EP policies. Since there is often a temporal gap between policy enactment and its effectiveness (Ahlers & Schubert, 2015), we must address the progressive relationship between policies and the other three characteristics. Referring to the GP coupling degrees presented in Table 4, we categorize local government development strategies into four levels: positive intervention (Guizhou), partial intervention (Jiangsu, Anhui, Hubei, and Yunnan), limited intervention (Sichuan, Hunan, Shanghai, and Zhejiang), and minimal intervention (Chongqing). The comprehensive, collaborative analysis, encompassing government policies, confirms the continuation of the downstream > midstream > upstream trend in the YREB. This trend also serves as a basis to dissect the distinctive strategies different governments adopt in response to development challenges. For instance, although the comprehensive, collaborative analysis yields low results for Chongqing and Guizhou, the underlying strategies differ significantly. Guizhou’s proactive EP development strategy, implemented after 2012, stands out as more vigorous than other provinces. In contrast, Chongqing’s notably lower policy intervention scores contribute to its lower overall value. This outcome underscores the importance of examining formation strategies rather than mere numerical values when analyzing the coupling results of multiple factors simultaneously. Based on the research outcomes, we outline potential government intervention strategies in Table 5.
Potential government intervention strategies
| UD | ED | EP | Government Intervention | Coordination |
|---|---|---|---|---|
| High-level | High-level | High-level | Positive intervention | High-level |
| Negative intervention | Low-level | |||
| Low-level | Positive intervention | Low-level | ||
| Negative intervention | Medium | |||
| Low-level | High-level | Positive intervention | Low-level | |
| Negative intervention | Medium | |||
| Low-level | Positive intervention | Medium | ||
| Negative intervention | Low-level | |||
| Low-level | High-level | High-level | Positive intervention | Low-level |
| Negative intervention | Medium | |||
| Low-level | Positive intervention | Medium | ||
| Negative intervention | Low-level | |||
| Low-level | High-level | Positive intervention | Medium | |
| Negative intervention | Low-level | |||
| Low-level | Positive intervention | Low-level | ||
| Negative intervention | High-level |
Only some of the situations in the figure appear in the data, so we have predicted some possible results.
In devising development strategies, governments should prioritize achieving a balance among various influential factors to facilitate sustainable progress in environmental preservation, ED, and high-quality urban expansion. Specifically, this involves harnessing the guiding potential of policy tools, enabling governments to fulfill their role as mediators throughout the development journey more effectively.
6 Conclusions
This study employs the CD model to analyze the coordination among UD, ED, and EP. It underscores the significance of government intervention and highlights the varying levels of government environmental intervention required at different developmental stages. Additionally, the research emphasizes the disparities in coordination among UD, ED, and EP, along with the influence of regional policy interventions.
Research indicates that high levels of UD and ED typically require coordination with robust EP, and proactive government intervention aids in enhancing this coordination. However, low levels of urbanization and ED may lead to reduced EP, with government intervention affecting coordination dynamics. Specifically, over-analysis from 2004 to 2019, the coordination level within various provinces along the YREB has shown continuous improvement. Nonetheless, the study reveals a strong coupling between UD and ED among the 11 provinces within the YREB. However, an imbalance exists in the coordination between ED and EP. Remarkably, the coupling between ED and EP is more pronounced than between UD and EP, suggesting a greater need for policy intervention to coordinate ED and EP. This imbalance becomes more evident under varying levels of regional policy intervention, resulting in a distinct staggered pattern of developmental coordination within the YREB: downstream > midstream > upstream.
This study advances the understanding of the relationship between UD, ED, and EP, highlighting the pivotal role of government in coordinating these factors. It identifies the varying demands for government environmental intervention across different development levels, offering crucial insights for policymakers to formulate region-specific policies. Introducing the novel dimension of government policies, an aspect less explored in previous research, we establish an analytical framework centered on comprehensive coordination through government intervention levels. This framework enhances the breadth of coordination analysis and yields profound insights.
Recognizing the significance of government actions, we acknowledge the pivotal role of the government in factors such as UD, ED, and EP. However, this study needs to delve into the specific mechanisms underlying these interrelationships. Therefore, future research can take the following directions. On the one hand, by delving into government decision-making, policy implementation, and the extent of government intervention at various stages, we can unveil how government behavior influences the relationships among these factors. On the other hand, integrating quantitative and qualitative methods can help us thoroughly explore the underlying logic and dynamic changes in government actions. Quantitative data can provide macro trends, while qualitative analysis can aid in comprehending the motivations and mechanisms behind government decisions.
Acknowledgments
Thanks to anonymous reviewers for their valuable comments and suggestions.
-
Funding information: This work was sponsored the National Social Science Grant of China, Research on paths to increase the income of rural left-behind groups under the rural revitalization strategy (22BSH068).
-
Conflict of interest: The authors did not report any potential conflict of interest.
-
Article note: As part of the open assessment, reviews and the original submission are available as supplementary files on our website.
-
Data availability statement: The data sets analyzed during the current study are available in the China National Bureau of Statistics Database and Carbon Emission Accounts & Datasets repository, China City Statistical Yearbook, and Provincial Government Websites. The data sets are available publicly and free of charge. Specifically, the data on Urban Population, Proportion of Urban Population, Land Used for Urban Construction as a Percentage of Urban Area, Gross Domestic Product (GDP), Per Capita GDP, Gross Regional Product Index (previous year = 100), General Budgetary Local Government Revenue, Per Capita Water Resource, Volume of Industrial Solid Wastes Discharged are available in China National Bureau of Statistics Database at https://data.stats.gov.cn/easyquery.htm? cn = E0103. The data on the area of Total Emissions of Carbon Dioxide are available in Carbon Emission Accounts & Datasets at www.ceads.net. The data on the Area of Land Used for Urban Construction and Green Coverage are in the China City Statistical Yearbook at https://navi.cnki.net/knavi/yearbooks/YZGCA/detail?uniplatform=NZKPT. The data on Number of Environmental Policies by province are at https://www.sc.gov.cn/10462/wza2012/zwxx/zwxx.shtml; https://www.guizhou.gov.cn/ztzl/gzsgzhgfxwjsjk/gzsjk/index.html; www.yn.gov.cn/zwgk/; https://www.cq.gov.cn/zwgk/zf xxgkml/szfwj/; https://www.hubei.gov.cn/xxgk/; https://www.hunan.gov.cn/hnszf/xxgk/xxgk.html; http://www.jiangxi.gov.cn/col/col13977/index.html; https://www.ah.gov.cn/public/index.html; http://www.tj.gov.cn/zwgk/; www.jiangsu.gov.cn/col/col76552/index.html; http://www.zj.gov.cn/col/col1229019362/index.html.
References
Abass, K., Adanu, S. K., & Agyemang, S. (2018). Peri-urbanisation and loss of arable land in Kumasi Metropolis in three decades: Evidence from remote sensing image analysis. Land Use Policy, 72, 470–479.10.1016/j.landusepol.2018.01.013Suche in Google Scholar
Abidin, H. Z., Andreas, H., Gumilar, I., Fukuda, Y., Pohan, Y. E., & Deguchi, T. (2011). Land subsidence of Jakarta (Indonesia) and its relation with urban development. Natural hazards, 59, 1753–1771.10.1007/s11069-011-9866-9Suche in Google Scholar
Ahlers, A. L., & Schubert, G. (2015). Effective policy implementation in China’s local state. Modern China, 41(4), 372–405.10.1177/0097700413519563Suche in Google Scholar
Ahmad, M., Rehman, A., Shah, S. A. A., Solangi, Y. A., Chandio, A. A., & Jabeen, G. (2021). Stylized heterogeneous dynamic links among healthcare expenditures, land urbanization, and CO2 emissions across economic development levels. Science of the Total Environment, 753, 142228.10.1016/j.scitotenv.2020.142228Suche in Google Scholar
Apostolopoulos, V., & Kasselouris, G. (2022). Seizing the potential of transport pooling in urban logistics-the case of thriasio logistics centre in Greece. Journal of Applied Research on Industrial Engineering, 9(2), 230–248.Suche in Google Scholar
Ariken, M., Zhang, F., Liu, K., Fang, C., & Kung, H. T. (2020). Coupling coordination analysis of urbanization and eco-environment in Yanqi Basin based on multi-source remote sensing data. Ecological Indicators, 114, 106331.10.1016/j.ecolind.2020.106331Suche in Google Scholar
Arneth, A., Sitch, S., Pongratz, J., Stocker, B. D., Ciais, P., Poulter, B., & Zaehle, S. (2017). Historical carbon dioxide emissions caused by land-use changes are possibly larger than assumed. Nature Geoscience, 10(2), 79–84.10.1038/ngeo2882Suche in Google Scholar
Asabere, S. B., Acheampong, R. A., Ashiagbor, G., Beckers, S. C., Keck, M., Erasmi, S., & Sauer, D. (2020). Urbanization, land use transformation and spatio-environmental impacts: Analyses of trends and implications in major metropolitan regions of Ghana. Land Use Policy, 96, 104707.10.1016/j.landusepol.2020.104707Suche in Google Scholar
Bass, M. S., Finer, M., Jenkins, C. N., Kreft, H., Cisneros-Heredia, D. F., McCracken, S. F., & Kunz, T. H. (2010). Global conservation significance of Ecuador’s Yasuní National Park. PloS One, 5(1), e8767.10.1371/journal.pone.0008767Suche in Google Scholar
Chen, M., Liu, W., Lu, D., Chen, H., & Ye, C. (2018). Progress of China’s new-type urbanization construction since 2014: A preliminary assessment. Cities, 78, 180–193.10.1016/j.cities.2018.02.012Suche in Google Scholar
Chen, Y., Zhang, S., Huang, D., Li, B. L., Liu, J., Liu, W., & Wang, H. (2017). The development of China’s Yangtze River Economic Belt: How to make it in a green way. Science Bulletin, 62(9), 648–651.10.1016/j.scib.2017.04.009Suche in Google Scholar
Choi, Y., & Wang, N. (2017). the economic efficiency of urban land use with a sequential slack-based model in Korea. Sustainability, 9(1), 79.10.3390/su9010079Suche in Google Scholar
Fan, Y., Fang, C., & Zhang, Q. (2019). Coupling coordinated development between social economy and ecological environment in Chinese provincial capital cities-assessment and policy implications. Journal of Cleaner Production, 229, 289–298.10.1016/j.jclepro.2019.05.027Suche in Google Scholar
Godschalk, D. R. (1975). Carrying capacity: A key to environmental planning?. Journal of Soil and Water Conservation, 30(4), 160–165.Suche in Google Scholar
Han, H., Li, H., & Zhang, K. (2019). Spatial-temporal coupling analysis of the coordination between urbanization and water ecosystem in the Yangtze River Economic Belt. International Journal of Environmental Research and Public Health, 16(19), 3757.10.3390/ijerph16193757Suche in Google Scholar
Jaeger, J. A., Bertiller, R., Schwick, C., & Kienast, F. (2010). Suitability criteria for measures of urban sprawl. Ecological Indicators, 10(2), 397–406.10.1016/j.ecolind.2009.07.007Suche in Google Scholar
Jin, W., Xu, L., & Yang, Z. (2009). Modeling a policy making framework for urban sustainability: Incorporating system dynamics into the Ecological Footprint. Ecological Economics, 68(12), 2938–2949.10.1016/j.ecolecon.2009.06.010Suche in Google Scholar
Li, K., Zhou, Y., Xiao, H., Li, Z., & Shan, Y. (2021). Decoupling of economic development from CO2 emissions in Yangtze River Economic Belt cities. Science of the Total Environment, 775, 145927.10.1016/j.scitotenv.2021.145927Suche in Google Scholar
Li, W., & Yi, P. (2020). Assessment of city sustainability—Coupling coordinated development among economy, society and environment. Journal of Cleaner Production, 256, 120453.10.1016/j.jclepro.2020.120453Suche in Google Scholar
Li, X., Zhang, M., & Wang, J. (2022). The spatio-temporal relationship between land use and population distribution around new intercity railway stations: A case study on the Pearl River Delta region, China. Journal of Transport Geography, 98, 103274.10.1016/j.jtrangeo.2021.103274Suche in Google Scholar
Liang, W., & Yang, M. (2019). Urbanization, economic development and environmental pollution: Evidence from China. Sustainable Computing: Informatics and Systems, 21, 1–9.10.1016/j.suscom.2018.11.007Suche in Google Scholar
Liao, C. J., Huang, J. F., Sheng, L., & You, H. Y. (2012). Grey correlation analysis between urban built-up area expansion and social economic factors: A case study of Hangzhou, China. Applied Mechanics and Materials, 209, 1615–1619.10.4028/www.scientific.net/AMM.209-211.1615Suche in Google Scholar
Lin, X., Wang, Y., Wang, S., & Wang, D. (2015). Spatial differences and driving forces of land urbanization in China. Journal of Geographical Sciences, 25, 545–558.10.1007/s11442-015-1186-7Suche in Google Scholar
Liu, J., Tian, Y., Huang, K., & Yi, T. (2021). Spatial-temporal differentiation of the coupling coordinated development of regional energy-economy-ecology system: A case study of the Yangtze River Economic Belt. Ecological Indicators, 124, 107394.10.1016/j.ecolind.2021.107394Suche in Google Scholar
Liu, J., Zheng, Q., Guo, R., & Li, M. (2012). Evaluation on coordinate development for urbanization in population and land of Chongqing. Journal of Southwest China Normal University(Natural Science Edition), 11, 66–72.Suche in Google Scholar
Liu, N., Liu, C., Xia, Y., & Da, B. (2018). Examining the coordination between urbanization and eco-environment using coupling and spatial analyses: A case study in China. Ecological Indicators, 93, 1163–1175.10.1016/j.ecolind.2018.06.013Suche in Google Scholar
Liu, R. Z., & Borthwick, A. G. (2011). Measurement and assessment of carrying capacity of the environment in Ningbo, China. Journal of Environmental Management, 92(8), 2047–2053.10.1016/j.jenvman.2011.03.033Suche in Google Scholar
Lu, D. (2007). Urbanization process and spatial sprawl in China. Urban Planning Forum, 4, 47–52.Suche in Google Scholar
Lv, T., Wang, L., Zhang, X., Xie, H., Lu, H., Li, H., & Zhang, Y. (2019). Coupling coordinated development and exploring its influencing factors in Nanchang, China: From the perspectives of land urbanization and population urbanization. Land, 8(12), 178.10.3390/land8120178Suche in Google Scholar
Malek, Ž., & Verburg, P. H. (2020). Mapping global patterns of land use decision-making. Global Environmental Change, 65, 102170.10.1016/j.gloenvcha.2020.102170Suche in Google Scholar
Maparu, T. S., & Mazumder, T. N. (2017). Transport infrastructure, economic development and urbanization in India (1990–2011): Is there any causal relationship?. Transportation Research Part A: Policy and Practice, 100, 319–336.10.1016/j.tra.2017.04.033Suche in Google Scholar
Mikalef, P., van de Wetering, R., & Krogstie, J. (2018). Big Data enabled organizational transformation: The effect of inertia in adoption and diffusion. Business Information Systems: 21st International Conference, BIS 2018, Berlin, Germany, July 18-20, 2018, Proceedings, 21, 135–147.10.1007/978-3-319-93931-5_10Suche in Google Scholar
Osintsev, N., & Khalilian, B. (2023). Does organizational performance increase with innovation and strategic planning?. Journal of Operational and Strategic Analytics, 1(1), 25–33.10.56578/josa010104Suche in Google Scholar
Santoso, E. B., Erli, H. K. D. M., Aulia, B. U., & Ghozali, A. (2014). Concept of carrying capacity: Challenges in spatial planning (Case study of East Java Province, Indonesia). Procedia-Social and Behavioral Sciences, 135, 130–135.10.1016/j.sbspro.2014.07.336Suche in Google Scholar
Saveriades, A. (2000). Establishing the social tourism carrying capacity for the tourist resorts of the east coast of the Republic of Cyprus. Tourism Management, 21(2), 147–156.10.1016/S0261-5177(99)00044-8Suche in Google Scholar
Shi, T., & Gill, R. (2005). Developing effective policies for the sustainable development of ecological agriculture in China: The case study of Jinshan County with a systems dynamics model. Ecological Economics, 53(2), 223–246.10.1016/j.ecolecon.2004.08.006Suche in Google Scholar
Siciliano, G. (2012). Urbanization strategies, rural development and land use changes in China: A multiple-level integrated assessment. Land Use Policy, 29(1), 165–178.10.1016/j.landusepol.2011.06.003Suche in Google Scholar
Specht, P. H. (1993). Munificence and carrying capacity of the environment and organization formation. Entrepreneurship Theory and Practice, 17(2), 77–86.10.1177/104225879301700207Suche in Google Scholar
Sun, Y., & Cui, Y. (2018). Evaluating the coordinated development of economic, social and environmental benefits of urban public transportation infrastructure: Case study of four Chinese autonomous municipalities. Transport Policy, 66, 116–126.10.1016/j.tranpol.2018.02.006Suche in Google Scholar
Vurur, N. S. (2022). The nexus between urbanization, renewable energy, financial development, and economic growth: Evidence from Turkey. The Journal of Corporate Governance, Insurance, and Risk Management (JCGIRM), 9(2), 316–326.10.56578/jcgirm090202Suche in Google Scholar
Wang, S., Li, G., & Fang, C. (2018). Urbanization, economic development, energy consumption, and CO2 emissions: Empirical evidence from countries with different income levels. Renewable and Sustainable Energy Reviews, 81, 2144–2159.10.1016/j.rser.2017.06.025Suche in Google Scholar
Wang, S., Ma, H., & Zhao, Y. (2014). Exploring the relationship between urbanization and the eco-environment–A case study of Beijing–Tianjin–Hebei region. Ecological Indicators, 45, 171–183.10.1016/j.ecolind.2014.04.006Suche in Google Scholar
Wei, Y. D., & Ye, X. (2014). Urbanization, urban land expansion and environmental change in China. Stochastic Environmental Research and Risk Assessment, 28, 757–765.10.1007/s00477-013-0840-9Suche in Google Scholar
Wu, T., Perrings, C., Kinzig, A., Collins, J. P., Minteer, B. A., & Daszak, P. (2017). economic development, urbanization, globalization, and the risks of emerging infectious diseases in China: A review. Ambio, 46, 18–29.10.1007/s13280-016-0809-2Suche in Google Scholar
Wu, Z., Li, Z., & Zeng, H. (2020). Using remote sensing data to study the coupling relationship between urbanization and eco-environment change: A case study in the Guangdong-Hong Kong-Macao greater bay area. Sustainability, 12(19), 7875.10.3390/su12197875Suche in Google Scholar
Xu, Y., McNamara, P., Wu, Y., & Dong, Y. (2013). An econometric analysis of changes in arable land utilization using multinomial logit model in Pinggu district, Beijing, China. Journal of Environmental Management, 128, 324–334.10.1016/j.jenvman.2013.05.020Suche in Google Scholar
Yang, J., Lei, K., Khu, S., & Meng, W. (2015). Assessment of water resources carrying capacity for sustainable development based on a system dynamics model: A case study of Tieling City, China. Water Resources Management, 29, 885–899.10.1007/s11269-014-0849-ySuche in Google Scholar
Yang, Y., Bao, W., Li, Y., Wang, Y., & Chen, Z. (2020). Land use transition and its eco-environmental effects in the Beijing–Tianjin–Hebei urban agglomeration: A production–living–ecological perspective. Land, 9(9), 285.10.3390/land9090285Suche in Google Scholar
Yin, D., Li, X., Li, G., Zhang, J., & Yu, H. (2020). Spatio-temporal evolution of land use transition and its eco-environmental effects: A case study of the Yellow River basin, China. Land, 9(12), 514.10.3390/land9120514Suche in Google Scholar
Yu, J., Zhou, K., & Yang, S. (2019). Land use efficiency and influencing factors of urban agglomerations in China. Land Use Policy, 88, 104143.10.1016/j.landusepol.2019.104143Suche in Google Scholar
Zhang, K. H., & Shunfeng, S. O. N. G. (2003). Rural–urban migration and urbanization in China: Evidence from time-series and cross-section analyses. China Economic Review, 14(4), 386–400.10.1016/j.chieco.2003.09.018Suche in Google Scholar
Zhang, C., & Chen, P. (2021). Industrialization, urbanization, and carbon emission efficiency of Yangtze River Economic Belt—empirical analysis based on stochastic frontier model. Environmental Science and Pollution Research, 28, 66914–66929.10.1007/s11356-021-15309-zSuche in Google Scholar
Zhao, L., & Chen, W. (2018). Estimating urban green space production in the macroeconomy: From public goods to a profitable method of investment. Urban Forestry & Urban Greening, 33, 16–26.10.1016/j.ufug.2018.04.017Suche in Google Scholar
Zhao, P. (2011). Managing urban growth in a transforming China: Evidence from Beijing. Land Use Policy, 28(1), 96–109.10.1016/j.landusepol.2010.05.004Suche in Google Scholar
Zhao, Y., Wang, S., Ge, Y., Liu, Q., & Liu, X. (2017). The spatial differentiation of the coupling relationship between urbanization and the eco-environment in countries globally: A comprehensive assessment. Ecological Modelling, 360, 313–327.10.1016/j.ecolmodel.2017.07.009Suche in Google Scholar
Zhou, N., Price, L., Yande, D., Creyts, J., Khanna, N., Fridley, D., & Franconi, E. (2019a). A roadmap for China to peak carbon dioxide emissions and achieve a 20% share of non-fossil fuels in primary energy by 2030. Applied Energy, 239, 793–819.10.1016/j.apenergy.2019.01.154Suche in Google Scholar
Zhou, Z., Zhou, E., & Wang, J. (2019b, July). Coupling coordinated development of population, economy, society and space urbanization in Yangtze River economic belt. 2019 16th International Conference on Service Systems and Service Management (ICSSSM) (pp. 1–13). IEEE.10.1109/ICSSSM.2019.8887722Suche in Google Scholar
© 2024 the author(s), published by De Gruyter
This work is licensed under the Creative Commons Attribution 4.0 International License.
Artikel in diesem Heft
- Regular Articles
- Political Turnover and Public Health Provision in Brazilian Municipalities
- Examining the Effects of Trade Liberalisation Using a Gravity Model Approach
- Operating Efficiency in the Capital-Intensive Semiconductor Industry: A Nonparametric Frontier Approach
- Does Health Insurance Boost Subjective Well-being? Examining the Link in China through a National Survey
- An Intelligent Approach for Predicting Stock Market Movements in Emerging Markets Using Optimized Technical Indicators and Neural Networks
- Analysis of the Effect of Digital Financial Inclusion in Promoting Inclusive Growth: Mechanism and Statistical Verification
- Effective Tax Rates and Firm Size under Turnover Tax: Evidence from a Natural Experiment on SMEs
- Re-investigating the Impact of Economic Growth, Energy Consumption, Financial Development, Institutional Quality, and Globalization on Environmental Degradation in OECD Countries
- A Compliance Return Method to Evaluate Different Approaches to Implementing Regulations: The Example of Food Hygiene Standards
- Panel Technical Efficiency of Korean Companies in the Energy Sector based on Digital Capabilities
- Time-varying Investment Dynamics in the USA
- Preferences, Institutions, and Policy Makers: The Case of the New Institutionalization of Science, Technology, and Innovation Governance in Colombia
- The Impact of Geographic Factors on Credit Risk: A Study of Chinese Commercial Banks
- The Heterogeneous Effect and Transmission Paths of Air Pollution on Housing Prices: Evidence from 30 Large- and Medium-Sized Cities in China
- Analysis of Demographic Variables Affecting Digital Citizenship in Turkey
- Green Finance, Environmental Regulations, and Green Technologies in China: Implications for Achieving Green Economic Recovery
- Coupled and Coordinated Development of Economic Growth and Green Sustainability in a Manufacturing Enterprise under the Context of Dual Carbon Goals: Carbon Peaking and Carbon Neutrality
- Revealing the New Nexus in Urban Unemployment Dynamics: The Relationship between Institutional Variables and Long-Term Unemployment in Colombia
- The Roles of the Terms of Trade and the Real Exchange Rate in the Current Account Balance
- Cleaner Production: Analysis of the Role and Path of Green Finance in Controlling Agricultural Nonpoint Source Pollution
- The Research on the Impact of Regional Trade Network Relationships on Value Chain Resilience in China’s Service Industry
- Social Support and Suicidal Ideation among Children of Cross-Border Married Couples
- Asymmetrical Monetary Relations and Involuntary Unemployment in a General Equilibrium Model
- Job Crafting among Airport Security: The Role of Organizational Support, Work Engagement and Social Courage
- Does the Adjustment of Industrial Structure Restrain the Income Gap between Urban and Rural Areas
- Optimizing Emergency Logistics Centre Locations: A Multi-Objective Robust Model
- Geopolitical Risks and Stock Market Volatility in the SAARC Region
- Trade Globalization, Overseas Investment, and Tax Revenue Growth in Sub-Saharan Africa
- Can Government Expenditure Improve the Efficiency of Institutional Elderly-Care Service? – Take Wuhan as an Example
- Media Tone and Earnings Management before the Earnings Announcement: Evidence from China
- Review Articles
- Economic Growth in the Age of Ubiquitous Threats: How Global Risks are Reshaping Growth Theory
- Efficiency Measurement in Healthcare: The Foundations, Variables, and Models – A Narrative Literature Review
- Rethinking the Theoretical Foundation of Economics I: The Multilevel Paradigm
- Financial Literacy as Part of Empowerment Education for Later Life: A Spectrum of Perspectives, Challenges and Implications for Individuals, Educators and Policymakers in the Modern Digital Economy
- Special Issue: Economic Implications of Management and Entrepreneurship - Part II
- Ethnic Entrepreneurship: A Qualitative Study on Entrepreneurial Tendency of Meskhetian Turks Living in the USA in the Context of the Interactive Model
- Bridging Brand Parity with Insights Regarding Consumer Behavior
- The Effect of Green Human Resources Management Practices on Corporate Sustainability from the Perspective of Employees
- Special Issue: Shapes of Performance Evaluation in Economics and Management Decision - Part II
- High-Quality Development of Sports Competition Performance Industry in Chengdu-Chongqing Region Based on Performance Evaluation Theory
- Analysis of Multi-Factor Dynamic Coupling and Government Intervention Level for Urbanization in China: Evidence from the Yangtze River Economic Belt
- The Impact of Environmental Regulation on Technological Innovation of Enterprises: Based on Empirical Evidences of the Implementation of Pollution Charges in China
- Environmental Social Responsibility, Local Environmental Protection Strategy, and Corporate Financial Performance – Empirical Evidence from Heavy Pollution Industry
- The Relationship Between Stock Performance and Money Supply Based on VAR Model in the Context of E-commerce
- A Novel Approach for the Assessment of Logistics Performance Index of EU Countries
- The Decision Behaviour Evaluation of Interrelationships among Personality, Transformational Leadership, Leadership Self-Efficacy, and Commitment for E-Commerce Administrative Managers
- Role of Cultural Factors on Entrepreneurship Across the Diverse Economic Stages: Insights from GEM and GLOBE Data
- Performance Evaluation of Economic Relocation Effect for Environmental Non-Governmental Organizations: Evidence from China
- Functional Analysis of English Carriers and Related Resources of Cultural Communication in Internet Media
- The Influences of Multi-Level Environmental Regulations on Firm Performance in China
- Exploring the Ethnic Cultural Integration Path of Immigrant Communities Based on Ethnic Inter-Embedding
- Analysis of a New Model of Economic Growth in Renewable Energy for Green Computing
- An Empirical Examination of Aging’s Ramifications on Large-scale Agriculture: China’s Perspective
- The Impact of Firm Digital Transformation on Environmental, Social, and Governance Performance: Evidence from China
- Accounting Comparability and Labor Productivity: Evidence from China’s A-Share Listed Firms
- An Empirical Study on the Impact of Tariff Reduction on China’s Textile Industry under the Background of RCEP
- Top Executives’ Overseas Background on Corporate Green Innovation Output: The Mediating Role of Risk Preference
- Neutrosophic Inventory Management: A Cost-Effective Approach
- Mechanism Analysis and Response of Digital Financial Inclusion to Labor Economy based on ANN and Contribution Analysis
- Asset Pricing and Portfolio Investment Management Using Machine Learning: Research Trend Analysis Using Scientometrics
- User-centric Smart City Services for People with Disabilities and the Elderly: A UN SDG Framework Approach
- Research on the Problems and Institutional Optimization Strategies of Rural Collective Economic Organization Governance
- The Impact of the Global Minimum Tax Reform on China and Its Countermeasures
- Sustainable Development of Low-Carbon Supply Chain Economy based on the Internet of Things and Environmental Responsibility
- Measurement of Higher Education Competitiveness Level and Regional Disparities in China from the Perspective of Sustainable Development
- Payment Clearing and Regional Economy Development Based on Panel Data of Sichuan Province
- Coordinated Regional Economic Development: A Study of the Relationship Between Regional Policies and Business Performance
- A Novel Perspective on Prioritizing Investment Projects under Future Uncertainty: Integrating Robustness Analysis with the Net Present Value Model
- Research on Measurement of Manufacturing Industry Chain Resilience Based on Index Contribution Model Driven by Digital Economy
- Special Issue: AEEFI 2023
- Portfolio Allocation, Risk Aversion, and Digital Literacy Among the European Elderly
- Exploring the Heterogeneous Impact of Trade Agreements on Trade: Depth Matters
- Import, Productivity, and Export Performances
- Government Expenditure, Education, and Productivity in the European Union: Effects on Economic Growth
- Replication Study
- Carbon Taxes and CO2 Emissions: A Replication of Andersson (American Economic Journal: Economic Policy, 2019)