Political Turnover and Public Health Provision in Brazilian Municipalities
-
Jevuks Matheus de Araújo

 ,
Eduarda Machoski
und
Ana Karolina Acris Melo
,
Eduarda Machoski
und
Ana Karolina Acris Melo

Abstract
The objective of this work is to estimate the effects of political turnover on municipal health indicators. For this purpose, we used a regression discontinuity design applied to a pool of data on close municipal elections that occurred in 2008 and 2012. The outcome variables tested were municipal health indicators observed 1 and 3 years after the elections. We assume that the change of parties in the leadership of the municipal executive power alters the managers and public health policies and, therefore, affects the indicators of this sector. Our results indicate that health indicators linked to administrative issues appeared to benefit from political turnover in the period immediately after the elections (1 year). These results were corroborated by our additional estimates (robustness). We highlight that the number of health workers and coverage of primary care remained better 3 years after the elections in municipalities that suffered political turnover, indicating that this improvement resulting from the change in management may not be transient. Finally, through averaging tests, we found that in municipalities where the incumbent lost the election and there was a turnover, health managers were more qualified, and there was greater creation of basic health units.
1 Introduction
In Brazil, the public health service follows a decentralized organization. Although the federal government still accounts for most of the sector’s financing, there is an increasing participation by other federal entities. Data from the Ministry of Health for 2017 indicate that 11 of the 27 states surpass the Union in public health accounts. In fact, today, states and municipalities finance about 55% of the Health Unified System (Sistema Único de Saúde, SUS). Thus, governors and, mainly, mayors – all elected by the population – are important agents in the administration of resources destined for public health. In joint actions with health managers, they must ensure that national and state policies are met and, above all, that the needs of their constituency’s actions and services are addressed.
Lee et al. (2004) point out that competition for votes causes politicians to adopt the middle ground, worrying about the interest of the electorate but moderating and avoiding extreme policies. Within this theme, the incumbent’s advantage becomes a relevant object of study.[1] This advantage, according to Groseclose (2001), can explain the competition among the candidates, electoral cycles, and the candidates’ positions. Starting from Erikson (1971), much of the empirical literature highlights the intrinsic advantage of incumbent parties and candidates, derived from the possession of political office during election campaigns.
This relationship between political turnover and public service provision is an interesting object of study. As highlighted by McCabe et al. (2008), the change of title in the head of the municipal executive power can have significant implications, since each political agent has different preferences, skills, and experiences. According to the authors, turnover can affect the implementation and provision of public services, in addition to hindering long-term commitments and obligations, among other factors.
Brazilian municipalities are autonomous and decentralized, responsible for public provision of services considered basic, such as education, health, transport, and sanitation (including the management of public companies operating in these areas). This scenario favors the study of the relationship between political turnover and public service provision in the country’s municipalities.
More specifically, we will focus on the issue of public health. The quality of services offered by the municipalities directly affects the welfare of the population. And it is the responsibility of the mayors and their respective managers to decide what the priorities will be and how the public health budget will be applied during their management.
Thus, we question how political turnover affects public health provision in Brazilian municipalities. The purpose of this essay is to test the relationship between political turnover and health indicators in Brazilian municipalities. To do so, we will use regression discontinuity (sharp case) applied to close elections. Our sample comprises a pool of data on municipal elections that took place in 2008 and 2012 and health indicators verified for the periods after the elections. Our result variables pertain to the periods of 1 year (2009 and 2013) and 3 years (2011 and 2015) after the elections, which will be analyzed separately.
The strategy used makes it possible to compare municipalities that underwent party changes in the leadership of the municipal executive branch against those in which a party remained in power, whether by re-election of the mayor or the election of a successor to the incumbent. It is logical to argue that political parties act differently, since they represent different constituencies. Thus, if the electorate considers that the incumbent party does not do a good job, it will vote for an opponent that represents better prospects for the municipality. Thus, according to Alesina (1988), given the responsibility assumed by the electorate, in addition to winning the elections, the parties can care about the quality of the policies resulting from an election. Furthermore, in a scenario where the election was defined by a small margin of difference, it is intuitive to think that the electorate will be even more attentive to the performance of the elected candidate
The most recent literature on this subject has made use of experimental or quasi-experimental techniques to deal with possible methodological problems. The work of Ansolabehere et al. (2000), for example, studies US elections and finds evidence that in an electoral dispute, competing candidates tend to take positions that are more extreme than those of incumbents. Lee’s work (2008), first within this theme to make regression discontinuity, points to evidence that the incumbent political party has approximately a 40% greater chance of maintaining a seat in the US House of Representatives compared with challengers.
Still, within the political economy, the concept of close elections is another issue that has been extensively addressed in the recent period. The initial approach with Lee’s work (2008) and the author’s basic idea is that districts where Republicans and Democrats have won close victories are very similar to one another, except that one of the two won the previous election. In other words, given that the final result of the election is defined by an exogenous and random component, the intuition presented by the author is that in close elections, candidates who lose or win the contest can be compared on average.
Since then, studies have addressed the issue of close elections on various topics.[2] Vogl (2014), for example, examines race in US elections, using a sample of mayoral election data from 1965 to 2010. The results point to evidence that in close elections in cities in the south of the country, victories by black candidates are more likely than losses. In addition, black candidates are more likely to be re-elected. The work of Brollo and Troiano (2016) analyzes close municipal elections that took place in 2000 and 2004 in Brazil. Among other results, the authors find evidence that in power, women are less prone to corruption than men and that women are less likely to be re-elected.
Finally, it is interesting to highlight the work of Akhtari et al. (2022). The authors study how political turnover in Brazilian municipalities affects the public provision of education. For that, they use regression discontinuity applied in close elections. The results indicate that municipalities with new parties in power score lower on school tests, suggesting that political turnover affects the quality of public services offered by this sector.
First, our results indicate that in the period immediately after the elections, political turnover benefits health indicators related to administrative issues (number of SUS workers, visits made by the Family Health Program (Programa Saúde da Família, PSF) coverage of primary care and cervical exams performed). In other words, such indicators are better in municipalities where the incumbent party lost the election and another party took power. We tested the persistence of these effects, and in this case, only the variable referring to the number of SUS workers remained significant, indicating that the effect of the new management on it is not lost during the mandate of the new incumbent party. To test the robustness of our evidence, three other estimates derived from our main model were made and our evidence was corroborated. However, 3 years after the elections, the coverage of primary care was significant, indicating that the improvement in this variable may not be transient. Finally, the study of possible channels of transmission of these beneficial effects showed us that on average, municipalities that underwent Political turnover had more qualified municipal SUS managers (appointed by mayors). In addition, in those municipalities where there was a change of party in power, more basic health units (primary attention) were created during the new administration.
This article is structured as follows, in addition to the Introduction: Section 2 presents a brief contextualization of the municipal political situation and public health management in the country. In Section 3, the materials and methods used in our empirical exercise are presented; Section 4 presents the results found; and the last section, Section 5, presents the final considerations that we can make from our efforts.
2 Brazilian Contexts
2.1 Municipal Political Scenery
Brazil is a federative democratic republic, characterized by having a multiparty system. Its territory is divided into 26 states and a federal district. The 5,570 municipalities, belonging to the states, form the local layer of public administration in the country. This local layer is the closest to the citizens, being made up of mayors and councilors. The mayors, heads of the municipal executive branch, are elected every 4 years in a direct democratic manner. In these elections, the councilors of each administration are also elected, forming the legislative body of the municipality.
In municipalities with a population below 200,000 inhabitants, mayors are elected according to the majority rule (absolute majority of votes), while municipalities with a population above this threshold follow the rule of the plurality of votes, and victory may occur in the second round of an election if no candidate achieves victory in the first round. Mayors are elected to 4-year terms, and since 1998, their terms may extend for four more years through re-election.[3]
2.2 Municipal Public Health Provision and Management
Created from the 1988 Constitution, the SUS is based on three basic principles: universality, integrality, and equity. It was conceived following a hierarchical and decentralized organization, in which the primary health care is destined to the municipalities and the most complex procedures are responsibilities of the states and the federal government. The 1988 Constitution therefore established organizational guidelines for the SUS, which have implications for decisions and implementations of public health policies. Among these guidelines, one aspect is extremely important for the functioning of the public health system: the definition of the role and attributions of SUS managers.
As the Ministry of Health points out (2019), it is up to the three spheres of government to jointly define mechanisms for the evaluation and control of health services, as well as to manage and apply budgetary and financial resources, to develop short and medium-term policies, and to promote their articulation, among other functions.
In this sense, Machado et al. (2011) emphasize that in the three spheres of government, decisions about health policies involve a large number of services and people. At the municipal level, health secretariats (or equivalent bodies) are administered by SUS managers – a term used to refer to the minister and state and municipal health secretaries. In other words, the SUS manager is the health authority in each sphere of government. The position has a very important political meaning, since each manager is appointed by the head of the executive branch.
In addition, according to Machado et al. (2011), the main duties of the SUS manager can be divided into four categories: formulation of public policies; financing; regulation, coordination, control, and evaluation; and direct execution of services. At the municipal level, it is important to note that it is up to the SUS manager to identify the problems and define the municipality’s priorities and carry out the planning of necessary actions for public health. It is also the responsibility of the municipal SUS manager to ensure the application of resources and make investments, and to articulate with other municipalities, guarantee the direct provision of assistance services, manage the basic health units and, consequently, evaluate the results of adopted municipal policies.
2.3 The Link Between Incumbent Performance and the Party Brand
Political parties play a crucial role in the establishment of stable democratic administrations. Their primary function is to gather and consolidate the diverse preferences of individuals, thereby decreasing the informational burdens on voters and facilitating the organization of legislative bodies (Heller & Mershon, 2009). Desposato (2006) asserts that while political parties are essential for a functioning democracy, they also serve the interests of politicians by offering mobilization efforts, financial support for campaigns, and a recognizable political identity upon which they can depend.
Concurrently, a substantial body of academic literature on distributive politics indicates that political parties derive national advantages from their local office control, and conversely, experience disadvantages when they lack such control. Emerging research indicates that the presence of local incumbent contributes to enhancing the perception of their affiliated parties in terms of governance matters (Holland, 2016; Lucardi, 2016). However, it is important to note that this notion is predicated upon one underlying assumption.
The underlying premise posits that the combined influence of party labels and the performance of incumbents shapes the effects of incumbency. However, in contexts where particularism and weak party discipline are prevalent, there is limited expectation for citizens or politicians to establish associations among co-partisans across different tiers of government (Rodden & Wibbels, 2011). In instances where party labels hold significant sway, a favorable performance at the national level is expected to bolster electoral support for co-partisan candidates in local elections. Conversely, when party labels lack strength, voters do not establish connections between local and national politicians, resulting in office control having no discernible impact, either positive or negative, on the vote shares of other candidates running under the same party label.[4]
Looking at the Brazilian case, the nature of the country’s party system has been hotly debated by comparativists. Previously, parties were commonly described as feeble, centered around individual personalities, and primarily driven by practices of patronage and pork-barrel politics (Desposato, 2006; Samuels, 1999). However, this negative perspective has been convincingly challenged by recent studies that highlight signs of party consolidation in areas such as legislative decision-making within the Congress (Figueiredo & Limongi, 2000), and the shaping of voters’ attitudes on national matters (Samuels & Zucco, 2014).
Despite suggestive indications of party system institutionalization at the national and state levels, there is currently no evidence to suggest that this hypothetical trend extends to the realm of municipal politics. This is further emphasized by the frailty of local political parties. Mayors often run personalistic campaigns (Novaes, 2014), and local coalitions are large and ideologically diverse, diminishing the impact of national party reputations in municipal elections (Lavareda & Telles, 2015).
Such findings can be confirmed by examining our data on the results of the 2008 and 2012 municipal elections. During our analysis period, the incumbent national party from 2003 to 2016 was the Workers’ Party (PT). The strength of the PT’s party label is well-established in the literature, as the party has a coherent program of social change, a disciplined membership (both in Congress and at the local level), deep roots in civil society (Hunter, 2010), and is the only party in Brazil with a large supporter base, as shown by Samuels and Zucco (2014).
However, the results of the 2008 and 2012 municipal elections do not reveal a partisan dominance between national and subnational governments. In 2008, despite the PT being the titular national party, 21% of the elected mayors were affiliated with the PMDB (Brazilian Democratic Movement Party), 14% with the PSDB (Brazilian Party for Social Democracy), and only 10% with the PT. Restricting the sample to only close races, the results seem similar, with 21% of the winning mayors being affiliated with the PMDB, 16.8% with the PSDB, and 11.5% with the PT. In the 2012 municipal elections, these results were maintained, as 18.6% of the elected mayors were affiliated with the PMDB, 12% with the PSDB, and only 11.8% with the PT. In the close elections of the same year, 23.8% of the winning mayors were affiliated with the PMDB, 10% with the PSDB, and only 12.9% with the PT. It is worth noting that in the 2012 elections, the PT was already in its third term as the titular national party.
Lee et al. (2004), Erikson (1971), and Groseclose (2001) highlight the inherent advantage enjoyed by incumbent parties and candidates. Novaes and Schiumerini (2022) reveal that the advantage or disadvantage of incumbency for Brazilian mayors depends on several factors, including differences in access to fiscal resources that systematically shape the performance of incumbents. Conversely, our data from the 2008 and 2012 municipal elections do not demonstrate a clear predominance of re-election or political turnover. For instance, in the closely contested 2008 elections, the re-election rate stood at 56% (while the turnover rate was 44%). Similarly, in the 2012 elections, the re-election rate was 48% (with a turnover rate of 52% that year). Given the small margin of difference between these results, it is not possible to ascertain whether there was a prevailing pattern of re-election or political rotation in the municipal elections.
3 Materials and Methods
3.1 Election Data
In this work, we used data from municipal elections that took place in 2004,[5] 2008, and 2012, obtained through the Superior Electoral Court (Tribunal Superior Eleitoral, TSE). With these, it was possible to calculate the incumbent’s voting margin for the years 2008 and 2012, defined for each year as the share of votes received by the incumbent party minus the share of votes received by its strongest opponent. Like Lee (2008), we consider only the cases in which the incumbent was the most voted or second, since candidates outside these positions generally obtain a small portion of the votes.
From this, it was possible to build our running variable of the regression discontinuity model – the incumbent’s narrow margin of votes. Here, we consider an election with a narrow margin one in which the incumbent almost lost or almost won the election with a margin of less than 5% or, in absolute terms, 10%. The idea is that in competitive elections, the result of winner or loser is random, as the candidates are similar.
3.2 Municipal Health Indicators
The data referring to municipal health indicators were obtained through the SUS Department of Informatics (DATASUS), for the years after the 2008 and 2012 municipal elections. More specifically, we used data from the indicators for the years 2009 and 2011 and for 2013 and 2015 (1 and 3 years after the election of 2008 and 2012). Table 1 shows the indicators that will be tested in this work, as well as their respective definitions.
Definition of the health indicators used
| Health indicator | Definition |
|---|---|
| Cytopathological examinations of the cervix | Number of cervical cytopathological exams performed on women aged 25–64 years, by place of residence and year of care |
| Immunization coverage rate | Number of doses applied on children under 1-year old, divided by the target population and multiplied by 100, by place of residence and year of application |
| Child mortality rate | Number of deaths of residents under 1 year of age regarding the total number of live births to resident mothers, in the year considered |
| SUS workers | Workers who attend SUS, in the public sphere, with protected bonds, in a specific municipality, in the year considered. Ratio per thousand inhabitants |
| Visits made by the Family Health Program | Home visits made by community health agents, referring to the Family Health Program, in a specific location, in each municipality. Ratio per thousand inhabitants |
| Primary Health Care Coverage Rate | Population coverage rate of family health teams and Primary Care teams used for the monitoring access to Primary Care services, in a specific municipality, in the year considered |
| Health Index | Focuses on basic health and includes indicators whose control is the responsibility of the municipality: proportion of adequate prenatal care, deaths due to ill-defined causes, infant deaths due to preventable causes, and hospitalizations sensitive to primary care |
| SUS workers in relation to the number of basic health units | Workers who attend SUS, in the public sphere, with protected bonds, in a specific municipality, in the year considered. Ratio per number of basic municipal health units |
Source: DATASUS.
3.3 Municipal Characteristics
Finally, the data used to form our covariate vector were obtained through the National Treasury Secretariat. We decided to use only budgetary variables – tax revenue per capita and expenditure per capita on health – since these are directly linked to the execution and provision of public services. Furthermore, as Ferraz and Finan (2011) point out, the use of such variables controls possible differences among the municipalities’ budgets.
3.4 The Regression Discontinuity Design
The work of Thistlethwaite and Campbell (1960) introduced the idea of the method that we now know as regression discontinuous design (RDD). As Imbens and Lemieux (2008) point out, the basic idea behind the RDD is that whether an individual is treated or not is determined totally, or partly, by the value of a covariate, which is on both sides of a fixed limit. The covariate may be associated with potential results, but this association is supposed to be mild. Thus, any discontinuity of the result due to the covariate is interpreted as evidence of a causal effect of the treatment.
Lee (2008) points out that for an RDD in the sharp case, it is necessary to assume two hypotheses. The first hypothesis concerns continuity: The conditional regression functions of the results of treatment and control in X i must be continuous. Formally:
where Y i (0) and Y i (1) are the potential results and X is the so-called running variable, a covariate that indicates whether the individual will receive treatment or not.
Imbens and Lemieux (2008) point out that this condition assumes that the conditional distribution function is smooth in the covariate and can be called the conditional distribution function. Let F y be the conditional distribution function of Y (t) , given X, where T indicates the treatment. The general version of the hypothesis therefore becomes
are continuous at x for all y.
The continuity hypothesis makes it clear, according to Lee (2008), that the credibility of impact estimates via RDD depends on whether the average result of individuals just below the cutoff point identifies the true counterfactual for those individuals who are just above the discontinuity. In other words, it is the continuity hypothesis that guarantees that we are identifying the causal effect of a treatment.
The second important hypothesis to be assumed is that of local ignorability. If around the point X i = c the condition of being treated or has not been defined at random, we have local ignorability. Formally:
According to Imbens and Lemieux (2008), this assumption is trivial because, depending on the covariables, there is no change in treatment. In other words, an individual cannot manipulate a covariate in order to be treated or not.
Under the two hypotheses presented earlier, the only explanation for the discontinuity in Y i in c is that an individual has received treatment, so that we can interpret the jump of T i at point c as the causal effect of the treatment. Thus, according to Hahn et al. (2001) and Angrist and Pischke (2009), we have T + = 1 and T − = 0, and the average local treatment effect can be expressed by
That is, the causal effect of the treatment is given by the difference in results between individuals who are located above the cutoff point and below this point.
3.5 Empirical Strategy
We want to examine whether the fact that a municipality has experienced party turnover has any effect on the health indicators of these municipalities. Following on the work of Akhtari et al. (2022), we will make a comparison between municipalities in which the incumbent party almost lost the election – and, therefore, remained in power – and municipalities in which the incumbent party was almost re-elected – and, in this way, there was party rotation in the municipal leadership. For that, we will make use of a sharp RDD.
To work with the concept of “almost lost” or “almost re-elected,” we will use a variable referring to the incumbent’s narrow margin of votes. The incumbent’s voting margin refers to the portion of votes that the incumbent party received in a given election, considering the total useful votes received in its respective municipality. By restricting this margin to a limit of [−5%; 5%], we have what we call a narrow margin.[6]
Furthermore, it is important to highlight that as Lee’s (2008) study, we will work only with municipalities where the incumbent party finished first or second in the election, since the share of votes received by third or other places tends not to be significant.
Following Imbens and Lemieux (2008), Brollo and Troiano (2016), and Akhtari et al. (2022), we will work with a linear regression specification, which is restricted to municipalities that are in the range of vote margins specified.
Thus, our specification can be expressed as follows:
where Y m,t+1 are the outcome variables (health indicators) of municipality m, measured 1 year after the elections (we are working with a pool of data from the 2008 and 2012 elections (period t), so that the period t + 1 corresponds to the data pool for the years 2009 and 2013). The result variable Y m,t+1, in this case, represents the local average effects (LATE) at the cutoff point c = 0. Our running variable is the incumbent’s margin of votes whereas our treatment variable is the incumbent’s margin of votes less than 0, which indicates that the incumbent lost his attempt at re-election and, therefore, the municipality underwent Political turnover. In addition, standard errors are grouped at the municipal level. In order to verify whether the possible effects of political turnover on municipal indicators are transient or permanent, we will estimate the same model above but consider the 3 years after the elections. In this case, our result variables will be given by Y m,t+3 (corresponding to the data pool for the years 2011 and 2015).
The intuition of our empirical strategy is that municipalities in which the incumbent party lost the election by a narrow margin of votes form a good counterfactual for municipalities in which the incumbent party remained in power (won the election with an advantage of at most 5%). Therefore, according to Lee (2008) and Brollo and Troiano (2016), the assumption stems from the fact that in close races, the result is defined by random factors, so that the incumbent’s probabilities of being re-elected or losing the election are the same.
Thus, through our empirical efforts, it will be possible to discover whether Political turnover (which occurs when the incumbent party loses the election and another party takes over the municipal leadership) has an effect on municipal health indicators and whether this effect is beneficial or deteriorates public health management in the municipalities.
4 Results
4.1 Descriptive analysis of the data
In the years 2008–2012, Brazil had 5,565 municipalities in its territory. Of these, we excluded the municipalities in which there was a possibility of a second round of elections (i.e., with a population of 200,000 or more) or went through supplementary elections, the municipalities went through supplementary elections, or both. Thereafter, for each year, we restricted our sample to the municipalities in which the incumbent party was trying to remain in power and finished first or second in its respective elections.
As a result, our sample was reduced to 2,820 municipalities for 2008 and 2,675 for 2012, totaling 5,495 municipalities in the total of our sample. The left part of Figure 1 presents the histogram of the incumbent’s vote margin constructed from the steps mentioned previously.
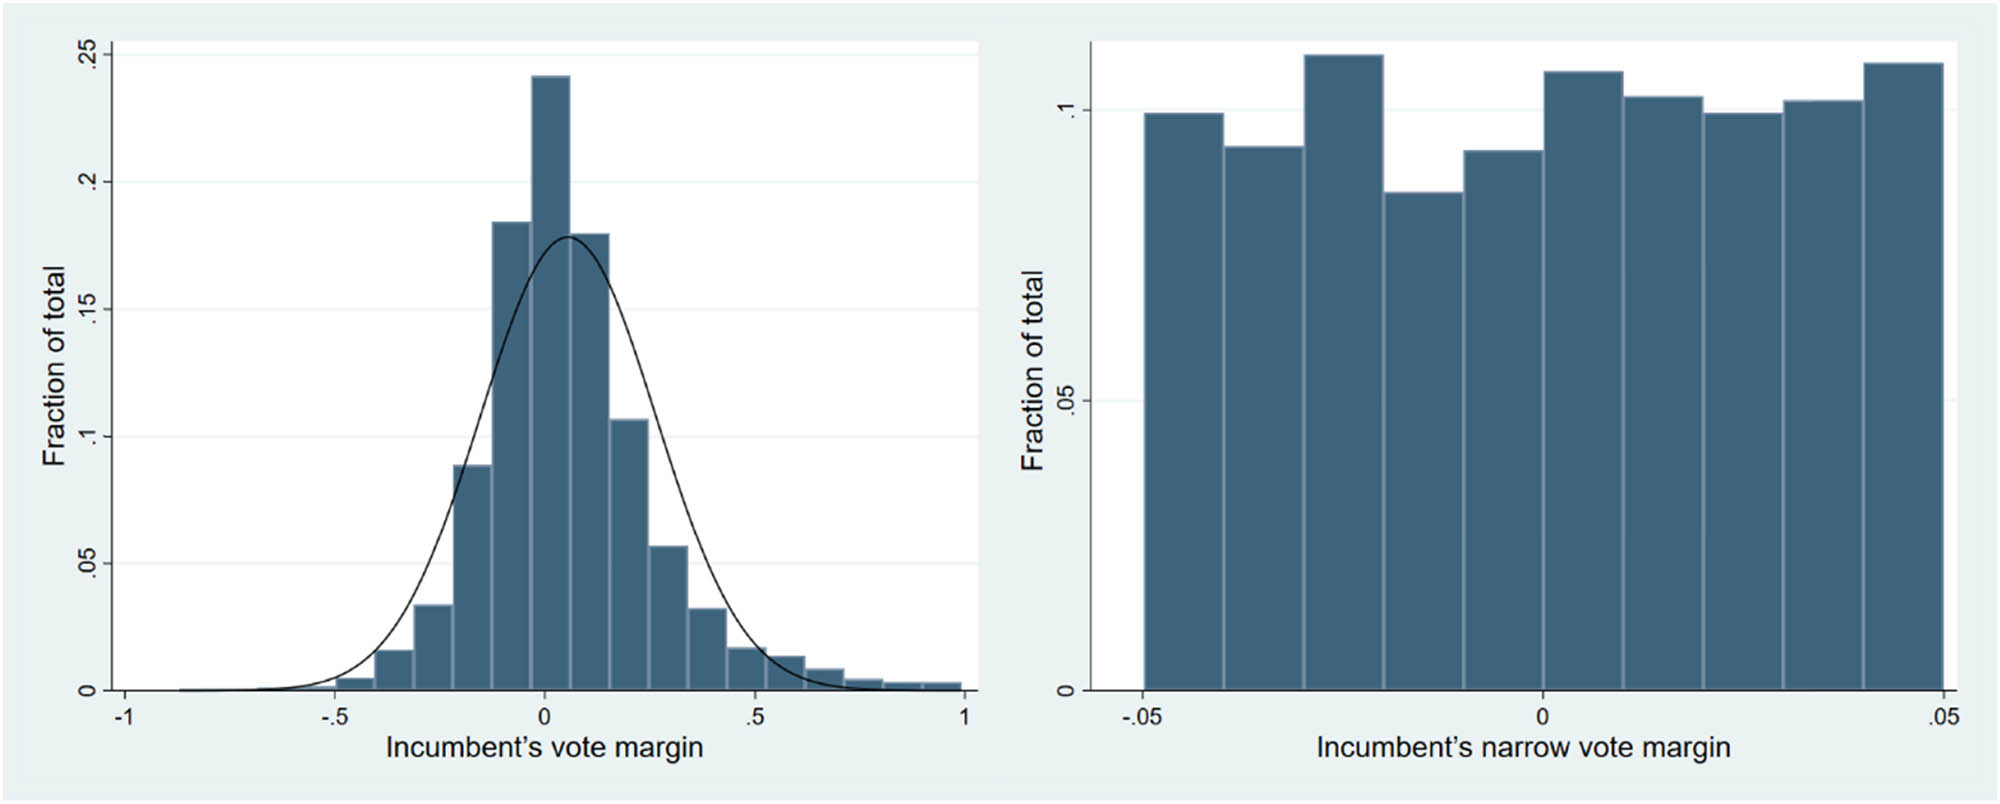
Incumbent’s vote margin and incumbent’s narrow vote margin – Histogram – 2008 and 2012. Source: TSE, data worked by the research.
Municipalities that are left to zero in the histogram are those in which the incumbent party lost the election (in 2008 or 2012), and there was Political turnover. The right side of the histogram represents the municipalities in which the incumbent party remained in power. Figure 1 shows that the distribution of the incumbent’s voting margin seems normally close to zero, indicating symmetry between the two sides of the distribution.
When we consider only the incumbent’s narrow vote margin, in which the party won or lost with a margin of no more than 5%, our sample is reduced to 686 municipalities in 2008 and 711 municipalities in 2012, totaling 1,397 municipalities. The right part of Figure 1 shows the histogram of this sample section.
Continuing, Table 2 presents descriptive statistics of the two groups of municipalities with which we deal.
Descriptive statistics for municipalities (2010) Averages
| Political turnover | No political turnover | |
|---|---|---|
| Incumbent’s vote margin | −0.0252 | 0.0251 |
| Electorate (number) | 13,239 | 12,323 |
| Per-capita income | R$ 510.36 | R$ 509.89 |
| Urban population | 64% | 62% |
| Illiteracy rate – 18 years and over | 17% | 16% |
| Activity rate – 18 years or older | 64% | 64% |
| Dependency ratio | 0.50 | 0.51 |
| Aging rate | 8.74 | 8.79 |
| Gini Index | 0.49 | 0.49 |
| N | 672 | 725 |
Source: IPEADATA.
Table 2 shows that within our sample, the municipalities that suffered Political turnover and those that kept the parties in power were quite similar to each other.
Finally, we performed the test by Cattaneo et al. (2018) for our discontinuity, in order to check if there is manipulation in our running variable. The results are shown in Table 3.
Test of manipulation around discontinuity – Incumbent’s narrow vote margin – 2008 and 2012
| Running variable: narrow_margin | ||
|---|---|---|
| Method | T | P > |T| |
| Conventional | 0.7565 | 0.4493 |
| Robust | 0.5374 | 0.5910 |
Source: Data worked by the research.
The results show that there is no evidence of manipulation in our variable, since the values found for the t-statistic lead us not to reject the null hypothesis of non-manipulation. Figure A1, in the Appendix, shows this result graphically.[7] From that result, we proceed to our main objective.
4.2 Political Turnover and Health Outcomes
Next, we present graphically the results of the regression discontinuity estimations carried out in order to verify how political turnover affects the provision of public health in the municipalities. Therefore, we estimated equation (1) using the incumbent’s narrow vote margin as the model’s running variable. The graphs that compose the figures presented below were generated using the uniform selection method of bins. The results can also be seen in Tables A2 and A3, in the Appendix.[8]
In each figure,[9] presented from this point on, the right side (incumbent’s narrow vote margin <0) refers to the municipalities in which the incumbent was almost re-elected – and there was political turnover – while the left side represents the municipalities in which the party almost lost but remained in power.
First, Figure 2 presents the results for SUS workers, visits from the PSF, and coverage of primary care for the period immediately after the elections (t + 1) and, in a measure of the persistence of the effects, for the period of 3 years after the elections (t + 3). When we analyzed 1 year after the elections (left column), the three variables were found to be significant and minor in municipalities where the incumbent party almost lost and, thus, there was no Political turnover. In other words, the change of party in municipal power has a positive effect on such variables. Thus, when compared with municipalities where the incumbent remained in power, municipalities with a new ruling party had more SUS workers, more PSF visits were made and the coverage of primary care was greater 1 year after the elections.

Political turnover (2008 and 2012) and municipal health indicators: 1 (2009 and 2013) and 3 years after the elections (2011 and 2015) – Part 1. Source: DATASUS and TSE, data worked by the research. Note: Sample average within the bin. Kernel: Triangular. Polynomial fit of order 1.
However, when we analyze 3 years after the elections (right column), the significant result is not maintained for two of the three variables, so that only the number of SUS workers per thousand inhabitants remains significant.[10] Three years after the elections, the results for the visits made by the PSF and the coverage of primary care indicate that there is no significant difference between municipalities that underwent political turnover and those that did not. We have indications, therefore, that the improvement in some indicators is transient, since the result was verified only in the year in which the political change took place.
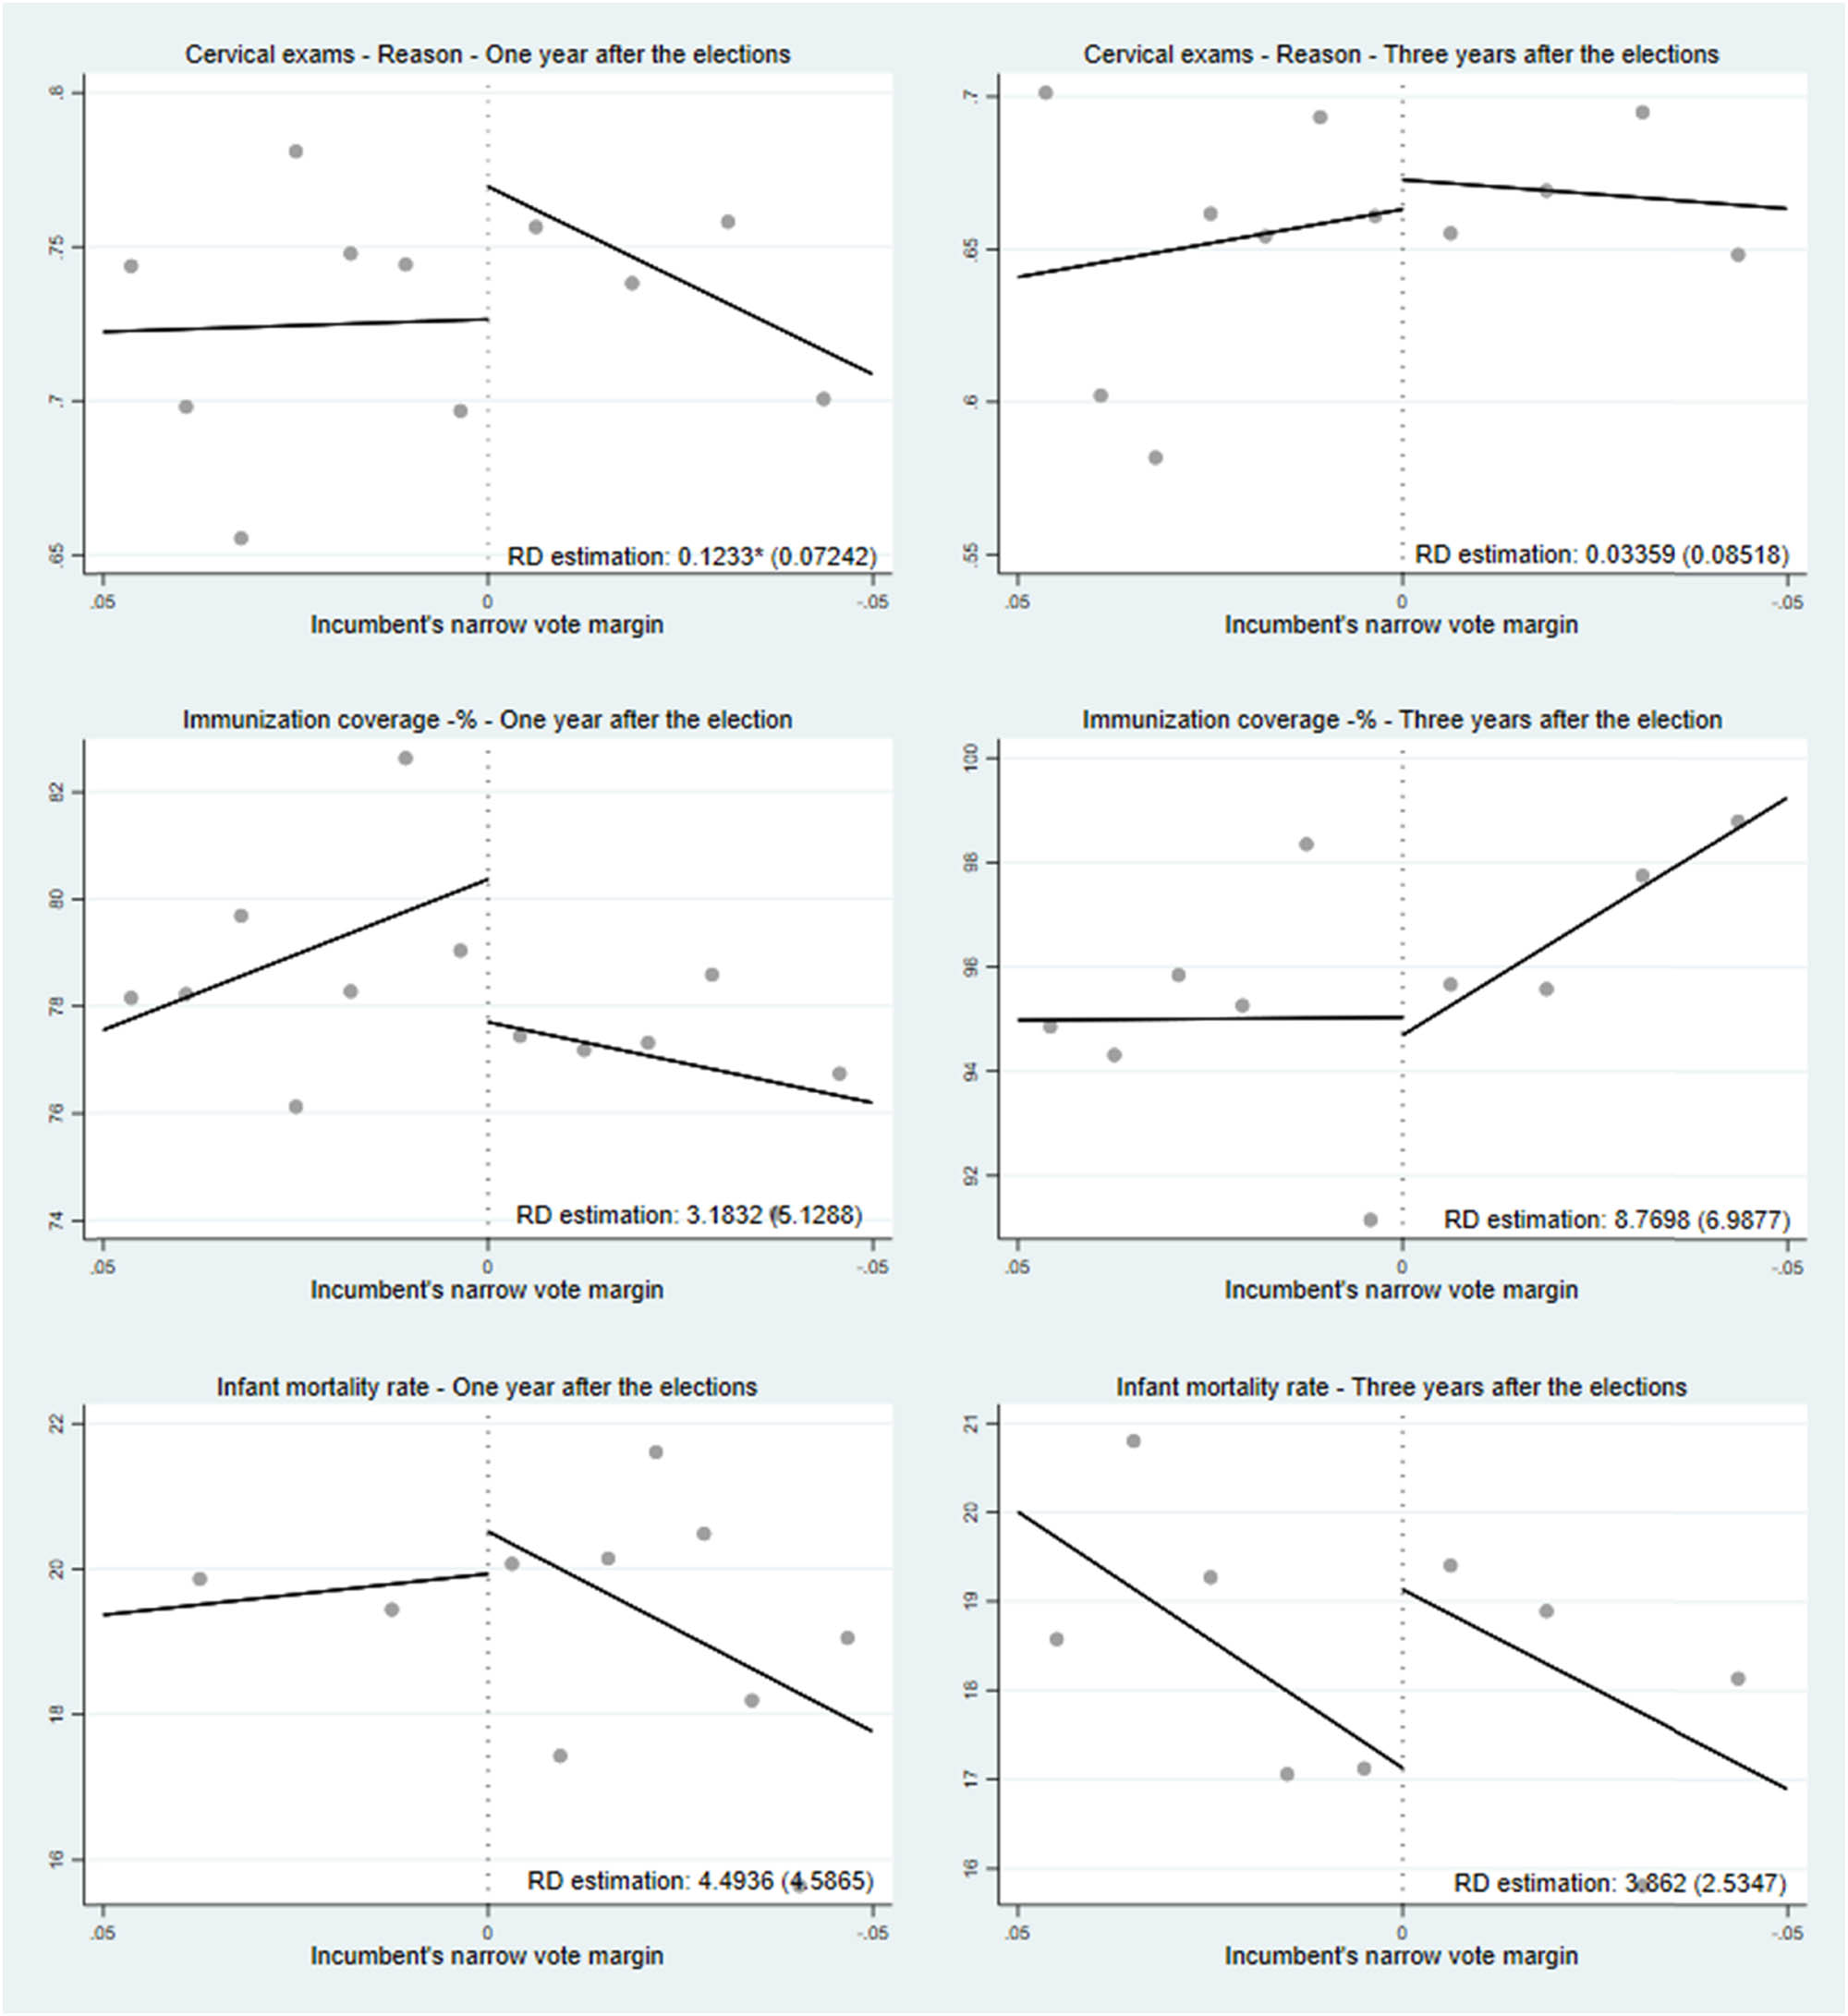
Proceeding, Figure 3 shows the results for the ratio of cervical exams performed, immunization coverage, and infant mortality rate. For 1 year after the elections, only the variable referring to cervical exams performed is significant, indicating, once again, that in municipalities where there was no political turnover, this indicator was lower. For rates of immunization coverage and infant mortality, the results are not significant. For 3 years after the elections, none of these variables shows statistical significance.
Political turnover (2008 and 2012) and municipal health indicators: 1 (2009 and 2013) and 3 years after the elections (2011 and 2015) – Part 2. Source: DATASUS and TSE, data worked by the research. Note: Sample average within bin. Kernel: Triangular. Polynomial fit of order 1.
Through these results presented, it is possible to perceive a different behavior for the tested response variables. The indicators shown in Figure 2 reflect administrative variables, related to the configuration and functioning of SUS activities. In these indicators, the role of the SUS municipal manager is a protagonist.
As noted earlier, we obtained significant results for the number of SUS workers, the visits made by the PSF, and the coverage of primary care, indicating that 1 year after the elections, municipalities where there was a political turnover present such higher indicators.
We have also said that the position of SUS manager is appointed by the head of the municipal power. Thus, the change of party in power is related to the change of the municipal health manager. Our results indicate that the change in the municipal chief of power seems to benefit the health administration, but that these benefits do not seem to last after the year of the change. That is, the adoption of new strategies and the realization of new actions in the health sector – given the entry of a new party in the municipal power – are effective, but only in the current period when political change is taking place.
The indicators presented in Figure 3 reflect health variables that can be considered structural. Although the performance of cervical exams[11] and the rate of immunization coverage directly depend on the management and SUS workers, they also depend on the interest of the service users. The infant mortality rate, in turn, depends on factors such as assistance to pregnant women, instruction and education policies, and adequate sanitation conditions. The results for immunization coverage and the infant mortality rate are not significant in the analyzed periods – 1 and 3 years after the elections. The lack of effect of political change on such indicators reflects the difficulty in reaching structural public health factors in the short term.
Our positive results found for the administrative variables can be related to the practice known as the report of the 100 days.[12] It is common that on the hundredth day of government, mayors publish reports on the strategies to be followed in their mandates, dictating the pace of the government in the next 4 years, in addition to publishing the first balance sheets on their management. Therefore, the first year of management is a milestone for mayors, as it is an opportunity for them to demonstrate their management skills to the population. The improvement seen in the administrative variables can be explained by the need to adopt practices that, simultaneously, improve the government’s management indicators. This creates an illusion of greater administrative competence for the electorate. Furthermore, the idea of transient competence shocks is also explained by the more competitive political environment (close elections) that amplifies political pressure on the government.
Despite the lack of impacts on individual indicators (Figure 3), turnover can have indirect effects that are not reflected in individual indicators. Additionally, in Figure 4, we observe the effects of political turnover on composite indicators. The first is a Health Index that measures the quality of municipal health services estimated by the Rio de Janeiro Industries Federation (FIRJAN), and the second is a participation rate of SUS workers in relation to the number of basic health units. The health index “focuses on basic health and includes indicators whose control is the responsibility of the municipality: proportion of adequate prenatal care, deaths from ill-defined causes, infant deaths from preventable causes and hospitalizations sensitive to basic care” (Firjan, 2018). The number of workers per health unit tries to capture the capacity of municipal health care.

Political turnover (2008 and 2012) and municipal health indicators: 1 (2009 and 2013) and 3 years after the elections (2011 and 2015) – Part 2. Source: DATASUS and TSE, data worked by the research. Note: Sample average within bin. Kernel: Triangular. Polynomial fit of order 1.
We observe that the effects of political turnover on both indicators are positive and persistent. These results show that political turnover can improve the quality of municipal health services. The number of SUS workers per health unit is directly associated with the accessibility dimension of municipal health services. A larger number of professionals attending health units suggest a more collaborative approach and greater care in providing health services. The health index is multidimensional and captures complex interactions of municipal public health interventions. It allows for a more subtle evaluation of policy effects, considering the multifaceted nature of public health challenges.
4.3 Robustness and Sensitivity
To test the validity of our evidence, we estimated the same Equation 1 using two other estimation methods, in addition to the conventional one shown previously. Presented by Calonico et al. (2014), these two other methods are characterized by correcting the bias and robustness of the estimator. In addition, we also estimated equation (1) by including the covariates shown in Table 8 and changing the polynomial specification of the model. Tables 4 and 6 show the results for the outcome variables 1 year after the elections, and Tables 5 and 7 show the results for 3 years after.
In the context of Tables 4–7, we have three different methods and three different specifications for each of the outcome variables. In lines (a), (b), and (c), we have the methods “Conventional,” “Bias-corrected,” and “Robust.” In columns (1), (2), and (3), we have the specifications without covariates and polynomial of order 1, with covariates and polynomial of order 1, without covariates and polynomial of order 2, respectively.
Political turnover (2008 and 2012) and health indicators 1 year after the elections (2009 and 2013) – Robustness
| Result variables 1 year after the elections – 2009 and 2013 | |||||||||
|---|---|---|---|---|---|---|---|---|---|
| SUS workers | PSF visits | Primary care coverage | |||||||
| (1) | (2) | (3) | (1) | (2) | (3) | (1) | (2) | (3) | |
| (a) Incumbent’s Margin of Votes <0 | 0.6238 | 1.7860* | 28.3870 | 72.7780** | 7.9840* | 12.8750** | |||
| Conventional | (0.7571) | (0.92611) | (18.4240) | (28.838) | (4.33835) | (5.4206) | |||
| (b) Incumbent’s Margin of Votes <0 | 1.6657** | 0.7895 | 1.9219** | 40.8560** | 35.1790* | 82.2670*** | 106620*** | 9.5805** | 14.2560*** |
| Bias Correction | (0.7506) | (0.7571) | (0.9261) | (18.4550) | (18.4240) | (28.8380) | (4.1163) | (4.3383) | (5.4206) |
| (c) Incumbent’s Margin of Votes <0 | 1.6657* | 0.7895 | 1.9219* | 40.8560* | 35.179* | 82.267*** | 10.662** | 9.5805* | 14.2560** |
| Robust | (0.8810) | (0.9095) | (1.0501) | (21.3940) | (21.273) | (31.85) | (4.77425) | (5.0674) | (6.0155) |
| Order (p) | 1 | 1 | 2 | 1 | 1 | 2 | 1 | 1 | 2 |
| Polynomial Local BW (h) | 0.013 | 0.012 | 0.019 | 0.013 | 0.013 | 0.013 | 0.014 | 0.014 | 0.017 |
| Order bias (b) | 0.021 | 0.019 | 0.027 | 0.024 | 0.022 | 0.022 | 0.027 | 0.024 | 0.025 |
| N | 1,397 | 1,276 | 1,397 | 1,260 | 1,150 | 1,260 | 1,397 | 1,276 | 1,397 |
| Covariates | No | Yes | No | No | Yes | No | No | Yes | No |
| Cervical exams | Immunization coverage | Child mortality rate | |||||||
|---|---|---|---|---|---|---|---|---|---|
| (1) | (2) | (3) | (1) | (2) | (3) | (1) | (2) | (3) | |
| (a) Incumbent’s Margin of Votes <0 | 0.0899 | 0.1453 | 1.2964 | 6.5611 | 2.6306 | 5.3407 | |||
| Conventional | (0.0705) | (0.1083) | (4.7638) | (5.9714) | (4.3259) | (5.1540) | |||
| (b) Incumbent’s Margin of Votes <0 | 0.1382** | 0.0969 | 0.1417 | 5.2066 | 2.9770 | 8.3259 | 5.6675 | 3.4106 | 6.6348 |
| Bias Correction | (0.0724) | (0.0705) | (0.1083) | (5.1880) | (4.7638) | (5.9714) | (4.5865) | (4.3259) | (5.1540) |
| (c) Incumbent’s Margin of Votes <0 | 0.1382 | 0.0969 | 0.1417 | 5.2066 | 2.9770 | 8.3259 | 5.6675 | 3.4106 | 6.6348 |
| Robust | (0.0869) | (0.0853) | (0.1263) | (5.9006) | (5.5596) | (6.6862) | (5.5453) | (5.2287) | (5.8385) |
| Order (p) | 1 | 1 | 2 | 1 | 1 | 2 | 1 | 1 | 2 |
| Polynomial Local BW (h) | 0.018 | 0.019 | 0.020 | 0.010 | 0.013 | 0.016 | 0.012 | 0.012 | 0.021 |
| Order bias (b) | 0.029 | 0.030 | 0.027 | 0.019 | 0.022 | 0.024 | 0.019 | 0.020 | 0.029 |
| N | 1,397 | 1,276 | 1,397 | 1,397 | 1,276 | 1,397 | 1,017 | 928 | 1,017 |
| Covariates | No | Yes | No | No | Yes | No | No | Yes | No |
Source: Data worked by the research.
Note: * = p < 0.1; ** = p < 0.05; *** = p < 0.01. The columns refer to the estimates made by the method of Regression Discontinuity and the values in parentheses refer to the standard errors. The sample is restricted to the incumbent’s narrow margin of votes ([−5%; +5%]).
Political turnover (2008 and 2012) and health indicators 3 years after the elections (2011 and 2015) – Robustness
| Result variables 3 years after the elections 2011 and 2015 | |||||||||
|---|---|---|---|---|---|---|---|---|---|
| SUS workers | PSF visits | Primary care coverage | |||||||
| (1) | (2) | (3) | (1) | (2) | (3) | (1) | (2) | (3) | |
| (a) Incumbent’s Margin of Votes <0 | 0.2396 | 1.2839 | 15.6950 | 33.7570 | 4.3845 | 13.1500** | |||
| Conventional | (0.6738) | (0.8311) | (20.6020) | (26.7340) | (3.7750) | (5.6339) | |||
| (b) Incumbent’s Margin of Votes <0 | 1.3432** | 0.3093 | 1.4075* | 32.3000 | 16.5280 | 36.8430 | 5.7866* | 5.2419 | 15.1220*** |
| Bias Correction | (0.6700) | (0.6738) | (0.8311) | (21.7510) | (20.6020) | (26.7340) | (3.4681) | (3.7750) | (5.6339) |
| (c) Incumbent’s Margin of Votes <0 | 1.3432* | 0.3093 | 1.4075 | 32.3000 | 16.5280 | 36.8430 | 5.7866 | 5.2419 | 15.1220** |
| Robust | (0.7767) | (0.8115) | (0.9359) | (26.1930) | (24.6630) | (30.2880) | (4.0750) | (4.4710) | (6.1959) |
| Order (p) | 1 | 1 | 2 | 1 | 1 | 2 | 1 | 1 | 2 |
| Polynomial Local BW (h) | 0.014 | 0.014 | 0.020 | 0.015 | 0.016 | 0.022 | 0.019 | 0.019 | 0.015 |
| Order bias (b) | 0.024 | 0.022 | 0.028 | 0.024 | 0.025 | 0.031 | 0.032 | 0.031 | 0.024 |
| N | 1,382 | 1,264 | 1,382 | 990 | 896 | 990 | 1397 | 1,276 | 1,397 |
| Covariates | No | Yes | No | No | Yes | No | No | Yes | No |
| Cervical exams | Immunization coverage | Child mortality rate | |||||||
|---|---|---|---|---|---|---|---|---|---|
| (1) | (2) | (3) | (1) | (2) | (3) | (1) | (2) | (3) | |
|
0.0179 | 0.0423 | 7.6436 | 9.4794 | 2.1870 | 6.0238* | |||
| Conventional | (0.0849) | (0.1107) | (6.5031) | (8.5778) | (2.6064) | (3.5061) | |||
| (b) Incumbent’s Margin of Votes <0 | 0.0443 | 0.0181 | 0.0539 | 10.3870 | 9.2210 | 9.5025 | 4.2274* | 2.0186 | 6.5285** |
| Bias Correction | (0.0851) | (0.0849) | (0.1107) | (6.9877) | (6.5031) | (8.5778) | (2.5347) | (2.6064) | (3.5061) |
| (c) Incumbent’s Margin of Votes <0 | 0.0443 | 0.0181 | 0.0539 | 10.3870 | 9.2210 | 9.5025 | 4.2274 | 2.0186 | 6.5285* |
| Robust | (0.1045) | (0.1046) | (0.1313) | (8.3570) | (7.7194) | (9.9712) | (3.0177) | (3.0835) | (3.9087) |
| Order (p) | 1 | 1 | 2 | 1 | 1 | 2 | 1 | 1 | 2 |
| Polynomial Local BW (h) | 0.016 | 0.017 | 0.022 | 0.015 | 0.018 | 0.022 | 0.021 | 0.019 | 0.017 |
| Order bias (b) | 0.024 | 0.026 | 0.030 | 0.026 | 0.031 | 0.029 | 0.031 | 0.027 | 0.025 |
| N | 1,397 | 1,276 | 1,397 | 1,397 | 1,276 | 1,397 | 995 | 903 | 995 |
| Covariates | No | Yes | No | No | Yes | No | No | Yes | No |
Source: Data worked by the research.
Note: * = p < 0.1; ** = p < 0.05; *** = p < 0.01. The columns refer to the estimates made by the method of Regression Discontinuity and the values in parentheses refer to the standard errors. The sample is restricted to the incumbent’s narrow margin of votes ([−5%; +5%]).
Political turnover (2008 and 2012) and health indicators 3 years after the elections (2009 and 2011) – Robustness
| Result variables 1 year after the elections – 2009 and 2013 | ||||||
|---|---|---|---|---|---|---|
| Health index | SUS workers by health units | |||||
| (1) | (2) | (3) | (1) | (2) | (3) | |
| (a) Incumbent’s Margin of Votes <0 | 0.0884*** | 0.0885** | 2.3312*** | 3.3453*** | ||
| Conventional | (0.0382) | (0.0441) | (0.9013) | (1.1804) | ||
| (b) Incumbent’s Margin of Votes <0 | 0.0894** | 0.0907** | 0.0880** | 3.0578*** | 2.7432*** | 3.6339*** |
| Bias Correction | (0.0384) | (0.0382) | (0.0441) | (0.9594) | (0.9013) | (1.1804) |
| (c) Incumbent’s Margin of Votes <0 | 0.0894* | 0.0907* | 0.0880* | 3.0578*** | 1.0172*** | 3.6339*** |
| Robust | (0.0464) | (0.0467) | (0.0515) | (1.0671) | (21.273) | (1.3105) |
| Order (p) | 1 | 1 | 2 | 1 | 1 | 2 |
| Polynomial Local BW (h) | 0.015 | 0.014 | 0.024 | 0.014 | 0.011 | 0.019 |
| Order bias (b) | 0.023 | 0.021 | 0.033 | 0.027 | 0.021 | 0.028 |
| N | 1,397 | 1,276 | 1,397 | 1,397 | 1,276 | 1,397 |
| Covariates | No | Yes | No | No | Yes | No |
Source: Data worked by the research. Note: * = p < 0.1; ** = p < 0.05; *** = p < 0.01. The columns refer to the estimates made by the method of Regression Discontinuity and the values in parentheses refer to the standard errors. The sample is restricted to the incumbent’s narrow margin of votes ([−5%; +5%]).
Political turnover (2008 and 2012) and health indicators 3 years after the elections (2009 and 2011) – Robustness
| Result variables 3 years after the elections – 2009 and 2013 | ||||||
|---|---|---|---|---|---|---|
| Health index | SUS workers by health units | |||||
| (1) | (2) | (3) | (1) | (2) | (3) | |
| (a) Incumbent’s Margin of Votes <0 | 0.0789** | 0.0793* | 0.4194 | 1.8902* | ||
| Conventional | (0.0352) | (0.0412) | (0.7310) | (1.0650) | ||
| (b) Incumbent’s Margin of Votes <0 | 0.0801** | 0.0830** | 0.0812** | 2.0481** | 0.6376 | 2.1522** |
| Bias Correction | (0.0362) | (0.0352) | (0.0412) | (0.9530) | (0.7310) | (1.0650) |
| (c) Incumbent’s Margin of Votes <0 | 0.0801* | 0.0830* | 0.0812* | 2.0481* | 0.6376 | 2.1522* |
| Robust | (0.0464) | (0.0428) | (0.0479) | (1.1060) | (0.8561) | (1.1896) |
| Order (p) | 1 | 1 | 2 | 1 | 1 | 2 |
| Polynomial Local BW (h) | 0.015 | 0.014 | 0.025 | 0.014 | 0.019 | 0.023 |
| Order bias (b) | 0.024 | 0.022 | 0.033 | 0.023 | 0.031 | 0.033 |
| N | 1,397 | 1,276 | 1,397 | 1,397 | 1,276 | 1,397 |
| Covariates | No | Yes | No | No | Yes | No |
Source: Data worked by the research. Note: * = p < 0.1; ** = p < 0.05. The columns refer to the estimates made by the method of Regression Discontinuity and the values in parentheses refer to the standard errors. The sample is restricted to the incumbent’s narrow margin of votes ([−5%; +5%]).
The “Conventional” estimator is the initial estimate based on standard methods and assumptions. It represents the treatment effect without any adjustments or corrections. The “Bias-corrected” estimator is designed to address potential biases that may arise in the conventional estimator. It employs statistical techniques to correct for systematic biases, improving the accuracy and reliability of the treatment effect estimation. The “Robust” estimator accounts for potential issues with the data or model assumptions. It incorporates robust standard errors or bootstrapping techniques to provide valid inferences even in the presence of data imperfections or model misspecifications. The robust estimator increases the reliability and robustness of the treatment effect estimation, enabling more trustworthy conclusions.
Estimating and comparing these three estimators is important to assess the sensitivity of the treatment effect to different assumptions and approaches. By examining the variation across estimators, it becomes possible to identify potential biases, uncertainties, or violations of assumptions. This comprehensive analysis helps in drawing more reliable conclusions and enhances the overall robustness of the findings in RDD studies.
For 1 year after the elections (Table 4), the new results obtained for the number of SUS workers, the visits made by the PSF, and the coverage of primary care remain consistent with the idea that municipal political turnover favors health indicators related to its administration, since, in general, the three variables still prove significant.
When we analyze 3 years after the elections (Table 5), the results for the coverage of primary care are significant to the specification changes, indicating that the improvement in this variable may not be transient; that is, the improvement seemed maintained throughout the term of new managers. We also detect a change in the infant mortality rate, which in some specifications proves significant. However, for this variable, the result is not consistent, since it changes as we change the polynomial specification or include covariates in the model. Thus, we do not have precise conclusions on the impact of political turnover on the infant mortality rate.
The robustness analysis confirms our results found for the health variables that are most directly associated with the control of municipal management. These results show that political turnover has short-term (transitory) impacts on public health administrative variables, so that these benefit from the change of party in the municipal leadership. Thus, it is interesting to try to understand the mechanisms used by the new municipal management that can favor or imply the results found.
The results in Tables 6 and 7 also corroborate the effects observed in the health index. It provides a more comprehensive picture of the long-term effects of the policy by considering trends and patterns across multiple dimensions of public health. The composite indicator provides a more holistic perspective on the policy’s overall effects, considering both direct and indirect consequences. For example, the policy may have had a positive impact on health system efficiency, resource allocation, or coordination of care, which may not be visible in specific health outcomes.
4.4 Mechanisms
Since we find that political turnover has improved some administrative health indicators, we wonder how it happens. At first, we analyzed variables regarding the characteristics of municipal health management. Table 8 shows the average incidences and the tests on the equality of means performed on selected variables, considering the municipality that underwent political turnover as treated.
Characteristics of the Municipal Health Management Body and characteristics about the manager 1 year after the elections (2009 and 2013) – average variations and tests on the equality of means (p value)
| Political turnover | No political turnover | Tests on the equality of means (p value) | |
|---|---|---|---|
| Exclusive Secretariat | 0.83 | 0.83 | 0.9450 |
| SUS Municipal manager with higher education or more | 0.70 | 0.65 | 0.0350 |
| SUS Municipal manager with health university degree | 0.44 | 0.36 | 0.0149 |
| Meetings held by the Municipal Health Council | 12 | 11 | 0.3778 |
| N | 972 | 725 |
Source: Data from DATASUS and IBGE, worked on by the research.
Note: The p value column refers to the tests on the equality of means performed, comparing the treated group (which underwent political turnover) and control (the incumbent party remained in power). The sample is restricted to the incumbent’s narrow margin of votes ([−5%; +5%]).
We obtained significant results for the tests of difference of means performed for the two variables referring to the education of the municipal manager of SUS. Thus, the results presented above indicate that in municipalities that underwent political turnover, the average education level of SUS managers was higher. One year after the elections, 70% of the municipalities with political change had SUS managers with higher education, whereas in municipalities where the party remained in power, this incidence is lower, around 65%. In addition, in municipalities with political turnover, there was a higher incidence of health trained managers.[13] Thus, we can infer that political turnover is beneficial in the sense that as new mayors take office, the health managers they appoint are better qualified compared with those in which the municipal executive power has not undergone changes in leadership. This better qualification may reflect more effective strategies in order to improve or make administrative issues more efficient, which may explain the significant results previously presented in Figure 2.
Some observations should be made regarding the larger number of qualified health managers in municipalities that have undergone political turnover. There is a well-established literature, indicating that political turnover and government transitions can be accompanied by bureaucratic turnover. Iyer and Mani (2012) were the first to examine how political turnover affects bureaucratic turnover in India, revealing that politicians influence the process of appointing bureaucrats, and political changes are associated with significant increases in the likelihood of bureaucrats being relocated. More recently, in the context of Brazil, Brassiolo et al. (2021) discovered that municipalities experiencing political turnover after closely contested elections also witness an increased turnover at both the top (managers) and bottom (administrative and elementary officials) levels of the hierarchy.
Also observing the Brazilian case, Akhtari et al. (2022) have conducted a study that examines the occurrence of disruptions in municipal bureaucracy associated with political turnover during municipal elections. Furthermore, the authors expand their analysis to investigate the impact of public service provision in the field of education. Their findings indicate that an increase in personnel replacements in schools is linked to a decline in the quality of public education, as evidenced by lower test scores in subsequent years. This finding is particularly significant as it establishes a connection between changes in the bureaucracy and outcomes that directly affect the well-being of citizens. However, the adverse effects observed by the authors seem to disappear with time. In a similar vein, Toral (2022) has also explored political turnover in Brazilian municipal elections, focusing on the transitional periods and specifically examining the composition of the bureaucracy and the delivery of healthcare services. The study reveals that when incumbents are defeated in elections, it leads to reorganization within the bureaucracy and a reduction in healthcare service delivery during the transition period.
As Akhtari et al. (2022) point out, party turnover results in new hires being observed across various sectors, including education, health, and construction. While this extensive bureaucracy overhaul may impact many of the services provided by the municipality, it remains unclear in the literature whether this is ultimately beneficial or detrimental to the quality of such services. Although we did not encounter studies analyzing the effects of improved qualification in management positions following party turnover, it is worth noting that higher qualifications or levels of education are typically associated with better quality public service provision. This factor could potentially serve as one of the mechanisms contributing to the positive results found in this study.
We also sought to investigate whether there is a difference between some variables in the municipal healthcare network. In this case, we calculated the variation[14] average 1 year after the election of such variables, in order to verify whether there is a difference in the generation of new units of the same between municipalities that have undergone political turnover and those that have not. The results are shown in Table 7.
We obtained a significant result of the test of difference of means for the variable referring to the variation of basic health units. In this case, we can intuit that municipalities that underwent political turnover created more basic health units compared with municipalities in which there was no political change. In fact, the data in Table 9 tell us that for every six municipalities in which the incumbent party lost the elections and there was political turnover, one center of basic health unit was created. As for the sample in which there was no political turnover, one center of basic health unit was created for each 17 municipalities in our sample. This result is consistent with the positive effect found in the previous section, where we verified that municipalities that go through rotation have better rates of coverage of primary care. We can infer, therefore, that this result is explained by the higher occurrence of the creation of new basic health units in municipalities that underwent changes in municipal leadership.
Variables of the municipal health care network Electoral years and 1 year after the elections (2008/2009 and 2012/2013) – average variations and tests on the equality of means (p value)
| Political turnover | No political turnover | Tests on the equality of means (p value) | |
|---|---|---|---|
| Community agents | 0.79 | 0.34 | 0.1296 |
| PSF nurses | 0.5 | 0.37 | 0.3765 |
| PSF doctors | 0.55 | 0.52 | 0.8176 |
| Basic Health Units | 0.16 | 0.06 | 0.0764 |
| Health Surveillance Units | 0.13 | 0.09 | 0.2633 |
| Psychosocial Care Center | 0.17 | 0.12 | 0.2638 |
| N | 672 | 725 |
Source: Data from DATASUS and IBGE, worked on by the research.
Note: The p value column refers to the tests on the equality of means performed, comparing the treated group (which underwent political turnover) and control (the incumbent party remained in power). The sample is restricted to the incumbent’s narrow margin of votes ([−5%; +5%]).
However, although we do not have significant results from the means tests for the other variables in Table 9, we think it is important to highlight how different they are between the treated and control groups. For the variation of jobs of community agents, for example, we found that one new agent was hired from each municipality that underwent political turnover. For municipalities where the party remained in power, however, one new community agent was hired for every three municipalities. Table A5, in the Appendix, shows the maximum and minimum values of the care network variables found for both groups. For the group that underwent political turnover, the maximum creation of jobs for community agents in a single municipality was 68, whereas for the sample of municipalities in which the parties remained in power, this maximum number was 32. Thus, for such indicators, even if we did not obtain significant results in the average tests, it is possible to perceive that the scenario in question in municipalities that undergo political turnover is better.
5 Final Considerations
This study set out to examine how political turnover affects municipal health indicators. Using a pool of data from close municipal elections that occurred in the country, our results showed that in the period immediately after the elections, political turnover benefits health indicators related to administrative issues, such as the number of SUS workers, the visits made by the PSF and the coverage of primary care. In addition, 1 year after the elections, the variable referring to the number of cervical exams performed also proved to benefit from political turnover. These results indicate that these variables were better in municipalities where the incumbent party lost the election and another party took power.
We sought to investigate the persistence of these effects. To this end, we tested the effect of political turnover on the same health indicators 3 years after the elections. In this case, only the variable referring to the number of SUS workers remained significant, indicating that the effect of the new management on it is not lost during the mandate of the new incumbent party.
For the strength of our evidence, we tested three other estimates derived from our main model. For the years following the elections, our previous results for the three administrative variables were corroborated. However, 3 years after the elections, the coverage of primary care was significant, indicating that the improvement in this variable may not be transient.
Finally, the study of possible channels of transmission of these beneficial effects showed us that on average, municipalities that underwent political turnover had more qualified municipal SUS managers (appointed by mayors). This better qualification may reflect better strategies and more effective public policies, which are reflected in health indicators related to administrative issues. In addition, in these municipalities where there was a change of party in power, more basic health units were created during the new administration, which helps us to understand the positive result found for the coverage of primary care.
The study of political mandate and close elections has recently gained prominence. Thus, we hope that this article will contribute to the literature that seeks to understand how political turnover affects the local economy. In our case, political turnover seems to benefit the municipal public health supply. A possible step forward would be to identify how this improvement in health indicators directly benefits the population.
Acknowledgments
The authors express their gratitude to the three anonymous reviewers for their insightful suggestions and meticulous review of the manuscript. This work was funded by the Coordenação de Aperfeiçoamento de Pessoal de Nível Superior (Capes), which provided a doctoral fellowship at Universidade Federal da Paraíba (UFPB).
-
Funding information: This study was funded by Coordenação de Aperfeiçoamento de Pessoal de Nível Superior (Finance Code 001).
-
Conflict of interest: The authors declare that have no conflict of interest that might constitute an embarrassment to the publication of this article.
-
Article note: As part of the open assessment, reviews and the original submission are available as supplementary files on our website.
Appendix

Test of Manipulation around the discontinuity Incumbent’s narrow vote margin 2008 and 2012. Source: Data worked by the research.
Descriptive statistics for covariates
| Budgetary characteristics averages | |||
|---|---|---|---|
| Political turnover | No political turnover | Tests on the equality of means (P value) | |
| Per-capita tax revenue | R$ 124.94 | R$ 118.49 | 0.4139 |
| Per-capita health expenditure | R$ 457.28 | R$ 450.86 | 0.1482 |
| N | 672 | 725 | |
Source: FINBRA data, worked on by the research.
Note: The P value column refers to the tests on the equality of means performed, comparing the treated group (which underwent political turnover) and control (the incumbent party remained in power). The sample is restricted to the incumbent’s narrow margin of votes ([−5%; +5%]).
Political turnover (2008 and 2012) and health indicators 1 year after the elections (2009 and 2013) Linear discontinuity model
| Result variables 1 year after the elections 2009 and 2013 | ||||
|---|---|---|---|---|
| SUS workers | PSF visits | Primary care coverage | Health index | |
| Incumbent’s Margin of Votes <0 | 1.4323* | 34.315* | 9.0266** | 0.0833** |
| Conventional | (0.75063) | (18.455) | (4.11632) | (0.0384) |
| BW Polynomial location (h) | 0.013 | 0.013 | 0.014 | 0.015 |
| Order bias (b) | 0.021 | 0.024 | 0.027 | 0.023 |
| N | 1,397 | 1,260 | 1,397 | 1,397 |
| Cervical exams | Immunization coverage | Child mortality rate | SUS workers by health units | |
| Incumbent’s Margin of Votes <0 | 0.1233* | 3.1832 | 4.4936 | 2.6287*** |
| Conventional | (0.07242) | (5.188) | (4.5865) | (0.9594) |
| BW Polynomial location (h) | 0.018 | 0.010 | 0.012 | 0.014 |
| Order bias (b) | 0.029 | 0.019 | 0.019 | 0.027 |
| N | 1,397 | 1,397 | 1,097 | 1,397 |
Source: Data worked by the research.
Note: * = p <0.1; ** = p <0.05; *** = p <0.01. The columns refer to the estimates made by the method of Regression Discontinuity, using polynomial order p (1) and the values in parentheses refer to standard errors. The sample is restricted to the incumbent’s narrow margin of votes ([−5%; +5%]).
Political turnover (2008 and 2012) and health indicators 3 years after the elections (2011 and 2015) Linear discontinuity model
| Result variables 3 years after the elections 2009 and 2013 | ||||
|---|---|---|---|---|
| SUS workers | PSF visits | Primary care coverage | Health index | |
| Incumbent’s Margin of Votes <0 | 1.1173* | 29.308 | 4.8669 | 0.0714** |
| Conventional | (0.67001) | (21.751) | (3.4681) | (0.0362) |
| BW Polynomial location (h) | 0.014 | 0.015 | 0.019 | 0.015 |
| Order bias (b) | 0.024 | 0.024 | 0.032 | 0.024 |
| N | 1,382 | 990 | 1,397 | 1,397 |
| Cervical exams | Immunization coverage | Child mortality rate | SUS workers by health units | |
| Incumbent’s Margin of Votes <0 | 0.03359 | 8.7698 | 3.862 | 1.7321* |
| Conventional | (0.08518) | (6.9877) | (2.5347) | (0.9530) |
| BW Polynomial location (h) | 0.016 | 0.015 | 0.021 | 0.014 |
| Order bias (b) | 0.024 | 0.026 | 0.031 | 0.023 |
| N | 1,397 | 1,397 | 995 | 1,397 |
Source: Data worked by the research.
Note: * = p < 0.1; ** = p < 0.05. The columns refer to the estimates made by the method of Regression Discontinuity. using polynomial order p (1). and the values in parentheses refer to standard errors. The sample is restricted to the incumbent’s narrow margin of votes ([−5%; +5%]).
Political turnover (2008 and 2012) and health indicators 2 years after the elections (2010 and 2014)
| Result variables 2 years after the elections 2010 and 2014 | |||||||||
|---|---|---|---|---|---|---|---|---|---|
| SUS workers | PSF visits | Primary care coverage | |||||||
| Incumbent’s Margin of Votes <0 | 1.3794* | 0.5316 | 1.483* | 38.243* | 29.854 | 69.332** | 10.262** | 8.6379** | 12.709** |
| Conventional | (0.0754) | (0.7462) | (0.8448) | (21.285) | (21.06) | (30.405) | (4.2048) | (4.2186) | (5.2854) |
| Incumbent’s Margin of Votes <0 | 1.5887** | 0.6717 | 1.6837** | 44.69** | 35.508* | 78.935*** | 11.644** | 9.9551** | 13.744*** |
| Bias Correction | (0.0754) | (0.7462) | (0.8448) | (21.285) | (21.06) | (30.405) | (4.2048) | (4.2186) | (5.2854) |
| Incumbent’s Margin of Votes <0 | 1.5887* | 0.6717 | 1.6837* | 44.69* | 35.508 | 78.935** | 11.644** | 9.9551** | 13.744** |
| Robust | (0.8765) | (0.8954) | (0.9414) | (25.085) | (24.836) | (34.197) | (4.9065) | (4.99739) | (5.9978) |
| Order (p) | 1 | 1 | 2 | 1 | 1 | 2 | 1 | 1 | 2 |
| Polynomial Local BW (h) | 0.013 | 0.012 | 0.022 | 0.017 | 0.015 | 0.016 | 0.013 | 0.014 | 0.020 |
| Order bias (b) | 0.022 | 0.020 | 0.032 | 0.025 | 0.024 | 0.024 | 0.024 | 0.024 | 0.027 |
| N | 1,397 | 1,276 | 1,397 | 1,069 | 1,069 | 1,174 | 1,397 | 1,276 | 1,397 |
| Covariates | No | Yes | No | No | Yes | No | No | Yes | No |
| Cervical exams | Immunization coverage | Child mortality rate | |||||||
| Incumbent’s Margin of Votes <0 | 0.1147 | 0.0679 | 0.1161 | 3.7053 | 4.5355 | 5.7082 | 2.8416 | 0.02099 | 4.5521 |
| Conventional | (0.076) | (0.0801) | (0.1151) | (4.291) | (4.5397) | (7.1241) | (3.3307) | (2.9818) | (4.5097) |
| Incumbent’s Margin of Votes <0 | 0.1269* | 0.0696 | 0.1035 | 3.8105 | 5.02 | 7.1614 | 3.8027 | 0.1348 | 5.249 |
| Bias Correction | (0.076) | (0.0801) | (0.1151) | (4.291) | (4.5397) | (7.1241) | (3.3307) | (2.9818) | (4.5097) |
| Incumbent’s Margin of Votes <0 | 0.1269 | 0.0696 | 0.1035 | 3.8105 | 5.02 | 7.1614 | 3.8027 | 0.1348 | 5.249 |
| Robust | (0.0923) | (0.0982) | (0.1346) | (5.1494) | (5.462) | (8.104) | (3.994) | (3.646) | (5.2461) |
| Order (p) | 1 | 1 | 2 | 1 | 1 | 2 | 1 | 1 | 2 |
| Polynomial Local BW (h) | 0.016 | 0.016 | 0.018 | 0.020 | 0.019 | 0.017 | 0.018 | 0.020 | 0.022 |
| Order bias (b) | 0.025 | 0.025 | 0.024 | 0.031 | 0.030 | 0.024 | 0.028 | 0.030 | 0.030 |
| N | 1,397 | 1,276 | 1,397 | 1,397 | 1,276 | 1,397 | 1,014 | 919 | 1,014 |
| Covariates | No | Yes | No | No | Yes | No | No | Yes | No |
Source: Data worked by the research.
Note: * = p <0.1; ** = p <0.05; *** = p <0.01. The columns refer to the estimates made by the method of Regression Discontinuity. using polynomial order p (1), and the values in parentheses refer to standard errors. The sample is restricted to the incumbent’s narrow margin of votes ([−5%; +5%]).
Political turnover (2008 and 2012) and health indicators 4 years after the elections (2012 and 2016)
| Result variables 4 years after the elections 2012 and 2016 | |||||||||
|---|---|---|---|---|---|---|---|---|---|
| SUS workers | PSF visits | Primary care coverage | |||||||
| Incumbent’s Margin of Votes <0 | 1.6723* | 0.7042 | 1.9396* | 51.625 | 28.62 | 72.081* | 17.575** | 13.805 | 18.534* |
| Conventional | (0.9102) | (0.7767) | (1.0102) | (32.13) | (28.443) | (38.518) | (8.8) | (8.6255) | (9.7262) |
| Incumbent’s Margin of Votes <0 | 1.8078 | 0.8258 | 2.1752** | 64.579** | 39.105 | 83.963** | 20.174** | 16.236* | 20.533** |
| Bias Correction | (0.9102) | (0.7767) | (1.0102) | (32.13) | (28.443) | (38.518) | (8.8) | (8.6255) | (9.7262) |
| Incumbent’s Margin of Votes <0 | 1.8078 | 0.8258 | 2.1752* | 64.579* | 39.105 | 83.963** | 20.174* | 16.236 | 20.533* |
| Robust | (1.1001) | (0.9278) | (1.11364) | (36.835) | (32.755) | (42.835) | (10.43) | (10.131) | (11.152) |
| Order (p) | 1 | 1 | 2 | 1 | 1 | 2 | 1 | 1 | 2 |
| Polynomial Local BW (h) | 0.013 | 0.014 | 0.023 | 0.011 | 0.013 | 0.016 | 0.014 | 0.015 | 0.025 |
| Order bias (b) | 0.020 | 0.023 | 0.033 | 0.020 | 0.020 | 0.024 | 0.023 | 0.024 | 0.032 |
| N | 686 | 625 | 686 | 608 | 551 | 608 | 686 | 625 | 686 |
| Covariates | No | Yes | No | No | Yes | No | No | Yes | No |
| Cervical exams | Immunization coverage | Child mortality rate | |||||||
| Incumbent’s Margin of Votes <0 | 0.0578 | 0.1558 | 0.0793 | 4.253 | 4.282 | 4.9305 | 5.1992 | 0.3325 | 6.3206 |
| Conventional | (0.1566) | (0.1621) | (0.2078) | (7.6621) | (7.874) | (9.4095) | (4.852) | (4.2119) | (7.0088) |
| Incumbent’s Margin of Votes <0 | 0.0678 | 0.1955 | 0.0707 | 5.0465 | 5.4772 | 5.2602 | 6.5572 | 0.4793 | 6.666 |
| Bias Correction | (0.1566) | (0.1621) | (0.2078) | (7.6621) | (7.874) | (9.4095) | (4.852) | (4.2119) | (7.0088) |
| Incumbent’s Margin of Votes <0 | 0.0678 | 0.1955 | 0.0707 | 5.0465 | 5.4772 | 5.2602 | 6.5572 | 0.4793 | 6.666 |
| Robust | (0.1916) | (0.1923) | (0.2491) | (9.4676) | (9.7913) | (10.911) | (6.0799) | (5.2167) | (8.3538) |
| Order (p) | 1 | 1 | 2 | 1 | 1 | 2 | 1 | 1 | 2 |
| Polynomial Local BW (h) | 0.016 | 0.016 | 0.023 | 0.020 | 0.023 | 0.028 | 0.014 | 0.017 | 0.019 |
| Order bias (b) | 0.025 | 0.027 | 0.029 | 0.028 | 0.032 | 0.034 | 0.022 | 0.025 | 0.027 |
| N | 686 | 625 | 686 | 686 | 625 | 686 | 504 | 458 | 504 |
| Covariates | No | Yes | No | No | Yes | No | No | Yes | No |
Source: Data worked by the research.
Note: * = p < 0.1; ** = p < 0.05. The columns refer to the estimates made by the method of Regression Discontinuity. using polynomial order p (1). and the values in parentheses refer to standard errors. The sample is restricted to the incumbent’s narrow margin of votes ([−5%; +5%]).
Political turnover (2008 and 2012) and health indicators during mandates Averages (2009–2012 and 2013–2016)
| Result variables after the elections averages 2009–2012 and 2013–2016 | |||||||||
|---|---|---|---|---|---|---|---|---|---|
| SUS workers | PSF visits | Primary care coverage | |||||||
| Incumbent’s Margin of Votes <0 | 1.6836* | 0.7542 | 1.9148* | 10.906 | 6.8262 | 68.434 | 16.46* | 11.568 | 16.418* |
| Conventional | (0.9469) | (0.8175) | (1.0267) | (22.795) | (22.358) | (41.691) | (8.6694) | (8.139) | (8.9601) |
| Incumbent’s Margin of Votes <0 | 1.8486* | 0.8264 | 2.1657** | 11.84 | 7.9495 | 81.712** | 19.344** | 13.938* | 18.558** |
| Bias Correction | (0.9469) | (0.8175) | (1.0267) | (22.795) | (22.358) | (41.691) | (8.6694) | (8.139) | (8.9601) |
| Incumbent’s Margin of Votes <0 | 1.8486 | 0.8264 | 2.1657* | 11.84 | 7.9495 | 81.712* | 19.344* | 13.938 | 18.558* |
| Robust | (1.143) | (0.9824) | (1.11552) | 27.535 | (26.468) | (46.738) | (10.092) | (9.5709) | (10.31) |
| Order (p) | 1 | 1 | 2 | 1 | 1 | 2 | 1 | 1 | 2 |
| Polynomial Local BW (h) | 0.012 | 0.013 | 0.023 | 0.020 | 0.017 | 0.014 | 0.012 | 0.013 | 0.023 |
| Order bias (b) | 0.019 | 0.020 | 0.032 | 0.032 | 0.026 | 0.022 | 0.020 | 0.021 | 0.031 |
| N | 686 | 625 | 686 | 525 | 479 | 525 | 686 | 625 | 686 |
| Covariates | No | Yes | No | No | Yes | No | No | Yes | No |
| Cervical exams | Immunization coverage | Child mortality rate | |||||||
| Incumbent’s Margin of Votes <0 | 0.0133 | 0.0639 | 0.0010 | 3.0547 | 3.0078 | 4.031 | 1.0892 | 1.9929 | 0.0788 |
| Conventional | (0.1232) | (0.1395) | (0.1573) | (5.9699) | (6.2421) | (7.4407) | (1.9504) | (2.11552) | (3.22675) |
| Incumbent’s Margin of Votes <0 | 0.0033 | 0.0961 | 0.0254 | 4.16 | 4.3735 | 4.6357 | 1.3187 | 2.7062 | 0.4185 |
| Bias Correction | (0.1232) | (0.1395) | (0.1573) | (5.9699) | (6.2421) | (7.4407) | (1.9504) | (2.11552) | (3.22675) |
| Incumbent’s Margin of Votes <0 | 0.0033 | 0.0961 | 0.0254 | 4.16 | 4.3735 | 4.6357 | 1.3187 | 2.7062 | 0.4185 |
| Robust | (0.1512) | (0.1655) | (0.1852) | (7.3608) | (7.7268) | (8.7403) | (2.33311) | (2.5157) | (3.9167) |
| Order (p) | 1 | 1 | 2 | 1 | 1 | 2 | 1 | 1 | 2 |
| Polynomial Local BW (h) | 0.018 | 0.016 | 0.027 | 0.021 | 0.023 | 0.029 | 0.020 | 0.019 | 0.016 |
| Order bias (b) | 0.028 | 0.026 | 0.035 | 0.029 | 0.032 | 0.034 | 0.031 | 0.031 | 0.026 |
| N | 686 | 625 | 686 | 686 | 625 | 686 | 323 | 289 | 323 |
| Covariates | No | Yes | No | No | Yes | No | No | Yes | No |
Source: Data worked by the research.
Note: * = p < 0.1; ** = p < 0.05. The columns refer to the estimates made by the method of Regression Discontinuity. using polynomial order p (1). and the values in parentheses refer to standard errors. The sample is restricted to the incumbent’s narrow margin of votes ([−5%; +5%]).
Nonparametric estimation – Coefficients
| Estimate | ||
|---|---|---|
| Outcome | 1 year after the elections | 3 years after the elections |
| SUS workers | 1.4169 | 1.2534 |
| PSF visits | 36.7973 | 33.5288 |
| Primary Care Coverage | 10.3843 | 5.4655 |
| Cervical exams | 0.1251 | 0.0303 |
| Immunization Coverage | 2.1611 | 8.5110 |
| Child mortality rate | 5.4648 | 3.6463 |
| Health Index | 0.0799 | 0.0690 |
| SUS Workers by Health Units | 2.3658 | 1.7158 |
Note: kernel: triangle, degree: 1. Without assumptions about standard deviations.
Variables of the municipal health care network Variations Electoral years and 1 year after the elections (2008–2009 and 2012–2013): Maximum and minimum values
| Political turnover | No political turnover | |||
|---|---|---|---|---|
| Minimum value | Maximum value | Maximum value | Minimum value | |
| Community agents | 36 | 68 | 43 | 32 |
| PSF Nurses | 17 | 24 | 5 | 34 |
| PSF Doctors | 9 | 16 | 5 | 15 |
| Basic Health Units | 8 | 10 | 11 | 10 |
| Health Surveillance Units | 0 | 2 | 0 | 1 |
| Psychosocial Care Center | 0 | 2 | 1 | 1 |
| N | 672 | 725 | ||
Source: Data worked by the research.
Note: The sample is restricted to the incumbent’s narrow voting margin ([−5%; +5%]).
References
Akhtari, M., Moreira, D., & Trucco, L. (2022). Political turnover, bureaucratic turnover, and the quality of public services. American Economic Review, 112(2), 442–493. doi: 10.1257/aer.20171867.Suche in Google Scholar
Albouy, D. (2013). Partisan representation in congress and the geographic distribution of federal funds. Review of Economics and Statistics, 95, 127–141. doi: 10.1162/REST_a_00343.Suche in Google Scholar
Alesina, A. (1988). Credibility and policy convergence in a two-party system with rational voters. The American Economic Review, 78(4), 796–805. http://www.jstor.org/stable/1811177.Suche in Google Scholar
Alford, J. R., & Hibbing, J. R. (1981). Increased incumbency advantage in the house. Journal of Politics, 43, 1042–1061. doi: 10.2307/2130188.Suche in Google Scholar
Angrist, J. D., & Pischke, J. S. (2009). Mostly harmless econometrics: An empiricist’s companion. Princeton University Press.10.1515/9781400829828Suche in Google Scholar
Ansolabehere, S., Snyder, J. M. J., & Stewart, I. C. (2000). Old voters, new voters, and the personal vote: Using redistricting to measure the incumbency advantage. American Journal of Political Science, 44, 17–34. doi: 10.2307/2669290.Suche in Google Scholar
Brassiolo, P., Estrada, R., & Fajardo, G. (2021). Bureaucratic turnover across levels of government. https://scioteca.caf.com/handle/123456789/1824.Suche in Google Scholar
Brollo, F., & Nannicini, T. (2012). Tying your enemy’s hands in close races: The politics of federal transfers in Brazil. American Political Science Review, 106, 742–761. doi: 10.2307/23357707.Suche in Google Scholar
Brollo, F., & Troiano, U. (2016). What happens when a woman wins an election? Evidence from close races in Brazil. Journal of Development Economics, 122, 28–45. doi: 10.1016/01604003.Suche in Google Scholar
Butler, D. M. (2009). A regression discontinuity design analysis of the incumbency advantage and tenure in the US house. Electoral Studies, 28, 123–128. doi: 101016/200807010.Suche in Google Scholar
Calonico, S., Cattaneo, M. D., & Titiunik, R. (2014). Robust data-driven inference in the regression-discontinuity design. The Stata Journal: Promoting communications on statistics and Stata, 14, 909–946. doi: 10.1177/1536867X1401400413.Suche in Google Scholar
Cattaneo, M. D., Jansson, M., & Ma, X. (2018). Manipulation testing based on density discontinuity. The Stata Journal: Promoting communications on statistics and Stata, 18, 234–261. doi: 10.1177/1536867X1801800115.Suche in Google Scholar
Cellini, S. R., Ferreira, F., & Rothstein, J. (2010). The value of school facility investments: Evidence from a dynamic regression discontinuity design. Quarterly Journal of Economics, 125, 215–261. doi: 10.1162/qjec.2010.125.1.215.Suche in Google Scholar
Cox, G. W., & Katz, J. N. (1996). Why did the incumbency advantage in US house elections grow? American Journal of Political Science, 40, 478–497. doi: 10.2307/2111633.Suche in Google Scholar
Desposato, S. W. (2006). Parties for rent? Ambition, ideology, and party switching in Brazil’s chamber of deputies. American Journal of Political Science, 50(1), 62–80. doi: 10.1111/j.1540-5907.2006.00170.x.Suche in Google Scholar
Eggers, A. C., Fowler, A., Hainmueller, J., Hall, A. B., & Snyder Jr., J. M. (2015). On the validity of the regression discontinuity design for estimating electoral effects: New evidence from over 40,000 close races. American Journal of Political Science, 59, 259–274. doi: 10.1111/ajps.12127.Suche in Google Scholar
Erikson, R. S. (1971). The advantage of incumbency in congressional elections. Polity, 3, 395–405. doi: 10.2307/3234117.Suche in Google Scholar
Ferraz, C., & Finan, F. (2011). Electoral accountability and corruption: Evidence from the audits of local governments. American Economic Review, 101, 1274–1311. doi: 10.1257/aer.101.4.1274.Suche in Google Scholar
Figueiredo, A. C., & Limongi, F. (2000). Presidential power, legislative organization, and party behavior in Brazil. Comparative Politics, 32(2), 151–170. doi: 10.2307/422395.Suche in Google Scholar
Firjan. (2018). Municipal Development Index. https://www.firjan.com.br/ifdm/downloads/.Suche in Google Scholar
Freier, R. (2015). The mayor’s advantage: Causal evidence on incumbency effects in German mayoral elections. European Journal of Political Economy, 40, 16–30. doi: 10.1016/j.ejpoleco.2015.07.005.Suche in Google Scholar
Groseclose, T. (2001). A model of candidate location when one candidate has a valence advantage. American Journal of Political Science, 45, 862–886. doi: 10.2307/2669329.Suche in Google Scholar
Hahn, J., Todd, P., & van der Klaauw, W. (2001). Identification and estimation of treatment effects with a regression-discontinuity design. Econometrics, 69, 201–209. doi: 10.2307/2692190.Suche in Google Scholar
Heller, W., & Mershon, C. (Eds.). (2009). Political parties and legislative party switching. Springer.10.1057/9780230622555Suche in Google Scholar
Holland, A. C. (2016). Insurgent successor parties: Scaling down to build a party after war. In S. Levitsky, J. Loxton, B. Van Dyck, & J. I. Domínguez (Eds.), Challenges of Party-Building in Latin America (pp. 273–304). Cambridge University Press.10.1017/CBO9781316550564.010Suche in Google Scholar
Hunter, W. (2010). The Transformation of the Workers’ Party in Brazil, 1989–2009. Cambridge University Press.10.1017/CBO9780511763304Suche in Google Scholar
Imbens, G. W., & Lemieux, T. (2008). Regression discontinuity designs: A guide to practice. Journal of Econometrics, 142, 615–635. doi: 10.1016/j.jeconom.2007.05.001.Suche in Google Scholar
Iyer, L., & Mani, A. (2012). Traveling agents: Political change and bureaucratic turnover in India. Review of Economics and Statistics, 94(3), 723–739. doi: 10.1162/REST_a_00183.Suche in Google Scholar
Lavareda, A., & Telles, H. (2015). Como o eleitor escolhe seu prefeito: campanha e voto nas eleições municipais [How the voter chooses their mayor: Campaign and vote in municipal elections]. Editora FGV.Suche in Google Scholar
Lee, D. S. (2008). Randomized experiments from nonrandom selection in US house elections. Journal of Econometrics, 142, 675–697. doi: 10.1016/j.jeconom.2007.05.004.Suche in Google Scholar
Lee, D. S., Moretti, E., & Butler, M. J. (2004). Do voters affect or elect policies? Evidence from the US house. Quarterly Journal of Economics, 119, 807–859. doi: 10.2307/25098703.Suche in Google Scholar
Lucardi, A. (2016). Building support from below? Subnational elections, diffusion effects, and the growth of the opposition in Mexico, 1984–2000. Comparative Political Studies, 49(14), 1855–1895. doi: 10.1177/0010414016666857.Suche in Google Scholar
Machado, C. V., Lima, L. D., & Baptista, T. W. F. (2011). Organizational principles and instances of SUS. In SUS qualification and managers (2nd ed., pp. 47–72). Fiocruz/ENSP/EAD.Suche in Google Scholar
McCabe, B. C., Feiock, R. C., Clingermayer, J. C., & Stream, C. (2008). Turnover among city managers: The role of political and economic change. Public Administration Review, 68, 380–386. doi: 10.2307/25145609.Suche in Google Scholar
Ministry of Health. (2019). SUS management. http://www.saude.gov.br/gestaodosus.Suche in Google Scholar
Novaes, L. M. (2014). Promiscuous politicians and the problem of party organization. Mayoral candidates as party brokers. Paper presented at the Annual Meeting of the Political Science Association, Washington D.C.Suche in Google Scholar
Novaes, L. M., & Schiumerini, L. (2022). Commodity shocks and incumbency effects. British Journal of Political Science, 52(4), 1689–1708. doi: 10.1017/S0007123421000478.Suche in Google Scholar
Rodden, J., & Wibbels, E. (2011). Dual accountability and the nationalization of party competition: Evidence from four federations. Party Politics, 17(5), 629–653. doi: 10.1177/1354068810376182.Suche in Google Scholar
Samuels, D. J., & Zucco, C. (2014). The power of partisanship in Brazil: Evidence from survey experiments. American Journal of Political Science, 58(1), 212–225. doi: 10.1111/ajps.12050.Suche in Google Scholar
Samuels, D. J. (1999). Incentives to cultivate a party vote in candidate-centric electoral systems: Evidence from Brazil. Comparative Political Studies, 32(4), 487–518. doi: 10.1177/0010414099032004004.Suche in Google Scholar
Thistlethwaite, D. L., & Campbell, D. T. (1960). Regression-discontinuity analysis: An alternative to the ex post facto experiment. Journal of Educational Psychology, 51, 309–317. doi: 10.1037/h0044319.Suche in Google Scholar
Toral, G. (2022). Turnover: How lame-duck governments disrupt the bureaucracy and service delivery before leaving office. Work. Pap. https://www.guillermotoral.com/turnover.pdf.Suche in Google Scholar
Trounstine, J. (2011). Evidence of a local incumbency advantage. Legislative Studies Quarterly, 36, 255–280. doi: 10.1111/j.19399162.2011.00013.x.Suche in Google Scholar
Vogl, T. S. (2014). Race and the politics of close elections. Journal of Public Economics, 109, 101–113. doi: 10.1016/j.jpubeco.2013.11.004.Suche in Google Scholar
© 2024 the author(s), published by De Gruyter
This work is licensed under the Creative Commons Attribution 4.0 International License.
Artikel in diesem Heft
- Regular Articles
- Political Turnover and Public Health Provision in Brazilian Municipalities
- Examining the Effects of Trade Liberalisation Using a Gravity Model Approach
- Operating Efficiency in the Capital-Intensive Semiconductor Industry: A Nonparametric Frontier Approach
- Does Health Insurance Boost Subjective Well-being? Examining the Link in China through a National Survey
- An Intelligent Approach for Predicting Stock Market Movements in Emerging Markets Using Optimized Technical Indicators and Neural Networks
- Analysis of the Effect of Digital Financial Inclusion in Promoting Inclusive Growth: Mechanism and Statistical Verification
- Effective Tax Rates and Firm Size under Turnover Tax: Evidence from a Natural Experiment on SMEs
- Re-investigating the Impact of Economic Growth, Energy Consumption, Financial Development, Institutional Quality, and Globalization on Environmental Degradation in OECD Countries
- A Compliance Return Method to Evaluate Different Approaches to Implementing Regulations: The Example of Food Hygiene Standards
- Panel Technical Efficiency of Korean Companies in the Energy Sector based on Digital Capabilities
- Time-varying Investment Dynamics in the USA
- Preferences, Institutions, and Policy Makers: The Case of the New Institutionalization of Science, Technology, and Innovation Governance in Colombia
- The Impact of Geographic Factors on Credit Risk: A Study of Chinese Commercial Banks
- The Heterogeneous Effect and Transmission Paths of Air Pollution on Housing Prices: Evidence from 30 Large- and Medium-Sized Cities in China
- Analysis of Demographic Variables Affecting Digital Citizenship in Turkey
- Green Finance, Environmental Regulations, and Green Technologies in China: Implications for Achieving Green Economic Recovery
- Coupled and Coordinated Development of Economic Growth and Green Sustainability in a Manufacturing Enterprise under the Context of Dual Carbon Goals: Carbon Peaking and Carbon Neutrality
- Revealing the New Nexus in Urban Unemployment Dynamics: The Relationship between Institutional Variables and Long-Term Unemployment in Colombia
- The Roles of the Terms of Trade and the Real Exchange Rate in the Current Account Balance
- Cleaner Production: Analysis of the Role and Path of Green Finance in Controlling Agricultural Nonpoint Source Pollution
- The Research on the Impact of Regional Trade Network Relationships on Value Chain Resilience in China’s Service Industry
- Social Support and Suicidal Ideation among Children of Cross-Border Married Couples
- Asymmetrical Monetary Relations and Involuntary Unemployment in a General Equilibrium Model
- Job Crafting among Airport Security: The Role of Organizational Support, Work Engagement and Social Courage
- Does the Adjustment of Industrial Structure Restrain the Income Gap between Urban and Rural Areas
- Optimizing Emergency Logistics Centre Locations: A Multi-Objective Robust Model
- Geopolitical Risks and Stock Market Volatility in the SAARC Region
- Trade Globalization, Overseas Investment, and Tax Revenue Growth in Sub-Saharan Africa
- Can Government Expenditure Improve the Efficiency of Institutional Elderly-Care Service? – Take Wuhan as an Example
- Media Tone and Earnings Management before the Earnings Announcement: Evidence from China
- Review Articles
- Economic Growth in the Age of Ubiquitous Threats: How Global Risks are Reshaping Growth Theory
- Efficiency Measurement in Healthcare: The Foundations, Variables, and Models – A Narrative Literature Review
- Rethinking the Theoretical Foundation of Economics I: The Multilevel Paradigm
- Financial Literacy as Part of Empowerment Education for Later Life: A Spectrum of Perspectives, Challenges and Implications for Individuals, Educators and Policymakers in the Modern Digital Economy
- Special Issue: Economic Implications of Management and Entrepreneurship - Part II
- Ethnic Entrepreneurship: A Qualitative Study on Entrepreneurial Tendency of Meskhetian Turks Living in the USA in the Context of the Interactive Model
- Bridging Brand Parity with Insights Regarding Consumer Behavior
- The Effect of Green Human Resources Management Practices on Corporate Sustainability from the Perspective of Employees
- Special Issue: Shapes of Performance Evaluation in Economics and Management Decision - Part II
- High-Quality Development of Sports Competition Performance Industry in Chengdu-Chongqing Region Based on Performance Evaluation Theory
- Analysis of Multi-Factor Dynamic Coupling and Government Intervention Level for Urbanization in China: Evidence from the Yangtze River Economic Belt
- The Impact of Environmental Regulation on Technological Innovation of Enterprises: Based on Empirical Evidences of the Implementation of Pollution Charges in China
- Environmental Social Responsibility, Local Environmental Protection Strategy, and Corporate Financial Performance – Empirical Evidence from Heavy Pollution Industry
- The Relationship Between Stock Performance and Money Supply Based on VAR Model in the Context of E-commerce
- A Novel Approach for the Assessment of Logistics Performance Index of EU Countries
- The Decision Behaviour Evaluation of Interrelationships among Personality, Transformational Leadership, Leadership Self-Efficacy, and Commitment for E-Commerce Administrative Managers
- Role of Cultural Factors on Entrepreneurship Across the Diverse Economic Stages: Insights from GEM and GLOBE Data
- Performance Evaluation of Economic Relocation Effect for Environmental Non-Governmental Organizations: Evidence from China
- Functional Analysis of English Carriers and Related Resources of Cultural Communication in Internet Media
- The Influences of Multi-Level Environmental Regulations on Firm Performance in China
- Exploring the Ethnic Cultural Integration Path of Immigrant Communities Based on Ethnic Inter-Embedding
- Analysis of a New Model of Economic Growth in Renewable Energy for Green Computing
- An Empirical Examination of Aging’s Ramifications on Large-scale Agriculture: China’s Perspective
- The Impact of Firm Digital Transformation on Environmental, Social, and Governance Performance: Evidence from China
- Accounting Comparability and Labor Productivity: Evidence from China’s A-Share Listed Firms
- An Empirical Study on the Impact of Tariff Reduction on China’s Textile Industry under the Background of RCEP
- Top Executives’ Overseas Background on Corporate Green Innovation Output: The Mediating Role of Risk Preference
- Neutrosophic Inventory Management: A Cost-Effective Approach
- Mechanism Analysis and Response of Digital Financial Inclusion to Labor Economy based on ANN and Contribution Analysis
- Asset Pricing and Portfolio Investment Management Using Machine Learning: Research Trend Analysis Using Scientometrics
- User-centric Smart City Services for People with Disabilities and the Elderly: A UN SDG Framework Approach
- Research on the Problems and Institutional Optimization Strategies of Rural Collective Economic Organization Governance
- The Impact of the Global Minimum Tax Reform on China and Its Countermeasures
- Sustainable Development of Low-Carbon Supply Chain Economy based on the Internet of Things and Environmental Responsibility
- Measurement of Higher Education Competitiveness Level and Regional Disparities in China from the Perspective of Sustainable Development
- Payment Clearing and Regional Economy Development Based on Panel Data of Sichuan Province
- Coordinated Regional Economic Development: A Study of the Relationship Between Regional Policies and Business Performance
- A Novel Perspective on Prioritizing Investment Projects under Future Uncertainty: Integrating Robustness Analysis with the Net Present Value Model
- Research on Measurement of Manufacturing Industry Chain Resilience Based on Index Contribution Model Driven by Digital Economy
- Special Issue: AEEFI 2023
- Portfolio Allocation, Risk Aversion, and Digital Literacy Among the European Elderly
- Exploring the Heterogeneous Impact of Trade Agreements on Trade: Depth Matters
- Import, Productivity, and Export Performances
- Government Expenditure, Education, and Productivity in the European Union: Effects on Economic Growth
- Replication Study
- Carbon Taxes and CO2 Emissions: A Replication of Andersson (American Economic Journal: Economic Policy, 2019)