A non-invasive method of glucose monitoring using FR4 material based microwave antenna sensor
-
Anveshkumar Nella
 ,
Rabah Wasel Aldhaheri
,
Rabah Wasel Aldhaheri

Abstract
This work presents a unique non-invasive method for monitoring glucose levels in blood using a planar Yagi–Uda antenna as a microwave sensor. The proposed antenna, operating at 5.5 GHz, exhibits a directional radiation pattern with a peak gain of 6.74 dBi. A low-cost FR4 material of size 30 mm × 40 mm × 1.6 mm is used as a dielectric substrate. A human finger phantom, comprising layers of skin, fat, blood, and bone, is created at 5.5 GHz in EM simulation tool for mimicking a real human finger. The finger phantom is positioned at different locations around the antenna and corresponding frequency shifts are remarked to a variation in glucose concentration from 0–500 mg/dL. An exemplary frequency shift of maximum 26 MHz is recorded when the phantom is placed at the bottom of the antenna. Time domain analysis is also carried out to understand the effect of glucose concentration variation on the output signal amplitude and delay. Simulated antenna results are found to be in stupendous agreement with the measured results. An experiment of placing a real human finger around the fabricated antenna also presents a splendid correspondence with the simulated results. Hence, this mechanism can be expedient for monitoring glucose levels in blood.
1 Introduction
Diabetes is one of the major chronic diseases mainly characterized by very high sugar levels in the blood during a long time [1,2]. The common method to measure glucose levels is using finger shrill and glucometer, which is known as invasive method [3,4]. However, the invasive methods cause pain to the patient, as each time blood samples are to be picked. One solution for this problem is non-invasive method, where microwave filters or antennas are used to measure the glucose levels in the blood samples [5,6,7,8,9,10]. Also, these are prominently preferred in medical field due to no risk of ionization, deep penetration, immune to temperature, and other disturbances [11,12,13,14,15,16].
A novel microwave sensor was proposed by Jean et al. [17] and similarly another pressure sensing sensor was presented in a previous study [18]. Measurement of glucose levels by calculating dielectric properties using ring resonator is discussed in an earlier study [19]. Measurement of glucose in the presence of animal tissues using mm wave measurement techniques was discussed by Cano-Garcia et al. [20]. Similarly, various novel methods for calculating glucose concentration in blood samples more accurately were presented in previous studies [21,22,23,24,25,26,27]. Meta-materials also can be used in the detection of glucose as detailed in an earlier literature [28]. The current state-of-art-of the research on glucose level monitoring sensors and the need to develop more sensitive sensors are elaborately presented in the latest review articles [29,30]. In a previous study [31], a novel coplanar microwave sensor giving a frequency shift of 1.34 MHz is discussed. In another study [32], a non-invasive method of finding glucose concentration using dielectric resonator is presented giving a maximum shift of 2.81 kHz only. Mondal et al. [33] proposed microwave-assisted noninvasive microfluidic biosensor for monitoring glucose concentration, giving a maximum shift of 62.5 GHz. A novel method of finding salt and sugar concentrations in fluids was discussed by Islam et al. [34]. Split ring resonators can also be used to find glucose concentration as discussed in a previous study [35]. Design and in vitro interference test of microwave noninvasive blood glucose monitoring sensor with a maximum frequency shift of 2 MHz was discussed in another study [36]. In a previous study [37], the novel method of determining glucose concentration using non-invasive method was developed, where the sensor was integrated in a wrist watch. Recently, machine learning methods have become popular in determining the glucose concentration in the human blood samples [38]. In a previous study [39], another method of glucose monitoring based on the diffusion limited aggregation earlobe model was studied. Similarly, in another study [40], a novel HI-shaped antenna sensor was developed for predicting fluctuating glucose levels in the blood samples.
The present work handles a way of monitoring glucose levels in blood using a printed Yagi–Uda antenna at 5.5 GHz as a microwave sensor. A human finger phantom of length 30 mm, height 12 mm, and width 12 mm, comprising skin, fat, blood, and bone as layers is created in EM simulation software for evaluating blood glucose concentration. Frequency and time domain analyses are performed to find out the glucose concentration. The main contribution in the presented work is that the proposed microwave sensor is compact in nature and can measure glucose concentrations with more sensitivity and accuracy. The size of the sensor is only 30 × 12 mm2. All simulations are carried out using HFSS simulator. Rest of the article is discussed as follows. Section 2 presents the planar Yagi–Uda antenna design, study results, modeling of a finger phantom and associated study on frequency shifts for different positions of finger model, and various glucose level concentrations. Section 3 presents the time domain analysis of the proposed antenna. Section 4 presents the measured reflection coefficient study in the presence of a healthy human finger at various positions around the fabricated antenna and also the corresponding frequency shifts are measured. Section 5 concludes the work.
2 The proposed antenna design and finger phantom modeling
2.1 Antenna design
The proposed antenna considered for glucose level monitoring in blood is shown in Figure 1. The antenna is a planar inverted L-shaped Yagi–Uda type with three parasitic elements as shown in Figure 1(a). The ground plane consists of another inverted L-shaped stub as shown in Figure 1(b). The main idea in taking the Yagi–Uda shape in the proposed work is to get considerable amount of field variation surrounding the antenna since each of the parasitic elements taken on top and bottom of the antenna can pronounce more variations in the fringing fields. This field variation changes the effective dielectric constant of the medium thus giving the frequency shifts. The obtained frequency shifts are mapped to the variations in glucose concentration in the blood samples and thus the changes can be monitored effectively.
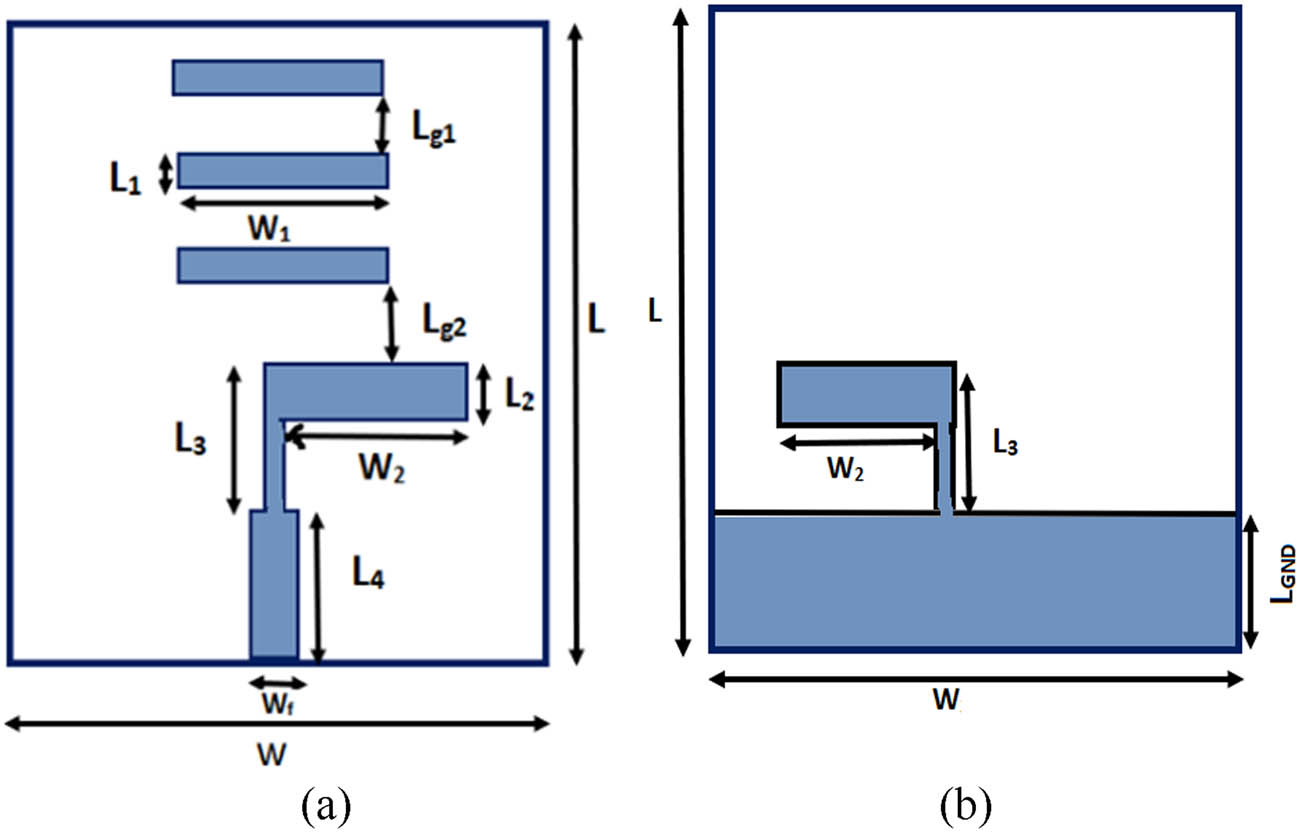
The proposed antenna: (a) top view and (b) bottom view.
Dimensions of various elements are mentioned in Table 1 and are optimized such that the antenna operates at 5.5 GHz. The three parasitic elements taken on the top of the substrate play key role in giving unidirectional radiation properties with enhanced gain, which is the main characteristic required for estimating the glucose level in the finger. Fabricated prototype of the proposed antenna is shown in Figure 2, where both top and bottom views of the antenna can be seen. The final dimensions of the antenna are obtained after performing extensive simulations on various dimensions of the antenna. The important parameters considered for parametric analysis are the radiating element length (W 2) and the ground length (L GND) as shown in Figure 3.
Dimensions of the proposed antenna
| Parameter | Dimension (mm) |
|---|---|
| L | 40 |
| W | 30 |
| L 1 | 2 |
| L 2 | 3.5 |
| L 3 | 8 |
| L 4 | 10 |
| L g1 | 4 |
| L g2 | 6 |
| W 1 | 10 |
| W 2 | 11 |
| L GND | 11 |
| W f | 3 |

Fabricated prototype: (a) top view, (b) bottom view, and (c) anechoic chamber with antenna prototype.
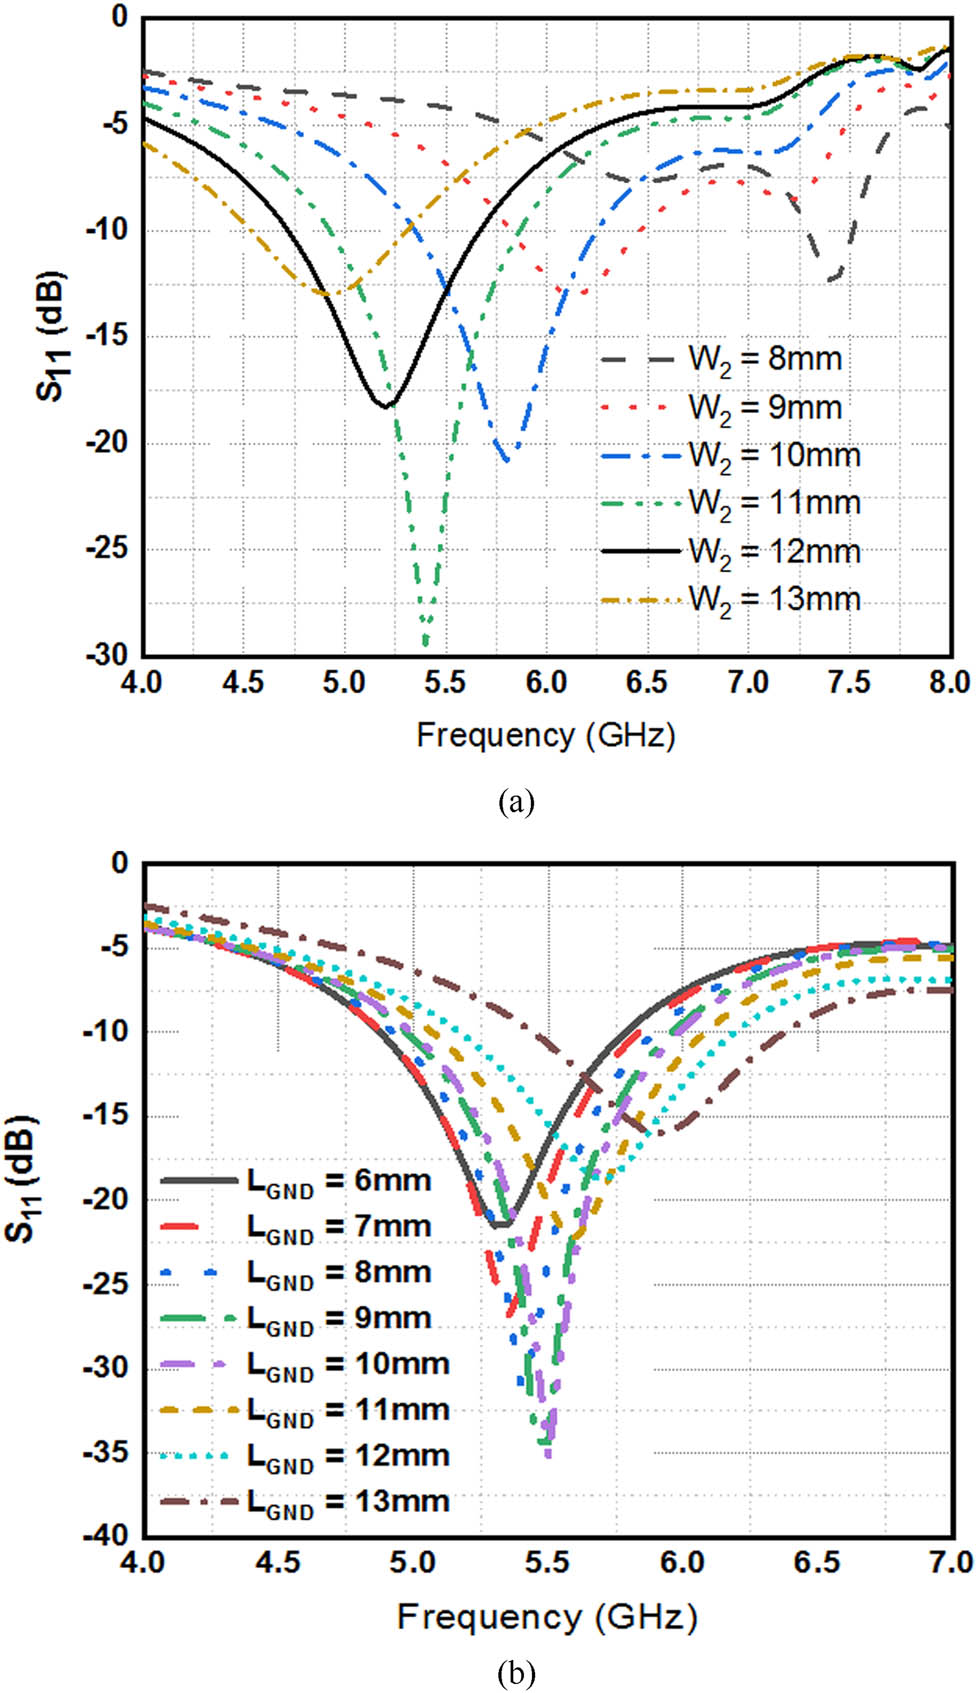
Parametric variation: (a) radiating element length (W 2) and (b) ground length (L GND).
From Figure 3(a), it is observed that good resonant behavior with minimum reflection coefficient is obtained for the selected length (W 2). Similarly, from Figure 3(b), it is observed that better reflection coefficient values are obtained for the ground length (L GND) of 11 mm and hence this value is considered in the design of antenna. The simulated and measured S-parameters of the proposed antenna are shown in Figure 4. It is observed that the proposed antenna resonates at 5.5 GHz and the simulated and measured results are well matched. The simulated and measured XY & YZ plane radiation patterns are shown in Figure 5. From the Figure 5, it is observed that the fabricated antenna gives good directional properties at 5.5 GHz, which is the desired characteristic for the antenna to be used for measuring glucose concentrations in finger phantoms. From the obtained radiation patterns, it is observed that the antenna is directional towards 90 deg. The 3D radiation pattern of the antenna shown in Figure 6 also confirms the directional behavior with a peak gain of 6.74 dBi.

Simulated and measured S11 (dB) of the proposed antenna.

Simulated and measured radiation patterns at 5.5 GHz on (a) XY-plane and (b) YZ-plane.
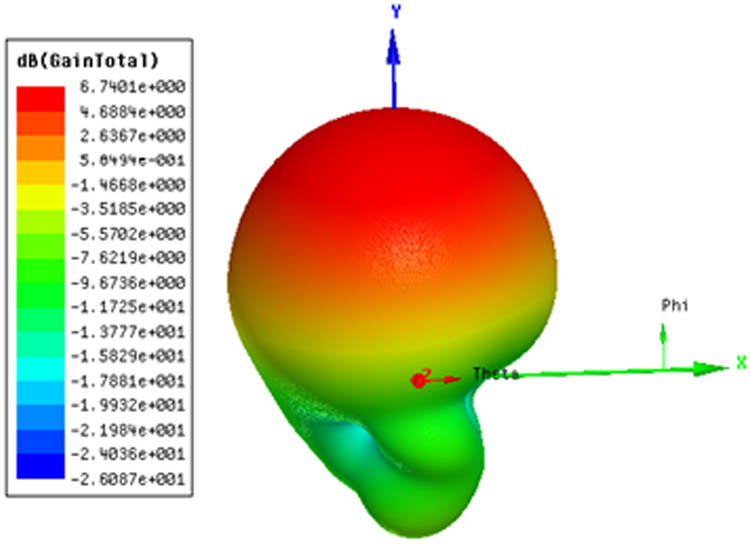
3D-radiation pattern at 5.5 GHz.
In order to obtain S-parameters and radiation patterns, Vector network analyzer with model name Agilent N5247A: A.09.90.02 is used. The radiation pattern measurements are carried out in anechoic chamber with dimensions 11.58 m × 7.29 m × 7.36 m (interior, with 0.4 m raised floor).
The absorber material has a power handling capability of 775 W/m2 with attenuation of more than 10 dB. The patterns are measured by keeping the distance between transmitter and receiver as 1.5 m. The surface current distribution of the proposed antenna at 5.5 GHz is also shown in Figure 7, from which it is observed that a considerable amount of current flows on the feed line and patch, making the antenna a good radiator at this particular frequency.

Surface current distribution at 5.5 GHz.
2.2 Modeling of finger phantom for glucose concentration monitoring
The main objective of the present research work is to design an antenna that can measure glucose concentration variations in the blood of a finger. To achieve this, a finger phantom model is created in the HFSS as shown in Figure 8 considering the structure of a real human finger. Various layers of the finger like skin, fat, blood, and bone are modeled using dielectric materials of different dielectric constants [29]. The central layer considered is the bone area of the finger, which is represented with pink color in Figure 8. Next to bone is the blood in the finger and is represented with green color. Next to blood is the fat and is represented with light green color and the last layer is the skin and is represented with gray color. The dielectric constant values of various tissues are calculated using various models like Debye model or Cole–Cole model and in general the later model is preferred in many cases. As per Cole–Cole model, the dielectric constants can be estimated using equation (1) [22].
where ω is the angular frequency, ε c′(ω) is the frequency-dependent dielectric constant, ε c″(ω) is the frequency-dependent dielectric loss, ε ∞ is the high frequency permittivity, ∆ε n is the magnitude of the dispersion, n is the order of the Cole–Cole model, α n is the parameter that allows for the broadening of the dispersion, σ i is the static ionic conductivity, and τ n is the relaxation time constant. Dielectric constant, conductivity, loss tangent at 5.5 GHz, and dimensions [32] of various layers of the finger phantom are given in Table 2.

Finger Phantom model: (a) squared cross section and (b) isometric view.
Dielectric constant, loss tangent, and dimensions of the antenna at 5.5 GHz
| Finger parameters | Skin | Fat | Blood | Bone |
|---|---|---|---|---|
| Dielectric constant value (ε r ) | 34.5 | 5 | 64.5 | 10 |
| Loss tangent | 0.255 | 0.245 | 0.375 | 0.37 |
| Dimension | S4 | S3 | S2 | S1 |
The different layers are considered in square shape, namely, bone layer as S1 of size 4 × 4 mm2, blood layer as S2 of size 9 × 9 mm2, fat layer as S3 of size 10 × 10 mm2, skin layer as S3 of size 12 × 12 mm2, and l = 30 mm. Dielectric constants and conductivity of the blood for various glucose concentrations at 5.5 GHz are shown in Table 3 as considered in the previous study [30]. The finger phantom is placed at various positions around the antenna like at bottom of the radiating element, bottom of the feed line, top of the radiating element, top of the feed line, and at top of directors. To illustrate, the case of finger phantom placed at the bottom of the antenna at 0.5 mm is shown in Figure 9. For each of the case, the change in reflection coefficient magnitude and frequency shift is studied by varying the concentration of glucose levels from 0 to 500 mg/dL in the finger phantom.
Dielectric constant and conductivity values for different glucose concentrations
| Glucose concentration (mg/dL) | 5.5 GHz | |
|---|---|---|
| ε r | Loss tangent | |
| 0 | 64.5 | 0.375 |
| 125 | 64.25 | 0.377 |
| 250 | 64 | 0.378 |
| 500 | 63.5 | 0.381 |

Phantom placed at the bottom of antenna at 0.5 mm: (a) side view and (b) slant view.
In the first case, finger phantom is placed below the antenna at 0.5 mm with glucose concentration varying from 0 to 500 mg/dL and the resulting S11-parameters are shown in Figure 10(a). From the graph, it is observed that the frequency shifts right side, when the glucose concentration increases. For 0 mg/dL glucose concentration, the antenna resonates at 5.524 GHz. When the glucose concentration is increased, a clear frequency shift is observed and for each step of increase in glucose level, a minimum shift of 3 MHz is observed. Hence, the proposed antenna is a suitable choice for measuring the glucose concentrations in blood since a clear frequency shift is observed for the change in glucose levels. Similarly, in the next case, the finger phantom is placed below the antenna at 1 mm and the resulting S11-parameters for glucose concentration variation are shown in Figure 10(b). From the figure, it is observed that a maximum shift of 26 MHz is observed, when the glucose concentration changes from 250 to 500 mg/dL.

(a)–(f) S11-Parameters for various phantom positions. (a) Phantom at bottom of antenna at 0.5 mm, (b) phantom at bottom of antenna at 1 mm, (c) phantom at bottom of feed at 0 mm, (d) phantom at top of antenna at 1 mm, (e) phantom at top of antenna at 1.5 mm, and (f) phantom at top of feed at 1.5 mm.
Similarly, finger phantom is placed at the bottom of feed at 0 mm and the resulting S11-parameters for glucose concentration variation are shown in Figure 10(c). However, in this case no shift in frequency is observed and is not the useful case for glucose measurement. Next the phantom is placed at the top of antenna at 1 mm and the resulting S11-parameters are shown in Figure 10(d). In this case, a maximum shift of 2 MHz is observed. In the next case, the phantom is placed at the top of antenna at 1.5 mm and corresponding S11-parameters for glucose variation are shown in Figure 10(e) and a maximum shift of 4 MHz is observed. In the last case, the phantom is positioned at the top of feed at 1.5 mm and the corresponding S11-parameters are shown in Figure 10(f) and in this case, a maximum shift of 8 MHz is observed.
The sensitivity plot is given in Figure 11 along with the electric field distribution for various cases. For all the cases, the summary of resultant resonant frequencies obtained and the corresponding S11-parameters magnitudes are given in Table 4. Similarly, the obtained frequency shifts for various glucose concentrations are given in Table 5, from which it is concluded that, when the finger phantom is placed at the bottom of antenna at 1 mm, the obtained frequency shift is satisfactory and a maximum frequency shift of 26 MHz is observed, when the glucose concentration varies from 250 to 500 mg/dL. The physical reason behind the frequency shift in this case is mainly owing to the electric field distribution surrounding the antenna. More variation in electric field on the antenna is required for glucose level measurements. This is owing to the more variation in fringing fields on the antenna resulting in considerable change in the dielectric constant of the antenna, which in turn gives considerable frequency shift when the finger phantom is placed near the antenna. In the present case, at the bottom of the antenna, more variation in fringing field is observed resulting in a maximum frequency shift of 26 MHz.

(a)–(f) Sensitivity and E-field distributions for phantom at the bottom of antenna at 1 mm. (a) Sensitivity, (b) glucose concentration vs frequency, (c) E-field distribution for 0 mg/dL, (d) E-field distribution for 125 mg/dL, (e) E-field distribution for 250 mg/dL, and (f) E-field distribution for 500 mg/dL.
Summary of resonant frequencies for various finger positions
| Position of finger phantom | Glucose concentration | |||||||
|---|---|---|---|---|---|---|---|---|
| 0 mg/dL | 125 mg/dL | 250 mg/dL | 500 mg/dL | |||||
| f r (GHz) | S11 (dB) | f r (GHz) | S11 (dB) | f r (GHz) | S11 (dB) | f r (GHz) | S11 (dB) | |
| Bottom of antenna at 0.5 mm | 5.524 | −13.225 | 5.530 | −13.242 | 5.533 | −13.192 | 5.537 | −13.178 |
| Bottom of antenna at 1 mm | 5.749 | −15.241 | 5.754 | −15.258 | 5.759 | −15.160 | 5.785 | −14.75 |
| Bottom of feed at 0 mm | 5.496 | −20.284 | 5.496 | −20.156 | 5.496 | −20.156 | 5.496 | −20.584 |
| Top of antenna 1 mm | 5.811 | −19.189 | 5.813 | −19.277 | 5.814 | −19.340 | 5.815 | −19.262 |
| Top of antenna at 1.5 mm | 5.901 | −20.206 | 5.903 | −20.270 | 5.904 | −20.233 | 5.908 | −20.286 |
| Top of feed at 1.5 mm | 5.698 | −23.849 | 5.702 | −23.654 | 5.702 | −23.599 | 5.710 | −24.869 |
Summary of frequency shifts for different finger positions at varying glucose concentrations from 0 to 500 mg/dL
| 0 mg/dL | 125 mg/dL | 250 mg/dL | 500 mg/dL | |
|---|---|---|---|---|
| Frequency shift (MHz) | Frequency shift (MHz) | Frequency shift (MHz) | Frequency shift (MHz) | |
| Bottom of antenna at 0.5 mm | — | 6 | 3 | 4 |
| Bottom of antenna at 1 mm | – | 5 | 5 | 26 |
| Bottom of feed at 0 mm | — | 0 | 0 | 0 |
| Top of antenna 1 mm | — | 2 | 1 | 1 |
| Top of antenna at 1.5 mm | — | 2 | 1 | 4 |
| Top of feed at 1.5 mm | — | 3 | 0 | 8 |
Bold is required as the sensor performs better for these values.
3 Time domain analysis for glucose concentration
In this method, the two antennas are placed face-to-face and side-by-side with a separation of 75 mm between them as shown in Figure 12. An input sinusoidal signal is applied to one antenna and the output signal is obtained at the other antenna. From the obtained output waveforms, it is observed that the amplitude of output signal is reduced to 0.0014 V from 1 V and also a delay of 0.0572 ns is observed. This obtained output amplitude can be used to determine the glucose concentration in the blood samples. In the measurement of glucose concentration, the proposed finger phantom is placed between the two antennas and the output signal amplitude and time delay are calculated for various glucose concentrations and the obtained time delays for both cases are shown in Tables 6 and 7. From the values given in the Table, it is observed that the the amplitude of ouput signal changes as the glucose concentration increases. However,the changes in output amplitude are irregular and not consistent and hence this case is not preferred in the estimation of glucose concentration.

Finger phantom between the antennas: (a) face-to-face and (b) side-by-side.
Variations in S-parameters, time delay, and output voltage w.r.t glucose concentration for antennas placed face-to-face
| Model type | S11 (dB) at 5.5 GHz | S21 (dB) at 5.5 GHz | V in (V) | V out (V) | Time delay (ns) |
|---|---|---|---|---|---|
| Single antenna | −30.182326 | — | — | — | — |
| Two antennas at 75 mm | −21.351425 | −14.501239 | 1 | 0.18067174 | 0.21436999 |
| Two antennas with finger model 0 mg/dL | −21.269056 | −15.707635 | 1 | 0.14737162 | 0.29895061 |
| Two antennas with finger model 125 mg/dL | −21.568902 | −15.742583 | 1 | 0.14729108 | 0.29605633 |
| Two antennas with finger model 250 mg/dL | −21.350929 | −15.665381 | 1 | 0.14707619 | 0.29601038 |
| Two antennas with finger model 500 mg/dL | −21.521494 | −15.725165 | 1 | 0.14705056 | 0.29603598 |
| Two antennas with finger model 750 mg/dL | −21.691845 | −15.767268 | 1 | 0.14698879 | 0.29604319 |
Variations in S-parameters, time delay, and output voltage w.r.t glucose concentration for antennas placed side-by-side
| Antenna type | S11 (dB) at 5.5 GHz | S21 (dB) at 5.5 GHz | V in (V) | V out (V) | Time delay (ns) |
|---|---|---|---|---|---|
| Single antenna | −30.182326 | — | — | — | — |
| Two antennas at 75 mm | −21.341072 | −43.296037 | 1 | 0.0041608308 | 0.057240114 |
| Two antennas with finger model 0 mg/dL | −22.032296 | −49.84769 | 1 | 0.0062503358 | 0.079480223 |
| Two antennas with finger model 125 mg/dL | −21.092947 | −50.003195 | 1 | 0.0062492765 | 0.079466999 |
| Two antennas with finger model 250 mg/dL | −21.055277 | −49.350883 | 1 | 0.0062537091 | 0.079466999 |
| Two antennas with finger model 500 mg/dL | −19.772386 | −51.216238 | 1 | 0.0062497146 | 0.079449221 |
| Two antennas with finger model 750 mg/dL | −22.054224 | −50.414067 | 1 | 0.0062483377 | 0.079449043 |
4 Measurement of reflection coefficient for different glucose concentrations
Further to validate the performance of the proposed antenna, finger of a normal healthy person is placed at various positions around the antenna and shifts in the frequency are measured. It is to be noted that this experimental study is performed just only to show a frequency shift in various positions of finger and not to compare with the exact simulated results. The reason is that the real human finger has same level of glucose concentration for all the positional cases. Moreover, fabrication and improper testing issues also create differences between simulation and measurement results. In Figure 13, photographs of the finger placed near the antenna at different positions are shown. For all the corresponding positions of the finger, S11-parameters are measured and are presented in Figure 14. From the figure, it is clearly observed that, when no finger is placed near the antenna, it resonates at 5.5 GHz with the magnitude of reflection coefficient as −33 dB. When the finger is kept in front of the antenna at 5 mm separation as shown in Figure 13(b), the resonant frequency shifts to the right side by 80 MHz with −30 dB of reflection coefficient magnitude. When the finger is placed on the top of the feedline with 0.5 mm spacing as shown in Figure 13(c), 150 MHz frequency shift is observed towards the right side with −32 dB of reflection coefficient magnitude.

Measurement of reflection coefficient by keeping finger at various positions: (a) No finger, (b) in front of the antenna, (c) top of the feed line, (d) top of the radiating element, (e) bottom of the feed, and (f) bottom of the antenna.

Measured S11-parameter values for various positions of the finger around the antenna.
When the finger is placed on the top of the radiating element with 0.5 mm gap as shown in Figure 13(d), a shift of 25 MHz with −28 dB of reflection coefficient magnitude is observed. When the finger is placed at the bottom of feed line with 0.5 mm spacing as shown in Figure 13(e), a frequency shift of 20 MHz is observed. Similarly, when the finger is placed at the bottom of the radiating element with 0.5 mm spacing as shown in Figure 13(f), a 60 MHz frequency shift with −40 dB reflection coefficient is observed. Summary of all the cases with the amount of frequency shift and reflection coefficient magnitude are shown in Table 8. From the frequency shift values observed in Table 5 and from the discussion in Section 3, the better position to place the finger to measure the variation in glucose concentrations is near the bottom of the radiating element. This is because, a clear frequency shift is observed when the finger of a healthy person or a glucose concentration varying finger is placed below the antenna. The performance of the proposed antenna is compared with some existing antennas in the literature that are used in the glucose level monitoring and are given in Table 9. Compared to the other existing works in the literature, the sensor proposed in the present work gives clear frequency shift values.
Measured frequency shift and reflection coefficient magnitude for various positions of the finger
| Position of Finger | Frequency shift (MHz) | Reflection coefficient (dB) |
|---|---|---|
| Without finger | — | −34.02 |
| In front of antenna | 80 | −29.62 |
| Top of feed line | 150 | −32.18 |
| Top of radiating element | 25 | −28.9 |
| Bottom of feed line | 20 | −43.88 |
| Bottom of radiating element | 60 | −40.8 |
Comparison with literature
| Ref. | Technology | Design complexity and cost | Operating frequency (GHz) | Freq. shift (MHz) |
|---|---|---|---|---|
| [31] | Non-invasive finger placed on planar resonator | Moderate and moderate cost | 1.8 | 1.34 |
| [32] | Non-invasive finger placed on dielectric resonator | Complex and costly | 4.7 | 0.00281 |
| [33] | Invasive method by extracting fluids | Moderate and low cost | 5.41 | 0.0625 |
| [34] | Microstrip antenna sensor | Simple and low cost | 2.5–18 | NA |
| [35] | Non-invasive wearable split ring resonator | Complex and Moderate | 1.5 | 0.005 |
| [36] | Interdigitated capacitor resonator-etched (CPW) | Complex and costly | 2.46 | 2 |
| This work | Non-invasive method using planar Yagi– Uda antenna | Simple and low cost | 5.5 | 26 |
Bold is required as the values represent for proposed sensor.
The work mentioned in the previous study [31] developed a novel CPW sensor for measuring glucose concentration at 1.8 GHz operating frequency. However, the work mentions the glucose concentrations up to 16,000 mg/dL, which is practically not required. In another study [32], the authors presented a novel dielectric resonator antenna for evaluating glucose concentrations at 4.7 GHz, which also carries the calculations up to 16,000 mg/dL. A microfluidic biosensor developed by Mondal et al. [33] measures glucose concentration at 5.4 GHz. In another study [34], authors presented the novel design of a microstrip sensor operating in the wideband of 2.5–18 GHz, which has the main limitation of practical reliability. Another paper [35] presented a novel split ring resonator for measuring glucose concentration; however, gave a maximum shift of only 5 kHz. Similarly, Tiwari et al. [36] presented the design of a flexible biomedical RF sensors for monitoring glucose concentration, operating at 2.46 GHz. However, the system design is complex and practically difficult to implement. However, the proposed antenna sensor operates at 5.5 GHz giving a maximum shift of 26 MHz, making the proposed antenna sensor more sensitive to the glucose levels variation. Hence, compared to the other existing works in the literature, the sensor proposed in the present work gives clear frequency shift values.
5 Conclusion
A planar Yagi–Uda antenna operating at 5.5 GHz and exhibiting a directional radiation pattern with a peak gain of 6.74 dBi is developed for measuring the glucose level concentrations in blood. A finger phantom is placed at various positions around the antenna and the corresponding frequency shifts are observed. The amount of shift in the resonant frequency is used to estimate the glucose concentration in the finger phantom. From the obtained results, it is observed that better frequency shift of maximum of 26 MHz is obtained if the finger is placed at the bottom of the radiating element. Hence, the proposed sensor can be used for applications such as
To measure glucose levels in the diabetic patient in the range of 0–500 mg/dL.
In glucose monitoring, where high sensitivity and more accuracy in the measurement results are the main criteria as the proposed sensor gives good frequency shifts.
Acknowledgments
This work is funded by the Deanship of Scientific Research (DSR) at King Abdulaziz University, Jeddah, Saudi Arabia under Grant No (RG-98-135-42).
-
Conflict of interest: Authors state no conflict of interest.
References
[1] Lin X, Xu Y, Pan X, Xu J, Ding Y, Sun X, et al. Global, regional, and national burden and trend of diabetes in 195 countries and territories: An analysis from 1990 to 2025. Sci Rep. 2020;10(1):1–11.10.1038/s41598-020-71908-9Search in Google Scholar PubMed PubMed Central
[2] Saeedi P, Petersohn I, Salpea P, Malanda B, Karuranga S, Unwin N & IDF Diabetes Atlas Committee. Global and regional diabetes prevalence estimates for 2019 and projections for 2030 and 2045: Results from the International Diabetes Federation Diabetes Atlas. Diabetes Res Clin Pract. 2019;157:68–76.10.1016/j.diabres.2019.107843Search in Google Scholar PubMed
[3] Villena Gonzales W, Mobashsher AT, Abbosh A. The progress of glucose monitoring – A review of invasive to minimally and non-invasive techniques, devices and sensors. Sensors. 2019;19(4):1–45.10.3390/s19040800Search in Google Scholar PubMed PubMed Central
[4] Juan CG, Bronchalo E, Potelon B, Quendo C, Ávila-Navarro E, Sabater-Navarro JM. Concentration measurement of microliter-volume water–glucose solutions using Q - factor of microwave sensors. IEEE Trans Instrum Meas. 2018;68(7):2621–34.10.1109/TIM.2018.2866743Search in Google Scholar
[5] Kumar DA, Jayanthy T. Review on non-invasive blood glucose measurement techniques. International Conference on Communication and Signal Processing (ICCSP). IEEE; 2020. p. 981–6.10.1109/ICCSP48568.2020.9182268Search in Google Scholar
[6] Omer AE, Shaker G, Safavi-Naeini S, Alquié G, Deshours F, Kokabi H, et al. Non-invasive real-time monitoring of glucose level using novel microwave biosensor based on triple-pole CSRR. IEEE Trans Biomed Circuits Syst. 2020;14(6):1407–20.10.1109/TBCAS.2020.3038589Search in Google Scholar PubMed
[7] Freer B, Venkataraman J. Feasibility study for non-invasive blood glucose monitoring. In Proceedings of the 2010 IEEE Antennas and Propagation Society International Symposium (APSURSI). Toronto, Canada; Nov. 11–17, 2010. p. 1–4.10.1109/APS.2010.5561003Search in Google Scholar
[8] Yilmaz T, Ozturk T, Joof S. A comparative study for development of microwave glucose sensors. In Proceedings of the 32nd URSI GASS. Montreal, QC, Canada; 2017, 19–26, p. 1–4.Search in Google Scholar
[9] Vrba J, Karch J, Vrba D. Phantoms for development of microwave sensors for non-invasive blood glucose monitoring. Int J Antennas Propag. 2015;2015:1–14.Search in Google Scholar
[10] Yee SK, Lim SCJ, Pong PS, Dahlan SH. Microstrip defected ground structure for determination of blood glucose concentration. Prog Electromagn Res C. 2020;99:35–48.10.2528/PIERC19110501Search in Google Scholar
[11] Ciudin A, Hernández C, Simó R. Non-invasive methods of glucose measurement: current status and future perspectives. Curr Diabetes Rev. 2012;8(1):48–54.10.2174/157339912798829197Search in Google Scholar PubMed
[12] Choi H, Luzio S, Beutler J, Porch A. Microwave noninvasive blood glucose monitoring sensor: Human clinical trial results. IEEE MTT-S International Microwave Symposium (IMS). IEEE; 2017. p. 876–9.10.1109/MWSYM.2017.8058721Search in Google Scholar
[13] Li Q, Xiao X, Kikkawa T. Absorption spectrum for non-invasive blood glucose concentration detection by microwave signals. J Electromagn Waves Appl. 2019;33(19):1093–106.10.1080/09205071.2019.1596168Search in Google Scholar
[14] Gusev M, Poposka L, Spasevski G, Kostoska M, Koteska B, Simjanoska M, et al. Noninvasive glucose measurement using machine learning and neural network methods and correlation with heart rate variability. J Sens. 2020;2020:1–13.10.1155/2020/9628281Search in Google Scholar
[15] Xiao X, Li Q. A noninvasive measurement of blood glucose concentration by UWB microwave spectrum. IEEE Antennas Wirel Propag Lett. 2016;160:1040–3.10.1109/LAWP.2016.2618946Search in Google Scholar
[16] Yilmaz T, Foster R, Hao Y. Radio-frequency and microwave techniques for non-invasive measurement of blood glucose levels. Diagnostics. MDPI. 2019;9(1):1–34.10.3390/diagnostics9010006Search in Google Scholar PubMed PubMed Central
[17] Jean BR, Green EC, McClung MJ. A microwave frequency sensor for non-invasive blood-glucose measurement. In IEEE Sensors Applications Symp. Atlanta, GA, 2008. p. 4–7.10.1109/SAS.2008.4472932Search in Google Scholar
[18] Turgul V, Kale I. A novel pressure sensing circuit for noninvasive RF/microwave blood glucose sensor. IEEE Conference Mediterrannean Microwave Symposium (MMS); 2016. p. 512–6.10.1109/MMS.2016.7803818Search in Google Scholar
[19] Deshmukh VV, Ghongade RB. Measurement of dielectric properties of aqueous glucose using planar ring resonator. IEEE International Conference on Microelectronics, Computing and Communications (MicroCom); 2016. p. 42–6.10.1109/MicroCom.2016.7522542Search in Google Scholar
[20] Cano-Garcia H, Gouzouasis I, Sotiriou I, Saha S, Palikaras G, Kosmas P, et al. Reflection and transmission measurements using 60 GHz patch antennas in the presence of animal tissue for non-invasive glucose sensing. In Proceedings of the 10th European Conference on Antennas and Propagation (EuCAP). Davos, Switzerland; 2016. p. 1–3.10.1109/EuCAP.2016.7481178Search in Google Scholar
[21] Liu LW, Kandwal A, Cheng Q, Shi H, Tobore I, Nie Z. Non-invasive blood glucose monitoring using a curved Goubau line. Electronics, MDPI. 2019;8:662–74.10.3390/electronics8060662Search in Google Scholar
[22] Karacolak T, Moreland EC, Topsakal E. Cole–cole model for glucose dependent dielectric properties of blood plasma for continuous glucose monitoring. Microw Opt Technol Lett. 2013;55(5):1160–4.10.1002/mop.27515Search in Google Scholar
[23] Vrba J, Karch J, Vrba D. Phantoms for development of microwave sensors for noninvasive blood glucose monitoring. Int J Antennas Propag. 2015;2015:1–5, Article ID: 57087010.1155/2015/570870Search in Google Scholar
[24] Yilmaz T, Karacolak T, Topsakal E. Characterization and testing of a skin mimicking material for implantable antennas operating at ISM band (2.4 GHz–2.48 GHz). IEEE Antennas Wirel Propag Lett. 2008;7:418–20.10.1109/LAWP.2008.2001736Search in Google Scholar
[25] Young PR, Aanandan CK, Mathew T, Krishna DD. Wearable antennas and systems. Int J Antennas Propag. 2012;2012:1–2, Article ID: 573202.10.1155/2012/573202Search in Google Scholar
[26] Abedeen Z, Agarwal P. Microwave sensing technique based label-free and real-time planar glucose analyzer fabricated on FR4. Sens Actuators A Phys. 2018;279:132–9.10.1016/j.sna.2018.06.011Search in Google Scholar
[27] Turgul V, Kale I. Influence of fingerprints and finger positioning on accuracy of RF blood glucose measurement from fingertips. Electron Lett. 2017;53:218–20.10.1049/el.2016.4327Search in Google Scholar
[28] Vrba J, Vrba D, Díaz L, Fišer O. Metamaterial sensor for microwave non-invasive blood glucose monitoring. IFMBE Proc. 2019;68:789–92.10.1007/978-981-10-9023-3_143Search in Google Scholar
[29] Khan AN, Cha YO, Giddens H, Hao Y. Recent advances in organ specific wireless bioelectronic devices: Perspective on biotelemetry and power transfer using antenna systems. Engineering; Elsevier; 2022.10.1016/j.eng.2021.10.019Search in Google Scholar
[30] Palmer C. Advanced devices ease burden of glucose monitoring for diabetics. Engineering. Amsterdam, Holland: Elsevier. Vol. 5; 2021. p. 547–9.10.1016/j.eng.2021.03.008Search in Google Scholar
[31] Cebedio MC, Rabioglio LA, Gelosi IE, Ribas RA, Uriz AJ, Moreira JC. Analysis and design of a microwave coplanar sensor for non-invasive blood glucose measurements. IEEE Sens J. 2020;20(18):10572–81.10.1109/JSEN.2020.2993182Search in Google Scholar
[32] Hasan MN, Tamanna S, Singh P, Nadeem MD, Rudramuni M. Cylindrical dielectric resonator antenna sensor for non-invasive glucose sensing application. In Proc. 6th Int. Conf. Signal Process. Integr. Netw. (SPIN); 2019. p. 961–4.10.1109/SPIN.2019.8711633Search in Google Scholar
[33] Mondal D, Tiwari NK, Akhtar MJ. Microwave assisted noninvasive microfluidic biosensor for monitoring glucose concentration. In Proc IEEE Sensors; 2018. p. 1–4.10.1109/ICSENS.2018.8589919Search in Google Scholar
[34] Islam MT, Rahman MN, Singh MSJ, Samsuzzaman M. Detection of salt and sugar contents in water on the basis of dielectric properties using microstrip antenna-based sensor. IEEE Access. 2018;6:4118–26.10.1109/ACCESS.2017.2787689Search in Google Scholar
[35] Choi H, Naylon J, Luzio S, Beutler J, Birchall J, Martin C, et al. Design and in vitro interference test of microwave noninvasive blood glucose monitoring sensor. IEEE Trans Microw Theory Techn. 2015;63(10):3016–25.10.1109/TMTT.2015.2472019Search in Google Scholar PubMed PubMed Central
[36] Tiwari NK, Singh SP, Mondal D, Akhtar MJ. Flexible biomedical RF sensors to quantify the purity of medical grade glycerol and glucose concentrations. Int J Microw Wirel Technol. 2020;12(2):120–30.10.1017/S1759078719001089Search in Google Scholar
[37] Chang T, Li H, Zhang N, Jiang X, Yu X, Yang Q, et al. Highly integrated watch for noninvasive continual glucose monitoring. Microsyst Nanoeng. 2022;8:25.10.1038/s41378-022-00355-5Search in Google Scholar PubMed PubMed Central
[38] Agrawal H, Jain P, Joshi AM. Machine learning models for non-invasive glucose measurement: towards diabetes management in smart healthcare. Health Technol. 2022;12:955–70.10.1007/s12553-022-00690-7Search in Google Scholar PubMed PubMed Central
[39] Yang C, Xiao X, Hu M, Wang Z. Non‐invasive microwave blood glucose monitoring based on the diffusion limited aggregation earlobe model. Int J RF Microw Comput Eng. 2022;32(12):1–9.10.1002/mmce.23443Search in Google Scholar
[40] SJ JK, Ananadan P, Shanker NR. Hi Shaped antenna for non-invasive diabetic measurement and monitors fluctuating diabetes. Res Sq. 2022. 10.21203/rs.3.rs-1761742/v1.Search in Google Scholar
© 2023 the author(s), published by De Gruyter
This work is licensed under the Creative Commons Attribution 4.0 International License.
Articles in the same Issue
- Regular Articles
- Effects of cellulose nanofibers on flexural behavior of carbon-fiber-reinforced polymer composites with delamination
- Damage mechanisms of bismaleimide matrix composites under transverse loading via quasi-static indentation
- Experimental study on hydraulic fracture behavior of concrete with wedge-splitting testing
- The assessment of color adjustment potentials for monoshade universal composites
- Metakaolin-based geopolymers filled with volcanic fly ashes: FT-IR, thermal characterization, and antibacterial property
- The effect of temperature on the tensile properties and failure mechanisms of two-dimensional braided composites
- The influence of preparation of nano-ZrO2/α-Al2O3 gradient coating on the corrosion resistance of 316L stainless steel substrate
- A numerical study on the spatial orientation of aligning fibrous particles in composites considering the wall effect
- A simulative study on the effect of friction coefficient and angle on failure behaviors of GLARE subjected to low-velocity impact
- Impact resistance capacity and degradation law of epoxy-coated steel strand under the impact load
- Analytical solutions of coupled functionally graded conical shells of revolution
- The influence of water vapor on the structural response of asphalt pavement
- A non-invasive method of glucose monitoring using FR4 material based microwave antenna sensor
- Chloride ion transport and service life prediction of aeolian sand concrete under dry–wet cycles
- Micro-damage analysis and numerical simulation of composite solid propellant based on in situ tensile test
- Experimental study on the influence of high-frequency vibratory mixing on concrete performance
- Effects of microstructure characteristics on the transverse moisture diffusivity of unidirectional composite
- Gradient-distributed ZTAp-VCp/Fe45 as new anti-wear composite material and its bonding properties during composite casting
- Experimental evaluation of velocity sensitivity for conglomerate reservoir rock in Karamay oil field
- Mechanical and tribological properties of C/C–SiC ceramic composites with different preforms
- Mechanical property improvement of oil palm empty fruit bunch composites by hybridization using ramie fibers on epoxy–CNT matrices
- Research and analysis on low-velocity impact of composite materials
- Optimizing curing agent ratios for high-performance thermosetting phthalonitrile-based glass fibers
- Method for deriving twisting process parameters of large package E-glass yarn by measuring physical properties of bobbin yarn
- A probability characteristic of crack intersecting with embedded microcapsules in capsule-based self-healing materials
- An investigation into the effect of cross-ply on energy storage and vibration characteristics of carbon fiber lattice sandwich structure bionic prosthetic foot
- Preparation and application of corona noise-suppressing anti-shedding materials for UHV transmission lines
- XRD analysis determined crystal cage occupying number n of carbon anion substituted mayenite-type cage compound C12A7: nC
- Optimizing bending strength of laminated bamboo using confined bamboo with softwoods
- Hydrogels loaded with atenolol drug metal–organic framework showing biological activity
- Creep analysis of the flax fiber-reinforced polymer composites based on the time–temperature superposition principle
- A novel 3D woven carbon fiber composite with super interlayer performance hybridized by CNT tape and copper wire simultaneously
- Effect of aggregate characteristics on properties of cemented sand and gravel
- An integrated structure of air spring for ships and its strength characteristics
- Modeling and dynamic analysis of functionally graded porous spherical shell based on Chebyshev–Ritz approach
- Failure analysis of sandwich beams under three-point bending based on theoretical and numerical models
- Study and prediction analysis on road performance of basalt fiber permeable concrete
- Prediction of the rubberized concrete behavior: A comparison of gene expression programming and response surface method
- Study on properties of recycled mixed polyester/nylon/spandex modified by hydrogenated petroleum resin
- Effect of particle size distribution on microstructure and chloride permeability of blended cement with supplementary cementitious materials
- In situ ligand synthesis affording a new Co(ii) MOF for photocatalytic application
- Fracture research of adhesive-bonded joints for GFRP laminates under mixed-mode loading condition
- Influence of temperature and humidity coupling on rutting deformation of asphalt pavement
- Review Articles
- Sustainable concrete with partial substitution of paper pulp ash: A review
- Durability and microstructure study on concrete made with sewage sludge ash: A review (Part Ⅱ)
- Mechanical performance of concrete made with sewage sludge ash: A review (Part Ⅰ)
- Durability and microstructure analysis of concrete made with volcanic ash: A review (Part II)
- Communication
- Calculation of specific surface area for tight rock characterization through high-pressure mercury intrusion
- Special Issue: MDA 2022
- Vibration response of functionally graded material sandwich plates with elliptical cutouts and geometric imperfections under the mixed boundary conditions
- Analysis of material removal process when scratching unidirectional fibers reinforced polyester composites
- Tailoring the optical and UV reflectivity of CFRP-epoxy composites: Approaches and selected results
- Fiber orientation in continuous fiber-reinforced thermoplastics/metal hybrid joining via multi-pin arrays
- Development of Mg-based metal matrix biomedical composites for acicular cruciate ligament fixation by reinforcing with rare earth oxide and hydroxyapatite – A mechanical, corrosion, and microstructural perspective
- Special Issue: CACMSE
- Preparation and application of foamed ceramic panels in interior design