The influence of water vapor on the structural response of asphalt pavement
-
Youhua Zhang
 ,
Xianfeng Tan
,
Xianfeng Tan

Abstract
A series of water damage phenomena of asphalt pavement during service show that water is very important. To comprehensively analyze the influence of water vapor factors on the response of pavement structure, this article first tests the water vapor diffusion coefficient of asphalt pavement materials at different temperatures establishes the water vapor concentration field model of the pavement structure, and analyzes the actual water vapor distribution of the pavement structure; then, the relationship between viscoelastic parameters of the mixture and water vapor concentration is established. Based on this, the finite element model of the pavement structure considering the water vapor factor is established, and the influence of the water vapor factor on the pavement structure response and fatigue life is quantified. It is found that water vapor has an important influence on the mechanical response. On the hottest days in summer, the attenuation of surface modulus caused by water vapor has the greatest impact on the upper layer of the pavement structure. Under the influence of water vapor, the position just below the wheel of the upper layer at the bottom of the horizontal tension strain increases by 108.26%, and the horizontal tension strain of the other layers increases by about 5%, increasing the risk of upper layer cracking. At the same time, water vapor reduces the stress that can be borne by the surface layer, while the rest of the stress is borne by the base. Compared with the fatigue life calculation method in the specification, the actual non-uniform water vapor concentration field reduces the fatigue life of the surface layer by 12.246%. This shows that the current structural calculation does not consider the water vapor factor, which makes the pavement structure more dangerous, and the influence of the water vapor factor should be fully considered.
1 Introduction
In the field of road construction in China, asphalt pavement has become the main pavement form of expressways and other highways because of its advantages of smoothness, less dust, and smooth, and comfortable driving. Water damage is one of the common early damages of asphalt pavement; in severe cases, it affects traffic safety and shortens the service life of asphalt pavement. The traditional view holds that the water damage of asphalt pavement is mainly caused by liquid water, which affects the performance of the asphalt pavement structure through rainfall infiltration and rising capillary water. However, the phenomenon of water damage in many arid areas shows that liquid water is not the only source of water damage, and the influence of water vapor on the pavement structure and performance is also huge [1,2,3,4]. Compared with short-term rainfall and other liquid water effects, the pavement structure is at a certain water vapor concentration for a long time [4]. Under the long-term action of the water vapor, the performance of asphalt decreases and affects the adhesion of asphalt itself and between the asphalt and aggregate [5]. Therefore, it is necessary to study the influence of water vapor on the response of the pavement structure.
For analyzing the distribution of water vapor in the pavement structure, many scholars have carried out research on the movement law of the water vapor in a mixture [6,7]. On this basis, some scholars have established a simple water vapor concentration field model of the pavement structure, but this part of the model does not consider the influence of temperature on the diffusion coefficient and the dynamic change of the external water vapor concentration environment; the obtained water vapor concentration field is in an ideal state [8]. Knowing the actual water vapor distribution inside the asphalt pavement structure under the dynamic changes of external temperature and water vapor can provide real water vapor parameters for the analysis of the asphalt pavement structure and pave the way for analyzing the influence of water vapor on the response of the asphalt pavement structure.
To solve the shortcomings in the above research, this article first establishes a finite element model of temperature and the water vapor field of the pavement structure considering the actual service environment. Combined with the water vapor concentration field model, the water vapor concentration of each layer of the pavement structure is analyzed, the viscoelastic parameters of this water vapor are solved according to the joint shift factor formula, and the pavement structure response model considering the actual water vapor concentration field is established. Compared with the conventional model, the influence of water vapor factors is analyzed. The results provide a certain theoretical and practical basis for clarifying the water damage mechanism of asphalt pavement and guide the design of the asphalt pavement structure.
2 Establishment of a finite element model of the temperature and water vapor concentration field of the pavement structure considering the actual service environment
In order to establish a finite element model of the mechanical response of the pavement structure considering fully of the water vapor, this section will establish a model of the uneven water vapor concentration field of the pavement structure in an all-weather temperature and water vapor concentration environment. First, the water vapor diffusion coefficient of pavement materials at different temperatures is quantified by the theory of penetrating water vapor diffusion and then the temperature field model of the pavement structure is established by taking the most unfavorable temperature as an example and combining it with the temperature situation in Yichun, Jiangxi Province, on July 31, 2021. Considering the temperature field as a predefined field, the unit grid reads the temperature data and then calculates the diffusion coefficient at the corresponding temperature according to the definition of the material diffusion coefficient for application. By inputting the boundary conditions of the water vapor concentration and simulating the water gas concentration field under the influence of a temperature field, the established temperature field model and the water gas concentration field model are analyzed.
This research is based on Yisui (Yichun City to Sichuan County) high-speed project. The pavement structure of this project section is shown in Figure 1, and in this work, a pavement structure model based on this structure is established.

Pavement structure.
2.1 Measurement of the water vapor diffusion coefficient
At present, when studying the water vapor movement of the pavement structure, the penetrating diffusion model is mostly used. This is because the pavement structure is under the water vapor difference between the soil base and the external environment, which is more in line with the penetrating water vapor diffusion model. Therefore, in this section, the penetrating water vapor diffusion model is adopted to measure the diffusion coefficient of the surface mixture, and, combined with the mass diffusion module in the finite element method, the uneven water vapor concentration field formed by the pavement structure under the dynamic action of the soil foundation and the external environment is simulated.
Some research group has measured the diffusion coefficient of AC-13C and AC-20C asphalt mixtures [9]. This article supplements the measurement of the diffusion coefficient of the AC-25C asphalt mixture to obtain the diffusion coefficient of each surface layer at different temperatures, as shown in Table 1.
Diffusion coefficients of AC-13C, AC-20C, and AC-25C mixtures
| Mixture type | Temperature (°C) | Measured value of the diffusion coefficient (mm2/s) | Fitting value of the diffusion coefficient (mm2/s) | A1 | E (kJ/mol) | Goodness of fit |
|---|---|---|---|---|---|---|
| AC-13C | 10 | 0.0265 | 0.02595 | 304.1 | 23.418 | 0.983 |
| 15 | 0.0287 | 0.02957 | ||||
| 20 | 0.0343 | 0.03355 | ||||
| 25 | 0.0368 | 0.03790 | ||||
| 30 | 0.0436 | 0.04265 | ||||
| AC-20C | 10 | 0.0382 | 0.03912 | 12.52 | 14.388 | 0.977 |
| 15 | 0.045 | 0.04324 | ||||
| 20 | 0.0476 | 0.04763 | ||||
| 25 | 0.0516 | 0.05229 | ||||
| 30 | 0.0573 | 0.05724 | ||||
| AC-25C | 10 | 0.05263 | 0.0521 | 4.71 | 11.237 | 0.9590 |
| 15 | 0.05554 | 0.0563 | ||||
| 20 | 0.06183 | 0.0607 | ||||
| 25 | 0.06312 | 0.0653 | ||||
| 30 | 0.07176 | 0.0701 |
2.2 The temperature field model of the pavement structure
Because the water vapor diffusion coefficient of the asphalt mixture is greatly affected by temperature, it is necessary to establish the temperature field of the pavement structure before establishing the water vapor diffusion model of the pavement structure by using the finite element method. The establishment method of the temperature field is based on the results of Professor Yan Zuoren of Tongji University [10]. With the help of the FILM module (user subroutine to define the nonuniform film coefficient and the associated sink temperatures for heat transfer analysis) and DFLUX module (user subroutine to define the nonuniformly distributed flux in a heat transfer or mass diffusion analysis), the definitions of effective radiation, air temperature and convective heat exchange of the pavement structure are realized, and the temperature field model of the pavement structure is established.
2.2.1 Establishment of the temperature field model
In this study, referring to the meteorological statistics of the National Meteorological Science Data Center, the temperature field model of the pavement structure was established. The annual average wind speed in Jiangxi Province is about 2.7 m/s, and the temperature data of the hottest day in July (July 31) in Yichun, Jiangxi Province, were selected. In previous studies [10,11,12,13], research on the thermal parameters of the pavement structural materials has been carried out and the comparison shows that the thermal parameters of the same materials have little difference. Therefore, the thermal parameters of the materials given in previous studies [11–14] are selected in this study and listed in Table 2.
Thermal parameters of pavement materials
| Structure sheaf | Compositive material | Thermal conductivity (J/(m h °C)) | Heat capacity (J/(kg °C)) | Material density (kg/m3) |
|---|---|---|---|---|
| Upper layer | AC-13C mixture | 4,680 | 903 | 2,579 |
| Middle layer | AC-20C mixture | 4,680 | 928 | 2,538 |
| Lower layer | AC-25C mixture | 5,040 | 942 | 2,527 |
| Upper grassroots | 5% cement-stabilized macadam | 5,616 | 955 | 2,216 |
| Lower grassroots | 3% cement-stabilized macadam | 5,616 | 948 | 2,108 |
| Subbase | Graded broken stone | 5,400 | 920 | 2,000 |
| Soil foundation | Soil | 5,616 | 1,040 | 1,800 |
2.2.2 Calculation results of the temperature field
To simulate the temperature field of the pavement structure, in this article, we have selected four typical points, the pavement surface, the bottom of the upper layer, the bottom of the middle layer, and the bottom of the lower layer, to analyze the temperature change trend, and the data are shown in Figure 2. From the simulation results, it can be seen that the surface layer is greatly affected by the external temperature, and the highest temperature of the pavement is 57°C. The calculation result file of the pavement structure temperature field is exported for the calculation of the water vapor concentration field.

Twenty-four hours temperature change at a typical location of the pavement structure.
2.3 The water vapor field model of the pavement structure
After the temperature field is established, it is regarded as a predefined field and the unit grid reads the temperature data. According to the definition of the material diffusion coefficient, the diffusion coefficient at the corresponding temperature is calculated. Then, combined with the input boundary conditions of the water vapor concentration, the water vapor concentration distribution under the influence of a temperature field is simulated, and the water vapor concentration field model of the pavement structure is established.
2.3.1 Parameter setting and the model establishment
The relationship between the water vapor diffusion coefficient and temperature can be fitted by the Arrhenius equation [9], as shown in Formula (1). With the help of this, the diffusion coefficients of each material layer were fitted and obtained at 10–60°C. The data are shown in Table 3. For the base-cement-stabilized macadam material, the properties of 5 and 3% cement-stabilized macadam are similar. Therefore, according to Rong and Tingting [8], the diffusion coefficient of the base material is obtained as follows:
Diffusion coefficient of the surface material
| Mixture type | Fitted values of diffusion coefficients at different temperatures (×10−4 m2/h) | |||||||||||
|---|---|---|---|---|---|---|---|---|---|---|---|---|
| Temperature (°C) | 10 | 15 | 20 | 25 | 30 | 35 | 40 | 45 | 50 | 55 | 60 | |
| AC-13C | — | 0.934 | 1.065 | 1.208 | 1.365 | 1.535 | 1.721 | 1.922 | 2.139 | 2.373 | 2.624 | 2.893 |
| AC-20C | 1.408 | 1.556 | 1.715 | 1.883 | 2.061 | 2.249 | 2.448 | 2.657 | 2.877 | 3.107 | 3.348 | |
| AC-25C | 1.875 | 2.027 | 2.186 | 2.352 | 2.524 | 2.702 | 2.887 | 3.078 | 3.275 | 3.478 | 3.687 | |
The diffusion coefficients given in Table 3 correspond to different mixture types. In terms of setting the boundary conditions of the water vapor concentration, it is generally believed that the relative water vapor of the soil foundation is 100% according to the water vapor concentration conditions at the lower boundary of the pavement structure [15]. In the pavement structure selected in this article, the upper layer of the soil foundation is a graded crushed stone with a large void ratio; therefore, it can be considered that the relative water vapor of the graded crushed stone is the same as that of soil foundation, which is 100%. According to the calculation results of the temperature field, the temperature of the graded crushed stone is stable at 28.73°C, and the water gas concentration is 28.33 g/mm3 according to the conversion of the relative water vapor. In this article, it is assumed that the upper boundary condition of the water vapor concentration of the pavement structure is equal to the water vapor concentration of an external environment. In this article, referring to the data of the National Meteorological Science Data Center, the relative water vapor data of the Yichun area on July 31 was obtained, and the change of the water gas concentration in this area was obtained by conversion. The water vapor concentration conditions at the upper and lower boundaries are introduced into the model and then the uneven water vapor concentration field of the pavement structure on July 31 in this area can be obtained.
2.3.2 Analysis of the water vapor concentration field on the road surface
In order to analyze the change law of the water vapor concentration field of the pavement structure, three typical positions of the bottom of the upper layer, the bottom of the middle layer, and the bottom of the lower layer are taken for analysis. In this article, the water vapor concentration changes in this environment for 7 days; the simulation results are shown in Figure 3.

Simulation results of the change in the water vapor concentration at different depths of the pavement structure for 7 days.
From the results of the analysis of Figure 3, it can be inferred that the upper and middle surface layers of the pavement structure are greatly affected by the change in the external water vapor concentration but the bottom of the middle surface layer to the bottom of the lower layer is affected by the external water vapor concentration and the mixture at this place is in a relatively constant water vapor concentration. In this article, the temperature and water vapor concentration environment of the hottest day are loaded for 7 days, and the water vapor concentration value of the pavement structure at the bottom of the upper layer is shown as a periodic change after reaching equilibrium. At the same time, ten time points within 24 h are selected to study the distribution of the water vapor concentration in the depth direction of the pavement, and the change curve is plotted in Figure 4.

Variation diagram of the water vapor concentration with a pavement structure depth at ten time points.
From the analysis of the results of Figure 4, it can be seen that the water vapor concentration is not uniformly distributed along the depth of the pavement structure and the water vapor concentration is high. After the water vapor concentration field reaches a dynamic equilibrium state, the area affected by the change in the external water vapor concentration is concentrated in the upper layer and the middle surface layer, and the lower layer is less affected. The concentration of the water vapor at the base level is maintained at a stable value. From the numerical analysis of the water vapor concentration, the overall road structure is in the range of 17–28 g/m3 water vapor concentration, which is determined by the subgrade water vapor concentration and the external water vapor concentration. From this study, it is found that the pavement structure is in a high-water vapor concentration environment, which shows that it is necessary to consider the non-uniform water vapor concentration field factor when calculating the response of the pavement structure. Next, the effect of water vapor on the viscoelastic properties of the mixture was studied, and the response model of the pavement structure was established.
3 The response model of the pavement structure considering water vapor factors
In this section, the water vapor concentration is linked with the mechanical properties of the mixture, and the dynamic modulus is determined by using the dynamic test system (DTS) to measure the specimen health of the sample at different water vapor concentrations. Then, according to the combined temperature–water–gas concentration–frequency shift method, the dynamic modulus under different temperatures, water vapor concentrations, and frequencies of the same mixture is unified into a main curve. At the same time, according to the actual water vapor concentration of each layer, the corresponding main curve is selected and the dynamic modulus is converted to the Prony series form of relaxation modulus, which is input into the finite element, and then the mechanical response of the pavement structure is calculated.
3.1 Dynamic modulus test of mixtures maintained at different water vapor concentrations
Long et al. have tested the dynamic moduli of AC-13C and AC-20C asphalt mixtures at different water vapor concentrations [16]. The same approach is used in this section, referring to previous studies [16,17,18,19,20]. Dynamic modulus tests were performed on AC-25C asphalt mixtures at different water vapor concentrations.
3.1.1 Regimens
The molded asphalt mixture dynamic modulus standard specimen is maintained with the help of a constant temperature and water vapor environment box. The health time of the specimen is determined according to Long et al. [16], and the specific health regimen is shown in Table 4. The reasons for choosing these four moisture concentrations are as follows: on the one hand, the moisture concentration should be selected to cover a large span as far as possible to comprehensively analyze the mechanical performance of the mixture in the whole service life; on the other hand, according to the above non-uniform moisture concentration field model, the pavement structure is in a high moisture concentration for a long time in summer so the moisture concentration is set in a high humidity environment.
Water vapor regimen
| Type of asphalt mixture | Water vapor concentration (g/m3) | T (°C) | Curing duration | Instruments used |
|---|---|---|---|---|
| AC-25C | 0.35 | 20 | 6 months | Vacuum drying oven |
| 8.64 | Constant temperature and water vapor box | |||
| 13.82 | ||||
| 17.29 |
3.1.2 Modulus test and results
The dynamic modulus of the post-cured specimen is measured using a DTS instrument, and the test schematic diagram is shown in Figure 5. The method in the test reference [16] controls the ambient water vapor concentration during the dynamic modulus test. This study was conducted following the Dynamic Modulus Test Protocol in the US State Highway and Transportation Association Code [18], and the test was strain control. The test results of the dynamic modulus corresponding to each water vapor concentration of the AC-25C mixture specimen are shown in Table 5.

Schematic diagram of the DTS dynamic modulus test.
Test results of the dynamic modulus corresponding to each water vapor concentration of the AC-25C mixture specimen
| Water vapor concentration (g/m3) | Frequency | Temperature (°C) | Water vapor concentration (g/m3) | Frequency | Temperature (°C) | ||||||||||||||||
|---|---|---|---|---|---|---|---|---|---|---|---|---|---|---|---|---|---|---|---|---|---|
| 5 | 20 | 35 | 55 | 5 | 20 | 35 | 55 | ||||||||||||||
| |E*| | φ | |E*| | φ | |E*| | φ | |E*| | φ | |E*| | φ | |E*| | φ | |E*| | φ | |E*| | φ | ||||||
| 0.35 | 0.1 | 14,430 | 16.24 | 3,711 | 29.33 | 904 | 28.12 | 273 | 18.47 | 13.72 | 0.1 | 14,848 | 17.52 | 3,699 | 30.88 | 838 | 29.44 | 217 | 17.92 | ||
| 0.5 | 18,318 | 12.79 | 6,302 | 25.55 | 1,620 | 30.75 | 380 | 21.93 | 0.5 | 19,100 | 13.87 | 6,419 | 26.72 | 1,537 | 32.39 | 296 | 21.72 | ||||
| 1 | 20,020 | 11.38 | 7,706 | 23.48 | 2,143 | 30.66 | 456 | 23.67 | 1 | 20,968 | 12.38 | 7,891 | 24.53 | 2,057 | 32.43 | 348 | 23.25 | ||||
| 5 | 23,773 | 8.64 | 11,359 | 18.61 | 4,130 | 27.81 | 834 | 26.16 | 5 | 25,060 | 9.32 | 11,783 | 19.36 | 4,091 | 29.73 | 639 | 25.92 | ||||
| 10 | 25,264 | 7.75 | 13,051 | 16.98 | 5,324 | 26.37 | 1,140 | 27.22 | 10 | 26,811 | 8.29 | 13,530 | 17.65 | 5,327 | 28.4 | 895 | 26.99 | ||||
| 25 | 26,968 | 6.91 | 15,403 | 15.18 | 7,157 | 24.39 | 1,710 | 29.35 | 25 | 29,110 | 7.3 | 15,889 | 15.79 | 7,291 | 26.25 | 1,365 | 29.63 | ||||
| 8.64 | 0.1 | 13,941 | 19.38 | 3,479 | 32.04 | 742 | 29.44 | 189 | 17.92 | 17.29 | 0.1 | 14,135 | 19.11 | 2,660 | 33.31 | 649 | 28.54 | 169 | 19 | ||
| 0.5 | 18,445 | 15.35 | 6,347 | 27.84 | 1,390 | 32.39 | 253 | 21.72 | 0.5 | 18,590 | 14.99 | 5,209 | 29.87 | 1,178 | 32.18 | 228 | 23.27 | ||||
| 1 | 20,477 | 13.62 | 7,926 | 25.57 | 1,892 | 32.43 | 292 | 23.25 | 1 | 20,561 | 13.32 | 6,783 | 27.24 | 1,559 | 33.4 | 267 | 25.14 | ||||
| 5 | 25,035 | 10.15 | 12,099 | 20.15 | 3,962 | 29.73 | 526 | 25.92 | 5 | 24,964 | 9.94 | 10,955 | 21.39 | 3,352 | 31.39 | 486 | 26.75 | ||||
| 10 | 26,913 | 8.98 | 14,018 | 18.34 | 5,298 | 28.4 | 725 | 26.99 | 10 | 26,749 | 8.86 | 12,921 | 19.34 | 4,576 | 30.08 | 675 | 27.88 | ||||
| 25 | 29,138 | 7.84 | 16,628 | 16.28 | 7,471 | 26.25 | 1,093 | 29.63 | 25 | 28,933 | 7.92 | 15,626 | 16.97 | 6,594 | 28.1 | 1,013 | 31.18 | ||||
3.2 Main curve drawing
In this article, the generalized Sigmod mathematical model is selected as the main curve model, and the dynamic modulus and phase angle of the linear viscoelastic stage can be converted by the approximate Kramers–Kronig relationship (the relationship model between viscoelastic parameters of the asphalt mixture is described) [20]. At present, the widely used shift factor in asphalt mixtures is the WLF equation (an equation describing the dependence of relaxation time on the temperature), which considers the effects of temperature and frequency but does not consider the effects of water vapor. Luo and Liu have used the Doolittle equation to derive the combined temperature–water vapor–frequency shift factor of the mixture under the tensile state [21], as shown in equation (2); the value of water vapor in this displacement factor is the concentration of water vapor. Considering that the formula was quoted from other scholars’ literature, no specific derivation process was written. With this shift factor, the dynamic modulus values at different water vapor concentrations are unified into a single main curve:
In order to compare and analyze the influence of different graded asphalt mixtures on the concentration of water vapor, the dynamic modulus data of AC-13C and AC-20C asphalt mixtures were selected from the study of Qiuhua [15]. The dynamic modulus of AC-13C, AC-20C, and AC-25C mixtures is fitted with the help of a combined shift factor, and the fitting results are listed in Tables 6 and 7; the main curve diagram is shown in Figure 6.
Main curve parameters of different mixture types
| Type of asphalt mixture | Model parameter | ||||
|---|---|---|---|---|---|
| δ | α | λ | β | γ | |
| AC-25C | 1.811 | 2.795 | 0.967 | −1.075 | −0.498 |
| AC-20C | 1.767 | 2.788 | 0.444 | −1.017 | −0.439 |
| AC-13C | 1.515 | 3.123 | 0.270 | −1.292 | −0.357 |
Joint shift factor and fitting decision coefficient
| Type of asphalt mixture | Shift parameters | Determination coefficient | |||
|---|---|---|---|---|---|
| C1 | C2 | C3 | R2-E | R2-φ | |
| AC-25C | 32.722 | 241.560 | 1716.083 | 0.9999 | 0.9937 |
| AC-20C | 21.893 | 190.847 | 561.982 | 0.9995 | 0.9550 |
| AC-13C | 31.045 | 268.617 | 467.907 | 0.9998 | 0.9701 |
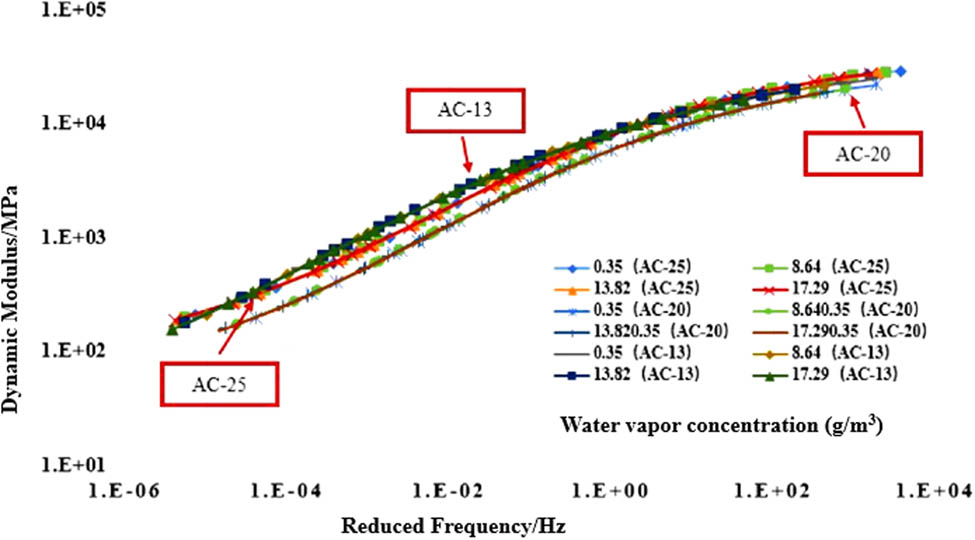
Master curve of the dynamic modulus of a mixture at different water vapor concentrations.
From the data in Table 7, it can be seen that the main curve model using the joint shift factor fits well, and the good fit of both the dynamic modulus and the phase angle main curve reaches 0.950 or more, thus indicating that the use of this method to unify the dynamic modulus of each water vapor concentration is accurate and effective.
3.3 Viscoelastic parameter conversion
After fitting the parameters of the dynamic modulus main curve of the mixture under different water vapor concentrations, the material parameters were converted to obtain the viscoelastic parameters and WLF shift factor that needed to be defined in the finite element model to realize the finite element analysis of the viscoelastic parameters. The most unfavorable time was selected from 2 p.m., and the water vapor concentration value at the midpoint of each layer of the surface layer at that time was taken as the representative value. The dynamic modulus value and the WLF shift factor at the water vapor concentration of each layer were converted. The material parameters were converted into the prony series form of the relaxation modulus according to Qiang [22]. In order to quantify the influence of the water vapor concentration field on the response of the pavement structure, it is also necessary to compare the results of the mechanical response of the pavement structure with the conventional method. Xi Lei et al. [17] measured that the internal water vapor concentration of asphalt mixture specimens without water vapor maintenance treatment was usually 7 g/m3 at room temperature (20°C). At present, the calculation method of pavement structure response in China’s current specifications [23] is to directly use the dynamic modulus measured by the indoor specimen (i.e., the dynamic modulus at a concentration of 7 g/m3 water vapor) for the simulation of pavement structure, and the actual response of the pavement structure under a single water vapor concentration of 7 g/m3 is obtained. The viscoelastic parameters of each layer are shown in Tables 8 and 9.
Main curve parameters at the corresponding water vapor concentration of each layer
| Method | Name of the polygon | Mixture type | Water vapor concentration (g/m3) | WLF shift factor | |
|---|---|---|---|---|---|
| C1 | C2 | ||||
| Actual water vapor | Upper layer | AC-13C | 24.97 | 29.48 | 282.66 |
| Middle layer | AC-20C | 21.63 | 21.09 | 197.99 | |
| Lower layer | AC-25C | 26.34 | 32.23 | 245.21 | |
| Routine | Upper layer | AC-13C | 7.00 | 30.62 | 272.50 |
| Middle layer | AC-20C | 7.00 | 21.63 | 193.08 | |
| Lower layer | AC-25C | 7.00 | 32.59 | 242.44 | |
Converted Prony series parameters
| Relaxation time
|
No. of relaxation modulus Prony series for different types of mixtures | |||||
|---|---|---|---|---|---|---|
| Actual water vapor | Routine | |||||
| AC-13C | AC-20C | AC-25C | AC-13C | AC-20C | AC-25C | |
| 2.0 × 10+05 | 0.00071 | 0.00075 | 0.00156 | 0.00188 | 0.00120 | 0.00205 |
| 2.0 × 10+04 | 0.00151 | 0.00160 | 0.00298 | 0.00417 | 0.00262 | 0.00403 |
| 2.0 × 10+03 | 0.00379 | 0.00406 | 0.00712 | 0.01030 | 0.00680 | 0.00982 |
| 2.0 × 10+02 | 0.00930 | 0.01047 | 0.01730 | 0.02310 | 0.01731 | 0.02372 |
| 2.0 × 10+01 | 0.02116 | 0.02585 | 0.04011 | 0.04495 | 0.03998 | 0.05263 |
| 2.0 × 10+00 | 0.04197 | 0.05530 | 0.07986 | 0.07349 | 0.07664 | 0.09710 |
| 2.0 × 10−01 | 0.07007 | 0.09566 | 0.12659 | 0.10069 | 0.11677 | 0.14056 |
| 2.0 × 10−02 | 0.09793 | 0.13113 | 0.15641 | 0.11765 | 0.14214 | 0.15950 |
| Transient shear modulus (MPa) | 16692.6 | 13788.3 | 15508.6 | 16698.9 | 13788.1 | 15508.7 |
4 Analysis of the pavement structure response under the most adverse conditions
The response analysis of the asphalt pavement structure is carried out considering the actual water vapor concentration field and only considering the single water vapor concentration. Also, the influence of the water vapor concentration field on the structural response is quantified by vertical displacement, strain, stress, and other indicators, so as to infer the cause of water damage of the pavement structure and provide a theoretical reference for the optimization of pavement materials and structural design in the rainy areas of the south.
4.1 Model building
Among the layers of materials in the pavement structure, the surface layer is defined by viscoelastic materials, and the data are derived from the actual measurement and calculation of Section 2.3. Elastic materials are defined as base layers and soil foundations, and the data are summarized in Table 10 [12,24].
Material parameters
| Materials | Thickness (cm) | Modulus (MPa) | Poisson’s ratio | Density (kg/m3) |
|---|---|---|---|---|
| AC-13C mixture | 4 | See viscoelastic parameter | 0.35 | 2,300 |
| AC-20C mixture | 6 | |||
| AC-25C mixture | 8 | |||
| 5% cement stabilizes the gravel base | 20 | 1,600 | 0.20 | 2,200 |
| 3% cement stabilizes the gravel base | 16 | 1,400 | ||
| Graded gravel | 20 | 350 | 0.35 | 2,100 |
| Soil | — | 50 | 0.4 | 1,800 |
Double-wheel uniaxial load specified in the Design Code for Asphalt Pavement was adopted as the standard load [25]; the tire grounding pressure is 0.7 MPa, the equivalent circle diameter is 0.213 m, and the center distance between the two wheels is 1.5 times the diameter.
First, according to the actual pavement structure combination form, the finite element model of the pavement structure is drawn with ABAQUS software. Its size is 3 m high and 3.75 m wide. It is divided into the surface course and base course of the corresponding thickness concerning datum points, and the load loading position is reserved at the same time. Then, the section is created, and material properties are assigned to the section. In terms of grid setting, the global seed is set to 0.02, that is, the cell length is 0.02, so the upper layer with a thickness of 0.04 has two layers of the grid. At the same time, seed distribution is set by edges and fewer grids are arranged in the lower half of the model, for example, set 35 grids by edges in the soil foundation.
The two action points are selected directly below the wheel and in the middle of the two wheels, the analysis points are set, as shown in Figure 7. The vertical displacement, strain, and stress values in the depth direction of the pavement structure at the analysis point are retrieved, and the influence of water vapor on the response of the pavement structure is analyzed; the finite element model is shown in Figure 8.

Load action diagram of the pavement structure.

Schematic diagram of pavement finite element structure.
4.2 Comparative analysis of the water vapor influence and pavement structure response of the conventional model
4.2.1 Vertical displacement of the pavement structures
The vertical displacement values of each structural layer are compared under action point A (directly below the wheel) and action point B (in the middle of the two wheels), and the vertical displacement values are plotted considering the actual water vapor concentration field and conventional methods, respectively, in Figure 9.

Vertical displacement value of each floor considering the actual water vapor concentration (left) and the conventional method (right).
It can be seen from the data in the figure that the maximum displacement value of each structural layer is not much different, and the displacement under the load is mainly in the soil base. Compared with the maximum displacement value of each structural layer at point A, the displacement value of each structural layer is 2.285 mm considering the actual non-uniform water vapor concentration distribution, and the displacement value is 2.257 mm by the conventional calculation method, and the displacement of the pavement structure is increased by about 1.24%. The change in the displacement at point B is consistent with that at point A, but the maximum displacement occurs in the lower layer because the upper and middle surface layers have a certain degree of a bulge under the squeeze between the wheel loads. Considering that the actual non-uniform water vapor concentration affects the vertical displacement value of the bottom of the lower layer (2.279 mm), the displacement value under the conventional calculation method is 2.235 mm; the water vapor concentration makes the displacement of the pavement structure also increase by about 1.97%, and the influence of the water vapor concentration on the vertical displacement of the structure is small. This is because the displacement occurs mainly in the soil foundation part, and the surface layer part itself contributes less to the displacement values.
4.2.2 The bottom strain of pavement structural layers
The horizontal strain changes of each layer are analyzed, and the depth direction of the pavement structure at A and B points is also analyzed. The horizontal strain values considering the actual water vapor concentration field and conventional methods are plotted in Figure 10.

Simulation results of horizontal strain values of each layer. (a) At point A, the actual water vapor concentration (left) and the horizontal strain values of each layer of the conventional method (right) are taken into account. (b) At point B, the actual water vapor concentration (left) and the horizontal strain values of each layer of the conventional method (right) are considered.
From the data in Figure 10, it can be seen that the horizontal strain at the bottom of the graded gravel layer at the two points A and B is the largest. For the surface layer, the maximum horizontal strain occurs at the bottom of the upper layer. The middle surface layer has the lowest modulus, so it is in a state of pressure, and the upper and lower layers are stretched. Comparing the horizontal strain value diagrams of each layer in different water environments, it can be found that after the modulus of the surface layer is attenuated by water vapor, the horizontal strain of each structural layer increases. Among the layers affected by the horizontal strain at the bottom of each layer, the upper layer is particularly serious. The data are presented in Table 11 for analysis (as shown in the table, the tensile strain is positive and the compressive strain is negative).
Comparison of maximum horizontal strain values at different locations of the pavement under the influence of the water vapor concentration
| Point | Methods | Maximum horizontal strain at different locations on the road surface μ | |||||
|---|---|---|---|---|---|---|---|
| Upper layer bottom | Middle layer bottom | Bottom of the lower layer | Upper base bottom | Subbase | Graded gravel bottom | ||
| Point A | Routine | 71.32 | −69.17 | 52.45 | 182.37 | 317.95 | 413.71 |
| Hydrosphere | 148.53 | −73.92 | 55.43 | 191.33 | 334.32 | 434.62 | |
| Increased ratio | 108.26% | 6.87% | 5.68% | 4.91% | 5.15% | 5.05% | |
| Point B | Routine | −435.17 | −79.36 | 55.75 | 192.55 | 336.79 | 434.83 |
| Hydrosphere | −617.58 | −86.57 | 58.55 | 203.88 | 356.47 | 458.21 | |
| Increased ratio | 41.92% | 9.08% | 5.03% | 5.88% | 5.84% | 5.38% | |
| Increased ratio | 41.92% | 9.08% | 5.03% | 5.88% | 5.84% | 5.38% | |
From Table 12, it can be seen that the actual least unfavorable non-uniform water vapor concentration field has a huge impact on the upper layer. The horizontal strain of the upper layer at point A is increased by 108.26%, and the strain is a tensile strain that is prone to fatigue cracking, which is more harmful. The horizontal strain of the remaining layers increases by about 5%. This means that the presence of a water vapor concentration field in the pavement structure will cause the horizontal strain of the upper layer to increase with the service life, inducing fatigue cracking. At the same time, the horizontal strain at the grass-root level increases, further increasing the risk of cracking at the grass-root level. The horizontal strain change at point B is the same as that of point A, and after considering the concentration of water vapor, the horizontal pressure strain of the upper layer increases the most, reaching 42%. The horizontal tension strain of the grass-root part increases by about 5% and the risk of cracking at the grass-root level increases.
Comparison of maximum horizontal stress values at different locations of the pavement under the influence of water vapor concentration
| Value point | Methods | Bottom of the upper layer | |||||
|---|---|---|---|---|---|---|---|
| Bottom of the upper layer | Bottom of the middle layer | Bottom of the lower layer | Bottom of the upper subgrade | Bottom of the lower subgrade | Bottom of the graded gravel layer | ||
| A point | The normal | −0.619 | −0.725 | 16.731 | 0.259 | 0.447 | 0.109 |
| Water vapor | −0.593 | −0.693 | 14.563 | 0.271 | 0.476 | 0.122 | |
| Ratio of increase | −4.20% | −4.41% | −12.96% | 4.63% | 6.49% | 11.93% | |
| B point | The normal | −0.735 | −0.353 | 17.583 | 0.279 | 0.452 | 0.120 |
| Water vapor | −0.569 | −0.332 | 15.152 | 0.293 | 0.487 | 0.129 | |
| Ratio of increase | −22.59% | −5.95% | −13.83% | 5.02% | 7.74% | 7.50% | |
4.2.3 Bottom stress of each layer of the pavement structure
Similarly, the depth direction of the pavement structure at points A and B is selected as the value points to analyze the variation of the horizontal stress at the bottom of each structure layer, as plotted in Figure 11; data are listed in Table 12.

Simulation results of horizontal stress values of each layer. (a) Horizontal stress values of each layer at point A considering the actual water vapor concentration (left) and conventional method (right). (b) The horizontal stress values of each layer at point B considering the actual water vapor concentration (left) and the conventional method (right).
As can be seen from Figure 11, compared with other surface layers, the bottom of the layer below the pavement structure is subjected to greater tensile stress. This is because the temperature gradually decreases along the direction of the pavement structure, resulting in a higher modulus of the lower layer, which then bears a larger stress. After considering the actual most unfavorable water vapor concentration field, the horizontal stress on the pavement structure surface at point A decreases by about 10%. In terms of the maximum horizontal stress, the variation of the horizontal strain at the bottom of the layer at point B is the same as that at point A, and the bottom of the lower layer is subject to greater horizontal stress. Considering the most unfavorable non-uniform water vapor concentration field, the horizontal stress of the surface layer decreases by about 10% and the base layer increases by about 5%.
4.3 Fatigue life analysis of the pavement structure under the influence of the water vapor and conventional model
It can be seen from the previous two sections that the horizontal strain of the pavement structure changes under the action of water vapor, leading to the attenuation of fatigue life. In order to further visually express the influence of the non-uniform water vapor concentration field on the pavement structure during the whole service cycle, in this section, we will analyze the influence of the non-uniform water vapor concentration field on the fatigue life of the pavement structure. By referring to the calculation method of the fatigue life in the study of Xi et al. [23], we considered the actual non-uniform water vapor concentration field and the pavement structure model of the conventional method and then introduced the horizontal strain of the surface layer into the empirical formula to calculate the fatigue life.
In order to analyze and consider the influence of the actual non-uniform water vapor concentration field on the fatigue life of the pavement structure, four value points [23] of ABCD (as shown in Figure 12) are selected in this section according to the specification, and the horizontal strain of the pavement structure under this condition is simulated as shown in Table 13.

Distribution of value points.
Maximum horizontal strain at different positions of the pavement
| Methods | Maximum horizontal strain at different positions of the pavement (μ) | |||||
|---|---|---|---|---|---|---|
| A (right under the wheel) | B (between two wheels) | |||||
| Bottom of the upper layer | Bottom of the upper layer | Bottom of the upper layer | ||||
| The normal | −49.434 | −36.132 | 36.696 | −138.00 | −41.360 | 39.294 |
| Water vapor | −47.591 | −37.307 | 37.920 | −147.71 | −42.995 | 40.609 |
| Ratio of increase | −3.73% | 3.25% | 3.34% | 7.03% | 3.95% | 3.35% |
| Methods | C (the wheel edge) | D (between B and C) | ||||
|---|---|---|---|---|---|---|
| Bottom of the upper layer | Bottom of the middle layer | Bottom of the upper layer | Bottom of the middle layer | Bottom of the upper layer | Bottom of the middle layer | |
| The normal | −56.957 | −38.411 | 38.932 | −98.829 | −40.31 | 39.232 |
| Water vapor | −55.707 | −39.668 | 40.243 | −103.23 | −41.799 | 40.550 |
| Ratio of increase | −2.19% | 3.27% | 3.37% | 4.46% | 3.69% | 3.36% |
By comparing the four calculation points of ABCD, the fatigue life of the pavement structure can be obtained by substituting the maximum underlayer tensile strain and its correlation value. The horizontal direction of the upper and middle surface layer is the compressive strain, so its fatigue life is not considered. The fatigue life calculation results of the lower layer are listed in Table 14.
Fatigue life of the pavement structure considering or not the water vapor
| Pavement structure layer | Methods | Equivalent modulus of resilience (MPa) | Saturation of the pitch VFA (%) | Fatigue loading factor kb | Asphalt layer bottom tensile strain ε a μ) | Temperature adjustment factor K T1 | Fatigue life of the asphalt mixture layer N f/108 |
|---|---|---|---|---|---|---|---|
| The lower layer | The normal | 10,952 | 59.3 | 0.956 | 39.294 | 1.097 | 1.967 |
| Water vapor | 9,726 | 0.956 | 40.209 | 1.039 | 1.726 |
It can be seen from the above fatigue life calculation results that the fatigue life of the lower layer is reduced from 1.967 × 10⁷ to 1.726 × 107 by 12.246% after considering the actual non-uniform water vapor concentration field. This indicates that the current conventional method represented by the specification is larger than the actual fatigue life of the pavement when calculating the fatigue life [23], and overestimates the anti-fatigue performance of the pavement structure, resulting in the design of the pavement structure being biased toward danger.
Here, we can reasonably infer the cause of the result. Moisture causes the modulus of the asphalt mixture to decay, while the uneven moisture concentration in the depth direction of the pavement structure will lead to the uneven distribution of the modulus of the pavement structural materials, and the modulus of the upper layer will decay most seriously. The horizontal strain of the upper layer increases by 108.26% under the effect of the vehicle load without considering water and gas. The increase of the horizontal strain further leads to the decrease of fatigue life.
5 Conclusion
By comparing the conventional method with the pavement structure calculation method considering the actual water vapor concentration field, the following conclusions are drawn:
Considering the actual non-uniform water vapor concentration field in high-temperature environment in summer, the vertical displacement of the pavement structure increases by about 1%. Under the influence of water vapor, the position just below the wheel of the upper layer at the bottom of the horizontal tension strain increases by 108.26% and the horizontal tension strain of the other layers increases by about 5%.This indicates that the presence of actual water–gas concentration field makes the upper layer more likely to crack.
Compared with the fatigue life calculation method in the specification, the actual non-uniform water vapor concentration field reduces the fatigue life of the surface layer by 12.246%, indicating that the fatigue life calculated by the conventional method is larger than the actual fatigue life of the road surface and overestimates the fatigue resistance performance of the road surface structure, resulting in the design of the road surface structure being more dangerous.
The attenuation of the surface material modulus caused by water vapor is the root of the problem. The non-uniform water vapor concentration field in the depth direction of the pavement structure leads to the non-uniform distribution of the material modulus of the pavement structure, which leads to the inability of conventional methods to accurately calculate and measure the pavement structure response.
Acknowledgements
The authors acknowledge the financial support from the Science and Technology Project of Jiangxi Provincial Department of Transportation of China (Project No. 2020Z0002 and Project No. 2021C0008).
-
Funding information: This work was financially supported by the Science and Technology Project of Jiangxi Provincial Department of Transportation of China (Project No. 2020Z0002 and Project No. 2021C0008).
-
Conflict of interest: The authors declare no conflict of interest.
References
[1] Shaoquan C. Study on water damage and prevention measures of asphalt pavement in gansu expressway. Xi’an, Shanxi, China: ChangAn University; 2011. (in Chinese)Search in Google Scholar
[2] Sixue N. Investigation and analysis on water damage of asphalt pavement in Gansu Province. Gansu Sci Technol. 2010;21(3):132–4. (in Chinese)Search in Google Scholar
[3] Hicks RG. Moisture damage in asphalt concrete [J]. Nchrp Synthesis of Highway Practice; 1991.Search in Google Scholar
[4] Envelope G. Comparative measurements of fracture toughgness combined with visual analysis of cracks propagation using the DIC technique of concretes based on cement matrix with a highly diversified composition. Theor Appl Fract Mech. 2022;121:103553.10.1016/j.tafmec.2022.103553Search in Google Scholar
[5] Changwei CAO. Study on subgrade water vapor condition and modulus adjustment coefficient. Shanghai, China: Tongji University; 2007. (in Chinese)Search in Google Scholar
[6] Rong L, Ziyao L, Tingting H. Influence of freeze-thaw cycle on water vapor diffusion in asphalt mixture. China J Highw Transp. 2018;31(9):8.Search in Google Scholar
[7] Chen M, Geng J, Chen H, Niu Y, Wang R, Wu W, et al. Diffusion of moisture and oxygen in bitumens using electrochemical impedance spectroscopy. Fuel. 2022;315:123212.10.1016/j.fuel.2022.123212Search in Google Scholar
[8] Rong L, Tingting H. Water vapor movement in asphalt mixture. J Chongqing Jiaotong Univ Nat Sci Ed. 2016;35(S1):49–60.Search in Google Scholar
[9] Xiaohe Y, Rong L, Ziyao L. Numerical simulation of water vapor field of typical cracks in asphalt pavement. Jilin Univ (Eng Technol Ed). 2022;52(10):2343–51. (in Chinese)Search in Google Scholar
[10] Natural J, Zuren Y. Study on temperature condition of cement concrete pavement. J Tongji Univ. 1980;3:91–101.Search in Google Scholar
[11] Gongyun L, Xiaoming H. Application of ABAQUS finite element software in Road engineering. Nanjing, Jiangsu, China: Southeast University Press, 2008. (in Chinese)Search in Google Scholar
[12] Chiarelli A, Dawson AR, Garcia A. Pavement temperature mitigation by the means of geothermally and solar heated air. Geothermics. 2017;68:9–19.10.1016/j.geothermics.2017.02.002Search in Google Scholar
[13] Zhuo Z. ABAQUS/Standard Finite Element Software Introductory Guide. ABAQUS/Standard Finite Element Software Introductory Guide; 1998.Search in Google Scholar
[14] Ziyao L. Study on the influence factors of water-air diffusion in asphalt mixture. Wuhan University of Technology; 2018.Search in Google Scholar
[15] Qiuhua C. Analysis of Influence Factors of Rutting on Asphalt Pavement Based on Temperature Field; Shijiazhuang Tiedao University; 2020.Search in Google Scholar
[16] Long X, Aubeny CP, Bulut R. Two-dimensional water vapor flow–soil deformation model for application to pavement design. Transp Res Rec J Transp Res Board. 2006;1967(1):121–31.10.1177/0361198106196700113Search in Google Scholar
[17] Xi L, Luo R, Liu H. Effect of relative water vapor on the linear viscoelastic properties of asphalt mixtures. Constr Build Mater. 2021;307:124956.10.1016/j.conbuildmat.2021.124956Search in Google Scholar
[18] Ministry of Transport of the People’s Republic of China. JTG E50-2011. Test code of asphalt and Asphalt Mixture for Highway engineering [S]. Beijing: People’s Communications Publishing House; 2011.Search in Google Scholar
[19] Standard Method of Test for Determining Dynamic Modulus of Hot Mix Asphalt (HMA). US-AASHTO; 2011.Search in Google Scholar
[20] Liu H, Luo R. Development of master curve models complying with linear viscoelastic theory for complex moduli of asphalt mixtures with improved accuracy. Constr Build Mater. 2017;152:259–68.10.1016/j.conbuildmat.2017.06.143Search in Google Scholar
[21] Luo R, Liu H. Improving the accuracy of dynamic modulus master curves of asphalt mixtures constructed using uniaxial compressive creep tests. J Mater Civ Eng. 2017;29(7):04017032.10.1061/(ASCE)MT.1943-5533.0001873Search in Google Scholar
[22] Qiang H. Effect of water vapor on viscoelastic properties and fatigue cracking properties of asphalt mixtures. Wuhan, Hubei, China: Wuhan University of Technology; 2020. (in Chinese)Search in Google Scholar
[23] Xi L, Luo R, Liu H. Evaluating the influence of water vapor on asphalt mixture performance by the flow number test. Constr Build Mater. 2021;284(1):122754.10.1016/j.conbuildmat.2021.122754Search in Google Scholar
[24] Ministry of Transport of the People’s Republic of China. Design code for asphalt pavement [S]. Beijing: People’s Communications Press; 2017.Search in Google Scholar
[25] Zejiao D, Yiqiu T, Jinping O. Dynamic response analysis of asphalt pavement under three-way heterogeneous moving load. China Civ Eng J. 2013;46(6):9.Search in Google Scholar
© 2023 the author(s), published by De Gruyter
This work is licensed under the Creative Commons Attribution 4.0 International License.
Articles in the same Issue
- Regular Articles
- Effects of cellulose nanofibers on flexural behavior of carbon-fiber-reinforced polymer composites with delamination
- Damage mechanisms of bismaleimide matrix composites under transverse loading via quasi-static indentation
- Experimental study on hydraulic fracture behavior of concrete with wedge-splitting testing
- The assessment of color adjustment potentials for monoshade universal composites
- Metakaolin-based geopolymers filled with volcanic fly ashes: FT-IR, thermal characterization, and antibacterial property
- The effect of temperature on the tensile properties and failure mechanisms of two-dimensional braided composites
- The influence of preparation of nano-ZrO2/α-Al2O3 gradient coating on the corrosion resistance of 316L stainless steel substrate
- A numerical study on the spatial orientation of aligning fibrous particles in composites considering the wall effect
- A simulative study on the effect of friction coefficient and angle on failure behaviors of GLARE subjected to low-velocity impact
- Impact resistance capacity and degradation law of epoxy-coated steel strand under the impact load
- Analytical solutions of coupled functionally graded conical shells of revolution
- The influence of water vapor on the structural response of asphalt pavement
- A non-invasive method of glucose monitoring using FR4 material based microwave antenna sensor
- Chloride ion transport and service life prediction of aeolian sand concrete under dry–wet cycles
- Micro-damage analysis and numerical simulation of composite solid propellant based on in situ tensile test
- Experimental study on the influence of high-frequency vibratory mixing on concrete performance
- Effects of microstructure characteristics on the transverse moisture diffusivity of unidirectional composite
- Gradient-distributed ZTAp-VCp/Fe45 as new anti-wear composite material and its bonding properties during composite casting
- Experimental evaluation of velocity sensitivity for conglomerate reservoir rock in Karamay oil field
- Mechanical and tribological properties of C/C–SiC ceramic composites with different preforms
- Mechanical property improvement of oil palm empty fruit bunch composites by hybridization using ramie fibers on epoxy–CNT matrices
- Research and analysis on low-velocity impact of composite materials
- Optimizing curing agent ratios for high-performance thermosetting phthalonitrile-based glass fibers
- Method for deriving twisting process parameters of large package E-glass yarn by measuring physical properties of bobbin yarn
- A probability characteristic of crack intersecting with embedded microcapsules in capsule-based self-healing materials
- An investigation into the effect of cross-ply on energy storage and vibration characteristics of carbon fiber lattice sandwich structure bionic prosthetic foot
- Preparation and application of corona noise-suppressing anti-shedding materials for UHV transmission lines
- XRD analysis determined crystal cage occupying number n of carbon anion substituted mayenite-type cage compound C12A7: nC
- Optimizing bending strength of laminated bamboo using confined bamboo with softwoods
- Hydrogels loaded with atenolol drug metal–organic framework showing biological activity
- Creep analysis of the flax fiber-reinforced polymer composites based on the time–temperature superposition principle
- A novel 3D woven carbon fiber composite with super interlayer performance hybridized by CNT tape and copper wire simultaneously
- Effect of aggregate characteristics on properties of cemented sand and gravel
- An integrated structure of air spring for ships and its strength characteristics
- Modeling and dynamic analysis of functionally graded porous spherical shell based on Chebyshev–Ritz approach
- Failure analysis of sandwich beams under three-point bending based on theoretical and numerical models
- Study and prediction analysis on road performance of basalt fiber permeable concrete
- Prediction of the rubberized concrete behavior: A comparison of gene expression programming and response surface method
- Study on properties of recycled mixed polyester/nylon/spandex modified by hydrogenated petroleum resin
- Effect of particle size distribution on microstructure and chloride permeability of blended cement with supplementary cementitious materials
- In situ ligand synthesis affording a new Co(ii) MOF for photocatalytic application
- Fracture research of adhesive-bonded joints for GFRP laminates under mixed-mode loading condition
- Influence of temperature and humidity coupling on rutting deformation of asphalt pavement
- Review Articles
- Sustainable concrete with partial substitution of paper pulp ash: A review
- Durability and microstructure study on concrete made with sewage sludge ash: A review (Part Ⅱ)
- Mechanical performance of concrete made with sewage sludge ash: A review (Part Ⅰ)
- Durability and microstructure analysis of concrete made with volcanic ash: A review (Part II)
- Communication
- Calculation of specific surface area for tight rock characterization through high-pressure mercury intrusion
- Special Issue: MDA 2022
- Vibration response of functionally graded material sandwich plates with elliptical cutouts and geometric imperfections under the mixed boundary conditions
- Analysis of material removal process when scratching unidirectional fibers reinforced polyester composites
- Tailoring the optical and UV reflectivity of CFRP-epoxy composites: Approaches and selected results
- Fiber orientation in continuous fiber-reinforced thermoplastics/metal hybrid joining via multi-pin arrays
- Development of Mg-based metal matrix biomedical composites for acicular cruciate ligament fixation by reinforcing with rare earth oxide and hydroxyapatite – A mechanical, corrosion, and microstructural perspective
- Special Issue: CACMSE
- Preparation and application of foamed ceramic panels in interior design