Graph cutting and its application to biological data
-
Mária Ždímalová


Abstract
In this paper we introduce the concept of segmentation based on mathematical approach using graph theory algorithms using the family of augmenting paths algorithms. We present a new program, an implementation, algorithms and obtained results devoted to segmentation of biomedical data. We implement our program for handling with segmentation, counting a measure of the existence of the minerals in the biomedical data. As a consequence we prove the existence of minerals in the data obtained from the brain of rabbits.
1 Introduction
This paper is motivated by the problem of segmentation and its application on real biomedical data. The segmentation problem has been studied for many years [8, 9, 10, 17, 18]. We focused on a graph theoretical approach to segmentation which is called "graph cutting" [2, 4, 13, 14, 15, 16]. It means that we have data represented as an image. We transport data to the graph representation by a network. In the network we are searching for a maximal flow, which corresponds to a minimal cut in the network. According to [2, 3, 4, 13] the minimal cut in network is the equivalent problem to finding a segmentation. We present different segmentation techniques used in image processing and we focus on graph theory based methods. We describe a transformation of an image to a graph and implement the minimum cut method which gives results in the form of a binary image. We created a new program in the C++ platform which segmented images of data and returns outputs according to specific requirements for biological purposes of finding minerals in the corresponding data.
The segmentation based on Edmonds-Karp algorithm is not sufficient for obtaining all segmented cells. We needed to extend this method and develop our new algorithms and techniques and an approach how to find cells, minerals, how to define in which area more minerals appear. We also developed the algorithm for counting and expressing percentual ratio of the corresponding cells.
In Section 1 we offer the introduction and motivation. In Section 2 we present the main graph and network theory and we also discuss Ford-Fulkerson and Edmonds-Karp Algorithms. In Section 3 we present experimental procedures and our new approach and new program implementation. We discuss new approach devoted to the program functionality and vector analysis. In Section 4 we present the results. The last Section No. 5 is devoted to the conclusion and the summary.
2 Metodology: maximal value and minimum cut in the network
First we define basic definitions which are necessary to introduce the whole theory, [1, 12]. Let G be an ordered couple : G = (V(G), E(G)), where V(G) is a finite set of vertices and E(G) is a set of edges. Edges are denoted: (uv) = {u, v} ∈ E(G) : u, v ∈ V(G) and these are two elements subsets of V(G). It is not necessary that in E(G) all subsets will be included. We denote the number of vertices if the graph G is nG and the number of vertices is mG.
The oriented graph (digraph) is a graph G , where D(G) is a set of darts - oriented couples from the set V(G). In oriented graphs we present edges by darts. The walk of
the graph G is a sequence: v0, v1, . . . , vk ∈ V(G) and (vivi+1) ∈ E(G), ∀ i : 0 ≤ i < k. The length of the walk is k. Moreover, if vi ≠ vj , ∀ i, j : 0 ≤ i < j ≤ k, then it is called the path of length k.
The network G = (V(G), E(G)) is an ordered couple, where V(G) is a finite set of vertices and E(G) is a dart set e = (uv) : u, v ∈ V(G). The network has two special vertices - a source s a and a sink t. The "source s" is such a vertex, from which darts emanates, but vice versa no darts are coming. The sink is a vertex t, where darts just enter it but no a dart emanates from it. To every dart we assign capacity c(e) - it is the non negative real value which corresponds to the maximal value of the flow, which can flow through the dart. The flow f (uv) is a function, which assigns to every dart a real value according the following rules:
Let v(f) be the size of the flow, which flows in the network. The first condition guaranties, that the flow through the dart can not be in excess of the capacity of the dart. It is called "capacity boundaries". The second condition is an assymetrical condition and means that the flow in the direction of the dart is equal to the reverse value of the flow against the direction of the dart. The last condition is called "Kirchhoff’s" law. It guarantees, that the amount flowing into the vertex v is equal to the amount of the flow leaving the same vertex. This condition holds for all vertices instead of the sink and the source. For the size of the flow in the network we obtain:
2.1 Maximal Flow and Minimal Cut
Maximal flow is the flow with maximal value, [1, 6, 12]. Maximal flow is obtained step by step saturating darts and augmenting paths in the network, so that the precise conditions are satisfied. Let A be a subset V(G) and also s ∈ A, t ∈ V(G) − A. The set < A, V(G) − A > denotes all darts emanating from the vertex v ∈ A to w ∈ V(G)−A. The value f (< A, V(G) − A >) presents the sum of flows on darts from the set < A, V(G)−A >. Capacity c(< A, V(G)−A >) denotes the sum of capacity of all darts from the set (< A, V(G)−A > ). For each size of flow it holds:
The set of darts < A, V(G) − A > is the cut defined by the set A. It means that the cut separates source from the sink and c(< A, V(G) − A >) is the capacity of the cut. Ford-Fulkerson theorem [6] says that the size of maximal flow from the source s to the sink t is equal the sum of capacity of the edges of minimal cut [2, 4]. The reason is that maximal flow saturates all edges belonging to the set < A, V(G) − A >, which belong to minimal cut:
The sequence of darts is called an augmenting path P, if it creates a path and we do not consider orientation of darts. The augmenting path can contain direct as well as reverse darts. We denote the dart as direct, if its orientation is the same like the orientation of the augmenting path. To every dart of this augmenting path there are assigned weights, which are called "reserves" r(u, v). The value of the "reserve" depends on the orientation of the dart:
We will choose from all "reserves" the smallest one and call it the reserve of the augmenting path r(P) and if its value is positive, then we call this value "increasing augmenting path". The increasing s − t augmenting path is a path starting in the vertex s and ending in the vertex t. If there is no increasing s−t augmenting path, then there is a maximal flow in the network. If there is still some flow, in the next step we increase the flow in the network and for the same value of the network there holds:
For finding maximal flow in the network and its minimal cut there are usually used two types of algorithm based on two approaches. One is a family of augmenting paths algorithms [4, 6, 13], specially Ford - Fulkerson algorithm [6] another one is Push relabel algorithms [7, 11, 13].
2.2 Ford-Fulkersonov algorithm
It is the basic algorithm for finding maximal flow in the network. It was described in 1956 by L. R. Ford Jr. and D. R. Fulkerson [6]. Searching of maximal flow in the network is by iterations, finding for augmenting s − t paths and increasing of the flow W(f ). Augmenting paths are possible be defined and searched by different approaches. Ford - Fulkerson algorithm is general, it is not direct way how to find them.
If there is a solution, that we reach t, it means we found maximal flow in the network. All vertices, which were not discovered and reached in this last iteration, will create a set A. Then the number of darts 〈A, V(G) − A〉 will create maximal flow with the value c(〈A, V(G) − A〉) = W(f ). We discuss Edmond’s Karp algorithm [1, 12] and its modification in the next chapter.
2.3 Edmonds-Karp algorithm
Each dart (vivj) has assigned two value, the flow f and the capacity c, as in Chapter 2.1. The flow f is an actual amount passing the edge and the capacity c is a maximum value of the flow f that can pass the edge.
In Figure 1 we present the "flow chart diagram" for Edmonds-Karp algorithm as we implemented it in our program. In the queue Q we add vertices we have found in breadth-first search. We also remove vertex from Q, when no darts satisfy certain conditions (2.6). Specifically, the queue Q contains indexes of vertices so it is an array of integers. Each vertex v has its own label l(v). This label shows the index of a vertex, which we came to v from. The label for source vertex s contains value l(s) = 0, because we start from this vertex and s is known at the beginning of the breadth-first search. We set labels for other vertices as vi as l(vi) = −1. The queue Q contains just s at position Q[0] at the beginning.
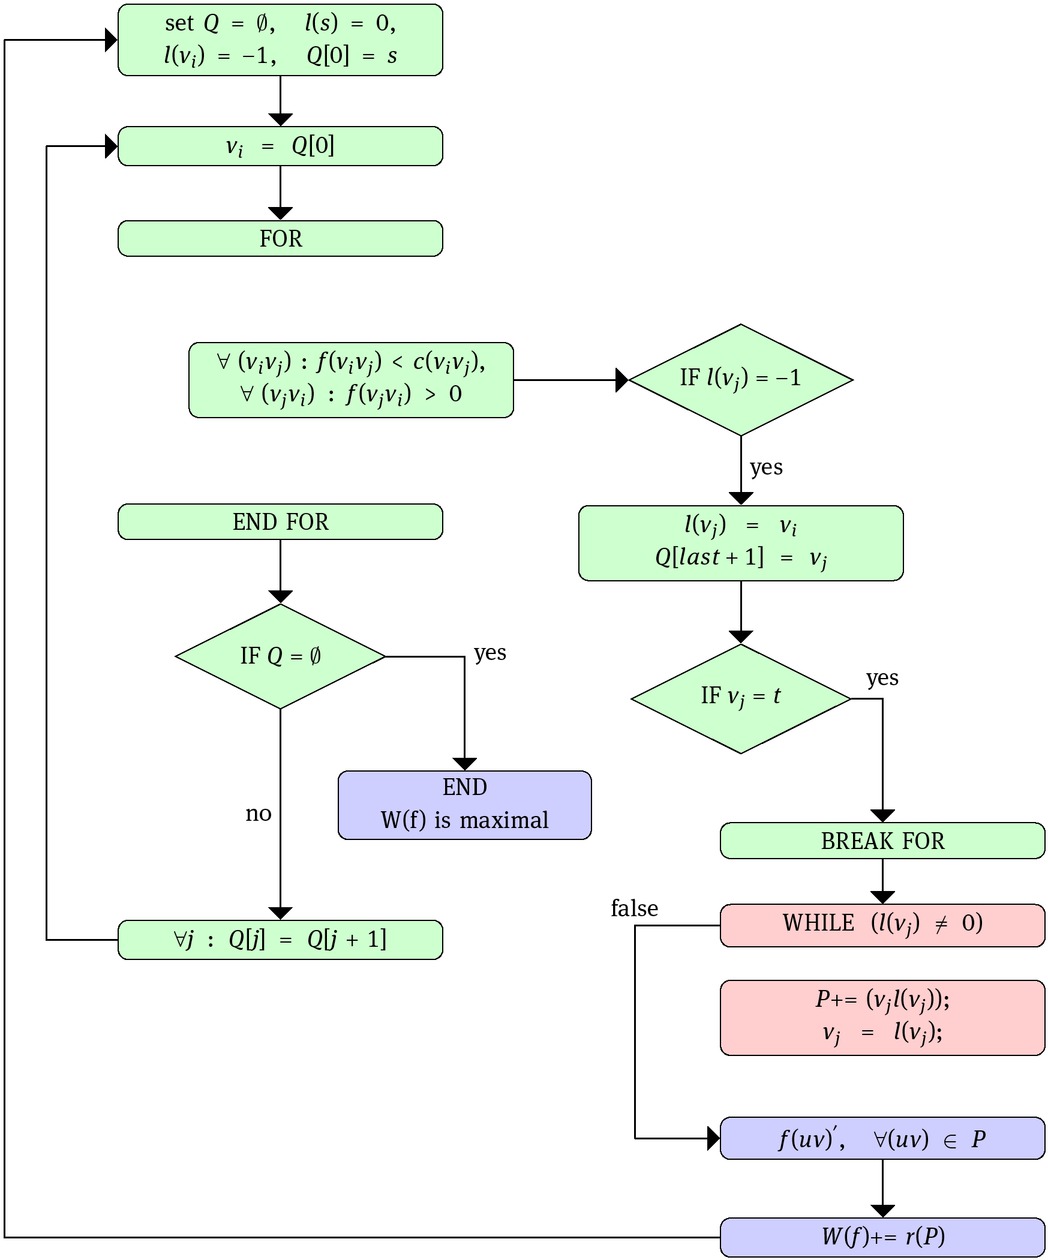
The flow chart diagram: The flow chart diagram for the Edmonds-Karp algorithm. The Breadth-first search algorithm is marked as green, the back-tracing of augmenting s-t path is marked pink.
Then we pick the vertex vi at position Q[0] and check two types of dart containing the vertex vi:
If we find an edge satisfying these conditions, then we add vertex vj at the end of Q and set l(vj) = vi. If vj = t , we found sink t and it means we can increase flow on an augmenting path.
When we look at label l(t) of t we get vertex vj. Edge (vj t) will be included in the augmenting path P. Then we look at label l(vj) and so on. In the end we find vertex with label l(vj) = 0 what means that vj is our source s. Such way we find all edges creating the augmenting path P. On these edges we have to change flow. Each edge has own reserve r(vivj) - amount of the flow possible to be added on this edge. The value r(P) represents the reserve of the augmenting path P. It is defined as:
Then the flow in the network changes in the following way:
After checking all edges meeting mentioned conditions we can remove vertex vi from Q and repeat these steps for vertex situated on the next place in Q. When Q no longer contains a vertex, then we cannot find the augmenting path and therefore there is now actually maximum flow in the network.
Edmonds-Karp algorithm finds the shortest augmenting paths in the network. Our implementation uses exactly one augmenting path in each iteration. Therefore, the computantional complexity of these types is used for solving maximum flow-minimum cut problem is O(VE2), where V is the number of vertices in the network and E is the number of edges.
For optimization we used one modification, which increases the speed of the algorithm. We saturate s − t augmenting paths containing exactly two darts (svi) and (vi t) before starting the Edmonds-Karp algorithm. We compare capacities of these darts and set the flow f on them as: f (svi) = f (vi t) = min(c(sv), c(vt)). Therefore, one of these edges will be saturated. We apply this on every vertex vi. Consequently, there will be augmenting paths of length, at least three in the network. Then the Edmonds-Karp algorithm finds maximum flow.
3 Experimental procedures
3.1 Transformation of real data into network
The data comes from Comenius University. They are actually examining a production of iron in cells of living organisms. The theory states that in a certain part of the brain with Purkyne cells more iron cells appear than in another part. Our task is to confirm this statement using our segmentation techniques. Therefore we acquired grayscale and coloured images obtained by microscope. These images contain brain cells of rabbits after irradiation with the GSM the signal.
We created a program satisfying the conditions for this specific problem and working with these specific sorts of images. We use segmentation, histogram counting and percentual ratio of segmented area to confirm this statement.
An important remark is that the obtained segmentation by the Edmonds-Karp algorithm is not enough for obtaining requested results. The mentioned algorithm gives us just very basic results. But we needed to create other new algorithms and new mathematical tools for obtaining "good" segmentation, as well as detection in which region more cells appear. For this we needed to develop other algorithms and counting histograms as well as vector analysis.
First, we need to transform a biomedical image into the network. We show the transformation on a grayscale image containing pixels p with intensities Ip in the range of 0 to 255. This approach was first presented by Boykov in [3, 13].
Single pixels of the image become vertices and boundaries of pixels become edges in the network. Edges represent relationships between neighboring pixels. We consider four pixels as neighbors to pixel p. In that way we receive an unordered graph. Each network contains two special vertices source s and sink t. We add these two in our graph and connect them through arrows with each vertex in the graph. The orientation of these darts is su and ut and they are called t−links. An orientation of remaining edges has to satisfy the following condition. When it is possible to get from vertex u to v, then there has to be an opportunity to get from v to vertex u. Therefore we replace the original edge with two darts with opposite orientation and the same capacity. These darts are called n − links. The capacities of darts are based on the difference of intensities of neighboring pixels.
At the beginning we have to select some source pixels. We want to segment an image into two regions - an object and background region. We choose pixels best describing the object and these pixel then will belong to the object set O. Pixels that best describe background will belong to the background set B. At least one pixel must be chosen to each set, but no pixel can belong to both sets. For us, the pixels in the first set will represent iron in cells. To source pixels there belong certain vertices in the network - source vertices.
The minimum s − t cut algorithm divides our network into two sets of vertices. The vertices v assigned to set O remain reachable from the source s, so there exists the s −v path while there does not exists v − t path, because the reserve (vt) = 0. Similarly for the vertices v in set B there exists v − t path and does not exists s − v path.
We set capacities within a simple way. Let have an image with pixel intensities Ip. Then find maximum value M and minimum value L of intensity in the image. The difference between maximum and minimum value is D = M − L. The average value of source pixels in set O is
These t − link capacities are called regional property and represent a penalty for incorrect assignment of pixel to set O or B. The coefficient λ sets the weight of this regional property and affects a result of segmentation. A smaller value leads to objects with smoother boundaries.
Next we will ensure that selected source pixels remain in the set we selected at the beginning. For the t − links pixels satisfies a special property: the vertex v ∈ O has to be always reachable from the source s and sink t cannot be reached from v. Therefore the capacities for v must satisfy a special property:
For v ∈ B it is opposite:
The last thing to solve is a capacity of n − links. It can be easily defined as:
The n −link capacities are called "boundary property" and represents penalty for discontinuity between neighboring pixels. We get large value pixels that have similar color and smaller value for pixels of different colors. These two properties use Boykov and Jolly [3] for determining the cost function, which minimization is equivalent to final segmentation.
3.2 Finding the minimum s–t cut
The theorem of Ford and Fulkerson states that a maximum flow from s to t saturates a set of edges corresponding to a minimum s − t cut. Moreover, the cost of the minimum cut is equal to the value of the maximum flow. Thus, the minimum cut and the maximum flow are dual problems. By finding the maximum flow we receive the minimum cut. The Ford–Fulkerson algorithm is a basic algorithm that solves the maximum flow problem. It belongs to the group of augmenting path algorithms. The augmenting path is a path from s to t that has available capacity on all its edges. The main idea is that we start with zero flow and as long as an augmenting path exists, we push the maximum possible flow along it – we saturate it. By saturating each augmenting path the total flow in the graph is increased. Once no an augmenting path exists, the maximum flow is reached and the algorithm terminates.
3.3 Marking procedure
This procedure performs a search for an augmenting path. Let f (e) denote current flow in the edge e, c(e) is the capacity of e.
Mark source node s, all other nodes are not marked.
(exists e = (p, q) ∈ E, p is marked, q is not marked, f (e) < c(e)) mark→ q
(exists e = (p, q) ∈ E, pi is not marked, q is marked, −c(e) < f (e))→mark p
If t is marked, an augmenting path exists. STOP.
If no node has been marked since last loop iteration, no augmenting path exists. STOP.
GOTO 2.
The steps 2 and 3 can be implemented in various ways. The Edmonds–Karp algorithm uses breadth-first search, which results in finding the shortest augmenting path in each step. For the reconstruction of the augmenting path we need to record which node caused the marking and in which direction; step 2 “marks forwards”, step 3 “marks backwards”. Then, the augmenting path can be reconstructed by tracing back from t to s.
3.3.1 Tracing back and saturating the augmenting path
When the sink t has been marked, we reconstruct the augmenting path. Simultaneously we find the maximum value of flow which can be added to the former flow along this path. This increment is strictly positive. It is added to the flow in edges “marking forwards” and is subtracted from the flow in edges “marking backwards”.
3.3.2 Ford–Fulkerson algorithm
Perform the marking procedure. If there is no augmenting path, GOTO 3.
Trace back and saturate the augmenting path. GOTO 1.
Maximum flow has been reached. Let S be a set of all nodes that have been marked by the last marking procedure in step 1. Let T = V∖S.{S, T} is the minimum s − t cut.
Generally the Ford–Fulkerson algorithm is not always finite. But assuming finite integral (or rational) capacities of all edges, the algorithm finishes in finite number of steps. Each step increases the total flow by a positive value, in case of integral capacities by at least 1. The maximum flow is finite, thus only only a finite number of augmenting paths will be found.
Note: (CPU). By this algorithm we can find solution in time O(|E|.F), where |E| is the whole number of edges and F is the size of maximal flow. Finding of the augmenting path has CPU O(|E|) and we need to find such paths at most F, because we increase the whole flow according to the augmenting path at least in 1.
3.4 Modifications of the algorithm
Here we present two major changes in the implementation of the Edmonds–Karp algorithm. The first one is easy to perform, significantly reduces running time with graphs based on real data and does not change the result compared to non-modified algorithm. Second modification further improves the speed of the algorithm. While the resulting segmentation is no longer the same, we show that it corresponds better to the expectations in our application.
3.5 Improvement of the marking procedure
The original marking procedure stops right after the sink has been marked. Then we are able to reconstruct only one augmenting path. However, if we allow multiple marks of the sink, more than one augmenting path can be found at once after performing one marking procedure. As a breadth-first search is used, all these paths found in one step have the same length. Because the marking procedure is a very time consuming operation, this modification reduces the total count of marking procedures before the algorithm terminates. Note that now not all of these paths found in one step will actually increase the total flow in the graph. The reason is that multiple paths can share some of their edges. There is a chance that by saturating one path we also saturate others. In the worst case only one of these paths will increase the total flow while others will not; this modification would not bring any advantage in this case. But tests with graphs constructed in our application show that the implementation modified in this way completes the segmentation process about ten times faster than the original algorithm while the results of both implementations are identical.
3.6 Further modifications
The original algorithm used for image segmentation starts by marking the source. In the next step it marks all nodes connected to the source by a non-saturated edge, which often means vast majority of the set P. So the algorithm spends a lot of time in those parts of the image that are far from expected result. Following alternation of the algorithm significantly reduces this problem. First, we define a new function that will help to describe the alternated algorithm. It is clear that for all p ∈ P a path only consisting of two t-links (s, p), (p, t) is the augmenting path if neither of these links is saturated. The saturation of all these paths will always be the first step of the algorithm and leads to the saturation of at least one t-link in each path. At most one t-link to each node p preserves free capacity. For all p ∈ P we define a new function R(p) : P −→ R as follows:
This function fully describes the state of all t − links after previously introduced first step of the algorithm. A positive value means that the t-link from the source has some remaining capacity R(p), while the t-link to the sink is fully saturated. A negative value indicates that the t-link from the source is saturated, while the t-link to the sink preserves capacity |R(p)|.R(p) = 0 means that both t-links got saturated. We evaluate this function during the construction of the graph. Now we propose to start the marking procedure from all object seeds instead of the source s. The procedure will end by marking any p ∈ P so that R(p) < 0. Because the starting node is connected to the source by a non-saturable edge (with infinite capacity) and the node at the end is connected to the sink by a nonsaturated edge, we have found one augmenting path from the source to the sink. However, this path never includes t-links from the source with a finite capacity. These links would be meaningless. Therefore we also modify the procedure reconstructing the augmenting paths. Instead of one path we reconstruct more of them. Each of them starts in the source, follows a different t-link, then they unite one after another and finally they reach the sink together using common t-link. They form a system of paths that can increase the total flow at most by the value −R(p), where p was the last node marked at the end of the marking procedure. While following the path back we bring flow.
3.7 Reconstruction of the system of paths
Results of the algorithm modified in this way will differ from the unchanged algorithm. In general, we perform the marking in a smaller area, thus resultant object segment will be smaller, especially in the case of the result consisting of several disjoint areas. The resultant segmentation of the original algorithm can contain more disjoint segments even if there was only one object seed. Our modified algorithm requires at least one object seed in every disjoint segment, otherwise marking would neither start in this segment nor reaches it. This requirement is not a limitation in our application, our goal is to segment only one object.
Note: CPU after all this optimization is reduced to O(V2E) and for some dense graphs it can be reduced to O(V3).
3.8 The program functionality and implementation
Basic outline of functions needed to implement the consist of an image data loading, creating a network and its representation, finding a maximum flow and finally creating a segmented image based on reserves remaining on darts in the network after the last step of the algorithm. But just to see the resulting image is not enough for us and we need to get numerical results to confirm the theory about gathering the iron cells in the region close to the Purkyne cells. We suggest our own methods to calculate amount of segmented pixels in the image. The first method better visualizes concentration of cells and gives us a grayscale result on square net of the image with brighter squares representing higher concentration. Next method uses histogram of image describing numbers of pixels segmented on a user defined line and lines parallel to it. The line is named as the direction vector. Consequently percentage of segmented pixels in a user defined region is counted based on this histogram. Last method implemented is our interpretation of region-growing method to determine the amount of iron cells in the image, because one cell can be formed from more pixels. Detailed description of them is listed in following rows. These methods and our program was designed for the specific purpose of counting iron cells and determining the region with more cells.
We implemented the maximum flow-minimum cut method for solving segmentation problem in Microsoft Visual Studio environment in C++ language. We find minimum cut with the Edmonds-Karp algorithm described above. Our program has a graphic user interface with more control elements and two main windows as shown in Figure 2. The user loads a gray scale or color image in the left window. Then the user can choose the source pixel or pixels of the object and the background, a direction vector and a threshold value. One pixel in each set will be sufficient for a maximum flow-minimum cut algorithm, but for reaching more accurate results we recommend to choose more source pixels. The direction vector determines the direction of counting of segmented pixels. Threshold value sets the upper threshold in our case, because we have segment images with bright background and dark objects and bright pixels have higher values of intensity. The only parameter in our program is λ-value, which has an influence on the result of segmentation. The last thing to set is a length of the side of the square. There the image will be divided into squares colored according to the number of the segmented pixels as one of the results. All these settings are situated in the upper part of the program highlighted in blue colour.
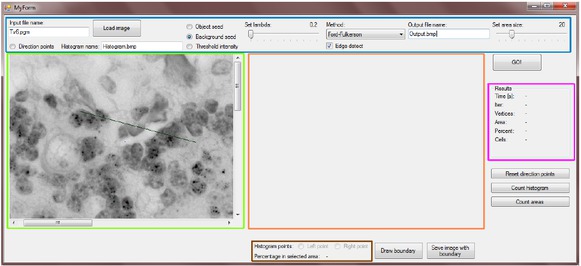
Program user interface: The part highlighted in the blue colour contains initialization settings and tools. The part highlighted in the green colour serves first for clicking on the object and the background pixels or for choosing the direction vector. Later it displays image with segmentation and regions selected in the histogram. In the orange rectangle histogram will be displayed. Numerical results will be shown in the purple rectangle. And finally the region with brown boundary defines the histogram processing part and after segmentation displays the percentage of segmented pixels in the selected region.
Since we are doing a binary segmentation, a result will be two sets of pixels - object and background pixels. After finishing the algorithm, more information about the segmentation and results in form of images will be displayed, see Figure 3. The most important information is displayed under labels Area, Percent and Cells in the right part of the program highlighted in the purple colour in the Figure 2. A total number of segmented pixels from the whole image is displayed in a row labeled as Area, how many percents it is from all the pixels in the image is displayed in a row labeled as Percent and in a row labeled as Cells we can find number of independent segmented objects. When two neighbouring pixels (squares with common edge, not just the vertex) are marked in process of segmentation as object pixels, they will belong to the same object. Then two regions that touch just in diagonal pixels are considered as two objects.
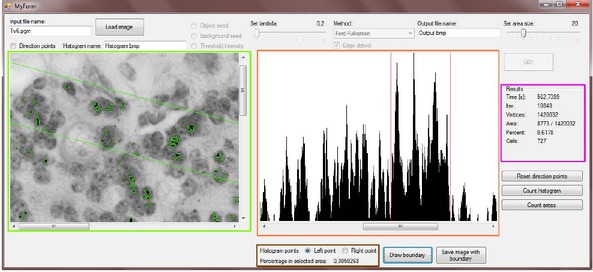
Displaying results in our program: The part in the green rectangle shows segmented iron cells and user selected region. Histogram with two columns selected is displayed in the orange rectangle. Two red columns represent two green lines in the image in the left window. Numerical results are in the purple rectangle. The percentage of segmented pixels in the region between the two green lines is written in the brown rectangle.
An image in the left window highlighted in the green colour will be redrawn and will show highlighted objects founded in the process of segmentation. If the user has selected a direction vector, the histogram will be displayed in the right window highlighted in the orange colour. This histogram represents absolute numbers of segmented pixels on lines parallel to the direction vector. It means the program passes the whole image line after line in the selected direction so that each pixel belongs to exactly one line and count absolute numbers of segmented pixels on each line. These numbers are shown on the y-axis of the histogram, on the x-axis there are indexes of lines. Then the histogram processing part of program highlighted in brown under the image of histogram becomes active. The user can select two columns in histogram that represent number of segmented pixels on two lines in the resulting image. After that the program returns number of segmented pixels in the region between these two lines in the image compared to all segmented pixels in the image. This result is shown in a percentage form and can acquires values from range 0 to 1. At the same time the lines forming boundaries of a selected region are displayed in image in the left window (highlighted in the green colour). When the user is satisfied with the results he/she can save these images or he/she can select other lines in the histogram or a different direction vector.
The results, saved automatically, belongs to the black-white image showing white objects on a black background, while boundaries of these objects can be also be highlighted in this image, see Figure 7. The next automatically saved result shows highlighted objects in an original image. The special image is created as one of the results. This grayscale image of the size the original image shows square net with a square edge of a size chosen by the user. Each square has an intensity ranging 0 to 255 according to the number of segmented pixels in the original image in region falling to this square. This number is normalized what means that in a region of the original image in the region falling to this square. This number is normalized which means that in a region of the original image belonging to the white square there occurs the most segmented pixel. The darker a square is the least segmented pixels to appear in this region. The result in this form is situated in the Figure 8.
For representing our image as a network (transformation was mentioned in the section 3.1) we use structures and classes. We have classes named Vertex, Arrow (a dart), Seed and a structure named Histogram. All of the vertices and darts in the network are grouped in arrays, so every vertex and dart has a unique index. The class Vertex consists of information such as indexes of incident darts and at the same these darts are divided into arrays of direct and reverse darts. This step increases memory requirements, but also increases the speed of searching of the augmenting path. We also need an index of previous vertex during the reconstructiong of the augmenting path, so this information will be stored too. The class Arrow (darts) contains two indexes - vertex where a dart starts and ends, a capacity and a reserve of a dart. The program contains two objects of the class Seed. The one is an array of source vertices of an object and the second is an array of source vertices of the background.
The structure Histogram will contain information about starting and ending point of a direction vector and every line on which histogram is counted. Also the number of segmented pixels on every line is saved.
After the network is constructed, that means all objects of classes Vertex and Arrow (a dart) are initialized, source pixels are set, capacities of darts are set, maximum flow is counted. When working with color images, capacities are set three times for each color channel separately and maximum flow is also counted three times. After some experiments with selecting the final segmentation, we select the second option below, because it is better for our type of images containing a background of mainly pink, red and white color. The first one is to create a final segmentation from pixels that are segmented at least on two color channels. The second one is to select just segmentation done on the red channel. There are other types of color image processing, too. But we coded just this option for our purpose.
For increasing the speed of the Edmonds-Karp algorithm we use optimization mentioned in Section 2.3. After the algorithm terminates, we get final the segmentation 4
Results: Final segmentation and corresponding histogram
4 Real data processing and results
We are working with real images of brain cells containing iron and our goal is to segment the iron from images as good as possible. A suitability of the segmentation is judged visually, as the cells have different sizes and also the intensity of iron varies, so some iron cells could be brighter than others. Also the edges of iron cells are not sharp therefore could be also a certain part of the background assigned to iron cells. We have to make a compromise and pick the segmentation that finds enough iron cells and at the same does not assign a lot of pixels of the background to the objects.
We used image pre-processing on some pictures to get clearer edges of cells and better contrast. At the same we tried to keep original information in the image. Our preprocessing consists of techniques called histogram equalization, contrast adjustment and shadow correction.
Choosing different source pixels returns different segmentation. We set the value of the parameter λ = 2, because our objects have small size and must not have a smooth boundary. In the following figures there are results obtained by our program using a color image as a source image.
In the Figure 6 there is the selected part of original image (Figure 5) after application of the enhancement. The result of segmentation with highlighted cells is in the Figure 7 and image with square net of square length 70 pixels is shown in the Figure 8. In the next Figure 10 it is possible to observe in that lower part of the image there is concentrated 52.50% of all segmented pixels. This result is obtained from the histogram on the Figure 9 , where the direction vector is set parallel to the upper edge of the enhanced image.
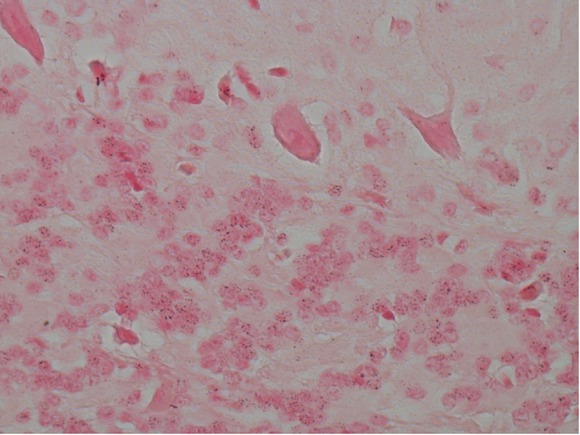
Biological data: The original image.
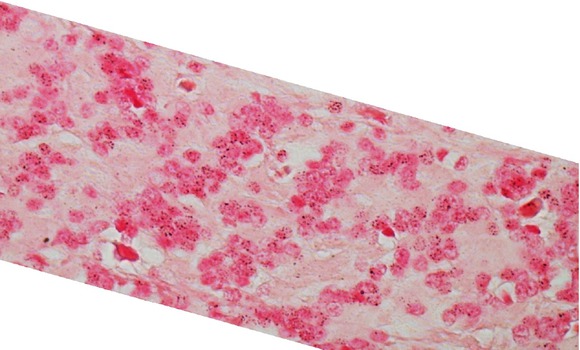
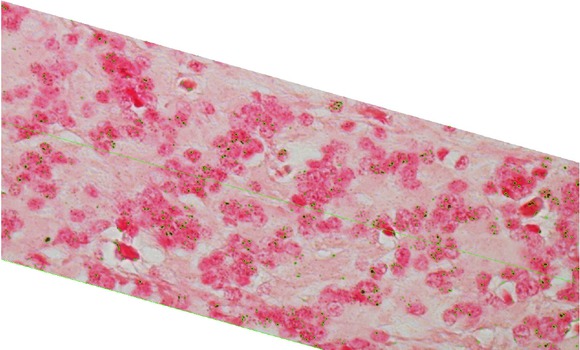
The selected part of original image after application of enhancement.
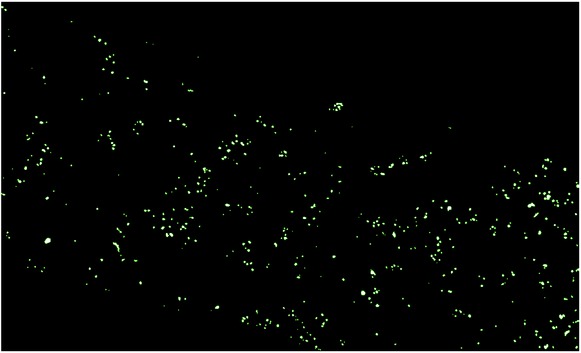
Results: Results in a form of a binary image.
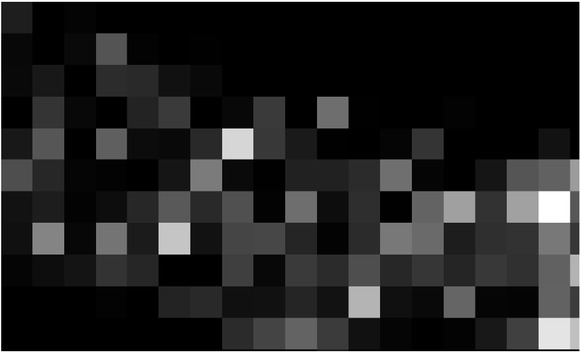
Results: The brighter a square is the higher the concentration is. The edge of the square is 70 pixels long.
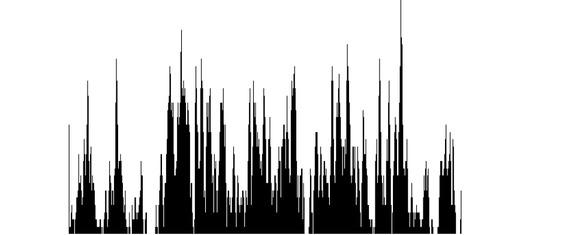
Histogram: Histogram counted according to the direction vector (57,-16).
Results: In the lower part of the image there is concentrated 52.50% of all segmented pixels.
In the Figures 11, in the upper row on the left hand side there is the original image. On the right hand side there is the cut and the enhanced image and in the bottom row there are the results of segmentation in the form of a binary image on the left hand side and image with highlighted segmentation on the right hand side. The last Figure 13 shows the highlighted line which divides image into two halves. On the right hand side there occur 59.49% of all segmented pixels in the image. The histogram is counted according the direction vector set parallel to the edge of the enhanced image, too.
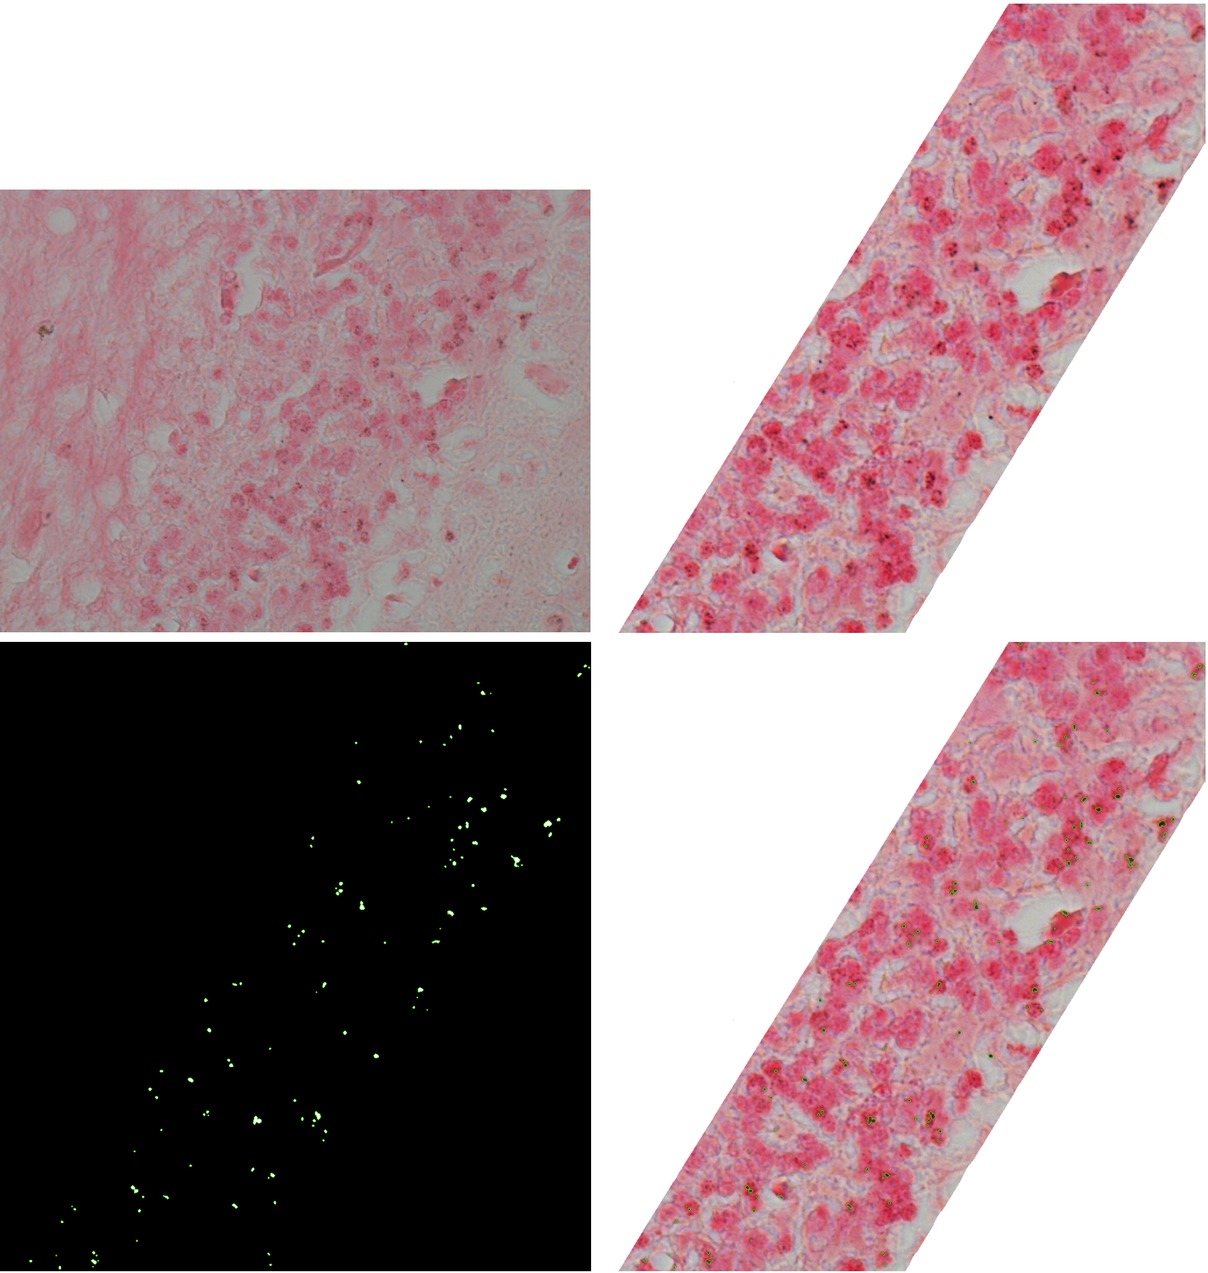
Results: In the upper row on the left hand side there is the original image, on the right hand side there is the cut and enhanced image and in the bottom row there are the results of segmentation in a form of a binary image on the left hand side and an image with highlighted segmentation on the right hand side.
Using these techniques we successfully identified small dark iron cells in the images of the rabbits brain and the obtained results confirmed that in the region close to the Purkyne cells there is a higher concentration of iron cells than in the other region after using GSM radiation on the brain of a rabbit.
5 Discussion and Conclusion
In this work we show the application of segmentation techniques of the graph theory on real biomedical images. The specialized executable program with implementation of the edge detection, region growing method, own visualization method and histogram counting according to a selected direction was written for solving the specific problem - segmentation of iron cells and determining of the amount of iron in the selected region of an image. We solve the segmentation problem using the maximum flow-minimum cut method, where maximum flow is counted with modification of the Edmonds-Karp algorithm.
We implemented functions important according the request for processing of data. We included also an algorithm of detection of edges for highlighting segmented objects into input data. We created the function which counts all segmented pixels by lines in any direction of the im age and then created a histogram form of these data. By the help of that we counted the percentile area of cells in the selected regions. Implementation of the mentionned function and algorithms into one program is our own approach.

Histogram: Histogram counted according to the direction vector (37,60).
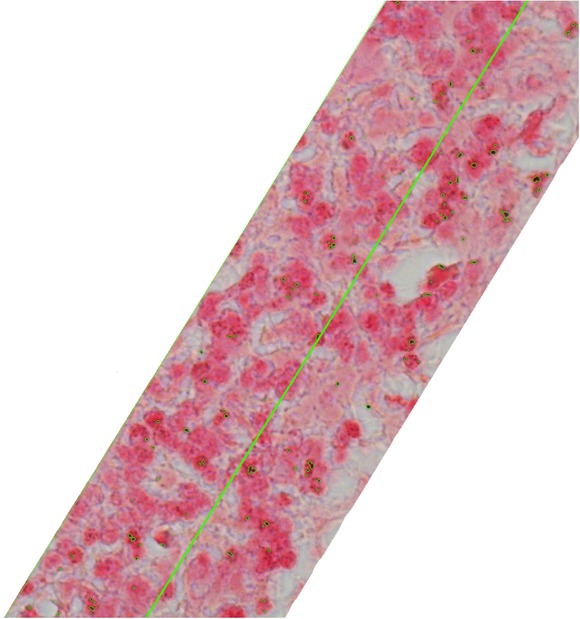
Results: The highlighted line divides the image into two halves. On the right hand side there occur 59.49% of all segmented pixels.
Identification and segmentation of iron cells was successful and with using of the histogram and counting percentage of segmented pixels in specific region we proved that after irradiation there are situated more iron cells in region near the Purkyne cells than in the other region in the rabbit’s brain. There is also some segmentation error, but it has no influence on results because of results scaling and error scaling. The error is evenly distributed in the whole image. So we give the algorithmic prove of the occurrence and gathering of iron cells in the rabbit’s brain after irradiation in this paper.
Acknowledgement
This work was supported by the Slovak Agency for Research and Development No. APVV-16-0039, No. VEGA 1/0006/19 and No. APVV-14-0013.
References
[1] Bondy J.A., Murty U.S., Graph theory with applications, Great Britain, The Macmillan Press Ltd., 1976.10.1007/978-1-349-03521-2Search in Google Scholar
[2] Boykov J., Funka-Lea G., Graph Cuts and Eflcient N-D Image Segmentation, International Journal of Computer vision 70(2), 2006, 109-131.10.1007/s11263-006-7934-5Search in Google Scholar
[3] Boykov Y., Jolly, M. P., Interactive Graph Cuts for Optimal Boundary & Region Segmentation of Objects in N-D Images, Proceedings of Image Segmentation, International Journal of Computer Vision Issue 2, 2006, 109-131.10.1007/s11263-006-7934-5Search in Google Scholar
[4] Boykov Y., Versler O., Graph Cuts in vision and graphics: theories and applications, Handbook of Mathematical models on computer vision, New York, Springer, 2006, 100-118.Search in Google Scholar
[5] Felzenszwalb P. F., Huttenlochter, D.P.: Eflcient Graph-Based Image Segmentation, International Journal of Computer Vision. Vol. 59, 2, 2004, 167-181.10.1023/B:VISI.0000022288.19776.77Search in Google Scholar
[6] Ford Jr. L. R., Fulkerson D. R., Maximal Flow through a Network, Canadian Journal of Mathematics, Vol. 8, 1956, 399-404.10.1007/978-0-8176-4842-8_15Search in Google Scholar
[7] Goldberg A. V., Tarjan R. E., A New Approach to the Maximum-Flow Problem, Journal of the Association for Computing Machinery, 35, No. 4, 1988, 921-940.10.1145/12130.12144Search in Google Scholar
[8] Gonzalez R. C., Woods, R.E., Digital Image Processing, 3rd Edition. New York, Prentice Hall, 2008.Search in Google Scholar
[9] Greig D., Portheous B., Seheult A., Exact maximum a posteriori estimation for binary images, Journal of the Royal Society Series B51, 2, 1989, 271-279.10.1111/j.2517-6161.1989.tb01764.xSearch in Google Scholar
[10] Grady L., Random Walks for Image Segmentation, IEEE Transactions on Pattern Analysis and Machine Intelligence, Vol. 28, 11, 2006, 1768-1783.10.1109/TPAMI.2006.233Search in Google Scholar PubMed
[11] Karzanov A. V., Determining the Maximal flow in a Network by the Method of Preflows, SovietMath. Dokl., Vol. 15, 2, 1974, 434-437.Search in Google Scholar
[12] Knor, M., Graph Theory, Bratislava, Print by STU, Slovak University of Technology in Bratislava, 2008, ISBN 978-80-227-2879-9, (in slovak).Search in Google Scholar
[13] Loucký J., Oberhuber T., Graph Cuts in Segmentation of a Left Ventricle from MRI Data, Proceedings of Czech-Japanese Seminar in Applied Mathematics 2010, COE Lecture Note, Vol.36, 2012, 46-54Search in Google Scholar
[14] Shi J., Malik J., Normalized Cuts and Image Segmentation, IEEE Transactions on Pattern Analysis and Machine Intelligence, Vol. 22, 8, 2000, 888-905.10.1109/34.868688Search in Google Scholar
[15] Wu Z., Leahy R., An Optimal Graph Theoretic Approach to Data Clustering: Theory and Its Application to Image Segmentation, IEEE Transactions on Pattern Analysis and Machine Intelligence, Vol. 15, 11, 1993, 1101-1113.10.1109/34.244673Search in Google Scholar
[16] Sonka M., Hlavac J., Boyle R., Graph cuts segmentation, Image processing, analysis and machine vision, 3.rd ed. TORONTO, Thompson learning, 2008, 980-306.Search in Google Scholar
[17] https://en.wikipedia.org/wiki/Cluster_analysis (24-04-2017)Search in Google Scholar
[18] https://en.wikipedia.org/wiki/Image_segmentation (23-04-2017)Search in Google Scholar
© 2019 M. Ždímalová et al., published by De Gruyter
This work is licensed under the Creative Commons Attribution 4.0 International License.
Articles in the same Issue
- Regular Articles
- Non-equilibrium Phase Transitions in 2D Small-World Networks: Competing Dynamics
- Harmonic waves solution in dual-phase-lag magneto-thermoelasticity
- Multiplicative topological indices of honeycomb derived networks
- Zagreb Polynomials and redefined Zagreb indices of nanostar dendrimers
- Solar concentrators manufacture and automation
- Idea of multi cohesive areas - foundation, current status and perspective
- Derivation method of numerous dynamics in the Special Theory of Relativity
- An application of Nwogu’s Boussinesq model to analyze the head-on collision process between hydroelastic solitary waves
- Competing Risks Model with Partially Step-Stress Accelerate Life Tests in Analyses Lifetime Chen Data under Type-II Censoring Scheme
- Group velocity mismatch at ultrashort electromagnetic pulse propagation in nonlinear metamaterials
- Investigating the impact of dissolved natural gas on the flow characteristics of multicomponent fluid in pipelines
- Analysis of impact load on tubing and shock absorption during perforating
- Energy characteristics of a nonlinear layer at resonant frequencies of wave scattering and generation
- Ion charge separation with new generation of nuclear emulsion films
- On the influence of water on fragmentation of the amino acid L-threonine
- Formulation of heat conduction and thermal conductivity of metals
- Displacement Reliability Analysis of Submerged Multi-body Structure’s Floating Body for Connection Gaps
- Deposits of iron oxides in the human globus pallidus
- Integrability, exact solutions and nonlinear dynamics of a nonisospectral integral-differential system
- Bounds for partition dimension of M-wheels
- Visual Analysis of Cylindrically Polarized Light Beams’ Focal Characteristics by Path Integral
- Analysis of repulsive central universal force field on solar and galactic dynamics
- Solitary Wave Solution of Nonlinear PDEs Arising in Mathematical Physics
- Understanding quantum mechanics: a review and synthesis in precise language
- Plane Wave Reflection in a Compressible Half Space with Initial Stress
- Evaluation of the realism of a full-color reflection H2 analog hologram recorded on ultra-fine-grain silver-halide material
- Graph cutting and its application to biological data
- Time fractional modified KdV-type equations: Lie symmetries, exact solutions and conservation laws
- Exact solutions of equal-width equation and its conservation laws
- MHD and Slip Effect on Two-immiscible Third Grade Fluid on Thin Film Flow over a Vertical Moving Belt
- Vibration Analysis of a Three-Layered FGM Cylindrical Shell Including the Effect Of Ring Support
- Hybrid censoring samples in assessment the lifetime performance index of Chen distributed products
- Study on the law of coal resistivity variation in the process of gas adsorption/desorption
- Mapping of Lineament Structures from Aeromagnetic and Landsat Data Over Ankpa Area of Lower Benue Trough, Nigeria
- Beta Generalized Exponentiated Frechet Distribution with Applications
- INS/gravity gradient aided navigation based on gravitation field particle filter
- Electrodynamics in Euclidean Space Time Geometries
- Dynamics and Wear Analysis of Hydraulic Turbines in Solid-liquid Two-phase Flow
- On Numerical Solution Of The Time Fractional Advection-Diffusion Equation Involving Atangana-Baleanu-Caputo Derivative
- New Complex Solutions to the Nonlinear Electrical Transmission Line Model
- The effects of quantum spectrum of 4 + n-dimensional water around a DNA on pure water in four dimensional universe
- Quantum Phase Estimation Algorithm for Finding Polynomial Roots
- Vibration Equation of Fractional Order Describing Viscoelasticity and Viscous Inertia
- The Errors Recognition and Compensation for the Numerical Control Machine Tools Based on Laser Testing Technology
- Evaluation and Decision Making of Organization Quality Specific Immunity Based on MGDM-IPLAO Method
- Key Frame Extraction of Multi-Resolution Remote Sensing Images Under Quality Constraint
- Influences of Contact Force towards Dressing Contiguous Sense of Linen Clothing
- Modeling and optimization of urban rail transit scheduling with adaptive fruit fly optimization algorithm
- The pseudo-limit problem existing in electromagnetic radiation transmission and its mathematical physics principle analysis
- Chaos synchronization of fractional–order discrete–time systems with different dimensions using two scaling matrices
- Stress Characteristics and Overload Failure Analysis of Cemented Sand and Gravel Dam in Naheng Reservoir
- A Big Data Analysis Method Based on Modified Collaborative Filtering Recommendation Algorithms
- Semi-supervised Classification Based Mixed Sampling for Imbalanced Data
- The Influence of Trading Volume, Market Trend, and Monetary Policy on Characteristics of the Chinese Stock Exchange: An Econophysics Perspective
- Estimation of sand water content using GPR combined time-frequency analysis in the Ordos Basin, China
- Special Issue Applications of Nonlinear Dynamics
- Discrete approximate iterative method for fuzzy investment portfolio based on transaction cost threshold constraint
- Multi-objective performance optimization of ORC cycle based on improved ant colony algorithm
- Information retrieval algorithm of industrial cluster based on vector space
- Parametric model updating with frequency and MAC combined objective function of port crane structure based on operational modal analysis
- Evacuation simulation of different flow ratios in low-density state
- A pointer location algorithm for computer visionbased automatic reading recognition of pointer gauges
- A cloud computing separation model based on information flow
- Optimizing model and algorithm for railway freight loading problem
- Denoising data acquisition algorithm for array pixelated CdZnTe nuclear detector
- Radiation effects of nuclear physics rays on hepatoma cells
- Special issue: XXVth Symposium on Electromagnetic Phenomena in Nonlinear Circuits (EPNC2018)
- A study on numerical integration methods for rendering atmospheric scattering phenomenon
- Wave propagation time optimization for geodesic distances calculation using the Heat Method
- Analysis of electricity generation efficiency in photovoltaic building systems made of HIT-IBC cells for multi-family residential buildings
- A structural quality evaluation model for three-dimensional simulations
- WiFi Electromagnetic Field Modelling for Indoor Localization
- Modeling Human Pupil Dilation to Decouple the Pupillary Light Reflex
- Principal Component Analysis based on data characteristics for dimensionality reduction of ECG recordings in arrhythmia classification
- Blinking Extraction in Eye gaze System for Stereoscopy Movies
- Optimization of screen-space directional occlusion algorithms
- Heuristic based real-time hybrid rendering with the use of rasterization and ray tracing method
- Review of muscle modelling methods from the point of view of motion biomechanics with particular emphasis on the shoulder
- The use of segmented-shifted grain-oriented sheets in magnetic circuits of small AC motors
- High Temperature Permanent Magnet Synchronous Machine Analysis of Thermal Field
- Inverse approach for concentrated winding surface permanent magnet synchronous machines noiseless design
- An enameled wire with a semi-conductive layer: A solution for a better distibution of the voltage stresses in motor windings
- High temperature machines: topologies and preliminary design
- Aging monitoring of electrical machines using winding high frequency equivalent circuits
- Design of inorganic coils for high temperature electrical machines
- A New Concept for Deeper Integration of Converters and Drives in Electrical Machines: Simulation and Experimental Investigations
- Special Issue on Energetic Materials and Processes
- Investigations into the mechanisms of electrohydrodynamic instability in free surface electrospinning
- Effect of Pressure Distribution on the Energy Dissipation of Lap Joints under Equal Pre-tension Force
- Research on microstructure and forming mechanism of TiC/1Cr12Ni3Mo2V composite based on laser solid forming
- Crystallization of Nano-TiO2 Films based on Glass Fiber Fabric Substrate and Its Impact on Catalytic Performance
- Effect of Adding Rare Earth Elements Er and Gd on the Corrosion Residual Strength of Magnesium Alloy
- Closed-die Forging Technology and Numerical Simulation of Aluminum Alloy Connecting Rod
- Numerical Simulation and Experimental Research on Material Parameters Solution and Shape Control of Sandwich Panels with Aluminum Honeycomb
- Research and Analysis of the Effect of Heat Treatment on Damping Properties of Ductile Iron
- Effect of austenitising heat treatment on microstructure and properties of a nitrogen bearing martensitic stainless steel
- Special Issue on Fundamental Physics of Thermal Transports and Energy Conversions
- Numerical simulation of welding distortions in large structures with a simplified engineering approach
- Investigation on the effect of electrode tip on formation of metal droplets and temperature profile in a vibrating electrode electroslag remelting process
- Effect of North Wall Materials on the Thermal Environment in Chinese Solar Greenhouse (Part A: Experimental Researches)
- Three-dimensional optimal design of a cooled turbine considering the coolant-requirement change
- Theoretical analysis of particle size re-distribution due to Ostwald ripening in the fuel cell catalyst layer
- Effect of phase change materials on heat dissipation of a multiple heat source system
- Wetting properties and performance of modified composite collectors in a membrane-based wet electrostatic precipitator
- Implementation of the Semi Empirical Kinetic Soot Model Within Chemistry Tabulation Framework for Efficient Emissions Predictions in Diesel Engines
- Comparison and analyses of two thermal performance evaluation models for a public building
- A Novel Evaluation Method For Particle Deposition Measurement
- Effect of the two-phase hybrid mode of effervescent atomizer on the atomization characteristics
- Erratum
- Integrability analysis of the partial differential equation describing the classical bond-pricing model of mathematical finance
- Erratum to: Energy converting layers for thin-film flexible photovoltaic structures