Precipitation of terephthalic acid from post-consumer polyethylene terephthalate waste fractions
-
Clemens Müller
 ,
Dirk Wilhelm Franke-Hameke
,
Dirk Wilhelm Franke-Hameke

Abstract
Achieving circularity for post-consumer polymers requires to address and overcome significant challenges and limitations such as the efficient removal of additives, colourants, contamination from usage and undesired chain scission. A very effective approach is offered by back-to-monomer recycling processes that break up the polymer matrix, release contaminants and yield virgin-like monomers as starting material for polymer production. This study used post-consumer and post-production polyethylene terephthalate (PET) which were depolymerized by revolPET® technology. As a reaction intermediate disodium terephthalate is obtained, from which the monomer terephthalic acid (TA) can be recovered through acidic precipitation. In this present study, precipitation with acetic acid and sulfuric acid is assessed regarding the impact on recycled terephthalic acid properties and the purification potential at temperatures up to 90°C. Precipitation at elevated temperatures reduces the yellow discolouration of TA, with acetic acid being more effective. With regard to isophthalic acid (IA), a common co-monomer in PET manufacturing, an increase in temperature could reduce the IA content in TA to 90% of the original content using sulfuric acid. Precipitation with acetic acid reduced IA content to less than 20%. The results of this study deliver a novel approach to integrate the purification into the TA formation step.
Abbreviations
- BMR
-
back-to-monomer recycling
- DMF
-
dimethyl formamide
- DST
-
disodium terephthalate
- EG
-
ethlyene glycol
- HPLC
-
high performance liquid chromatography
- IA
-
isophthalic acid
- IAS
-
intentionally added substances
- IV
-
intrinsic viscosity [dL·g−1]
- NIAS
-
non-intentionally added substances
- PA
-
precipitation acid
- PET
-
polyethylene terephthalate
- PSD
-
logarithmic volume-related density distribution
- PTA
-
purified terephthalic acid
- rPET
-
recycled polyethylene terephthalate
- rTA
-
recycled terephthalic acid
- SSP
-
solid state polycondensation
- TA
-
terephthalic acid
1 Introduction
The global production of plastics in 2021 mounted up to 390.7 million tons (without plastic fibres), of which the majority of 44% was used as packaging. This share is in a comparable magnitude with the European total plastics demand of 50.3 million tonnes of which 39.1% are posed by packaging. However, the recycled content in new packaging remains globally at 8.5% being lower than the European average of 9.9% for all post-consumer recycled content [1]. Among plastics, polyethylene terephthalate (PET) represents a recycling showpiece with its widely known PET bottle recycling. With 97% (in 2020) of all PET being used in the packaging sector (excluding PET fibres), the European market is primarily split between bottles (70%) and trays (20%). Of these 4.6 million tonnes of rigid PET packaging, 49% were collected and sorted for recycling in 2020 [2]. Despite of these promising numbers, the final recycled content in PET bottles was estimated to only 17% in 2020. At the same time the total market demand for high quality recycled polyethylene terephthalate (rPET) has been increasing, significantly exceeding the supply. Additionally, only 54% of the total PET recycling input leave the recycling facilities as rPET for high viscosity applications and of these only 27% are approved for food contact. In addition to necessary progress in collection and sorting to increase supply and quality of rPET, the limitations of mechanical recycling pose a major challenge [2]. Apart from contaminated input streams, thermal and chemical degradation of the PET polymer during reprocessing limits its mechanical recyclability [3]. On the one hand, the rPET loses tensile strength with every cycle due to polymer chain scission [4]. On the other hand, the polymer gets darker and more yellow with increasing recycled content. The darkening effect is even amplified by blue colourants that are intentionally added as countermeasures for yellowing [5]. Additionally, even small amounts of foreign polymers that incorporate into the PET matrix upon recycling can drastically affect its properties limiting its reapplication [6,7,8]. Back-to-monomer recycling (BMR) offers a currently investigated approach to restore the properties of virgin PET from yet unrecyclable PET feedstocks like brittle bottles, multi-layered trays or even synthetic polyester fibres. While different reaction pathways like alcoholysis, aminolysis or hydrolysis exist, these technologies share the central aim of breaking PET into basic monomeric building blocks. This targeted depolymerisation of the PET polymer matrix releases contaminants, colourants and other by-products that can be subsequently treated and removed [9]. In this work, the products of alkaline hydrolysis will be focussed while more details about alternative BMR processes can be found elsewhere [10,11,12]. Among the different technologies that use alkaline hydrolysis, the depolymerization approach by Brepohl and Biermann et al. displays several advantages [13,14]. By using a continuously operated twin-screw extruder and solid sodium hydroxide, they successfully depolymerize PET dual layer material commonly used for food trays within a reaction time of less than 1 min delivering a depolymerization quota of up to 97% [13]. The resulting ethylene glycol (EG) and terephthalic acid (TA) precursor disodium terephthalate (DST) are subsequently dissolved in water and undergo filtration for solids removal. The resulting mixture is subsequently acidified using a strong acid like sulfuric acid which leads to instant precipitation of TA crystals [13,15].
However, this recycled terephthalic acid (rTA) must meet the industrial specifications in terms of purity, morphological appearance and particle size. The latter define handling properties, such as flowability of equimolar mixtures of rounded purified terephthalic acid (PTA) with EG regarding the subsequent polycondensation of PET [16]. Since TA is synthesized via multistage oxidation of para-xylene it is impurified with reaction intermediates of different degrees of oxidation (p-toluic acid, 4-carboxybenzaldehyde). In consequence, these substances possess only one carboxylic group which can connect to the PET chain on one end only. Therefore, they act as chain terminators which drastically affect the polymer properties and additionally provoke unwanted colouring in the final PET [5,17]. These intermediates are chemically similar to TA and are consequently incorporated in the crude TA crystal. Therefore, the crude TA is treated in an energetically intense hydrogenation step at temperatures exceeding 250°C in order to dissolve TA in water and release impurities from the crystal structure. In the subsequent stepwise flash-crystallisation, TA is selectively crystallized with a reduced amount of contaminants yielding PTA [18,19]. For this reason, PET does not contain critical amounts of these intermediates which displays a fundamental advantage of BMR in comparison to conventional PTA production. However, rTA from BMR is challenged by contaminants of various origins and chemical compositions in its PET feedstock. These can be assigned to three general groups: post-production, post-consumer and recycling induced contaminants [20]. In contrast to mechanical recycling, the degradation of the polymer itself during use and recycling rather eases than complicates depolymerisation in BMR processes. But, since the PET polymer matrix is chemically broken up, antioxidants, thermal stabilizers, plasticisers, friction reducers, co-monomers and barrier polymers are released. With regard to mechanical PET recycling, migration of these compounds onto the plastic surface and into the food content is an unwanted side effect that substantially limits PET circularity (regulative contamination limits [21]) [20]. Furthermore, even super clean recycling processes eventually demand for addition of virgin PET, amongst others to control the negative impact of accumulating recycling additives [22,23]. While this limitation can be directly addressed by BMR on one side, it presents a major challenge on the other side. Coupled with the shear variety of these additives, they can also degrade or take part in consecutive reactions. Thus, intentionally added substances during PET manufacturing for maintaining and extending polymer properties could turn into non intentionally added substances (NIAS) ultimately affecting the rPET safety and its re-polymerization process [15,20]. This challenge was targeted by several research groups that were able to successfully produce rPET from rTA in laboratory and pilot plant scale. Karayannidis et al. polymerized PET with rTA from post-consumer bottle flakes that were depolymerized by alkaline hydrolysis. They did not perform any additional purification apart from solid-liquid separation and necessary TA precipitation [24]. With 0.54 dL·g−1 the resulting intrinsic viscosity (IV) of their PET was in good agreement with the rPET produced by Franco et al. [15]. They depolymerized PET/PE dual layer trays by alkaline hydrolysis, performed an additional purification step to remove soluble impurities before precipitating TA and producing rPET from recycled rEG and rTA. With an IV of 0.599 dL·g−1 their rPET did not only show comparable properties to their virgin PET comparative test (IV = 0.606 dL·g−1) but also a similar purity, e.g Hazen colour index <10. Additionally, they tested for NIAS and proved their rPET to be suitable for food contact. They did not state whether solid state polycondensation (SSP), common in mechanical PET recycling, was applied [15]. Tournier et al. enzymatically depolymerised pre-amorphized PET residue from post-consumer bottle flakes. After subsequent purification by activated carbon and recrystallization at 250°C their rTA had an colour index of 2.9 and the resulting rPET featured an IV of 0.75 dL·g−1 after SSP [25]. Quartinello et al. applied neutral hydrolysis to partly depolymerize PET from textile waste. They used subsequent enzymatic depolymerization of the residual oligomers as a purification method [26]. Their work was continued by Valh et al. who dissolved rTA in sodium hydroxide and subsequently separated oligomers by filtration instead of enzymatic purification. They recovered rTA by acidification with hydrochloric acid and successfully repolymerized it to PET in a mixture with PTA [27]. These examples prove the concept of BMR and reveal a variety of approaches to adjust rTA purity and facilitate its re-polymerization and re-application. Impurities in rTA from PET packaging origin can be removed effectively to meet industrial PTA standards and do not hinder subsequent polycondensation. In the presented studies the Hazen colour index of rTA or rPET samples was determined to evaluate its yellow discolouration. This single parameter is widely applied in PET manufacturing analytics as it is sensitive to a variety of impurities already at low levels [28,29]. However, with regard to realistic waste streams these studies do not present strategies for the separation and removal of the common co-monomer isophthalic acid (IA). IA displays a recycling specific impurity as production of PTA is based on highly purified p-xylene e.g. from the chromatographic Parex™ process. This highly selective process yields a p-xylene practically free of the m-xylene isomer, the precursor for IA production [30].
During polycondensation of PET, IA is usually added in amounts up to 5% of TA mass to slow down the crystallization rate of the final polymer which promotes PET processability and transparency. Especially the latter displays a desired attribute in food packaging and drinking bottles [6,7,20]. This is due to the angular carboxylic group of IA disturbing the crystalline (“parallel”) arrangement of neighbouring PET polymer chains (Figure 1) [31].
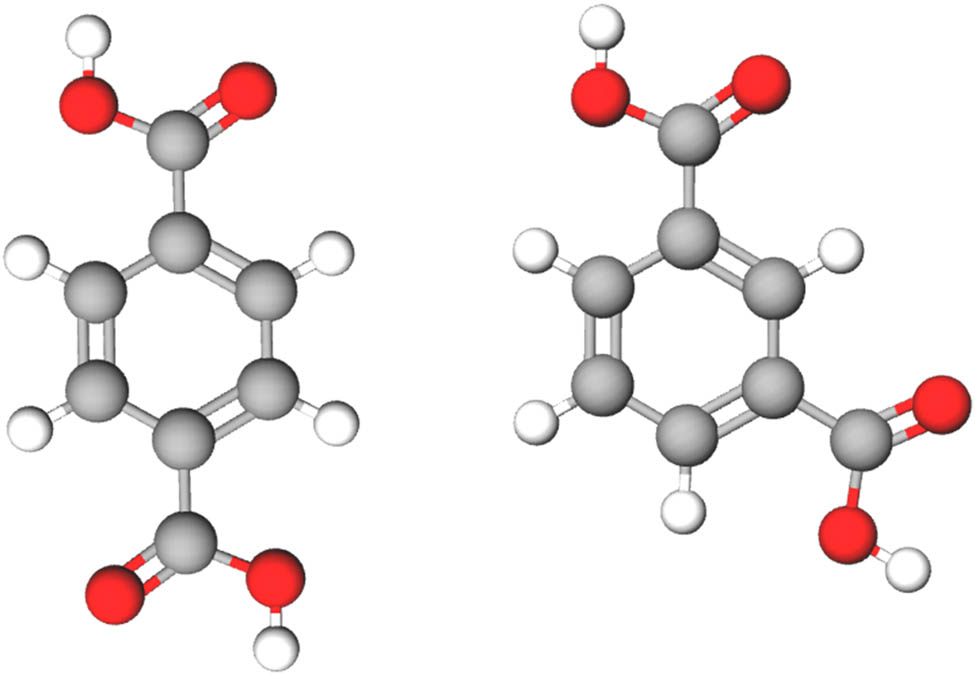
Molecular structure of TA (left) and IA (right), carbon (grey spheres), hydrogen (white spheres), oxygen (red spheres).
Since already small amounts of this co-monomer affect the properties of the final polymer, manufacturers need to control its dosage [6,7]. Additionally, the legal use of recycled monomers might require a time and cost intensive registration of the monomer mixture if the very mixture is not registered yet, e.g. European REACH directive [32]. Thus, IA must be considered an impurity that needs to be separated from rTA [7,24]. Due to its structural similarity with TA as seen in Figure 1, IA can coprecipitate with TA after acidification of the alkaline hydrolysis product of DST and disodium isophthalate (DSI) [24,33]. In order to reduce its incorporation into crystalline rTA, the introduced PTA purification step via hydrogenation and stepwise crystallization serves as an example. This was taken up by Crippa and Morico who suggest a repeated crystallization procedure for purification of TA [6]. In a similar manner Tournier et al. crystallized the TA at 250°C in water for purification but did not mention IA impurities although depolymerizing bottle grade PET [25]. Milder temperatures and an alternative solvent were used by Cheng et al. who recrystallized TA in N,N-dimethylacetamide (DMA) and successfully improved crystal size and purity [34].
Besides that, information about purification in BMR is scarce in open literature as well as in statements by the industry [11]. Thus, to the best of our knowledge the purification capability of the rTA precipitation step has not been addressed in the open literature yet. A first investigation with a model reactant studied the effect of precipitation acid (PA) and temperature on crystal size and TA processability. It demonstrated that especially acetic acid as PA exerts promising effects next to commonly used strong acids like sulfuric acid [12]. The present work extends this investigation to real depolymerization products of post-consumer and production origin containing by-products. In order to discuss the approach of the alternative PA acetic acid, Figure 2 displays the solubilities of TA and IA in acetic acid, water and mixtures of both. Since IA and TA solubility data at temperatures below 100°C is rare, the y-axis is split and intercept distance adjusted in order to visualise data for a higher temperature region in one diagram.
![Figure 2
Solubility of TA (■) and IA (▲) in water, acetic acid and their mixtures, values in brackets represent solvent content and acetic acid content in solvent mixtures respectively, literature data [35,36,37,38,39,40].](/document/doi/10.1515/gps-2023-0244/asset/graphic/j_gps-2023-0244_fig_002.jpg)
While triangles and squares refer to IA and TA respectively, the symbol filling corresponds to the respective solvent or solvent mixture. By comparing the TA and IA solubility in pure water below 100°C it can already be seen that IA is significantly more soluble than TA. For instance, at around 75°C, 1 gIA/kgsolvent of IA is dissolved instead of 0.1 gTA/kgsolvent of TA. This low TA solubility increases upon addition of acetic acid to the solvent mixture, which results in the significant particle size increase during precipitation [12]. However, at temperatures below 60°C, TA solubility in pure acetic acid appears to be lower than in the given higher concentrated aqueous acetic acid mixture. A similar influence is revealed for IA when adding acetic acid for which data is only available at temperatures exceeding 100°C. While IA solubility is generally higher for acetic acid compared to the aqueous solvent, their higher concentrated mixtures surmount pure acetic acid solubility above 100°C. This is attributed to the maximum solubility effect as predicted by the Scatchard-Hildebrand solution theory [41]. Transferring this information to the precipitation from realistic feedstocks containing IA and TA leads to the assumption that the selectivity of TA precipitation can be increased by acetic acid as PA. Additionally, due to the generally low IA content in PET, a higher precipitation temperature could lead to IA remaining in solution instead of precipitating simultaneously. Based on this approach, this work also investigates the general impact of the PA and temperature on coloured impurities. Additionally, the influence of EG on the precipitation will be evaluated as it is reported to reduce DST solubility [42]. The experiments are conducted with real hydrolysis products in comparison to a model reactant using acetic and sulfuric acid in comparison [12].
2 Materials and methods
2.1 Materials
Solid sodium hydroxide (≥98%) was purchased from Carl Roth, Karlsruhe, Germany. TA (≥99%) was obtained from Acros Organics, The Hague, Netherlands. Sulfuric acid (≥99%), acetic acid (≥99.85%) and IA (≥99%) were purchased from Sigma Aldrich, St. Louis, USA. PAs were used at 0.25 gacid/gtotal aqueous dilution. The PET reactants (Table 1) were depolymerized by RITTEC 8.0 Umwelttechnik GmbH using the revolPET® technology in which PET is hydrolysed using solid sodium hydroxide in a reactive extrusion process [12,13,14,15]. The resulting DST and EG monomer are subsequently dispersed in demineralized water while insoluble components are separated in a consecutive solid/liquid separation step. The resulting yellow coloured solution is used in the precipitation experiments and not purified by activated carbon nor extractive processes.
Description of the used PET reactants
| PET reactant | Reactant description | Source |
|---|---|---|
| PET/PE (colourless) | Dual layer, food tray material, post production | W.u.H. Fernholz GmbH & Co. KG |
| Undersized PET light blue | Mono layer, sieve residue of PET bottle recycling, post-consumer | Veolia environmental services S.A. |
| PET light blue | Mono layer, mixture of blue/colourless shredded bottle flakes, post-consumer | Source One GmbH |
| Model (non-PET) | DST solution from purified terephthalic and IA | — |
The respective PET reactant of the revolPET® process was used at a DST concentration of 26.5 gDST/kgtotal (≈0.127 molTA·L−1). The stated DST concentration includes structurally similar disodium isophthalate. The model reactant of the same concentration was produced by dissolving TA and IA in a diluted aqueous sodium hydroxide solution and did not contain EG. The average composition of the applied depolymerized PET reactants is given in Table 2.
Average theoretical composition of depolymerized PET reactant
| Component | Concentration (g·L−1) |
|---|---|
| Disodium terephthalate (containing ∼1–5 wt% Disodium isophthalate) | 26.5 |
| Sodium hydroxide (excess) | 1.2 |
| EG | 7.9 |
2.2 Precipitation procedure
1 L of the respective reactant was transferred into the crystallizer and heated to the target temperature. Afterwards the PA was dosed with a constant dosing rate of 30 mL·min−1. This displays a flow velocity at the dosing nozzle of 0.16 m·s−1 (Re = 320). The amount of acid for precipitation was chosen to neutralise excess sodium hydroxide and displace the sodium ions in DST. Since weak acetic acid dissociates incompletely it provides less hydronium ions for precipitation of TA and IA at equimolar addition. Compared to strong sulfuric acid, this results in a reduced yield [12]. In order to compensate the possible influence of yield differences on the amount of incorporated impurities the acid dosages were adjusted to yield 93 ± 1% of TA. Consequently, the amount of sulfuric acid was reduced to 0.93 molacid/molTA (equimolar = 1 molacid/molTA). Likewise, the necessary amount of acetic acid was increased to 2.9 molacid/molTA (equimolar = 2 molacid/molTA) [12]. Afterwards the suspension was cooled to 35°C. The crystalline rTA was filtered, washed and samples for purity analysis were dried till constant mass. All experiments were performed as duplicates except from model reactant Hazen colour index analysis (single measurement).
2.3 Particle size and morphology
Particle size was measured with a laser diffraction spectrometer Helos Kr with Quixel dispersing unit by Sympatec©, Germany. Ultrasonication was applied for 15 s to homogenise sample conditions. Particle size was calculated in accordance with the Fraunhofer diffraction model. The distributions are displayed as logarithmic volume-related density distribution
2.4 Purity analysis
The Hazen colour index and IA content were selected for quality evaluation of the influence of the varied process parameters on rTA. The Hazen colour index is commonly used by PET manufacturers as a TA specification parameter [43]. High colour index values indicate an unwanted yellow discolouration of the TA sample, consequently leading to a yellow PET product after polycondensation. For sample preparation, 500 mg of washed and dried rTA were dissolved in dimethyl formamide (DMF) or 2 mol·L−1 ammonia solution to a target concentration of 50 gTA/Lsolvent (Table 3) [28]. The absorbance of this solution was subsequently measured between 360 nm and 830 nm with a SPECORD 210 plus UV/VIS spectrometer by Analytik Jena, Germany. The measurements and calculations were conducted in accordance with ASTM 5386-05 and ASTM E-313. The second chosen quality parameter is the IA content in the TA precipitate. Its content in the final TA precipitate was measured via high performance liquid chromatography (HPLC). Therefore, the prepared samples for colour index measurements were diluted to 2 gTA/Lsolvent with the respective solvent and subsequently measured in an Ultimate 3000 HPLC by Thermo Fisher Scientific, US.
List of PET reactants and used analytical solvents for colour and IA measurements
| PET reactant | Analytical solvent |
|---|---|
| Model | DMF |
| Undersized PET | DMF |
| PET/PE | DMF |
| PET light blue* | 2 mol·L−1 ammonia |
*The preparational method was adjusted for the PET light blue experimental series in order to improve component handling by avoiding toxic DMF as solvent.
3 Results and discussion
The following sections show and discuss the results of the precipitation experiments of depolymerized real PET waste and model reactants. In the first part of this study the capacity of the precipitation step on reduction of coloured impurities and the IA content in rTA is focussed. In the second part it is analysed whether these PET waste fractions with EG and impurities affect the TA crystal size and morphology.
3.1 Colour index
The colour index represents a measure for the intensity of a visible yellow tint of a product. Commercially available PTA (used as model reactant) must not exceed colour index values above 10 [43]. Figure 3 displays the influence of temperature and PA on the Hazen colour index of rTA in dependence of the precipitation temperature.
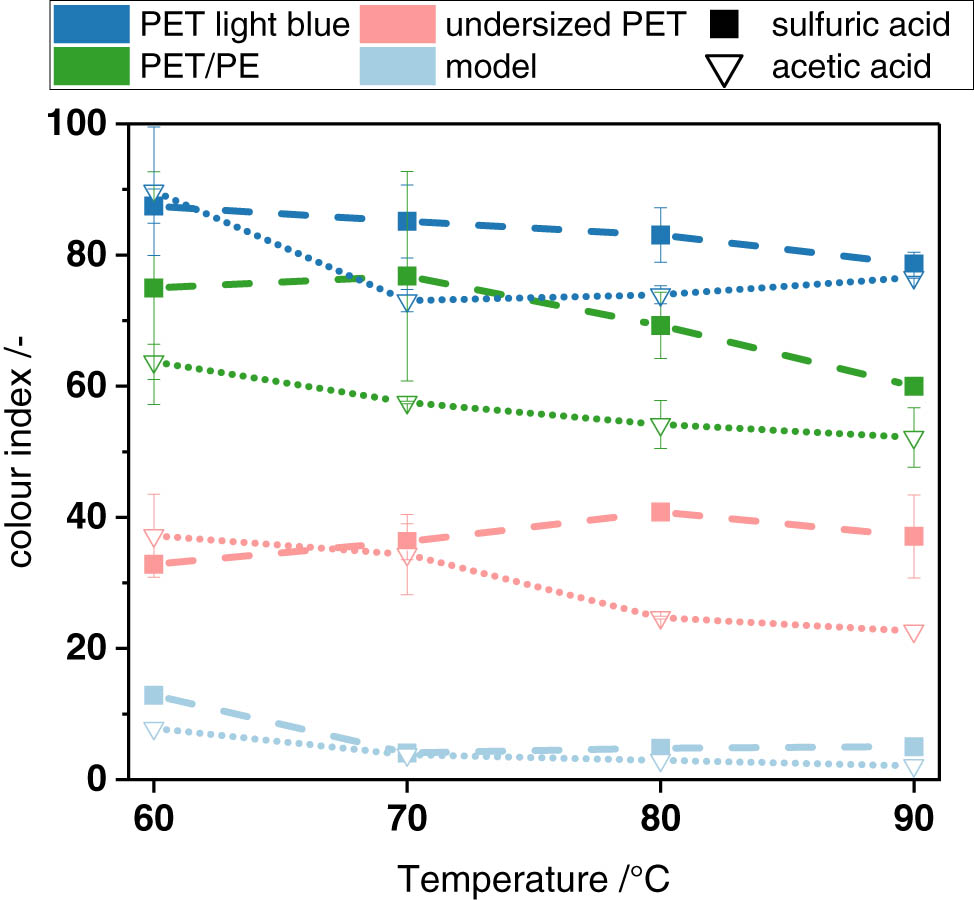
Hazen colour index of rTA after precipitation with sulfuric and acetic acid at different temperatures, model reactant values represent single measurements only, connecting lines between measuring points are shown to guide the eye.
As a general trend, a reduced colour index can be observed with increasing precipitation temperature. This can be the result of an increased solubility of coloured impurities. Likewise, the higher temperature reduces supersaturation and promotes a more controlled precipitation of TA. Additionally, as a consequence of the particle size increasing with temperature, the larger needles exhibit a lower specific surface area which reduces the chance for surface integration of colourants [12]. Generally, these effects can be observed for both PAs. However, acetic acid appears to reduce discoloration to a larger extent compared to sulfuric acid. An additional statistical t-test confirmed this observation and proved the relevance of this effect (supplementary material). This can again be correlated with significantly larger crystals of TA precipitated by acetic acid [12]. Both purity enhancing effects, higher temperature and usage of acetic acid as PA, can also be observed for the model reactant. Nevertheless, the absolute reduction of discolouration in the analysed temperature region is small with significant deviations between repetitive measurements. Additionally, the range of the colour index for the different PET reactants shows that the respective reactants possess different individual levels of impurity. Thus, the colour index of model reactant TA lies in the range of PTA. On the opposite, rTA precipitated from PET light blue and PET/PE reactant incorporates significantly more yellow coloured impurities than rTA from undersized PET. These differences must be attributed to the conditions during the depolymerization step, since the PET reactant flakes were colourless and light blue initially. According to literature, rTA colour shows a significant sensitivity to changes in reaction temperature and torque during reactive extrusion [13,14,28]. Furthermore, the highly alkaline solid-solid reaction at high temperatures can favour the degradation of EG. For example, its dimer diethylene glycol is known to decompose into yellow coloured fragments under the conditions of thermomechanical recycling [5]. It can be deduced that mild reaction temperatures are favourable as they generate less colouring impurities that have to be removed subsequently. Nevertheless, the results by Biermann et al. also revealed a general rTA colour index between 100 and 140 at depolymerization temperatures from 100°C to 160°C. The corresponding colour indices represent an approximate base value for the colour index trend of the rTA from PET light blue reactant, since they precipitated rTA for purity analysis at room temperature [28]. Taking this into account it can be assumed, that the colour index drops significantly between standard conditions and 60°C. Subsequently it apparently reaches an almost constant value. Additionally, the colour index primarily depends on the initial reactant purity whereas an elevated temperature only shows a secondary colour reducing impact. All in all, these results indicate that the precipitation step promotes rTA colour purification but cannot replace an additional purification step.
3.2 IA content
In contrast to coloured impurities that are also present in crude TA of fossil origin, IA represents a recycling specific impurity. In order to separate IA and adjust its content in rTA to the respective PET application requirements, the following part focusses on the capability of the precipitation on IA reduction. Therefore, Figure 4 depicts the influence of the PA on the IA content in the rTA precipitate for different precipitation temperatures and PET reactants.
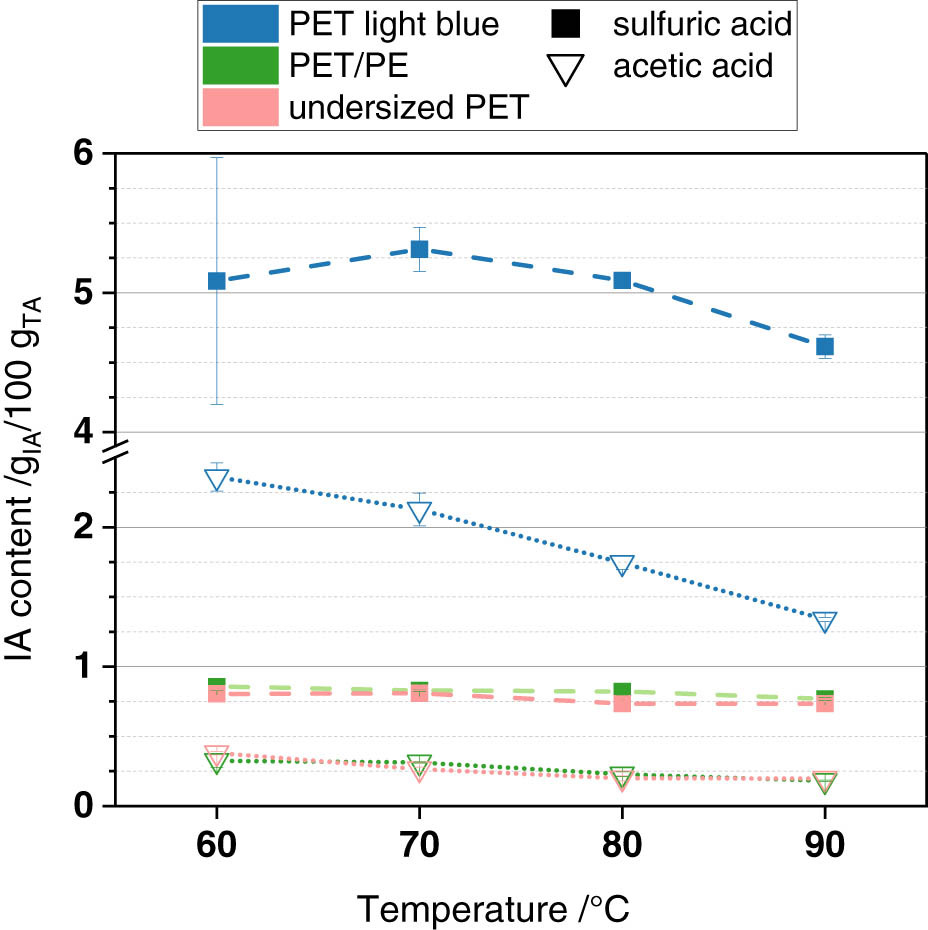
IA content of rTA after precipitation with sulfuric and acetic acid at different temperatures, lines are shown to guide the eye.
The IA content in the rTA precipitate is dominated by the initial isophthalate content of the PET reactant. Consequently, rTA from PET light blue reactant contains the highest amount of IA followed by rTA from undersized PET and PET/PE. However, in contrast to the colour index values, the effect of temperature and PA on IA content shows clear trends. Thus, a significant IA reduction can be observed for precipitation at higher temperatures, independent of the initial IA content. This can be attributed to the stronger dependence of IA solubility on temperature and generally higher solubility compared to TA (Figure 2). Between 55°C and 85°C, IA solubility is more than tripled from 0.45 gIA/kgsolvent to 1.52 gIA/kgsolvent while TA solubility is doubled from 0.08 gTA/kgsolvent to 0.176 gTA/kgsolvent. In consequence, more IA can remain in solution and does not co-precipitate with rTA. The relative IA reduction for all three PET sources appears to be almost constant for the individual PAs when increasing temperature from 60°C to 90°C. Thus, after precipitation with sulfuric acid the IA content in rTA is reduced by approximately 9.5% and approximately 45% after precipitation with acetic acid. In contrast to this temperature impact, the application of acetic acid as precipitation agent causes IA reduction to a larger degree, whose significance was additionally confirmed by statistical t-test (supplementary material). This rTA incorporates only 20% of IA in comparison to rTA precipitated by sulfuric acid at the same temperature. This is the result of the promoted solubility of IA in aqueous acetic acid. Although TA solubility is enhanced under presence of acetic acid as well, the impact on IA is significantly more pronounced (Figure 2). Despite these promising results on IA reduction, its final content in rTA is still dominated by the depolymerized PET reactant. Thus, the IA content differs substantially, even for waste of similar origin like PET light blue and undersized PET from PET bottle recycling. Therefore, it should be considered to recycle rTA to applications with a similar IA demand as its original application.
3.3 Particle size and morphology
Next to rTA purity its particle size is of major concern when considering subsequent processability. Larger rTA crystals lead to an advantageous filterability as well as an improved rheological behaviour. Especially the latter gains importance with regard to rTA polycondensation with equimolar amounts of EG [12,16]. However, also purity can be affected by particle size, e.g. considering a surface/volume ratio and surface integrated impurities. Therefore, Figure 5 displays the influence of sulfuric acid and acetic acid on the particle size distribution of TA of the different proveniences at 60°C and 90°C.
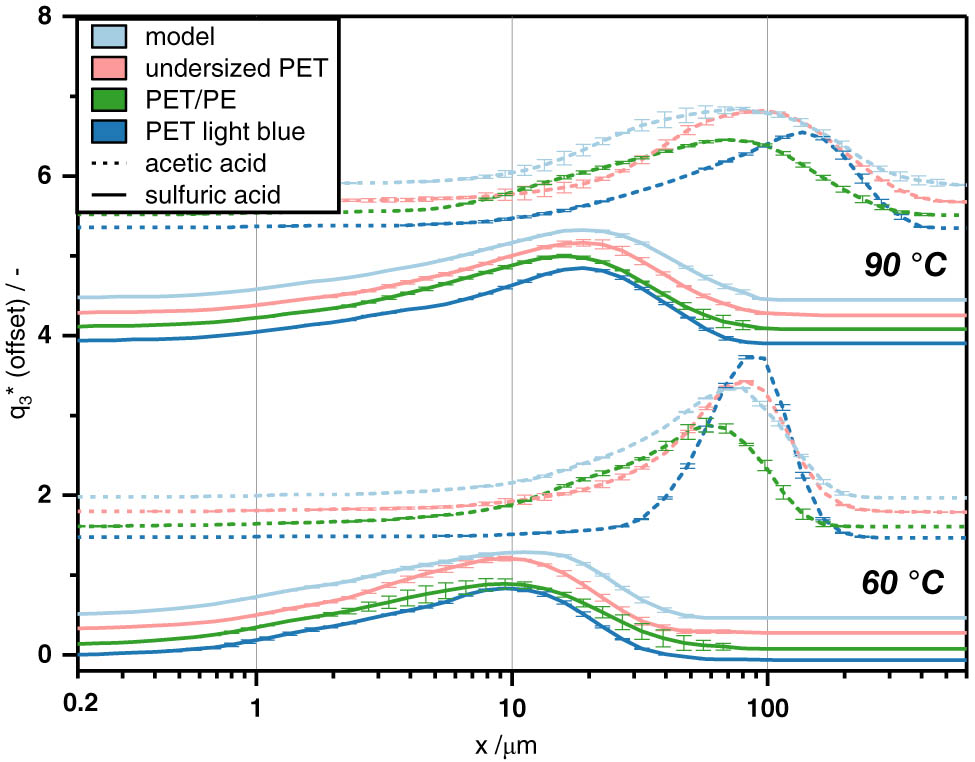
Influence of sulfuric acid and acetic acid on particle size of TA at 60°C (bottom) and 90°C (top), lines instead of points are used to guide the eye.
In order to ease comparison and improve visualization, the PSD graphs are displayed in a stacked manner along the y-axis and as continuous lines instead of points. The general impact of a higher precipitation temperature leading to larger rTA crystals is confirmed for both acids with PET reactants [12]. Additionally, the general trends between real post-consumer reactants and model reactants without EG show a good comparability. Especially the sulfuric acid precipitation experiments feature almost identical distributions of which only the PET light blue reactant at 90°C shows a small deviation with a slight shift towards larger crystals. This behaviour of PET light blue is significantly pronounced for precipitation with acetic acid. A significant impact of acetic acid on crystallisation can be observed for all reactants. While precipitation with sulfuric acid shows very similar distributions, the reactants precipitated with acetic acid differ significantly. For both temperatures displayed, PET light blue followed by undersized PET have their distribution maxima at a larger particle size compared to PET/PE. On the contrary, the model reactant results in smaller TA crystals for both temperatures with acetic acid. It is important to note that all of the depolymerized PET reactants contain EG which reduces the solubility of DST [42]. On the other hand, EG as a less polar solvent compared to water could positively affect solubility of less polar TA which could explain the smaller model reactant distributions. However, this does not explain why this effect appears only for precipitation with acetic acid. Additionally, undersized PET and PET light blue originate from bottle recycling and display mono layer material. PET/PE instead represents a dual layer from post production waste. Since these materials have not been purified, it cannot be excluded that the crystallization behaviour is affected by unknown production contaminants. Despite this, it can be deduced that the used PET reactants did not contain contaminants critically influencing the crystallization of rTA. An alternative explanatory approach can be derived from the purification capacity examined in the previous chapter. Thus, especially the IA contents of the different reactants and the IA reducing effect of acetic acid were noticeable. Since IA is generally more soluble in water than TA and even more in acetic acid (Figure 2), the mean benzene carboxylic acid solubility is higher. Additionally, the PET light blue reactant contains five times more IA compared to the other reactants. Thus, the average solubility of its final crystalline product is larger than that of the other reactants. According to Figure 2, these differences in solubility between IA and TA increase with temperature due to the steeper inclination of IA solubility. This could contribute to the PET light blue peak at 90°C being shifted the most in comparison to the other reactants’ peaks. Furthermore, the qualitative comparison of the precipitation experiments reveals significant differences in TA crystal formation between both PAs. In case of sulfuric acid, precipitation occurs instantly with the first drop already precipitating visible TA. In contrast, upon dosing acetic acid no initial precipitation occurs. Instead, a constantly growing turbidity of the reaction mixture can be noticed during acetic acid dosing. This being the result of the differences in acid strength can additionally be evidence of a “more controlled” precipitation leading to crystal growth. The resulting dendritical structures for acetic acid precipitated TA have already been published previously [12]. However, the slow formation and large size of these crystals could explain the apparent higher purity of rTA from acetic acid as stated before. Next to the particle size measurement, SEM images were taken for evaluation of the crystal morphology and surface. Therefore, Figure 6 shows the SEM images of rTA precipitated with acetic acid at 60°C from PET light blue reactant which revealed the strongest deviations in size.
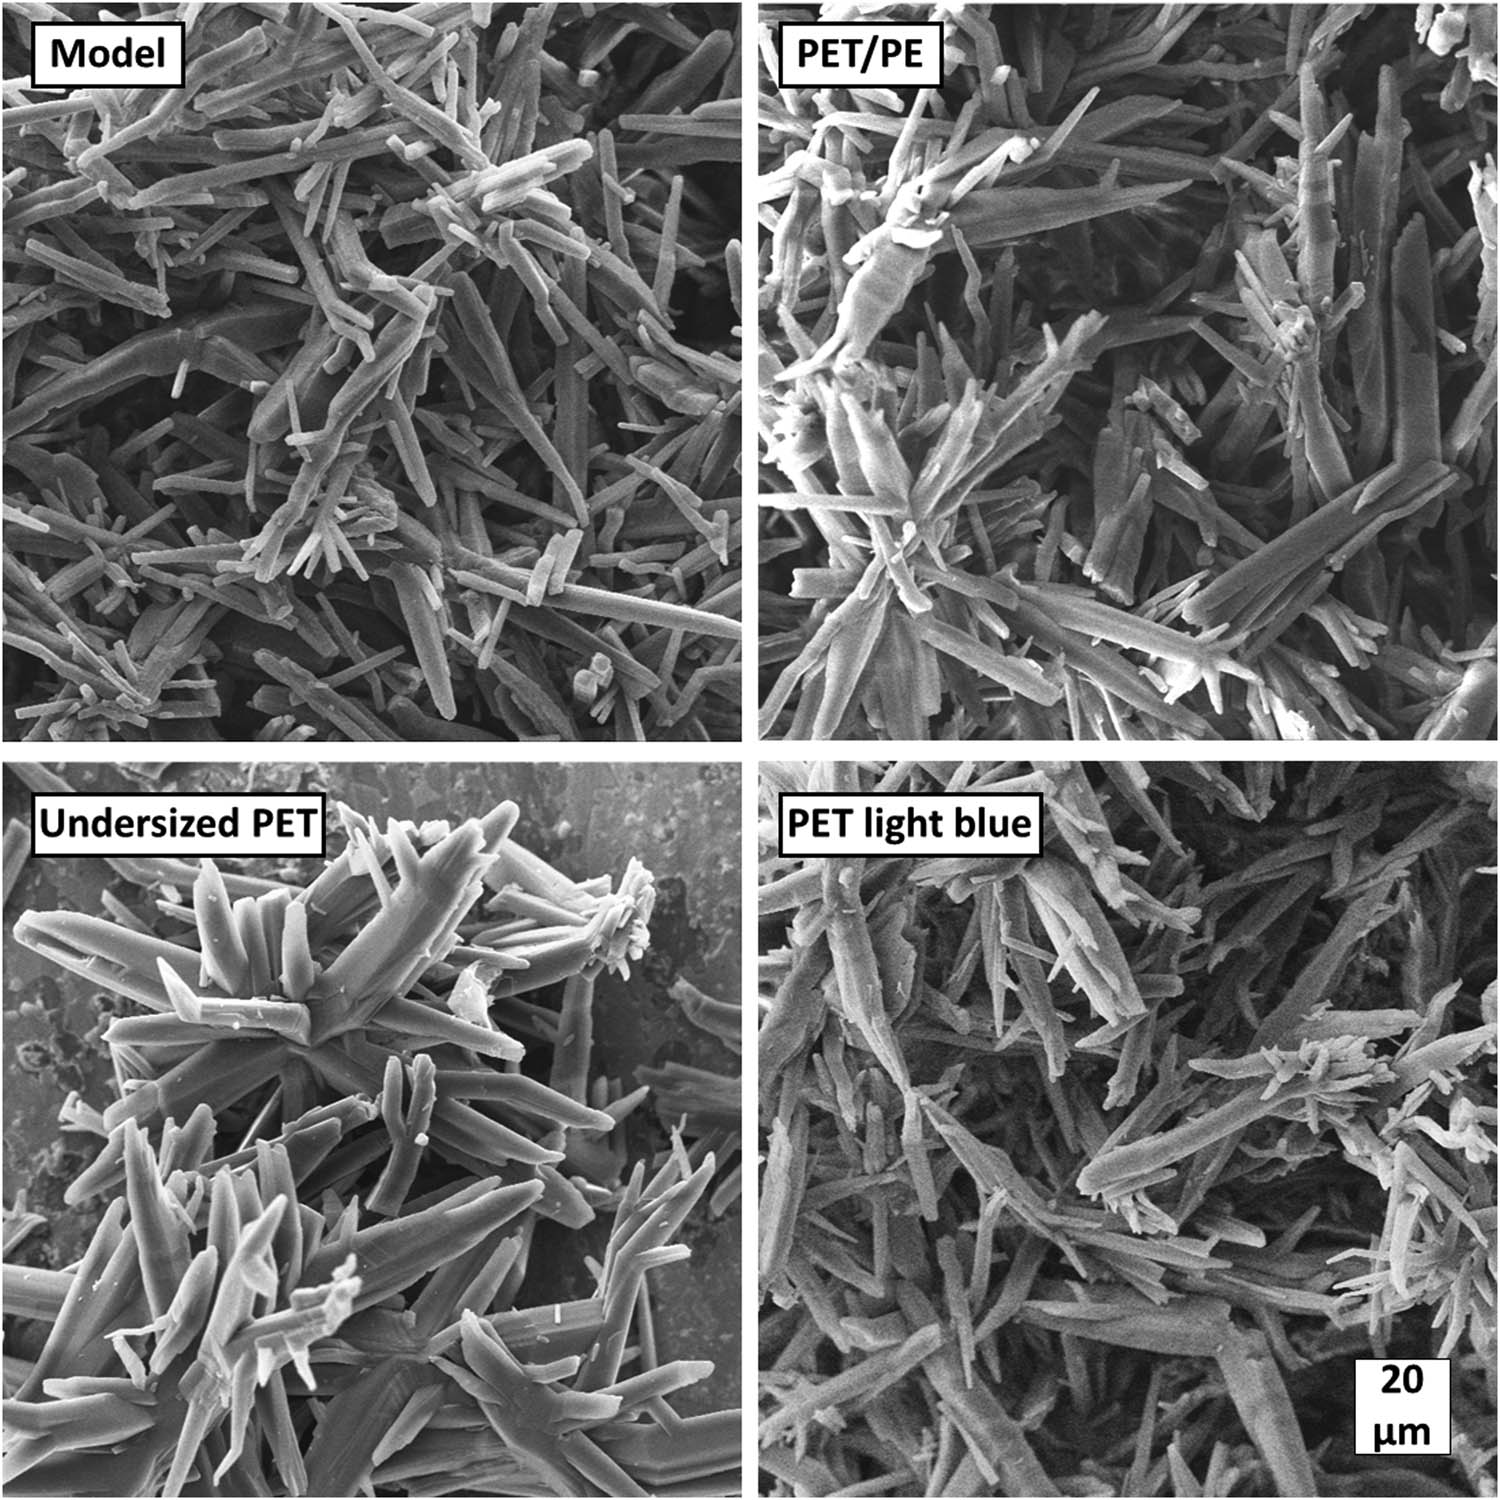
SEM images of TA precipitated by acetic acid at 60°C for different reactants, all images are displayed at same magnification.
All images display the similar dendritical structure of TA crystals which was also seen for precipitation with acetic acid from model reactants [12]. Regarding particle size, the differences between the reactants shown in the previous section cannot be confirmed. Nevertheless, the surface of the PET/PE and PET light blue crystals appears slightly rougher and corrugated. This characteristic could promote surface integration of impurities explaining the higher colour index of rTA from PET light blue and PET/PE. Additionally, the TA crystals from PET reactants possess pointed ends on the short side while TA crystals from model reactant appear to remain square shaped. However, images only represent a small sample size and cannot be considered as a statistical measure.
4 Conclusion
TA was precipitated from different waste PET sources that were depolymerized by alkaline hydrolysis with revolPET® technology. Precipitation was performed with acetic acid and sulfuric acid directly from filtered but impurified DST solution. The comparison of rTA particle size revealed no crystallization critical impact of PET waste reactants. Thus, neither dissolved impurities in the reactants nor the presence of EG lead to substantial interference with the crystallization of rTA.
The purity of the resulting rTA crystals was analysed for yellow discolouration and IA content. An increased precipitation temperature gradually reduces yellow discolouration in rTA precipitate which could be especially observed for acetic acid instead of sulfuric acid. This decolourisation potential of the precipitation step provides an additional measure to meet rTA colour requirements, next to adsorptive treatments. However, the magnitude of the colour reduction by precipitation at elevated temperatures is small and significantly depends on the initial reactant purity. Similarly, it could be shown that IA possesses a reduced tendency to co-crystallize with TA at higher temperatures. This effect directly correlates with the IA solubility increasing stronger with temperature than TA solubility. Due to the even higher solubility of IA in aqueous acetic acid, its use as PA induced an even stronger IA reduction. Thus, IA content in TA was reduced to 80% for precipitation with acetic acid instead of sulfuric acid regardless of the IA content of the PET reactant. Thus, precipitation with acetic acid supports the separation of IA in rTA. It consequently provides an effective IA purification method, like active carbon adsorption for reduction of discolouration. In addition, rTA crystals from acetic acid are significantly larger than from sulfuric acid which promotes subsequent processability (e.g. filtration) [12]. All in all, the results of this study show a possibility to significantly improve terephthalic acid purity during precipitation from its alkaline solution. Especially the use of acetic acid for precipitation extends the options for an advantageous rTA purification and recovery. This presents sustainable and economically viable prospects, as organic PAs could be generated via microbial fermentation. Furthermore, the residual sodium salts offer higher-value by-products compared to sodium chloride or sulfate. Additionally, TA crystallization must demonstrate economic and qualitative competitiveness with virgin terephthalic acid production via fossil-based routes. Therefore, successful industrial adoption necessitates consideration of factors such as reactant costs, by-product quality, operational expenses, as well as the time and effort required to obtain the final monomers. Therefore, future research should focus on a continuous operation of the precipitation step following the continuous depolymerisation by revolPET® technology. Moreover, the research should be extended to more complex waste fractions e.g. textiles, in order to prove the broad applicability and functionality of BMR and rTA precipitation.
-
Funding information: The authors gratefully acknowledge funding from the German Federal Ministry for Economic Affairs and Climate Action (BMWK) for the project reform-2-rePET (Grant No. 16KN082926).
-
Author contributions: Clemens Müller: conceptualization, methodology, investigation, formal analysis; funding acquisition; writing – original draft and visualisation; Dirk Wilhelm Franke-Hameke: investigation, formal analysis, Esther Laura Brepohl: conceptualization, investigation; Lars Biermann: conceptualization, investigation; Carsten Eichert: conceptualization, funding acquisition, resources, project administration Stephan Scholl: conceptualization, funding acquisition, resources; supervision, project administration, writing – review & editing.
-
Conflict of interest: Authors state no conflict of interest.
-
Data availability statement: Additional information on the analytical procedures and a statistical test on significance of the purification effect is provided as supplementary material. The datasets generated and analyzed during this study are available from the corresponding author on reasonable request.
References
[1] PlasticsEurope. Plastics – the facts 2022. 2023. https://plasticseurope.org/knowledge-hub/plastics-the-facts-2022/, accessed 3 May 2023.Search in Google Scholar
[2] PETcore Europe. PET Market in Europe – State of Play 2022: Production, collection and recycling. 2022. https://www.petcore-europe.org/images/news/pdf/PET_REPORT_2022_V4_compressed.pdf, accessed 21 June 2022.Search in Google Scholar
[3] Nisticò R. Polyethylene terephthalate (PET) in the packaging industry. Polym Test. 2020;90:106707.10.1016/j.polymertesting.2020.106707Search in Google Scholar
[4] Suhaimi NAS, Muhamad F, Abd Razak NA, Zeimaran E. Recycling of polyethylene terephthalate wastes: A review of technologies, routes, and applications. Polym Eng Sci. 2022;62:2355–75.10.1002/pen.26017Search in Google Scholar
[5] Alvarado Chacon F, Brouwer MT, van Thoden Velzen EU. Effect of recycled content and rPET quality on the properties of PET bottles, part I: Optical and mechanical properties. Packag Technol Sci. 2020;33:347–57.10.1002/pts.2490Search in Google Scholar
[6] Crippa M, Morico B. PET depolymerization: a novel process for plastic waste chemical recycling. In Catalysis, green chemistry and sustainable energy. Amsterdam, Netherlands: Elsevier; 2020. p. 215–29.10.1016/B978-0-444-64337-7.00012-4Search in Google Scholar
[7] Gravendeel M, de Groot M, Slenders L, Stevens B, Stolk M, Wolters J, et al. Depolymerization of PET Polymers at Ioniqa Technologies (Case Study). In: Mortier J, editor. Industrial Arene Chemistry. Weinheim, Germany: Wiley; 2023. p. 2117–41.10.1002/9783527827992.ch67Search in Google Scholar
[8] Berg D, Schaefer K, Koerner A, Kaufmann R, Tillmann W, Moeller M. Reasons for the discoloration of postconsumer poly(ethylene terephthalate) during reprocessing. Macro Mater Eng. 2016;301:1454–67.10.1002/mame.201600313Search in Google Scholar
[9] Geyer B, Lorenz G, Kandelbauer A. Recycling of poly(ethylene terephthalate) – A review focusing on chemical methods. Express Polym Lett. 2016;10:559–86.10.3144/expresspolymlett.2016.53Search in Google Scholar
[10] Al-Sabagh AM, Yehia FZ, Eshaq G, Rabie AM, ElMetwally AE. Greener routes for recycling of polyethylene terephthalate. Egypt J Pet. 2016;25:53–64.10.1016/j.ejpe.2015.03.001Search in Google Scholar
[11] Barnard E, Rubio Arias JJ, Thielemans W. Chemolytic depolymerisation of PET: a review. Green Chem. 2021;23:3765–89.10.1039/D1GC00887KSearch in Google Scholar
[12] Müller C, Heck CA, Stephan L, Paschetag M, Scholl S. Precipitation of terephthalic acid from alkaline solution: Influence of temperature and precipitation acid. Ind Eng Chem Res. 2023;62:12029–40.10.1021/acs.iecr.2c04451Search in Google Scholar
[13] Brepohl E. Continuous back to monomer recycling of PET from composite materials using a twin-screw extruder. Boston (online). AIChE Annual Meeting. Nov 07-19, 2021.Search in Google Scholar
[14] Biermann L, Brepohl E, Eichert C, Paschetag M, Watts M, Scholl S. Development of a continuous PET depolymerization process as a basis for a back-to-monomer recycling method. Green Process Synth. 2021;10:361–73.10.1515/gps-2021-0036Search in Google Scholar
[15] Franco RLC, Eichert C, Lücking C, Biermann L, Paschetag M, Scholl S. revolPET®: An Innovative “Back-to-Monomer” Recycling Technology for the Open Loop Value Chain of PET and Polyester Composite Packaging and Textiles. In: Kohl H, Seliger G, Dietrich F, editors. Manufacturing Driving Circular Economy: Proceedings of the 18th Global Conference on Sustainable Manufacturing, October 5-7, 2022. 1st edn. Berlin, Cham: Springer International Publishing; Imprint Springer; 2023. p. 175–83.10.1007/978-3-031-28839-5_20Search in Google Scholar
[16] Träger M, Jostmann T. Kristallisation von Terephthalsäure aus wässerigen Hydrolyseprodukten des Dimethylterephthalates. Chem Ing Tech. 1997;69:493–6.10.1002/cite.330690413Search in Google Scholar
[17] Lee HL, Chiu CW, Lee T. Engineering terephthalic acid product from recycling of PET bottles waste for downstream operations. Chem Eng J Adv. 2021;5:100079.10.1016/j.ceja.2020.100079Search in Google Scholar
[18] Sheehan RJ, editor. Ullmann’s encyclopedia of industrial chemistry: terephthalic acid, dimethyl terephthalate and isophthalic acid. Weinheim, Germany: Wiley-VCH Verlag GmbH & Co. KGaA; 2012.Search in Google Scholar
[19] Tourani S, Safekordi AA, Rashidzadeh M, Rashidi AM, Khorasheh F. Hydrogenation of crude terephthalic acid by supported Pd and Pd–Sn catalysts on functionalized multiwall carbon nanotubes. Chem Eng Res Des. 2016;109:41–52.10.1016/j.cherd.2016.01.016Search in Google Scholar
[20] Coniglio MA, Fioriglio C, Laganà P. Non-intentionally added substances in PET-bottled mineral water. Cham: Springer International Publishing; 2020.10.1007/978-3-030-39134-8Search in Google Scholar
[21] European Commission. Commission Regulation (EU) No 10/2011 on plastic materials and articles intended to come into contact with food. Brussel, Belgium: Directorate-General for Health and Food Safety; 2011.Search in Google Scholar
[22] Welle F. Twenty years of PET bottle to bottle recycling – An overview. Resour Conserv Recycl. 2011;55:865–75.10.1016/j.resconrec.2011.04.009Search in Google Scholar
[23] Pinter E, Welle F, Mayrhofer E, Pechhacker A, Motloch L, Lahme V, et al. Circularity study on PET bottle-to-bottle recycling. Sustainability. 2021;13:7370.10.3390/su13137370Search in Google Scholar
[24] Karayannidis GP, Chatziavgoustis AP, Achilias DS. Poly(ethylene terephthalate) recycling and recovery of pure terephthalic acid by alkaline hydrolysis. Adv Polym Technol. 2002;21:250–9.10.1002/adv.10029Search in Google Scholar
[25] Tournier V, Topham CM, Gilles A, David B, Folgoas C, Moya-Leclair E, et al. An engineered PET depolymerase to break down and recycle plastic bottles. Nature. 2020;580:216–9.10.1038/s41586-020-2149-4Search in Google Scholar PubMed
[26] Quartinello F, Vajnhandl S, Volmajer Valh J, Farmer TJ, Vončina B, Lobnik A, et al. Synergistic chemo-enzymatic hydrolysis of poly(ethylene terephthalate) from textile waste. Microb Biotechnol. 2017;10:1376–83.10.1111/1751-7915.12734Search in Google Scholar PubMed PubMed Central
[27] Valh JV, Vončina B, Lobnik A, Zemljič LF, Škodič L, Vajnhandl S. Conversion of polyethylene terephthalate to high-quality terephthalic acid by hydrothermal hydrolysis: the study of process parameters. Text Res J. 2020;90:1446–61.10.1177/0040517519893714Search in Google Scholar
[28] Biermann L, Quast D, Brepohl E, Eichert C, Scholl S. Alkali depolymerization of poly(ethylene terephthalate) in a quasi‐solid‐solid kneading reaction. Chem Eng Technol. 2021;44:2300–8.10.1002/ceat.202100327Search in Google Scholar
[29] Allen NS, Edge M, Daniels J, Royall D. Spectroscopic analysis of organic contaminants in terephthalic acid: colour implications in poly(ethylene terephthalate) manufacture. Polym Degrad Stab. 1998;62:373–83.10.1016/S0141-3910(98)00024-XSearch in Google Scholar
[30] Zhu F, Johnson JA, Ablin DW, Ernst GA. Efficient petrochemical processes: Technologies, design and operation. Hoboken: Wiley-AIChE; 2020.10.1002/9781119487890Search in Google Scholar
[31] Mohan TP, George AP, Kanny K. Combined effect of isophthalic acid and polyethylene glycol in polyethylene terephthalate polymer on thermal, mechanical, and gas transport properties. J Appl Polym Sci. 2012;126:536–43.10.1002/app.36818Search in Google Scholar
[32] European Chemicals Agency, editor. Guidance of monomers and polymers: Version 3.0. Helsinki, Finland: European Chemicals Agency; 2023.Search in Google Scholar
[33] Kosmidis VA, Achilias DS, Karayannidis GP. Poly(ethylene terephthalate) recycling and recovery of pure terephthalic acid. Kinetics of a phase transfer catalyzed alkaline hydrolysis. Macromol Mater Eng. 2001;286:640–7.10.1002/1439-2054(20011001)286:10<640::AID-MAME640>3.0.CO;2-1Search in Google Scholar
[34] Wu S-C, Cheng Z-M, Wang S-D, Shan X-L. Recovery of terephthalic acid from alkali reduction wastewater by cooling crystallization. Chem Eng Technol. 2011;34:1614–8.10.1002/ceat.201100096Search in Google Scholar
[35] Cheng Y, Huo L, Li X. Solubilities of isophthalic acid in acetic acid+ water solvent mixtures. Chin J Chem Eng. 2013;21:754–8.10.1016/S1004-9541(13)60520-0Search in Google Scholar
[36] Han N, Wang L, Sun C, Fu R. Determination and correlation of the phase equilibrium of terephthalic acid, water and acetic acid ternary system. Huaxue Gongcheng Xi’an. 2000;28:55–8.Search in Google Scholar
[37] Ma P, Xia Q. Determination and correlation for solubility of aromatic acids in solvents. Chin J Chem Eng. 2001;9:39–44.Search in Google Scholar
[38] Han N, Zhu L, Wang L, Fu R. Aqueous solubility of m-phthalic acid, o-phthalic, acid and p-phthalic acid from 298 to 483 K. Sep Purif Technol. 1999;16(2):175–80.10.1016/S1383-5866(99)00005-2Search in Google Scholar
[39] Apelblat A, Manzurola E, Abo Balal N. The solubilities of benzene polycarboxylic acids in water. J Chem Thermodyn. 2006;38:565–71.10.1016/j.jct.2005.07.007Search in Google Scholar
[40] Takebayashi Y, Sue K, Yoda S, Hakuta Y, Furuya T. Solubility of terephthalic acid in subcritical water. J Chem Eng Data. 2012;57:1810–6.10.1021/je300263zSearch in Google Scholar
[41] Chen M, Ma P. Solid-liquid equilibria of several systems containing acetic acid. J Chem Eng Data. 2004;49:756–9.10.1021/je034114cSearch in Google Scholar
[42] Rezazadeh A, Thomsen K, Gavala HN, Skiadas IV, Fosbøl PL. Solubility and freezing points of disodium terephthalate in water–ethylene glycol mixtures. J Chem Eng Data. 2021;66:2143–52.10.1021/acs.jced.1c00052Search in Google Scholar
[43] Equipolymers Global GmbH. Sales specification: Terephthalic acid purified. Schkopau Germany: Equipolymers Global GmbH; 2019.Search in Google Scholar
© 2025 the author(s), published by De Gruyter
This work is licensed under the Creative Commons Attribution 4.0 International License.
Articles in the same Issue
- Research Articles
- Optimized green synthesis of silver nanoparticles from guarana seed skin extract with antibacterial potential
- Green adsorbents for water remediation: Removal of Cr(vi) and Ni(ii) using Prosopis glandulosa sawdust and biochar
- Green approach for the synthesis of zinc oxide nanoparticles from methanolic stem extract of Andrographis paniculata and evaluation of antidiabetic activity: In silico GSK-3β analysis
- Development of a green and rapid ethanol-based HPLC assay for aspirin tablets and feasibility evaluation of domestically produced bioethanol in Thailand as a sustainable mobile phase
- A facile biodegradation of polystyrene microplastic by Bacillus subtilis
- Enhanced synthesis of fly ash-derived hydrated sodium silicate adsorbents via low-temperature alkaline hydrothermal treatment for advanced environmental applications
- Impact of metal nanoparticles biosynthesized using camel milk on bacterial growth and copper removal from wastewater
- Preparation of Co/Cr-MOFs for efficient removal of fleroxacin and Rhodamine B
- Applying nanocarbon prepared from coal as an anode in lithium-ion batteries
- Improved electrochemical synthesis of Cu–Fe/brass foil alloy followed by combustion for high-efficiency photoelectrodes and hydrogen production in alkaline solutions
- Precipitation of terephthalic acid from post-consumer polyethylene terephthalate waste fractions
- Biosynthesized zinc oxide nanoparticles: Multifunctional potential applications in anticancer, antibacterial, and B. subtilis DNA gyrase docking
- Anticancer and antimicrobial effects of green-synthesized silver nanoparticles using Teucrium polium leaves extract
- Green synthesis of eco-friendly bioplastics from Chlorella and Lithothamnion algae for safe and sustainable solutions for food packaging
- Optimizing coal water slurry concentration via synergistic coal blending and particle size distribution
- Green synthesis of Ag@Cu and silver nanowire using Pterospermum heterophyllum extracts for surface-enhanced Raman scattering
- Green synthesis of copper oxide nanoparticles from Algerian propolis: Exploring biochemical, structural, antimicrobial, and anti-diabetic properties
- Simultaneous quantification of mefenamic acid and paracetamol in fixed-dose combination tablet dosage forms using the green HPTLC method
- Green synthesis of titanium dioxide nanoparticles using green tea (Camellia sinensis) extract: Characteristics and applications
- Pharmaceutical properties for green fabricated ZnO and Ag nanoparticle-mediated Borago officinalis: In silico predications study
- Synthesis and optimization of gemcitabine-loaded nanoparticles by using Box–Behnken design for treating prostate cancer: In vitro characterization and in vivo pharmacokinetic study
- A comparative analysis of single-step and multi-step methods for producing magnetic activated carbon from palm kernel shells: Adsorption of methyl orange dye
- Sustainable green synthesis of silver nanoparticles using walnut septum waste: Characterization and antibacterial properties
- Efficient electrocatalytic reduction of CO2 to CO over Ni/Y diatomic catalysts
- Greener and magnetic Fe3O4 nanoparticles as a recyclable catalyst for Knoevenagel condensation and degradation of industrial Congo red dye
- Recycling of HDPE-giant reed composites: Processability and performance
- Fabrication of antibacterial chitosan/PVA nanofibers co-loaded with curcumin and cefadroxil for wound healing
- Cost-effective one-pot fabrication of iron(iii) oxychloride–iron(iii) oxide nanomaterials for supercapacitor charge storage
- Novel trimetallic (TiO2–MgO–Au) nanoparticles: Biosynthesis, characterization, antimicrobial, and anticancer activities
- Green-synthesized chromium oxide nanoparticles using pomegranate husk extract: Multifunctional bioactivity in antioxidant potential, lipase and amylase inhibition, and cytotoxicity
- Therapeutic potential of sustainable zinc oxide nanoparticles biosynthesized using Tradescantia spathacea aqueous leaf extract
- Chitosan-coated superparamagnetic iron oxide nanoparticles synthesized using Carica papaya bark extract: Evaluation of antioxidant, antibacterial, and anticancer activity of HeLa cervical cancer cells
- Antioxidant potential of peptide fractions from tuna dark muscle protein isolate: A green enzymatic approach
- Clerodendron phlomoides leaf extract-mediated synthesis of selenium nanoparticles for multi-applications
- Optimization of cellulose yield from oil palm trunks with deep eutectic solvents using response surface methodology
- Nitrogen-doped carbon dots from Brahmi (Bacopa monnieri): Metal-free probe for efficient detection of metal pollutants and methylene blue dye degradation
- High energy density pseudocapacitor based on a nanoporous tungsten(VI) oxide iodide/poly(2-amino-1-mercaptobenzene) composite
- Green synthesized Ag–Cu nanocomposites as an improved strategy to fight multidrug-resistant bacteria by inhibition of biofilm formation: In vitro and in silico assessment study
- In vitro evaluation of antibacterial activity and associated cytotoxicity of biogenic silver nanoparticles using various extracts of Tabernaemontana ventricosa
- Fabrication of novel composite materials by impregnating ZnO particles into bacterial cellulose nanofibers for antimicrobial applications
- Solidification floating organic drop for dispersive liquid–liquid microextraction estimation of copper in different water samples
- Kinetics and synthesis of formation of phosphate composites from low-grade phosphorites in the presence of phosphate–siliceous shales and oil sludge
- Removal of minocycline and terramycin by graphene oxide and Cr/Mn base metal–organic framework composites
- Microfluidic preparation of ceramide E liposomes and properties
- Therapeutic potential of Anamirta cocculus (L.) Wight & Arn. leaf aqueous extract-mediated biogenic gold nanoparticles
- Antioxidant-rich Micromeria imbricata leaf extract as a medium for the eco-friendly preparation of silver-doped zinc oxide nanoparticles with antibacterial properties
- Influence of different colors with light regime on Chlorella sp., biomass, pigments, and lipids quantity and quality
- Experimental vibrational analysis of natural fiber composite reinforced with waste materials for energy absorbing applications
- Green synthesis of sea buckthorn-mediated ZnO nanoparticles: Biological applications and acute nanotoxicity studies
- Production of liquid smoke by consecutive electroporation and microwave-assisted pyrolysis of empty fruit bunches
- Synthesis of MPAA based on polyacrylamide and gossypol resin and applications in the encapsulation of ammophos
- Application of iron-based catalysts in the microwave treatment of environmental pollutants
- Enhanced adsorption of Cu(ii) from wastewater using potassium humate-modified coconut husk biochar
- Adsorption of heavy metal ions from water by Fe3O4 nano-particles
- Green synthesis of parsley-derived silver nanoparticles and their enhanced antimicrobial and antioxidant effects against foodborne resistant bacteria
- Unwrapping the phytofabrication of bimetallic silver–selenium nanoparticles: Antibacterial, Anti-virulence (Targeting magA and toxA genes), anti-diabetic, antioxidant, anti-ovarian, and anti-prostate cancer activities
- Review Article
- Sustainable innovations in garlic extraction: A comprehensive review and bibliometric analysis of green extraction methods
- Rapid Communication
- In situ supported rhodium catalyst on mesoporous silica for chemoselective hydrogenation of nitriles to primary amines
- Special Issue: Valorisation of Biowaste to Nanomaterials for Environmental Applications
- Valorization of coconut husk into biochar for lead (Pb2+) adsorption
- Corrigendum
- Corrigendum to “An updated review on carbon nanomaterials: Types, synthesis, functionalization and applications, degradation and toxicity”