Media Tone and Earnings Management before the Earnings Announcement: Evidence from China
-
Huan Wang


Abstract
This article examines the relationship between media tone and earnings management before the earnings announcement. Using data from China, I discover a positive relationship between media tone before the earnings announcement and earnings management. For companies whose managers sell their ownership in the next time and have prior media exposure, the beneficial relationship is more pronounced. The relationship between abnormal media tone before results declaration and earnings management appears to be weakened by external oversight. According to the findings, managers can use media slant in addition to earnings management as a way to increase stock price following an earnings announcement. I also find that managers may use two public channels to influence media tone before the earnings announcement: the distribution of preliminary accounting data and earnings pre-announcement. Our study expands on the media’s involvement in earnings management and offers proof of the concurrent use of multiple management techniques to artificially raise stock prices.
1 Introduction
Earnings announcement is an essential way for firms to convey information to shareholders. However, since managers can use discretion in reporting corporate profits without violating generally accepted accounting principles (DuCharme et al., 2004, Rangan, 1998, Teoh et al., 1998a,b), they usually use discretionary accounting choices to manage earnings disclosures. Earnings management is a term frequently used to describe the use of discretionary accounting decisions to manage profits (Schipper, 1989). Numerous studies focus on the causes (Brown, 2001; Ducharme et al., 2004; Louis, 2004) and effects (Healy & Wahlen, 1999) of earnings management and generally agree that managers have an incentive to manage earnings disclosures to influence stock prices and obtain profits from rising stock prices.
According to the Agenda-setting Theory (McCombs & Shaw, 1972), media can shape public opinion. Therefore, several studies indicate that managers might actively influence the tone of media reports through media relationships (Gurun, 2015), advertisements (Ellman & Germano, 2009; Reuter & Zitzewitz, 2006), and the employment of public relations agencies (Solomon, 2012), which leads media to exhibit an upbeat tone when covering significant events, such as initial public offering (IPO), M&A events (Ahern & Sosyura, 2014; Cook et al., 2006). This kind of media report with a sentimental slant caused by active management is usually considered to be media spin.
Although both earnings and media management can help managers influence stock prices, the relationship between these two instances of management opportunism is not well understood. Will managers manage both earnings and media tone? Whether media management is a complement to earnings management and when this is the case? China provides an ideal setting to explore these questions. On the one hand, the Chinese market is a typical emerging market with low-quality information disclosures. The information disclosures are irregular, and the phenomenon of earnings management is frequent. On the other hand, more than 80% of all transactions in the Chinese stock market are made by individual investors. Compared to institutional investors, individuals’ perceptions and sentiments are influenced by the media to a greater extent (Barber & Odean, 2008; Gurun & Butler, 2012; Li et al., 2019). Therefore, in the Chinese market, media tone is an essential factor affecting investor sentiment and stock prices.
To conduct the empirical analysis, I first collect detailed media data from the Chinese Research Data Services Platform (CNRDS) database from 2007 to 2022. This database uses machine learning to determine the tone of media reports. Since media outlets do not abruptly shift the direction of their reporting in a short amount of time, the covered company’s public or private information must be the source of the unusual media tone. By testing the relationship between earnings management and the abnormal media tone before the earnings announcement, I find that the abnormal media tone preceding the earnings announcement can be attributed to events connected to earnings reports. This core finding is robust in a battery of robustness and endogeneity checks. To enrich this finding, I further conduct several heterogeneity analyses. The results show that the positive relation between earnings management and the abnormal media tone before the earnings announcement is more prominent when managers with more incentives to sell their shares and media experience. Moreover, external governance such as institutional ownership, analyst coverage, and audits’ reputation can reduce the positive relation between earnings management and the abnormal media tone before the earnings announcement.
I further explore the potential channels, including earnings pre-announcement and preliminary accounting data. By omitting all required disclosure, I manually gather the samples that coincide with the publication of preliminary accounting data and earnings pre-announcement between the end of the previous fiscal year and the earnings announcement release. The findings indicate that there is a stronger mediating influence from preliminary accounting data and that the relationship between discretionary accruals (DAC) and the unusual tone of the media before the earnings announcements partially operate through both channels. Consequently, I conclude that before the earnings announcements, firms who practice positive earnings management are more likely to encounter an abnormally upbeat and optimistic media tone, suggesting that managers might use media tone as an addition to earnings management to temporarily increase stock prices.
Our article contributes to the literature in three ways. First, the significance of the media in profit management is further supported by this research. Prior studies mainly focus on the media coverage (MC) and its function as a watchdog. The relationship between media bias and earnings management is rarely studied. Chahine et al. (2015) postulate that managers deliberately address media inquiries before making an equity offer. Media coverage may raise public awareness, but it does not always lead stock values to soar. However, there are important distinctions between media tone and coverage in terms of how they affect profit management. As a result, managers can actively manage media tone in addition to strategically responding to media expectations. I offer the first official empirical proof that the positive tilt of MC before earnings reporting is positively correlated with earnings management. I demonstrate how management incentives and media experiences, along with communications between companies and the media, account for the positive relationship.
Second, this study adds to the expanding research on the use of management techniques to artificially raise stock values. There has been no research on the combination of media tilt and earnings management. This study investigates the connections between abnormal media tone before earnings release. Managers could speak with the media ahead of time to leverage (LEV) media slant as an additional tool to enhance the impact of earnings management. While research indicates that nondiscretionary accruals could serve as an alternative or supplement to DAC, there is no proof that earnings management and other management tools – aside from accounting methods – are related. This study aims to provide insights into how management might work together to raise stock prices soon.
Lastly, this work contributes to the body of knowledge regarding media spin. Despite the literature’s conclusion that businesses have an incentive to shape media tone, it is typically challenging to locate concrete proof of how businesses interact with the media. This research offers some evidence of the public communication channels that firms may employ to release information and influence media opinion by looking into the processes of earnings management in an aberrant media tone.
The remainder of this article is organized as follows. Section 2 introduces the background and develops the hypotheses. Section 3 discusses the methodology. Section 4 presents the empirical results and discussion. Section 5 discusses some further analysis. Section 6 shows the robustness and endogeneity checks. Section 7 concludes.
2 Background and Hypotheses
2.1 Earnings Management and Media News
The term “earnings management” invariably refers to management’s opportunistic use of DAC to manipulate reported profits (Schipper, 1989). The impact of earnings management is temporary since DAC allow revenues, expenses, gains, and losses to be shifted from 1 year to the next. As a result, they often “reverse” in a subsequent year (Chung et al., 2002). However, a wealth of evidence from earlier research indicates that earnings management occurs in a variety of contexts, including debt contracts (Beneish, 1997, Watts & Zimmerman, 1990), earnings expectations (Brown, 2001; Burgstahler & Dichev, 1997), executive compensation seeking (Bergstresser & Philippon, 2006; Cheng & Warfield, 2005), M&A (DeAngelo, 1988; Louis, 2004), and IPOs (Ducharme et al., 2004; Teoh et al., 1998a,b). The majority of research has found that managers profit from higher stock prices, which can be temporarily inflated by earnings manipulation. For instance, Stein (1989) develops a model to demonstrate that managers are expected to control earnings to raise stock prices in the short term and that this behavior intensifies as managers’ utility to the existing stock price increases. According to research by Cheng and Warfield (2005), managers who have large equity incentives are more likely to sell shares in the future, which encourages them to manipulate results to raise the market value of the shares they will eventually sell.
The literature also focuses on what determines earnings management. According to earlier research, earning management would be decreased by institutional ownership, audit committees, independent boards, and analyst coverage (Cornett et al., 2008; Klein, 2002). According to studies (Bergstresser & Philippon, 2006; Cheng & Warfield, 2005; Jiang et al., 2010), stock incentives also improve earning management.
In the literature, the media is frequently seen as an external financial market regulator and an information intermediary. Consequently, earlier research on the connection between media reporting and earnings management has mostly concentrated on the media’s function in limiting managerial opportunism and earnings management (Dyck et al., 2008; Miller, 2006). Chen et al. (2018) found that media attention can reduce earnings management efforts. After separating media news into informative and non-informative categories, Chahine et al. (2015) discovered that, before their equity carve-outs, earnings management is negatively connected with informative media news. According to Qi et al. (2014), “suspect firms” (ST, RO, and SEO firms) that receive greater public attention control their earnings more.
Recent research, however, reveals evidence that the media does not always act independently in the financial market. For instance, studies show that businesses have an incentive to control media coverage in certain circumstances, such as IPOs and takeovers (Ahern & Sosyura, 2014). Cook et al. (2006). Research also reveals that businesses can impact media bias by employing PR firms (Solomon, 2012), increasing advertising expenditures (Ellman & Germano, 2009; Reuter & Zitzewitz, 2006), disclosing CSR information (Cahan et al., 2015), utilizing local press outlets (Gurun & Butler, 2012), and appointing board members with prior experience in the media (Gurun, 2015).
Whether managers have an incentive to spin media when they manage reported earnings is an obvious question to follow, given that both earnings management and media spin are strategies managers use to artificially boost the firm share price in the short term. Do media reports complement or replace earnings management? By methodically examining the connection between earnings management and the unusual media tone preceding earnings disclosure, this study will provide an answer to this query.
2.2 Hypotheses
A theory of hard and soft information was presented by Bertomeu and Marinovic (2016). Hard information is verifiable, but soft disclosures include press releases, forecasts, and unaudited statements. They contend that when soft and hard information are released together, there is a higher chance of misreporting. According to this idea, I would anticipate media reports to serve as a supplement to the strategic release of hard information (managed profits) if I classify press releases as soft information and reported earnings as hard information.
First off, managers use media sentiment as a supplement to help impact stock prices when they are unable to fully utilize earnings management. Only in cases when the markets are having trouble identifying earnings management can managers exercise their accounting discretion to influence reported earnings and stock prices. Nonetheless, managers are unable to deceive investors using earnings management, according to the efficient market hypothesis. Furthermore, as information in the earnings announcements is subject to formal verification processes or audits, earnings management can be quickly found and shown to be “difficult to agree.” In this scenario, stock prices won’t respond to earnings reports in a way that suggests unexpected results. Therefore, managers are unable to completely benefit from earnings management. They can require an additional method as a complement to aid in managing earnings and impact stock prices. Such soft disclosures could help manage earnings because press releases are adept at presenting an impression of the covered company and can be “easily pushed in one direction or another” (Nelson & Ijiri, 1976).
Second, when the credibility of profits is low, investors may rely more on the opinion of media reports since the media press is always viewed as an information conduit and external supervisor. According to Schipper (1989), managers can control earnings because of asymmetric information and a lack of complete communication. However, because earnings information lacks credibility, such a bad information environment may also lessen the impact of profit management. Investors appear to value a second view in this instance from a third party. Consequently, managers who manage revenues can better pursue their interests by using press releases.
Lastly, because investors lack the skills to understand earnings information, the media is a crucial source of information in markets with a higher concentration of individual investors, like the Chinese stock market. In a situation like this, investor euphoria may be easily encouraged by the favorable media tone combined with falsified earnings. Therefore, I anticipate that corporations that manage their earnings more would likewise have more aggressive media coverage and a higher chance of overstatements. Therefore, I put out the following hypothesis:
Hypothesis 1
Ceteris paribus, companies that actively manage their earnings typically have an abnormally optimistic media tone immediately before their earnings presentation.
Insider trading and earnings management have a theoretical foundation thanks to earlier research (Bar-Gill & Bebchuk, 2003; Elitzur & Yaari, 2004; Trueman, 1990). They show that there are more incentives for managers to misreport and more instances of misreporting (such as participating in earnings management) when they plan to sell some of their holdings soon. Managers should modify DAC to boost current-period earnings before selling their own company’s shares in the following period, according to empirical research (Park & Park, 2004). The fundamental premise behind these incentives for earnings management is that managers would profit from increased revenues from insider sells if stock prices were affected by earnings management. If earnings management and related media spin lead to higher stock prices, managers would benefit more from the stock value than they would in the absence of press releases. In this instance, the use of DAC to manipulate reported earnings is more likely to be followed by the promotion of media press to effect the share price if managers sell their ownership in the following period of the annual report. Managers are still driven to inflate stock prices to better the circumstances under which their companies would be able to raise cash for new initiatives, even if they are unable to sell their shares immediately following the earnings report. In this instance, if managers can sell a portion of their shares during the intermediate trading period, the benefits to them from media spin and earnings management grow. As a result, I formulate the following hypothesis.
Hypothesis 2
The correlation between abnormal media tone before the earnings announcement and earnings management is stronger for companies whose managers sell their shares in the following period.
There is a large cross-sectional range in the firm’s capacity to influence media coverage. Several strategies, including the use of investor relations firms (Solomon, 2012), advertising fees (Reuter & Zitzewitz, 2006), local media (Gurun & Butler, 2012), and disclosure of corporate social responsibility (Cahan et al., 2015), are among the ways that studies contend that companies can manage the media to promote their corporate news stories. Gurun (2015) found that corporate board members with experience in the mass media have an impact on the media slant and coverage of their companies. They find that there are 21% fewer disparaging phrases in stories about companies that have a media professional on the board of directors. In our study, I take advantage of this supposition to investigate whether media experience affects the association between deviant media tone and earnings management. Generally, managers with media experiences have a better understanding of the relevant laws of media operation, familiar with the communication theories, and know what kind of text content can attract more attention, thus, they can gain greater benefits from media management. Meanwhile, media experiences also accumulated social network resources for them in the media industry, enabling them to contact more familiar journalists or media outlets, and the costs of media management may be much lower. Hence, in terms of both benefits and costs, managers with media experiences are more likely to proactively manage media. Therefore, I anticipate that managers who have worked in mass media will be more able to shape media opinion while overseeing profits. Next, I put up the following hypothesis.
Hypothesis 3
In companies where the managers have expertise in the media, there is a stronger correlation between abnormal media tone before results announcement and earnings management.
Earnings management and media spin both allude to the conflict of interest that exists between the managers employed by enterprises to decide on investment projects and payouts and the firm’s dispersed owner-investors since the ultimate purpose of both is to temporarily raise the share price of the company. According to earlier research, external corporate governance is crucial in preventing managers from handling abnormal accruals and enhancing the caliber of corporate earnings (Mitra & Cready, 2005; Velury & Jenkins, 2006). From this angle, one would anticipate that external governance would likewise lessen media spin since media spin is essentially a self-interested managerial practice. Therefore, I anticipate that businesses with stronger external governance will be less likely to control media coverage and earnings. As a result, I put out the following hypothesis.
Hypothesis 4
External governance reduces the correlation between abnormal media tone before to results announcement and earnings management.
3 Methodology
3.1 Sample and Data
As China formally launched the non-tradable shares reform in September 2005, I constructed the sample with all Chinese A share-listed companies[1] during the 2007–2022 period. I select the initial samples by excluding firms that are under special treatment,[2] have IPO, SEOs, and insider sales in a year,[3] in the financial services industry,[4] with fewer than 30 trading weeks of stock returns in a fiscal year, with no media report in 30 days before its earnings announcement, and with missing information for the control variables. After data filtering, I am left with a sample of 34,644 firm-year observations. Since the earnings announcement of year t is public in year t + 1, I chose the sample period of 2007–2021 for the control variables and 2008–2022 for the media data.
All detailed information on media reports is collected from the CNRDS database. Other financial data are sourced from the China Stock Market and Accounting Research database and the WIND database.
3.2 Measures
3.2.1 Earnings Management
Earnings management is usually measured by nondiscretionary accruals and DAC. Discretionary accruals reflect subjective accounting choices made by managers, whereas nondiscretionary accruals depend on the level of activity of a firm (Chung et al., 2002). To examine the role of media in managers’ reporting of earnings, I use DAC as a proxy for earnings management. I use a cross-sectional modified version of the Jones (1991) model to estimate DAC. This model is widely used to assess earnings management in the accounting literature (e.g. Dechow et al., 1995; Teoh et al., 1998a, b). I model total accruals as a function of changes in sales revenues minus changes in account receivables, and property, plant, and equipment. I then run the following cross-sectional model within each fiscal year and industry (based on SIC codes of CSRC):
where
3.2.2 Media Tone
In this article, all detailed information on media reports is collected from the CNRDS database, which is widely used in Mandarin studies (Li et al., 2019; Wang et al., 2024). This database covers 602 newspapers and 414 online media outlets, providing each media report’s release date, source, and tone. The tone of the article is determined based on machine learning methods by the database, which is assigned a value of one, minus one, and zero for positive, negative, and neutral tones, respectively. To verify the accuracy of the media tone provided by the database, I randomly selected 10,000 articles to manually judge the tone. The consistency rate is 94%, where the main difference is in the judgment of neutral reports, the judgment of positive and negative reports is basically the same.
I adopt three steps to measure the abnormal media tone before the earnings announcement. First, I calculate the raw media tone before the earnings announcement as follows:
where Raw_Tone is the average media tone on firm i in 30 days before the earnings announcement. Variable media tone is the tone of the media report j on firm i, which equals one when the tone of the media report is positive, minus one when it is negative, and zero when it is neutral. Coverage is the total number of media reports related to the firm i in 30 days before the earnings announcement.
Second, I use two benchmarks to capture the normal media tone. The first benchmark (Benchmark1) is the average media tone of the other firms in the same industry 30 days before the earnings announcement, which is calculated as equation (3). The second benchmark (Benchmark2) is the average media tone during the period between the last earnings announcement and 30 days before this earnings announcement, which is calculated as equation (4).
where Benchmark1 is the average media tone of the other firms in the same industry 30 days before earnings announcement. N is the number of firms in the firm i’s industry. Variable media_tone is the tone of the media report l on firm k, and Coverage is the total number of media reports on firm k in 30 days before the earnings announcement.
where Benchmark2 is the average media tone during the period between the last earnings announcement and 30 days before this earnings announcement. Variable media tone is the tone of the media report j on firm i. Coverage is the total number of media reports related to the firm i during the period between the last earnings announcement and 30 days before this earnings announcement.
Third, two measures of abnormal media tone are calculated as follows:
where Ab_Tone1 and Ab_Tone2 are abnormal media tones, which are the dependent variables in this article. Other variables are defined in the same way as equations (2)–(4). To better understand the measures of media tone, I use the following figure to clarify the related events and intervals (Figure 1).
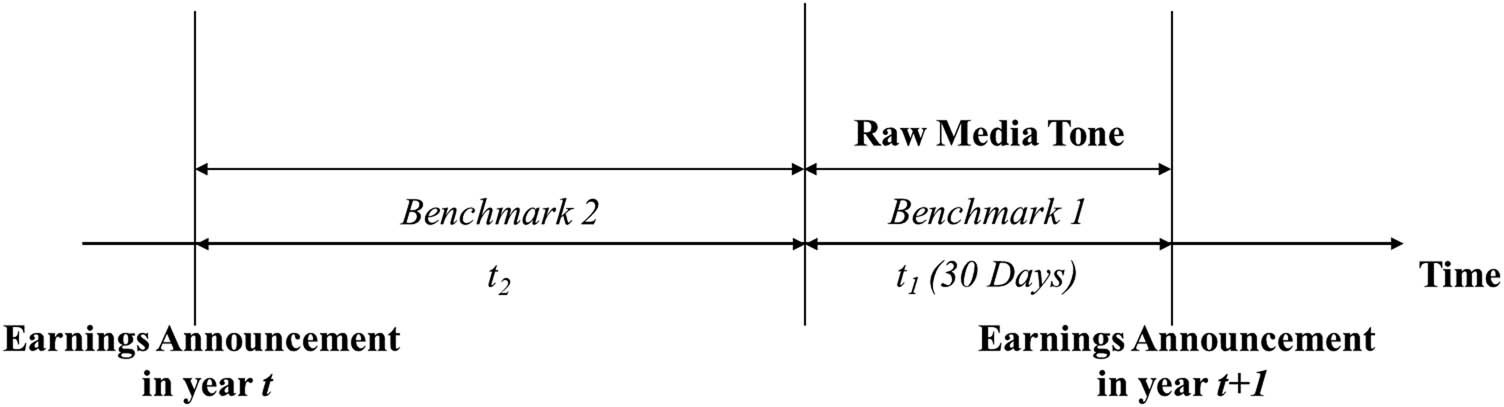
Timeline of events. This figure shows the timeline of events and the interval corresponding to media measures.
3.2.3 Empirical Model
To test the relationship between earnings management and abnormal media tones before the earnings announcement, I estimate the following model:
where Ab_Tone i,t + 1 is the abnormal media tone of firm i during the 30 days before the earnings announcement of year t + 1. DAC i,t is the earnings management level of the company i in year t proxied by DAC. I impose a 1-year lag between the dependent and independent variables because the earnings announcement of year t is public in year t + 1. I also measure all control variables (Controls) in year t. According to the previous literature on media (Fang et al., 2016; Li et al., 2019), the control variables in our article include financial LEV, book-to-market ratio (BM), return on assets (ROA), firm size (SIZE), firm age (AGE), analyst coverage (ANLST), institutional shareholdings (INS), the nature of equity (SOE), earnings per share (EPS) and MC. I also include industry and year dummies in all regressions. Variable definitions are provided in the Appendix. Following Petersen (2009), the standard errors are clustered at the firm level. Moreover, all continuous variables are winsorized at the 1 and 99% levels to mitigate the effect of outliers.
4 Empirical Results
4.1 Descriptive Statistics
The variable statistics are shown in Table 1. Discretionary accruals have a positive skewness in their distribution, with a mean and median value of 0.003 and −0.003, respectively, suggesting that they have a significant value. The distribution of the two aberrant media tone scores is comparable. The aberrant media tone’s mean and median values are both negative. The sample firms have an average ROA of 0.041, a market-to-book ratio of 0.611, an LEV of 0.501, and 7.8% institutional ownership. The state owns almost one-third of the business (means = 0.353).
Descriptive statistics
| Variable | N | Mean | 25thPctl. | Median | 75thPctl. | Std.Dev. |
|---|---|---|---|---|---|---|
| DAC | 34,644 | 0.003 | −0.045 | −0.003 | 0.040 | 0.087 |
| Ab_Tone1 | 34,644 | −0.007 | −0.179 | −0.021 | 0.149 | 0.268 |
| Ab_Tone2 | 34,644 | −0.006 | −0.132 | −0.007 | 0.125 | 0.212 |
| Control variables | ||||||
| SIZE | 34,644 | 22.042 | 20.348 | 23.188 | 24.093 | 2.450 |
| LEV | 34,644 | 0.501 | 0.166 | 0.743 | 0.972 | 17.899 |
| BM | 34,644 | 0.611 | 0.415 | 0.616 | 0.752 | 0.241 |
| AGE | 34,644 | 9.504 | 1.132 | 16.325 | 21.278 | 59.073 |
| SOE | 34,644 | 0.353 | 0.000 | 0.656 | 1.313 | 0.228 |
| ANLST | 34,644 | 1.321 | 0.000 | 2.395 | 2.989 | 1.413 |
| INS | 34,644 | 7.833 | 1.430 | 4.805 | 11.192 | 8.578 |
| ROA | 34,644 | 0.041 | −0.063 | 0.099 | 0.142 | 0.205 |
| EPS | 34,644 | 0.425 | 0.162 | 0.307 | 0.521 | 0.712 |
| MC | 34,644 | 4.882 | 4.421 | 4.916 | 5.071 | 0.824 |
| Other mediator and moderator variables | ||||||
| REDUC | 34,644 | 0.141 | 0.000 | 0.000 | 0.000 | 0.426 |
| MEDIA | 34,644 | 0.042 | 0.000 | 0.000 | 0.000 | 0.181 |
| AUDIT | 34,644 | 0.081 | 0.000 | 0.000 | 0.0000 | 0.264 |
| ANLST_average | 34,644 | 0.091 | 0.000 | 0.000 | 0.000 | 0.272 |
| ΔANLST_average | 34,644 | 0.002 | 0.000 | 0.000 | 0.000 | 0.122 |
| Forecast | 17,462 | 0.742 | 0.000 | 1.000 | 1.000 | 0.513 |
| Earnings | 15,386 | −0.081 | 0.246 | 0.053 | 0.083 | 0.455 |
This table reports the summary statistics of variables in our sample. The period is from 2007 to 2015. Detailed variable definitions are reported in Table A1.
The Pearson correlation matrix for the variables utilized in this article is shown in Table 2. The two measures of aberrant media tone have a 0.89 correlation coefficient, which is significant at the 1% level. At the 1% level, there is a substantial positive correlation between the DAC and the two media tone variables. This supports the first hypothesis, which states that greater optimism in the media before the earnings announcement is caused by more favorable earnings management.
Pearson correlation matrix
| 1 | 2 | 3 | 4 | 5 | 6 | 7 | 8 | 9 | 10 | 11 | 12 | 13 | 14 | 15 | 16 | 17 | 18 | 19 | 20 | |
|---|---|---|---|---|---|---|---|---|---|---|---|---|---|---|---|---|---|---|---|---|
| 1. DAC | 1.00 | |||||||||||||||||||
| 2. Ab_Tone1 | 0.03 | 1.00 | ||||||||||||||||||
| 3. Ab_Tone2 | 0.03 | 0.89 | 1.00 | |||||||||||||||||
| 4. SIZE | 0.01 | 0.04 | 0.02 | 1.00 | ||||||||||||||||
| 5 LEV | −0.06 | −0.03 | −0.04 | 0.40 | 1.00 | |||||||||||||||
| 6.BM | 0.01 | −0.07 | −0.08 | 0.51 | 0.29 | 1.00 | ||||||||||||||
| 7. AGE | −0.08 | 0.03 | 0.03 | 0.25 | 0.32 | 0.04 | 1.00 | |||||||||||||
| 8. SOE | −0.06 | 0.01 | 0.00 | 0.34 | 0.24 | 0.20 | 0.37 | 1.00 | ||||||||||||
| 9. ANLST | −0.07 | 0.09 | 0.08 | 0.37 | −0.10 | 0.01 | −0.21 | −0.03 | 1.00 | |||||||||||
| 10. INS | −0.03 | 0.10 | 0.09 | 0.11 | −0.02 | −0.23 | −0.00 | 0.01 | 0.48 | 1.00 | ||||||||||
| 11. ROA | 0.00 | 0.06 | 0.06 | 0.02 | −0.20 | −0.18 | −0.09 | −0.07 | 0.33 | 0.27 | 1.00 | |||||||||
| 12 EPS | 0.12 | 0.06 | 0.055 | 0.21 | −0.13 | −0.04 | −0.06 | −0.01 | 0.41 | 0.30 | 0.40 | 1.00 | ||||||||
| 13.MC | 0.03 | −0.08 | −0.09 | 0.40 | 0.08 | 0.05 | −0.02 | 0.02 | 0.39 | 0.21 | 0.12 | 0.22 | 1.00 | |||||||
| 14. REDUC | 0.03 | 0.03 | 0.00 | −0.09 | −0.01 | −0.06 | −0.14 | −0.11 | 0.07 | 0.06 | 0.00 | 0.02 | 0.14 | 1.00 | ||||||
| 15. MEDIA | −0.00 | −0.02 | 0.02 | 0.02 | −0.03 | −0.01 | −0.04 | 0.19 | 0.05 | 0.00 | −0.01 | 0.00 | 0.07 | 0.02 | 1.00 | |||||
| 16. AUDIT | −0.04 | 0.01 | −0.01 | 0.40 | 0.09 | 0.19 | 0.04 | 0.14 | 0.19 | 0.01 | 0.04 | 0.10 | 0.22 | −0.00 | 0.01 | 1.00 | ||||
| 17 ANLST_average | 0.03 | 0.02 | −0.00 | 0.12 | −0.05 | −0.02 | −0.11 | 0.02 | 0.34 | 0.29 | 0.24 | 0.37 | 0.19 | −0.00 | 0.01 | 0.06 | 1.00 | |||
| 18. ΔANLST_average | −0.02 | 0.02 | 0.01 | 0.04 | 0.04 | −0.08 | 0.07 | 0.05 | 0.18 | 0.08 | 0.80 | 0.14 | 0.04 | 0.01 | −0.00 | 0.09 | 0.22 | 1.00 | ||
| 19. Forecast | 0.15 | 0.09 | 0.10 | 0.00 | −0.11 | −0.15 | −0.13 | −0.07 | 0.24 | 0.21 | 0.29 | 0.42 | 0.09 | 0.01 | 0.01 | −0.02 | 0.18 | 0.15 | 1.00 | |
| 20. Earnings | 0.01 | 0.06 | 0.05 | 0.08 | 0.08 | −0.05 | 0.19 | 0.13 | −0.04 | 0.08 | 0.09 | 0.01 | 0.01 | −0.00 | −0.05 | 0.03 | 0.05 | 0.26 | 0.31 | 1.00 |
This table reports the Pearson correlation coefficients between the variables. Bold values indicate statistical significance at the 5 or 1% level.
4.2 Baseline Regression Results
Table 3 presents the baseline regression results of this article. Consistent with our prediction, DAC have a significantly positive coefficient, suggesting that companies with more positive earnings management are more likely to experience a more optimistic abnormal media tone in the days before the earnings announcement. On average, a one-standard-deviation increase in DAC is associated with an increase of 2.24% (= 0.069 × 0.087/0.268) and 2.25% (= 0.060 × 0.087/0.212) of a standard deviation in abnormal media tone before the earnings announcement as measured by Ab_Tone1 and Ab_Tone1 respectively. Coefficients for six of the control variables are significant at the 0.01 level. The variables of firm size (SIZE), firm age (AGE), analyst coverage (ANLST), INS, the nature of equity (SOE), EPS, and ROA have positive signs. The LEV, BM ratio variable and MC have negative signs. The signs and statistical significance are consistent with previous research on MC in other contexts (Fang & Peress, 2009; Gurun & Butler, 2012; Gurun, 2015).
Media tone and earnings management
| (1) | (2) | |
|---|---|---|
| Ab_Tone1 t + 1 | Ab_Tone2 t + 1 | |
| DAC t | 0.069*** | 0.060*** |
| (3.21) | (3.58) | |
| SIZE t | 0.016*** | 0.009*** |
| (4.10) | (3.21) | |
| LEV t | −0.064*** | −0.054*** |
| (−4.56) | (−5.32) | |
| BM t | −0.070*** | −0.050*** |
| (−4.10) | (−3.52) | |
| AGE t | 0.001*** | 0.001*** |
| (3.19) | (3.64) | |
| SOE t | 0.015** | 0.010** |
| (2.46) | (2.35) | |
| ANLST t | 0.032*** | 0.027*** |
| (6.62) | (6.97) | |
| INS t | 0.002*** | 0.001*** |
| (4.98) | (4.31) | |
| ROA t | 0.065 | 0.031 |
| (1.54) | (1.36) | |
| EPS t | 0.006 | 0.005 |
| (1.45) | (1.67) | |
| MC t | −0.058*** | −0.041*** |
| (−14.32) | (−13.96) | |
| Intercept t | −0.067 | 0.015 |
| (−1.21) | (0.52) | |
| Fixed Industry | YES | YES |
| Fixed Year | YES | YES |
| N | 34,644 | 34,644 |
| R 2 | 0.081 | 0.091 |
This table documents the correlation between earnings management and abnormal media tone. The dependent variables for columns (1) and (2) are Ab_Tone1 t + 1 and Ab_Tone2 t + 1, respectively. The independent variable is accrual earning management (DAC t ). Industry and Fixed Years (Industry and Year dummies) are included in the regression. Figures in parentheses are t-statistics, which are based on standard errors adjusted for firm and time clustering (Petersen, 2009). Levels of significance are denoted by *(10%), **(5%), and ***(1%).
4.3 Influence Factors
As I anticipate in Hypotheses 2–4, managers may be more motivated to control profits and interact with the media before the earnings announcement if they intend to sell their own company’s shares in the upcoming term. Additionally, such communication can be considerably simpler given the corporate managers’ prior media experience. External corporate governance, however, might prevent management from controlling media tilt and abnormal accruals. I include the interaction between DAC and these covariates in model (7), respectively, to quantify the effects of these factors.
The computed regression coefficients are reported in Table 4. To prevent endogeneity in the baseline regression, I removed the companies that had IPOs, SEOs, and insider sales around the time of the earnings announcement. I include the firms whose managers sell their ownership in the 180 days following the earnings announcement to examine the impact of managers’ motivations in controlling both MC and firm earnings. I use REDUC to proxy for insider sales. If managers sell the shares of their own companies within 180 days of the annual report, it equals one. If not, it equals zero. I include REDUC as a control in the regression to address the potential endogeneity issue that media spin may be triggered by insider sales rather than earnings management. The findings demonstrate that even with REDUC included, the DAC coefficients are still positive and significant. In the meantime, for both measures of abnormal media tone, the coefficients of the interaction between DAC and REDUC are positive and significant at the 5% level. This confirms our hypothesis that managers who sell shares after the earnings announcement would have purposefully inflated the stock price by boosting earnings through DAs and spins in the media.
Effects of insider sales and media experience
| (1) | (2) | (3) | (4) | |
|---|---|---|---|---|
| Ab_Tone1 t + 1 | Ab_Tone2 t + 1 | Ab_Tone1 t + 1 | Ab_Tone2 t + 1 | |
| DAC t | 0.015*** | 0.013*** | 0.062** | 0.058*** |
| (3.44) | (4.29) | (2.34) | (2.98) | |
| REDUC t | 0.012** | 0.008** | ||
| (2.35) | (2.46) | |||
| REDUC t × DAC t | 0.030** | 0.028*** | ||
| (2.48) | (2.69) | |||
| MEDIA t | 0.022* | 0.016* | ||
| (1.95) | (1.68) | |||
| MEDIA t × DAC t | 0.264*** | 0.176** | ||
| (2.92) | (2.35) | |||
| SIZE t | 0.006*** | 0.002 | 0.014*** | 0.009*** |
| (2.98) | (1.36) | (3.87) | (3.21) | |
| LEV t | −0.032*** | −0.024*** | −0.059*** | −0.058*** |
| (−3.31) | (−3.71) | (−5.12) | (−5.24) | |
| BM t | −0.032*** | −0.020*** | −0.071*** | −0.055*** |
| (−3.23) | (−2.57) | (−4.32) | (−3.67) | |
| AGE t | 0.001*** | 0.001*** | 0.012** | 0.001*** |
| (3.56) | (3.79) | (2.25) | (2.70) | |
| SOE t | 0.008*** | 0.007** | 0.015*** | 0.010** |
| (2.55) | (2.57) | (2.89) | (2.38) | |
| ANLST t | 0.011*** | 0.008*** | 0.021** | 0.018*** |
| (5.10) | (5.21) | (7.29) | (7.76) | |
| INS t | 0.002*** | 0.001*** | 0.002*** | 0.001*** |
| (7.21) | (6.22) | (5.81) | (5.18) | |
| ROA t | 0.051** | 0.044** | 0.067 | 0.045 |
| (2.22) | (2.13) | (1.42) | (1.23) | |
| EPS t | −0.003 | −0.002 | 0.006 | 0.005 |
| (−1.19) | (−1.00) | (1.15) | (1.48) | |
| MC t | −0.031*** | −0.022*** | −0.538*** | −0.384*** |
| (−10.55) | (−10.64) | (−13.41) | (−13.52) | |
| Intercept t | −0.022 | 0.029 | −0.019 | 0.018 |
| (−0.58) | (0.86) | (−1.01) | (0.44) | |
| Fixed Industry | YES | YES | YES | YES |
| Fixed Year | YES | YES | YES | YES |
| N | 34,644 | 34,644 | 34,644 | 34,644 |
| R 2 | 0.038 | 0.030 | 0.081 | 0.085 |
This table documents the influence factors that affect the association between earnings management and abnormal media tone. The results of insider sales are reported in columns (1) and (2), and results for media experience are in columns (3) and (4). Industry and year fixed effects (Industry and Year dummies) are included in the regression. Figures in parentheses are t-statistics, which are based on standard errors adjusted for firm and time clustering (Petersen, 2009). Levels of significance are denoted by *(10%), **(5%), and ***(1%).
The working experience in the media industry of managers is defined by MEDIA, where MEDIA = 1 indicates that a company’s board members have worked or studied in the media, while MEDIA = 0 indicates otherwise. The findings demonstrate that, at the 0.01 or 0.05 level, there is still a substantial positive correlation between DAC and the atypical media tone in the days preceding the earnings announcement. At the 5% level, the interaction coefficients between DAC and MEDIA are both significant and positive. The findings imply that abnormal media tone and earnings management have a stronger beneficial relationship for companies whose managers have previous experience in the media.
Table 5 illustrates how the relationships between abnormal media tone and DAC are impacted by external corporate governance. According to earlier research, managers can be restrained from handling aberrant accruals and the quality of company earnings can be increased by analysts, auditors’ reputation, and institutional ownership (DeFond & Jiambalvo, 1991; Dyck et al., 2010; Healy & Palepu, 2001). Consequently, I employ institutional ownership (INS), analyst coverage (ANLST), and audit firm reputation (AUDIT) as proxies for external corporate governance, with AUDIT = 0 otherwise and AUDIT = 1 if the audit firm is among the top four firms. Table 5 displays the impact of analyst coverage in the first two columns, audit reputation in columns (3) and (4), and institutional ownership in the final two columns. I discover that, in all columns, the relationship between DAC and the unusual media tone immediately preceding the results announcement is still positive and significant at the 0.01 level. Additionally, at the 0.01 level, the interaction coefficients between DAC and the three proxies – ANLST, AUDIT, and INS – are significant and negative. This supports our hypothesis that the beneficial relationships between abnormal media tone before to results announcement and earnings management are weakened by external corporate governance.
Effect of external corporate governance
| (1) | (2) | (3) | (4) | (5) | (6) | |
|---|---|---|---|---|---|---|
| Ab_Tone1 t + 1 | Ab_Tone2 t + 1 | Ab_Tone1 t + 1 | Ab_Tone2 t + 1 | Ab_Tone1 t + 1 | Ab_Tone2 t + 1 | |
| DAC t | 0.236*** | 0.189*** | 0.101*** | 0.098*** | 0.175*** | 0.121*** |
| (3.91) | (4.88) | (3.50) | (3.81) | (4.63) | (4.22) | |
| ANLST t | 0.025*** | 0.021*** | 0.025*** | 0.020*** | 0.023*** | 0.021*** |
| (7.66) | (7.87) | (7.54) | (7.96) | (7.39) | (7.50) | |
| ANLST t × DAC t | −0.073*** | −0.058*** | ||||
| (−2.99) | (−2.97) | |||||
| AUDIT t | −0.012 | −0.010 | ||||
| (−1.12) | (−1.28) | |||||
| AUDIT t × DAC t | −0.376*** | −0.299*** | ||||
| (−2.98) | (−3.09) | |||||
| INS t | 0.002*** | 0.001*** | 0.002*** | 0.001*** | 0.002*** | 0.001*** |
| (5.38) | (4.89) | (5.38) | (4.96) | (5.54) | (4.88) | |
| INS t × DAC t | −0.011*** | −0.006*** | ||||
| (−3.78) | (−3.00) | |||||
| SIZE t | 0.016*** | 0.009*** | 0.016*** | 0.009*** | 0.017*** | 0.009*** |
| (3.90) | (2.96) | (3.46) | (3.05) | (4.17) | (3.00) | |
| LEV t | −0.064*** | −0.052*** | −0.065*** | −0.054*** | −0.066*** | −0.055*** |
| (−4.72) | (−5.41) | (−4.63) | (−5.50) | (−4.98) | (−5.37) | |
| BM t | −0.076*** | −0.048*** | −0.075*** | −0.048*** | −0.076*** | −0.047*** |
| (−4.49) | (−3.89) | (−4.31) | (−3.76) | (−4.22) | (−3.95) | |
| AGE t | 0.001** | 0.001** | 0.001** | 0.001** | 0.001** | 0.001*** |
| (2.19) | (2.58) | (2.19) | (2.58) | (2.19) | (2.68) | |
| SOE t | 0.016** | 0.011** | 0.017*** | 0.012** | 0.016** | 0.011** |
| (2.56) | (2.25) | (2.69) | (2.41) | (2.58) | (2.33) | |
| ROA t | 0.060 | 0.032 | 0.061 | 0.033 | 0.065 | 0.035 |
| (1.33) | (1.03) | (1.42) | (1.09) | (1.49) | (1.08) | |
| EPS t | 0.006 | 0.005 | 0.006 | 0.005 | 0.006 | 0.005 |
| (1.31) | (1.42) | (1.33) | (1.51) | (1.28) | (1.47) | |
| MC t | −0.053*** | −0.040*** | −0.053*** | −0.040*** | −0.053*** | −0.040*** |
| (−14.35) | (−14.30) | (−14.30) | (−14.22) | (−14.03) | (−14.26) | |
| Intercept t | −0.064 | 0.022 | −0.069 | 0.009 | −0.079 | 0.010 |
| (−1.02) | (0.39) | (−1.02) | (0.14) | (−1.15) | (0.25) | |
| Fixed Industry | YES | YES | YES | YES | YES | YES |
| Fixed Year | YES | YES | YES | YES | YES | YES |
| N | 34,644 | 34,644 | 34,644 | 34,644 | 34,644 | 34,644 |
| R 2 | 0.0880 | 0.087 | 0.080 | 0.088 | 0.080 | 0.088 |
This table documents the effect of external corporate governance on the association between earnings managements and abnormal media tone. ANLST is defined as the natural logarithm of analyst coverage plus 1. AUDIT is defined as the reputation of audit firms, it equals 1 if firm’s external audit is one of the four major audit organizations, and otherwise, it is 0. INS is the ownership of institutions. Industry and year fixed effects (Industry and Year dummies) are included in the regression. Figures in parentheses are t-statistics, which are based on standard errors adjusted for firm and time clustering (Petersen, 2009). Levels of significance are denoted by *(10%), **(5%), and ***(1%).
5 Further Analysis: Communication Channels
According to the Section 4 empirical data, there might be discussions between media outlets and companies before the release of earnings. Financial media opinion may be influenced by firms that engage in either covert or overt messaging. Giving a heads-up about the performance before the earnings announcement is one approach that could work. I examine the impact using two releases: pre-announced earnings and preliminary accounting information. While preliminary accounting data is the unaudited accounting data released before annual reports, earnings pre-announcement is often a performance estimate of firms’ profit to prevent significant movements in stock price following the earnings announcement. Aside from a few unique circumstances, both disclosures are optional for companies listed on the Chinese stock exchange. I speculate that if businesses disclose their artificially generated excess through pre-announced earnings and preliminary accounting information, the media could consequently form an opinion on the business. The unusual media tone that precedes the earnings announcement is shaped by such public opinion guidelines.
By excluding all required disclosures, I manually gather 17,462 earnings pre-announcements and 15,386 preliminary accounting data disclosures between the end of the previous fiscal year and the annual report’s release. Both pre-announced earnings and preliminary accounting data before the earnings announcement are present in 14,261 observations. I use the dummy variable PRE to define the earnings pre-announcement. Forecast = 1 and Forecast = 0 else if the results pre-announcement mentions “big increase,” “slight increase,” “turn a loss into profit,” or “continued profit.” I utilize the difference between the EPS in the year t’s preliminary accounting data and the actual EPS in year t – 1 as a proxy for the earnings information in the year t’s preliminary accounting data (Earnings), as EPS is contained in the preliminary earnings estimate.
Next, I analyze the channels using the Causal Step Regression and Sobel test, which were suggested by Baron and Kenny (1986) and Sobel (1982). Tables 6 and 7 present the empirical estimations, respectively. The channel effect of earnings pre-announcement is shown in Table 6. I regress DAC to earnings pre-announcement (Forecast) in the first phase. Companies with positive earnings management tend to deliver positive earnings pre-announcement, according to Table 6’s Column (1), where the coefficient estimate of DAC is positive and significant. I regress the earnings pre-announcement (Forecast) to the abnormal media tone before the earnings announcement (Ab_Tone) in the second step. Positive earnings pre-release can result in abnormally positive media coverage before the results announcement, as seen by the significantly positive coefficient of forecast in Column (2). Discretionary accruals (DAC) and earnings pre-announcement (Forecast) are included in the regression model (5) in the third phase. It is seen that there is a substantial positive correlation between the independent and mediator variable coefficients. When the forecast is incorporated into the analysis, the relevance of DAC declines in relation to our baseline findings in Table 3. This suggests that earnings pre-announcement plays a role in the impact of DAC on aberrant media tone. The channel effect of preliminary accounting data is seen in Table 7. Preliminary accounting data results are comparable to pre-announced earnings. Thus, accounting data also play a role in explaining the relationship between DAC and the unusual media tone before the earnings announcement. To determine whether the mediate effects are significant, I can employ the Sobel test. The Sobel Z-values for both the pre-announcement earnings and the preliminary accounting data are significant at the 1% level.
The channel effect of earnings pre-announcement
| (1) | (2) | (3) | (4) | (5) | |
|---|---|---|---|---|---|
| Forecast t | Ab_Tone1 t + 1 | Ab_Tone2 t + 1 | Ab_Tone1 t + 1 | Ab_Tone2 t + 1 | |
| Forecast t | 0.041*** | 0.033*** | 0.040*** | 0.035*** | |
| (5.58) | (5.88) | (5.22) | (5.63) | ||
| DAC t | 0.398*** | 0.071** | 0.055** | ||
| (8.31) | (2.32) | (2.39) | |||
| SIZE t | −0.004 | 0.013** | 0.007* | 0.013** | 0.007* |
| (−0.62) | (2.43) | (1.75) | (2.56) | (1.72) | |
| LEV t | −0.020 | −0.070*** | −0.059*** | −0.068*** | −0.058*** |
| (−0.82) | (−4.10) | (−4.52) | (−4.14) | (−4.62) | |
| BM t | −0.102*** | −0.059** | −0.036** | −0.058** | −0.036** |
| (−2.99) | (−2.75) | (−2.34) | (−2.67) | (−2.37) | |
| AGE t | −0.003*** | 0.001* | 0.001* | 0.001* | 0.001* |
| (−4.54) | (1.71) | (1.82) | (1.73) | (1.92) | |
| SOE t | 0.012 | 0.008 | 0.004 | 0.009 | 0.005 |
| (0.89) | (0.89) | (0.66) | (0.99) | (0.73) | |
| ANLST t | 0.017*** | 0.024*** | 0.017*** | 0.023*** | 0.017*** |
| (2.98) | (5.76) | (6.23) | (5.98) | (6.00) | |
| INS t | 0.002*** | 0.002*** | 0.001*** | 0.002*** | 0.001*** |
| (3.01) | (3.96) | (3.33) | (4.00) | (3.88) | |
| ROA t | 0.850*** | 0.039 | 0.029 | 0.047 | 0.035 |
| (10.00) | (0.79) | (0.79) | (0.95) | (0.93) | |
| EPS t | 0.247*** | 0.007 | 0.006 | 0.005 | 0.005 |
| (25.01) | (1.21) | (1.33) | (0.96) | (1.00) | |
| MC t | −0.002 | −0.054*** | −0.040*** | −0.054*** | −0.040*** |
| (−0.25) | (−10.04) | (−10.82) | (−10.03) | (−10.99) | |
| Intercept t | 0.651*** | −0.012 | 0.045 | −0.011 | 0.046 |
| (4.83) | (−0.36) | (0.81) | (−0.35) | (0.80) | |
| Fixed Industry | YES | YES | YES | YES | YES |
| Fixed Year | YES | YES | YES | YES | YES |
| N | 17,462 | 17,462 | 17,462 | 17,462 | 17,462 |
| R-squared | 0.221 | 0.099 | 0.111 | 0.100 | 0.109 |
This table documents the channel effect of companies’ earnings pre-announcement on the correlation between earnings management and abnormal media tone. Columns (1) is the regression result of DAC on Forecast. Columns (2) and (3) are the regression results of Forecast on Ab_Tone1 and Ab_Tone2. Columns (4) and (5) are the regression results of including both Forecast and DAC to model 5. Industry and Fixed Years (Industry and Year dummies) are included in the regression. Figures in parentheses are t-statistics, which are based on standard errors adjusted for firm and time clustering (Petersen, 2009). Levels of significance are denoted by *(10%), **(5%), and ***(1%).
The channel effect of preliminary accounting data
| (1) | (2) | (3) | (4) | (5) | |
|---|---|---|---|---|---|
| Earnings t | Ab_Tone1 t + 1 | Ab_Tone2 t + 1 | Ab_Tone1 t + 1 | Ab_Tone2 t + 1 | |
| Earnings t | 0.056*** | 0.039*** | 0.054*** | 0.038*** | |
| (5.22) | (4.89) | (5.11) | (4.99) | ||
| DAC t | 0.181** | 0.036 | 0.014 | ||
| (2.45) | (0.79) | (0.56) | |||
| SIZE t | −0.014 | 0.024*** | 0.018*** | 0.024*** | 0.018*** |
| (−1.25) | (3.41) | (3.32) | (3.52) | (3.27) | |
| LEV t | 0.115*** | −0.092*** | −0.061*** | −0.083*** | −0.061*** |
| (2.89) | (−3.41) | (−3.40) | (−3.39) | (−3.42) | |
| BM t | −0.068 | −0.088*** | −0.081*** | −0.089*** | −0.081*** |
| (−1.43) | (−2.95) | (−3.62) | (−2.98) | (−3.62) | |
| AGE t | 0.008*** | −0.001 | 0.001 | −0.007 | −0.001 |
| (5.33) | (−0.78) | (−0.69) | (−0.67) | (−0.69) | |
| SOE t | 0.014 | −0.007 | −0.008 | −0.006 | −0.008 |
| (0.89) | (−0.59) | (−0.91) | (−0.52) | (−0.83) | |
| ANLST t | −0.071*** | 0.031*** | 0.024*** | 0.031*** | 0.024*** |
| (−9.99) | (5.80) | (5.95) | (5.77) | (5.98) | |
| INS t | 0.002** | 0.002*** | 0.001** | 0.002*** | 0.001** |
| (2.64) | (2.81) | (2.43) | (2.89) | (2.41) | |
| ROA t | −0.009 | −0.095 | −0.065 | −0.090 | −0.063 |
| (−0.08) | (−1.15) | (−1.09) | (−1.08) | (−1.04) | |
| EPS t | 0.339*** | 0.001 | −0.002 | −0.000 | −0.003 |
| (22.39) | (0.17) | (−0.28) | (−0.01) | (−0.30) | |
| MC t | 0.092** | −0.081*** | −0.064*** | −0.081*** | −0.064*** |
| (2.43) | (−10.31) | (−11.11) | (−10.30) | (−11.10) | |
| Intercept t | 0.109 | −0.079 | −0.050 | −0.083 | 0.134*** |
| (0.61) | (−0.61) | (−0.62) | (−0.61) | (2.88) | |
| Fixed Industry | YES | YES | YES | YES | YES |
| Fixed Year | YES | YES | YES | YES | YES |
| N | 15,386 | 15,386 | 15,386 | 15,386 | 15,386 |
| R-squared | 0.176 | 0.100 | 0.109 | 0.101 | 0.111 |
This table documents the channel effect of the release of preliminary accounting data on the correlation between earnings management and abnormal media tone. Earnings equals the difference between EPS in preliminary earnings estimate in year t and the actual EPS in year t – 1. Columns (1) is the regression result of DAC on Earnings. Columns (2) and (3) are the regression results of Earnings on Ab_Tone. Columns (4) and (5) are the regression results of adding Earnings to model 5. Industry and Fixed Years (Industry and Year dummies) are included in the regression. Figures in parentheses are t-statistics, which are based on standard errors adjusted for firm and time clustering (Petersen, 2009). Levels of significance are denoted by *(10%), **(5%), and ***(1%).
I employ 14,261 samples that have both preliminary accounting data and earnings pre-announcement before the earnings announcement to investigate the main mediator. In the Causal Step Regression, I add both variables as mediators, and Table 8 presents the outcomes. I discover that while the significance of profits pre-announcement is diminished for Ab_Tone1, the mediating effect of preliminary accounting data is still significant. To estimate the coefficients, I additionally employ the bootstrap method, which involves self-sampling 1,000 times. Let us assume the following: the coefficients of Forecast and Earnings to Ab_Tone are γ and ω, respectively, and the regression coefficients of DAC to Forecast and Earnings are α and β, respectively. If αγ is greater than βω, then Forecast has a greater mediating impact than Earnings. Earnings is the primary mediator if αγ < βω. Table 9 displays the acquired results. Our findings are in line with Table 8, which shows that there is less significance for the earnings pre-announcement mediating impact. Furthermore, there is a notable distinction in the mediating impact between the two mediators. As a result, I can say that preliminary accounting data has a stronger mediating influence. The reason could be that preliminary accounting data mostly comprises specific quantities of earnings that are close to the earnings announcement, while earnings pre-announcement uses more ambiguous language, like “big increase” and “slightly decrease.” Furthermore, preliminary accounting data is always released closer to the time of the earnings announcement, increasing the likelihood that the media would express an unusual attitude before the announcement of earnings. There must be alternative channels via which businesses interact with the media before the earnings announcement, nevertheless, given that not all of them make their preliminary accounting data and earnings pre-announcement public.
Causal step regression of two channels
| (1) | (2) | (3) | (4) | (5) | (6) | |
|---|---|---|---|---|---|---|
| Forecast t | Earnings t | Ab_Tone1 t + 1 | Ab_Tone2 t + 1 | Ab_Tone1 t + 1 | Ab_Tone2 t + 1 | |
| DAC t | 0.361*** | 0.186** | 0.029 | −0.009 | ||
| (4.58) | (2.33) | (0.73) | (−0.29) | |||
| Forecast t | 0.024** | 0.024*** | 0.023* | 0.024*** | ||
| (2.09) | (2.99) | (2.02) | (2.97) | |||
| Earnings t | 0.052*** | 0.038*** | 0.051*** | 0.034*** | ||
| (4.44) | (3.91) | (4.52) | (3.89) | |||
| SIZE t | −0.018 | −0.022* | 0.024*** | 0.011*** | 0.024*** | 0.021*** |
| (−1.54) | (−1.91) | (3.12) | (3.41) | (3.33) | (3.46) | |
| LEV t | 0.156*** | 0.099** | −0.073*** | −0.058*** | −0.071*** | −0.059*** |
| (3.88) | (2.51) | (−2.62) | (−2.99) | (−2.72) | (−2.97) | |
| BM t | −0.123** | −0.042 | −0.100*** | −0.084*** | −0.100*** | −0.084*** |
| (−2.45) | (−0.87) | (−2.91) | (−3.42) | (−2.96) | (−3.43) | |
| AGE t | −0.010*** | 0.013*** | −0.003 | −0.002 | −0.003 | −0.002 |
| (−4.86) | (6.23) | (−1.34) | (−1.00) | (−1.32) | (−1.00) | |
| SOE t | −0.003 | 0.012 | −0.006 | −0.007 | −0.006 | −0.007 |
| (−0.43) | (0.62) | (−0.60) | (−0.75) | (−0.63) | (−0.73) | |
| ANLST t | 0.025*** | −0.073*** | 0.028*** | 0.021*** | 0.028*** | 0.021*** |
| (2.95) | (−8.88) | (4.82) | (4.90) | (4.83) | (4.93) | |
| INS t | 0.003*** | 0.003** | 0.002** | 0.001** | 0.002** | 0.001** |
| (2.42) | (2.65) | (2.64) | (2.33) | (2.44) | (2.13) | |
| ROA t | 0.979*** | −0.100 | −0.058 | −0.033 | −0.054 | −0.034 |
| (7.32) | (−0.75) | (−0.57) | (−0.57) | (−0.63) | (−0.58) | |
| EPS t | 0.245*** | 0.384*** | −0.012 | −0.011 | −0.011 | −0.011 |
| (14.90) | (23.76) | (−0.98) | (−1.11) | (−0.95) | (−1.06) | |
| MC t | 0.032** | 0.011 | −0.088*** | −0.070*** | −0.087*** | −0.070*** |
| (2.48) | (0.78) | (−10.01) | (−10.97) | (−9.97) | (−11.07) | |
| Intercept t | 0.725*** | 0.250 | −0.008 | −0.999 | −0.221 | 0.101 |
| (3.20) | (1.21) | (−0.96) | (−0.93) | (−0.86) | (−0.98) | |
| Fixed Industry | YES | YES | YES | YES | YES | YES |
| Fixed Year | YES | YES | YES | YES | YES | YES |
| N | 14,261 | 14,261 | 14,261 | 14,261 | 14,261 | 14,261 |
| R-squared | 0.230 | 0.198 | 0.113 | 0.123 | 0.115 | 0.125 |
This table documents the effect of including both earnings pre-announcement and preliminary accounting data as mediators. The dependent variables for column (1) are Forecast, for column (2) is Earnings, and for columns (3)–(6) are Ab_Tone. Industry and Fixed Years (Industry and Year dummies) are included in the regression. Figures in parentheses are t-statistics, which are based on standard errors adjusted for firm and time clustering (Petersen, 2009). Levels of significance are denoted by *(10%), **(5%), and ***(1%).
Bootstrapping result of dominant mediator
| Coefficient | Bootstrap test | ||
|---|---|---|---|
| Impact of DAC on Forecast | α | 0.362*** (4.84) | |
| Impact of DAC on Earnings | β | 0.184** (2.43) | |
| Mediating effect of preliminary accounting data | αγ | Ab_Tone1 t + 1 | 0.019*** (3.12) |
| Ab_Tone2 t + 1 | 0.018*** (3.82) | ||
| Mediating effect of earnings pre-announcement | βω | Ab_Tone1 t + 1 | 0.007* (1.91) |
| Ab_Tone2 t + 1 | 0.005* (1.78) | ||
| The difference in mediating effect | αγ − βω | Ab_Tone1 t + 1 | 0.013* (1.74) |
| Ab_Tone2 t + 1 | 0.014*** (2.88) | ||
This table documents the results using the Bootstrap test to self-sample for 1,000 times. Levels of significance are denoted by *(10%), **(5%), and ***(1%).
6 Robustness and Endogeneity Checks
6.1 Robustness Tests
In this section, I run a battery of tests to examine whether core evidence of baseline regression is robust to alternative measures. First, I use alternative measures of discretionary accruals (DAC1 and DAC2). Based on the previous studies (Dechow et al., 1995; Fang et al., 2016), I use the Jones model (Jones, 1991) instead of the modified Jones model to measure DAC. The model is as follows:
where all the variables are the same as model (1). DAC1 is defined as the regression residuals.
Furthermore, I employ dummy variables (DAC2) as an alternative measure, with DAC2 = 1 if DAC > 0 and DAC2 = 0 otherwise, to determine whether the abnormal media tone before the earnings announcement is caused by the direction of earnings management rather than its figures. Table 10 presents findings that align with Table 5, indicating that both DAC1 and DAC2 have positive and statistically significant coefficients.
Robustness check with alternative independent variable
| (1) | (2) | (3) | (4) | |
|---|---|---|---|---|
| Ab_Tone1 t + 1 | Ab_Tone2 t + 1 | Ab_Tone1 t + 1 | Ab_Tone2 t + 1 | |
| DAC1 t | 0.066** | 0.059*** | ||
| (2.40) | (2.87) | |||
| DAC2 t | 0.018*** | 0.013*** | ||
| (3.51) | (3.48) | |||
| SIZE t | 0.016*** | 0.009*** | 0.016*** | 0.009*** |
| (4.02) | (3.01) | (4.06) | (2.99) | |
| LEV t | −0.064*** | −0.054*** | −0.064*** | −0.054*** |
| (−4.77) | (−5.44) | (−4.78) | (−5.50) | |
| BM t | −0.074*** | −0.047*** | −0.074*** | −0.047*** |
| (−4.23) | (−3.67) | (−4.21) | (−3.62) | |
| AGE t | 0.001** | 0.001*** | 0.001** | 0.001*** |
| (2.22) | (2.67) | (2.23) | (2.69) | |
| SOE t | 0.016** | 0.098** | 0.016** | 0.008** |
| (2.60) | (2.31) | (2.56) | (2.28) | |
| ANLST t | 0.023*** | 0.018*** | 0.023*** | 0.018*** |
| (7.06) | (7.55) | (7.03) | (7.45) | |
| INS t | 0.002*** | 0.001*** | 0.002*** | 0.001*** |
| (5.16) | (4.21) | (5.19) | (4.23) | |
| ROA t | 0.062 | 0.033 | 0.062 | 0.032 |
| (1.42) | (1.16) | (1.44) | (1.14) | |
| EPS t | 0.006 | 0.005 | 0.005 | 0.005 |
| (1.32) | (1.60) | (1.30) | (1.59) | |
| MC t | −0.053*** | −0.038*** | −0.053*** | −0.038*** |
| (−13.29) | (−13.25) | (−13.30) | (−13.25) | |
| Intercept t | −0.071 | 0.015 | −0.080 | 0.007 |
| (−1.00) | (0.30) | (−1.15) | (0.14) | |
| Fixed Industry | YES | YES | YES | YES |
| Fixed Year | YES | YES | YES | YES |
| N | 34,644 | 34,644 | 34,644 | 34,644 |
| R 2 | 0.077 | 0.087 | 0.078 | 0.087 |
This table documents the results of using two alternative measures of earnings management. Figures in parentheses are t-statistics, which are based on standard errors adjusted for firm and time clustering (Petersen, 2009). Levels of significance are denoted by *(10%), **(5%), and ***(1%).
Second, I use alternative measures of media tone. Since the positive association between abnormal media tone and earnings management may also be affected by the intensity of the tone instead of the news volume, I use the intensity of the news tone as a weight to calculate the media tone of each firm. The details are as follows:
where Raw_Tone is the tone of the media report j on firm i, which equals one when the tone of the media report is positive, minus one when it is negative, and zero when it is neutral. Intensity i,j refers to the degree of news tone on news j for firm i. I measure it by the extent of news j concerning firm i. It equals three when firm i appears in the news j’s title, equals two when firm i appears more than 3 times in the news j’s text instead of the title, and one otherwise. N refers to the number of total-related news of firm i in the 30 days before annual report. The measurement of abnormal media tone is then based on the firm news tone in equation (9). Table 11 shows that the coefficients of DAC are positive and significant. This is consistent with Table 5.
Robustness check with alternative dependent variable
| (1) | (2) | |
|---|---|---|
| Ab_Tone3 t + 1 | Ab_Tone4 t + 1 | |
| DAC t | 0.007*** | 0.008*** |
| (2.72) | (2.80) | |
| SIZE t | −0.001 | −0.001* |
| (−1.50) | (1.89) | |
| LEV t | −0.001 | −0.000 |
| (−1.17) | (−0.09) | |
| BM t | −0.005*** | −0.005*** |
| (−3.54) | (−3.05) | |
| AGE t | 0.000*** | 0.000*** |
| (5.63) | (4.97) | |
| SOE t | 0.002*** | 0.001 |
| (3.19) | (1.22) | |
| ANLST t | 0.003*** | 0.002** |
| (8.00) | (5.10) | |
| INS t | 0.000*** | 0.000*** |
| (7.18) | (6.70) | |
| ROA t | 0.007 | 0.009** |
| (1.56) | (2.13) | |
| EPS t | 0.002*** | 0.002*** |
| (5.81) | (6.24) | |
| MC t | −0.001*** | −0.000 |
| (−3.06) | (−1.00) | |
| Intercept t | 0.047*** | 0.056*** |
| (8.55) | (8.79) | |
| Fixed Industry | YES | YES |
| Fixed Year | YES | YES |
| N | 34,644 | 34,644 |
| R 2 | 0.442 | 0.339 |
This table documents the analysis using alternative measures of media tone. Industry and year fixed effects (Industry and Year dummies) are included in the regression. Figures in parentheses are t-statistics, which are based on standard errors adjusted for firm and time clustering (Petersen, 2009). Levels of significance are denoted by *(10%), **(5%), and ***(1%).
In this article, I choose 30 days before the earnings announcement as the period to calculate abnormal media tone. To mitigate the potential problem of sample selection, I further choose 20, 40, and 60 days as alternative periods to check the robustness of our results. The results in Table 12 show that the coefficients of DAC remain significantly positive when different period is used to measure abnormal media tone.
Robustness check with alternative time windows
| 20 days | 40 days | 60 days | ||||
|---|---|---|---|---|---|---|
| (1) Ab_Tone1 t + 1 | (2) Ab_Tone2 t + 1 | (3) Ab_Tone1 t + 1 | (4) Ab_Tone2 t + 1 | (5) Ab_Tone1 t + 1 | (6) Ab_Tone2 t + 1 | |
| DAC t | 0.042* | 0.042** | 0.070*** | 0.071*** | 0.078*** | 0.077*** |
| (1.94) | (1.99) | (2.65) | (3.69) | (3.38) | (4.61) | |
| SIZE t | 0.009*** | 0.009*** | 0.018*** | 0.010** | 0.017*** | 0.009*** |
| (2.65) | (2.77) | (4.73) | (3.47) | (5.09) | (3.71) | |
| LEV t | −0.054*** | −0.054*** | −0.074*** | −0.059*** | −0.071*** | −0.058*** |
| (−5.22) | (−5.21) | (−5.80) | (−6.42) | (−6.35) | (−7.18) | |
| BM t | −0.042*** | −0.043*** | −0.076*** | −0.053*** | −0.087*** | −0.057*** |
| (−3.11) | (−3.19) | (−4.53) | (−4.29) | (−5.91) | (−5.34) | |
| AGE t | 0.001** | 0.001** | 0.001*** | 0.001*** | 0.002*** | 0.001*** |
| (1.94) | (2.13) | (2.69) | (2.71) | (3.62) | (4.14) | |
| SOE t | 0.009** | 0.010** | 0.018*** | 0.012*** | 0.022*** | 0.013*** |
| (2.32) | (2.44) | (3.62) | (3.35) | (4.77) | (4.25) | |
| ANLST t | 0.012*** | 0.012*** | 0.020*** | 0.015*** | 0.021*** | 0.015*** |
| (5.34) | (5.53) | (7.12) | (7.47) | (8.50) | (8.85) | |
| INS t | 0.001*** | 0.001*** | 0.002*** | 0.001*** | 0.002*** | 0.001*** |
| (4.69) | (4.65) | (5.31) | (4.32) | (5.28) | (4.34) | |
| ROA t | 0.035 | 0.032 | 0.097** | 0.050* | 0.087** | 0.050* |
| (1.13) | (0.97) | (2.29) | (1.69) | (2.38) | (1.91) | |
| EPS t | 0.005 | 0.005 | 0.006 | 0.005 | 0.011*** | 0.009*** |
| (1.42) | (1.40) | (1.40) | (1.60) | (2.81) | (3.09) | |
| MCt | −0.032*** | −0.031*** | −0.056*** | −0.038*** | −0.056*** | −0.039*** |
| (−10.87) | (−10.53) | (−14.59) | (−14.50) | (−16.92) | (−16.38) | |
| Intercept t | −0.024 | −0.013 | −0.110* | −0.011 | −0.090 | −0.004 |
| (−0.47) | (−0.26) | (−1.67) | (−0.24) | (−1.54) | (−0.10) | |
| Fixed Industry | YES | YES | YES | YES | YES | YES |
| Fixed Year | YES | YES | YES | YES | YES | YES |
| N | 34,644 | 34,644 | 34,644 | 34,644 | 34,644 | 34,644 |
| R-squared | 0.056 | 0.030 | 0.090 | 0.104 | 0.137 | 0.155 |
This table documents the effect of earnings management on abnormal media tone. We choose 20, 40 and 60 days before earnings announcement as alternative time windows. Industry and year fixed effects (Industry and Year dummies) are included in the regression. Figures in parentheses are t-statistics, which are based on standard errors adjusted for firm and time clustering (Petersen, 2009). Levels of significance are denoted by *(10%), **(5%), and ***(1%).
Additionally, to confirm the coverage of print and digital media, I performed independent computations and discovered that print media is more easily used by managers and more vulnerable to corporate control (Table 13). But I also found that certain types of exploitation are also applied to online media.
Robustness check with different kinds of media
| (1) | (2) | (3) | (4) | |
|---|---|---|---|---|
| Ab_Tone_P1 t + 1 | Ab_Tone_P2 t + 1 | Ab_Tone_N1 t + 1 | Ab_Tone_N2 t + 1 | |
| DAC t | 0.042*** | 0.039*** | 0.012** | 0.010** |
| (4.31) | (3.96) | (2.56) | (2.48) | |
| SIZE t | −0.002* | −0.003** | −0.001* | −0.001* |
| (−2.24) | (−2.55) | (−1.99) | (1.89) | |
| LEV t | −0.006 | −0.007 | −0.001 | −0.000 |
| (−1.67) | (−1.35) | (−1.27) | (−0.10) | |
| BM t | −0.004** | −0.005** | −0.005*** | −0.005*** |
| (−2.44) | (−2.31) | (−3.54) | (−3.05) | |
| AGE t | 0.000** | 0.000* | 0.000*** | 0.000*** |
| (2.24) | (1.87) | (5.63) | (4.97) | |
| SOE t | −0.003* | −0.001* | 0.002*** | 0.002*** |
| (−2.12) | (−2.16) | (3.19) | (3.22) | |
| ANLST t | 0.008*** | 0.005*** | 0.003*** | 0.002** |
| (5.77) | (6.70) | (8.00) | (5.10) | |
| INS t | 0.000*** | 0.000** | 0.000*** | 0.000*** |
| (3.21) | (2.43) | (7.18) | (6.70) | |
| ROA t | 0.037** | 0.072*** | 0.007 | 0.009** |
| (2.13) | (3.51) | (1.56) | (2.13) | |
| EPS t | 0.009*** | 0.011*** | 0.002*** | 0.002*** |
| (5.47) | (5.52) | (5.81) | (6.24) | |
| MC t | −0.005*** | −0.009*** | −0.001*** | −0.000 |
| (−3.60) | (−5.13) | (−3.06) | (−1.00) | |
| Intercept t | −0.028 | 0.042 | 0.047*** | 0.056*** |
| (−1.12) | (1.36) | (8.55) | (8.79) | |
| Fixed Industry | YES | YES | YES | YES |
| Fixed Year | YES | YES | YES | YES |
| N | 34,644 | 34,644 | 34,644 | 34,644 |
| R 2 | 0.084 | 0.048 | 0.442 | 0.339 |
This table documents the analysis using two kinds of media: paper media and net media. Industry and year fixed effects (Industry and Year dummies) are included in the regression. Figures in parentheses are t-statistics, which are based on standard errors adjusted for firm and time clustering (Petersen, 2009). Levels of significance are denoted by *(10%), **(5%), and ***(1%).
Finally, as a rigorous check, I also control for the province-fixed effects to lessen the possible issue of the missing variable. I are unable to adjust for firm effect in our test since our sample is an unbalanced panel with some firms having only 1-year observations. Rather, to remove the geographic effect, I incorporate province-fixed factors into our model. Using the province-fixed effect in the regression does not appear to have any discernible effect in Table 14.
Robustness check with province-fixed effects
| (1) | (2) | |
|---|---|---|
| Ab_Tone1 t + 1 | Ab_Tone2 t + 1 | |
| DAC t | 0.076*** | 0.066*** |
| (2.89) | (3.32) | |
| SIZE t | 0.013*** | 0.006* |
| (3.00) | (1.94) | |
| LEV t | −0.054*** | −0.043*** |
| (−4.09) | (−4.66) | |
| BM t | −0.056*** | −0.033*** |
| (−3.25) | (−2.69) | |
| AGE t | 0.001*** | 0.001*** |
| (2.77) | (3.23) | |
| SOE t | 0.015** | 0.010** |
| (2.26) | (2.00) | |
| ANLST t | 0.024*** | 0.018*** |
| (7.25) | (7.58) | |
| INS t | 0.002*** | 0.001*** |
| (5.44) | (4.49) | |
| ROA t | 0.079* | 0.046 |
| (1.78) | (1.41) | |
| EPS t | 0.007 | 0.006 |
| (1.21) | (1.60) | |
| MC t | −0.052*** | −0.038*** |
| (−12.00) | (−12.18) | |
| Intercept t | −0.008 | 0.061 |
| (−0.14) | (1.19) | |
| Fixed Province | YES | YES |
| Fixed Industry | YES | YES |
| Fixed Year | YES | YES |
| N | 34,644 | 34,644 |
| R-squared | 0.097 | 0.096 |
This table shows the Robustness check with province-fixed effects. Province, Industry, and Year refer to province, industry, and year fixed effects, respectively. Figures in parentheses are t-statistics, which are based on standard errors adjusted for firm and time clustering (Petersen, 2009). Levels of significance are denoted by *(10%), **(5%), and ***(1%).
6.2 Endogeneity Correction
Our analysis may not be affected by the possible reverse causality problem because the financial media may not abruptly alter the tone of their report just before the earnings announcement. Nonetheless, unobservable heterogeneity that unobservable firm-specific factors impact both abnormal media tone and DAC continues to raise endogeneity problems. To address these endogeneity issues, I therefore use the instrumental variables approach.
The instrumental variable (DAC_Industry) is the average DAC of other businesses in the same industry. The reasoning for this is that businesses operating in the same sector always have comparable operational risk, investment opportunity, and company breadth. If a company’s earnings management level is on average higher than that of its competitors in the industry, this could indicate the existence of an industry norm. In this instance, the target firm’s degree of profit management likewise tends to rise. Since the industry average DAC is unlikely to be influenced by firm characteristics and is difficult to logically correlate with the abnormal media tone of a particular firm within the industry, it might be considered an exogenous variable.
The outcomes of the instrumental variables approach using the two-stage least squares method (2SLS) are displayed in Table 15. At the 0.01 level, the coefficients linked to the instrumented variable (DAC_industry) are statistically significant and positive. At the 0.01 level of significance, the F-statistics for the combined significance of the instruments are noteworthy. Our instrumented variable is a strong instrument, according to the results.
Endogeneity by instrumental variables
| (1) | (2) | (3) | |
|---|---|---|---|
| DAC t | Ab_Tone1 t + 1 | Ab_Tone2 t + 1 | |
| DAC_Industry t | 0.983*** | ||
| (17.99) | |||
| DAC t | 0.076*** | 0.066*** | |
| (2.71) | (3.23) | ||
| SIZE t | 0.001 | 0.016*** | 0.009*** |
| (0.38) | (4.05) | (2.93) | |
| LEV t | −0.023*** | −0.066*** | −0.055*** |
| (−4.87) | (−4.89) | (−5.61) | |
| BM t | 0.046 | −0.072*** | −0.045*** |
| (0.83) | (−4.20) | (−3.60) | |
| AGE t | −0.001*** | 0.001** | 0.001** |
| (−4.67) | (2.00) | (2.40) | |
| SOE t | −0.009*** | 0.016** | 0.018** |
| (−4.19) | (2.58) | (2.24) | |
| ANLST t | 0.003** | 0.023*** | 0.016*** |
| (2.41) | (7.25) | (7.69) | |
| INS t | −0.000 | 0.002*** | 0.001*** |
| (−0.15) | (5.10) | (4.15) | |
| ROA t | −0.097*** | 0.056 | 0.030 |
| (−6.33) | (1.15) | (0.78) | |
| EPS t | 0.018*** | 0.008 | 0.007* |
| (11.05) | (1.61) | (1.91) | |
| MC t | −0.001 | −0.055*** | −0.040*** |
| (−0.23) | (−13.27) | (−13.21) | |
| Intercept t | 0.007 | −0.071 | 0.016 |
| (0.30) | (−1.04) | (0.32) | |
| Fixed Industry | YES | YES | YES |
| Fixed Year | YES | YES | YES |
| N | 34,644 | 34,644 | 34,644 |
| R-squared | 0.058 | 0.080 | 0.089 |
| F-statistics for the joint significance of the instruments | 561.17*** | 546.84*** | |
This table shows the results that using two-stage least square method (2SLS). Specifically, DAC_Industry is the average of industry of the earnings management. Columns (1) is the result of the first stages and columns (2) and (3) are the results of the second. Industry and year fixed effects (Industry and Year dummies) are included in the regression. Figures in parentheses are t-statistics, which are based on standard errors adjusted for firm and time clustering (Petersen, 2009). Levels of significance are denoted by *(10%), **(5%), and ***(1%).
I take into consideration whether the abnormal media tone before to the earnings announcement and the earnings management relationship is caused by the analyst report before the earnings announcement, even if I utilize the instrumental variable technique to prevent the endogeneity produced by variable omission. The media’s perception of a company’s results is sometimes influenced by the analyst predictions included in analyst reports. Meanwhile, media tone may also effect analyst forecasts before the earnings announcement. The sample that includes analyst predictions within 30 days of the earnings announcement is painstakingly gathered by us. Next, I incorporate as a control variable in our baseline model the average analyst forecast (ANLST_average) for a certain firm over the course of 30 days. As an additional proxy for analyst forecast, I also provide the difference (ΔANLST_average) between the firm’s EPS from the prior year and the analyst prediction. There is no discernible difference in the outcomes when analyst prediction is incorporated into the regression, as seen in Table 16.
Endogeneity by analyst expectations
| (1) | (2) | (3) | (4) | |
|---|---|---|---|---|
| Ab_Tone1 t + 1 | Ab_Tone2 t + 1 | Ab_Tone1 t + 1 | Ab_Tone2 t + 1 | |
| DAC t | 0.073*** | 0.062*** | 0.072** | 0.062*** |
| (2.63) | (3.10) | (2.62) | (3.10) | |
| ANLST_average t | 0.008 | −0.002 | ||
| (1.02) | (−0.50) | |||
| ΔANLST_average t | 0.001 | −0.009 | ||
| (0.14) | (−0.87) | |||
| SIZE t | 0.016*** | 0.009*** | 0.016*** | 0.009*** |
| (3.97) | (2.85) | (4.01) | (2.84) | |
| LEV t | −0.065*** | −0.054*** | −0.064*** | −0.053*** |
| (−4.81) | (−5.46) | (−4.79) | (−5.44) | |
| BM t | −0.072*** | −0.045*** | −0.073*** | −0.045*** |
| (−4.12) | (−3.61) | (−4.17) | (−3.62) | |
| AGE t | 0.001** | 0.001*** | 0.001** | 0.001*** |
| (2.31) | (2.63) | (2.20) | (2.68) | |
| SOE t | 0.016** | 0.011** | 0.016** | 0.011** |
| (2.57) | (2.27) | (2.58) | (2.27) | |
| ANLST t | 0.023*** | 0.018*** | 0.023*** | 0.018*** |
| (7.14) | (7.56) | (7.15) | (7.48) | |
| INS t | 0.002*** | 0.001*** | 0.002*** | 0.001*** |
| (5.05) | (4.23) | (5.14) | (4.22) | |
| ROA t | 0.064 | 0.037 | 0.065 | 0.036 |
| (1.39) | (1.08) | (1.41) | (1.07) | |
| EPS t | 0.005 | 0.007* | 0.007 | 0.007* |
| (0.89) | (1.67) | (1.27) | (1.73) | |
| MC t | −0.055*** | −0.040*** | −0.055*** | −0.040*** |
| (−13.37) | (−13.27) | (−13.34) | (−13.28) | |
| Intercept t | 0.078 | 0.014 | −0.068 | 0.014 |
| (1.15) | (0.31) | (−1.01) | (0.31) | |
| Fixed Industry | YES | YES | YES | YES |
| Fixed Year | YES | YES | YES | YES |
| N | 34,644 | 34,644 | 34,644 | 34,644 |
| R 2 | 0.080 | 0.089 | 0.080 | 0.089 |
This table documents the effect of earnings management on abnormal media tone after controlling analyst expectations. ΔANLST_average equals the average of analyst expectations of company i in 30 days before the earnings announcement of year t minus actual EPS in year t – 1. The dependent variable for columns (1) and (3) are Ab_Tone1 t + 1 and Ab_Tone2 t + 1 are for columns (2) and (4). Industry and Fixed Years (Industry and Year dummies) are included in the regression. Figures in parentheses are t-statistics, which are based on standard errors adjusted for firm and time clustering (Petersen, 2009). Levels of significance are denoted by *(10%), **(5%), and ***(1%).
7 Conclusion
Two distinct functions of the media are documented in prior research on the relationship between earnings management and the media. One is that the media acts as a kind of external governance that lessens the management of earnings. Another is that the media influences how businesses disclose their profits. In other words, businesses control their profits to meet media demands. In this study, I aim to present a third function for the media in earnings management: as an additional channel for managers to further enhance the benefits of earnings management. I investigated experimentally the relationship between the abnormal media tone before the earnings announcement release and the earnings management that occurred in the year preceding the annual report. There is evidence that the media’s unusually upbeat tone just before the earnings announcement is linked to increased degrees of profit management. The results support the instrumental hypothesis of the media, which holds that the media press is a tool used by company management to impact stock prices and aid in the achievement of earnings management. This is because it is improbable that the media would abruptly shift its slant and allow the company to respond.
More specifically, this article uses media reports collected from the CNRDS database. I determine the abnormal media tone of each company in the 30 days leading up to its earnings announcement by calculating its DAC. The results show a strong positive correlation between the abnormal media tone and the company’s level of earnings management. This article also investigates the possible impact of managers’ media experiences, insider sales, and other external corporate monitors on the relationships between abnormal media tone and earnings management. According to the data, the relationship is stronger for companies whose managers sell their ownership in the next period, for managers who have previously worked in the media, and for corporations with fewer institutional holdings, less analyst coverage, and a worse reputation for audit firms. These results support our theory on the media’s supplemental role in profit management.
This study outlines the dual functions that the media plays and offers insightful information about the relationships between media and earnings management. In research, I handle aberrant tone as a dependent variable. As research on textual and technical innovations grows, I am also able to explore and analyze textual information’s distinct content elements in greater detail.
While research has shown that both media tone and earnings management can affect stock prices in the near term, this article is the first to reunite the two, usually separate, subsets of the literature to demonstrate the joint use of the two strategies before the earnings announcement. Our research adds to the body of knowledge on media spin by demonstrating how corporations can sway the opinions of the media, in addition to suggesting a new role for the media in earnings management. Based on this article, considering the continuous development of text analysis and machine learning methods, future research could further focus on the manipulative behavior of managers on text similarity, text content topic, etc., and examine its influencing factors and economic consequences.
-
Funding information: The author states no funding involved.
-
Author contribution: Huan Wang was responsible for all of the data organization, writing, and revising of this article.
-
Conflict of interest: The author states no conflict of interest.
-
Data availability statement: All data generated or analyzed during this study are included in this published article.
-
Article note: As part of the open assessment, reviews and the original submission are available as supplementary files on our website.
Variable definitions
| Variable | Definitions |
|---|---|
| DAC | The regression residual is calculated by modified Jones model |
| Ab_Tone1 | The difference between the news tone of report j of firm i during the 30 days and the average media tone of the other companies in the same industry in 30 days before the earnings announcement |
| Ab_Tone2 | The difference between the news tone of report j of firm i during the 30 days and the average media tone during the period between last earnings announcement and 30 days before this earnings announcement |
| REDUC | REDUC = 1 if the CEO reduces his equity in the 180 days after the earnings announcement and REDUC = 0 otherwise |
| MEDIA | MEDIA = 1 if managers of the company have worked or studied in the media industry and if not, MEDIA = 0 |
| AUDIT | The indicator variable for audit firms, equals 1 if the audit firm belongs to the top 4 audit firms and zero otherwise |
| ANLST_average | The average of analyst expectations of company i in 30 days before the earnings announcement of year t |
| ΔANLST_average | The difference between analyst prediction and the firm’s EPS of the previous year |
| Forecast | If the performance forecasts are “big increase,” “slight increase,” “turn loss into profit,” or “continued profit,” Forecast = 1; and Forecast = 0 otherwise |
| Earnings | Earnings equal to the difference between EPS in preliminary earnings estimate in year t and the actual EPS in year t – 1 |
| SIZE | The natural logarithm of the book value of total assets at the end of the fiscal year |
| LEV | Firm financial LEV, calculated as total liabilities divided by total assets |
| BM | The market-to-book ratio |
| AGE | The natural logarithm of the years after IPO |
| SOE | The indicator variable for executive ownership, equals 1 if the company is owned by state and zero otherwise |
| ANLST | The natural logarithm of one plus the number of firm’s followed analysts |
| INS | The proportion of INS in total shares |
| ROA | Return on assets measured at the end of fiscal year t |
| EPS | The ratio of profit after tax to total equity |
| MC | The natural logarithm of media attention plus 1 |
| DAC1 | The regression residual is calculated by modified Jones model |
| DAC2 | DAC2 = 1 if DAC > 0 and DAC2 = 0 otherwise |
| Ab_Tone3 | The news tone is calculated by equation (9) in which I use the intensity of the news tone as weights. The measurement of abnormal media tone is calculated by equation (3) |
| Ab_Tone4 | The news tone is calculated by equation (9) in which I use the intensity of news tone as weights. The measurement of abnormal media tone is calculated by equation (4) |
References
Ahern, K. R., & Sosyura, D. S. (2014). Who writes the news? Corporate press releases during merger negotiations. The Journal of Finance, 69(1), 241–291.10.1111/jofi.12109Suche in Google Scholar
Barber, B. M., & Odean, T. (2008). All that glitters: The effect of attention and news on the buying behavior of individual and institutional investors. Review of Financial Studies, 21(2), 785–818.10.1093/rfs/hhm079Suche in Google Scholar
Bar-Gill, O., & Bebchuk, L. A. (2003). Misreporting corporate performance. Working paper. Harvard University.10.2139/ssrn.354141Suche in Google Scholar
Baron, R. M., & Kenny, D. A. (1986). The moderator-mediator variable distinction in social psychological research: Conceptual, strategic, and statistical considerations. Journal of Personality and Social Psychology, 51(6), 1173–1182.10.1037//0022-3514.51.6.1173Suche in Google Scholar
Beneish, M. D. (1997). Detecting GAAP violation: Implications for assessing earnings management among firms with extreme financial performance. Journal of Accounting and Public Policy, 16(3), 271–309.10.1016/S0278-4254(97)00023-9Suche in Google Scholar
Bergstresser, D., & Philippon, T. (2006). CEO incentives and earnings management. Journal of Financial Economics, 80(3), 511–529.10.1016/j.jfineco.2004.10.011Suche in Google Scholar
Bertomeu, J., & Marinovic, I. (2016). A theory of hard and soft information. The Accounting Review, 91(1), 1–20.10.2308/accr-51102Suche in Google Scholar
Brown L. (2001). A temporal analysis of earnings surprises: Profits versus losses. Journal of Accounting Research, 39(2), 221–241.10.1111/1475-679X.00010Suche in Google Scholar
Burgstahler, D., & Dichev, I. (1997). Earnings management to avoid earnings decreases and losses. Journal of Accounting and Economics, 24(1), 99–126.10.1016/S0165-4101(97)00017-7Suche in Google Scholar
Cahan, S. F., Chen, C., Chen, L., & Nguyen, N. H. (2015). Corporate social responsibility and media coverage. Journal of Banking and Finance, 59(10), 409–422.10.1016/j.jbankfin.2015.07.004Suche in Google Scholar
Chahine, S., Mansi, S., & Mazboudi, M. (2015). Media news and earnings management prior to equity offerings. Journal of Corporate Finance, 35, 177–195.10.1016/j.jcorpfin.2015.09.002Suche in Google Scholar
Chen, K. C. W., & Yuan, H. Q. (2004). Earnings management and capital resource allocation: Evidence from China’s accounting-based regulation of rights issues. The Accounting Review, 79(3), 645–665.10.2308/accr.2004.79.3.645Suche in Google Scholar
Chen, X., Lee, C. W. J., & Li, J. (2008). Government assisted earnings management in China. Journal of Accounting and Public Policy, 27(3), 262–274.10.1016/j.jaccpubpol.2008.02.005Suche in Google Scholar
Chen, Y., Cheng, C. A., Li, S., & Zhao, J. (2018). The monitoring role of the media: Evidence from earnings management. Social Science Electronic Publishing.10.2139/ssrn.2938955Suche in Google Scholar
Cheng, Q., & Warfield, T. D. (2005). Equity incentives and earnings management. The Accounting Review, 80(2), 441–476.10.2308/accr.2005.80.2.441Suche in Google Scholar
Chung, R., Firth, M., & Kim, J. (2002). Institutional monitoring and opportunistic earnings management. Journal of Corporate Finance, 8(1), 29–48.10.1016/S0929-1199(01)00039-6Suche in Google Scholar
Cook, D. O., Kieschnick, R. L., & Van Ness, R. A. (2006). On the marketing of IPOs. Journal of Financial Economics, 82(1), 35–61.10.1016/j.jfineco.2005.08.005Suche in Google Scholar
Cornett, M. M., Marcus, A. J., & Tehranian, H. (2008). Corporate governance and pay-for-performance: The impact of earnings management. Journal of Financial Economics, 87(2), 357–373.10.1016/j.jfineco.2007.03.003Suche in Google Scholar
DeAngelo, L. E. (1988). Managerial competition, information costs, and corporate governance: The use of accounting performance measures in proxy contests. Journal of Accounting and Economics, 10(1), 3–36.10.1016/0165-4101(88)90021-3Suche in Google Scholar
Dechow, P. M., Sloan, R. G., & Sweeney, A. P. (1995). Detecting earnings management. The Accounting Review, 70(2), 193–225.Suche in Google Scholar
DeFond, M. L., & Jiambalvo, J. (1991). Incidence and circumstances of accounting errors. The Accounting Review, 66(3), 643–655.Suche in Google Scholar
Ducharme, L. L., Malatesta, P. H., & Sefcik, S. E. (2004). Earnings management, stock issues, and shareholder lawsuits. Journal of Financial Economics, 71(1), 27–49.10.1016/S0304-405X(03)00182-XSuche in Google Scholar
Dyck, A., Morse, A., & Zingales, L. (2010). Who blows the whistle on corporate fraud? The Journal of Finance, 65(6), 2213–2253.10.1111/j.1540-6261.2010.01614.xSuche in Google Scholar
Dyck, A., Volchkova, N., & Zingales, L. (2008). The corporate governance role of the media: Evidence from Russia. Journal of Finance, 63(3), 1093–1135.10.1111/j.1540-6261.2008.01353.xSuche in Google Scholar
Edmans, A., Goncalves-Pinto, L., Wang, Y., & Groen-Xu, M. (2018). Strategic news releases in equity vesting months. The Review of Financial Studies, 31(11), 4099–4141.10.1093/rfs/hhy070Suche in Google Scholar
Elitzur, R. R., & Yaari, V. (2004). Executive incentive compensation and earnings manipulation in a multi-period setting. Journal of Economic Behavior & Organization, 26(2), 201–219.10.1016/0167-2681(94)00019-BSuche in Google Scholar
Ellman, M., & Germano, F. (2009). What do the papers sell? A model of advertising and media bias. The Economic Journal, 119(537), 680–704.10.1111/j.1468-0297.2009.02218.xSuche in Google Scholar
Fang, L. H., & Peress, J. (2009). Media coverage and the cross‐section of stock returns. Journal of Finance, 64(5), 2023–2052.10.1111/j.1540-6261.2009.01493.xSuche in Google Scholar
Fang, V. W., Huang, A. H., & Karpoff, J. M. (2016). Short selling and earnings management: A controlled experiment. Journal of Finance, 71(3), 1251–1294.10.1111/jofi.12369Suche in Google Scholar
Gurun, U. G. (2015). Price of publicity. SSRN Electronic Journal.Suche in Google Scholar
Gurun, U. G., & Butler, A. W. (2012). Don’t believe the hype: Local media slant, local advertising, and firm value. The Journal of Finance, 67(2), 561–598.10.1111/j.1540-6261.2012.01725.xSuche in Google Scholar
Healy, P. M., & Palepu, K. G. (2001). Information asymmetry, corporate disclosure, and the capital markets: A review of the empirical disclosure literature. Journal of Accounting and Economics, 31(1–3), 405–440.10.1016/S0165-4101(01)00018-0Suche in Google Scholar
Healy, P. M., & Wahlen, J. M. (1999). A review of the earnings management literature and its implications for standard setting. Accounting Horizons, 13(4), 365–383.10.2308/acch.1999.13.4.365Suche in Google Scholar
Jiang, J., Petroni, K. R., & Wang, I. Y. (2010). CFOs and CEOs: Who have the most influence on earnings management?. Journal of Financial Economics, 96(3), 513–526.10.1016/j.jfineco.2010.02.007Suche in Google Scholar
Jones, J. J. (1991). Earnings management during import relief investigations. Journal of Accounting Research, 29, 193–228.10.2307/2491047Suche in Google Scholar
Klein A. (2002). Audit committee, board of director characteristics, and earnings management. Journal of Accounting and Economics, 33(3), 375–400.10.1016/S0165-4101(02)00059-9Suche in Google Scholar
Li, Q., Wang, J. M., & Bao, L. (2019). Media tone, bias, and stock price crash risk: Evidence from China. Asia-pacific Journal of Accounting & Economics, 29(1), 1–35.10.1080/16081625.2019.1654396Suche in Google Scholar
Louis, H. (2004). Earnings management and the market performance of acquiring firms. Journal of Financial Economics, 74, 121–148.10.1016/j.jfineco.2003.08.004Suche in Google Scholar
McCombs, M. E., & Shaw, D. L. (1972). The agenda-setting function of mass media. The Public Opinion Quarterly, 36(2), 176–187.10.1086/267990Suche in Google Scholar
Miller, G. S. (2006). The press as a watchdog for accounting fraud. Journal of Accounting Research, 44(5), 1001–1033.10.1111/j.1475-679X.2006.00224.xSuche in Google Scholar
Mitra, S., & Cready, W. M. (2005). Institutional stock ownership, accrual management, and information environment. Journal of Accounting, Auditing & Finance, 20(3), 257–286.10.1177/0148558X0502000304Suche in Google Scholar
Nelson, C. L., & Ijiri, Y. (1976). Theory of accounting measurement. Journal of Finance, 31(5), 1539–1540.10.2307/2326710Suche in Google Scholar
Park, M. S., & Park, T. (2004). Insider sales and earnings management. Journal of Accounting & Public Policy, 23(5), 381–411.10.1016/j.jaccpubpol.2004.07.003Suche in Google Scholar
Petersen, M. A. (2009). Estimating standard errors in finance panel data sets: Comparing approaches. The Review of Financial Studies, 22(1), 435–480.10.1093/rfs/hhn053Suche in Google Scholar
Qi, B., Yang, R., & Tian, G. (2014). Can media deter management from manipulating earnings? Evidence from China. Review of Quantitative Finance & Accounting, 42(3), 571–597.10.1007/s11156-013-0353-0Suche in Google Scholar
Rangan, S. (1998). Earnings management and the performance of seasoned equity offerings. Journal of Financial Economics, 50(1), 101–122.10.1016/S0304-405X(98)00033-6Suche in Google Scholar
Reuter, J., & Zitzewitz, E. (2006). Do ads influence editors? Advertising and bias in the financial media. The Quarterly Journal of Economics, 121(1), 197–227.10.1162/qjec.2006.121.1.197Suche in Google Scholar
Schipper, K. (1989). Commentary on earnings management. Accounting Horizons, 3(4), 91–102.Suche in Google Scholar
Sobel, M. E. (1982). Asymptotic confidence intervals for indirect effects in structural equation models. Sociological Methodology, 13, 290–312.10.2307/270723Suche in Google Scholar
Solomon, D. H. (2012). Selective publicity and stock prices. The Journal of Finance, 67(2), 599–638.10.1111/j.1540-6261.2012.01726.xSuche in Google Scholar
Stein, J. C. (1989). Efficient capital markets, inefficient firms: A model of myopic corporate behavior. Quarterly Journal of Economics, 104(4), 655–669.10.2307/2937861Suche in Google Scholar
Teoh, S., Welch, I., & Wong, T. (1998a). Earnings management and the long-run market performance of initial public offerings. Journal of Finance, 53(6), 1935–1974.10.1111/0022-1082.00079Suche in Google Scholar
Teoh, S., Welch, I., & Wong, T. (1998b). Earnings management and the underperformance of seasoned equity offering. Journal of Financial Economics, 50(1), 63–99.Suche in Google Scholar
Trueman, B. (1990). Theories of earnings announcement timing. Journal of Accounting and Economics, 13(3), 285–301.10.1016/0165-4101(90)90035-3Suche in Google Scholar
Velury, U., & Jenkins, D. S. (2006). Institutional ownership and the quality of earnings. Journal of Business Research, 59(9), 1043–1051.10.1016/j.jbusres.2006.05.001Suche in Google Scholar
Wang, J., Li, Q., Lai, C., & Song, V. (2024). Corporate fraud, political connections, and media bias: Evidence from China. Bulletin of Economic Research, 76(2), 319–353.10.1111/boer.12423Suche in Google Scholar
Watts, R., & Zimmerman, J. (1990). Positive accounting theory: A ten-year perspective. The Accounting Review, 65(1), 131–156.Suche in Google Scholar
© 2024 the author(s), published by De Gruyter
This work is licensed under the Creative Commons Attribution 4.0 International License.
Artikel in diesem Heft
- Regular Articles
- Political Turnover and Public Health Provision in Brazilian Municipalities
- Examining the Effects of Trade Liberalisation Using a Gravity Model Approach
- Operating Efficiency in the Capital-Intensive Semiconductor Industry: A Nonparametric Frontier Approach
- Does Health Insurance Boost Subjective Well-being? Examining the Link in China through a National Survey
- An Intelligent Approach for Predicting Stock Market Movements in Emerging Markets Using Optimized Technical Indicators and Neural Networks
- Analysis of the Effect of Digital Financial Inclusion in Promoting Inclusive Growth: Mechanism and Statistical Verification
- Effective Tax Rates and Firm Size under Turnover Tax: Evidence from a Natural Experiment on SMEs
- Re-investigating the Impact of Economic Growth, Energy Consumption, Financial Development, Institutional Quality, and Globalization on Environmental Degradation in OECD Countries
- A Compliance Return Method to Evaluate Different Approaches to Implementing Regulations: The Example of Food Hygiene Standards
- Panel Technical Efficiency of Korean Companies in the Energy Sector based on Digital Capabilities
- Time-varying Investment Dynamics in the USA
- Preferences, Institutions, and Policy Makers: The Case of the New Institutionalization of Science, Technology, and Innovation Governance in Colombia
- The Impact of Geographic Factors on Credit Risk: A Study of Chinese Commercial Banks
- The Heterogeneous Effect and Transmission Paths of Air Pollution on Housing Prices: Evidence from 30 Large- and Medium-Sized Cities in China
- Analysis of Demographic Variables Affecting Digital Citizenship in Turkey
- Green Finance, Environmental Regulations, and Green Technologies in China: Implications for Achieving Green Economic Recovery
- Coupled and Coordinated Development of Economic Growth and Green Sustainability in a Manufacturing Enterprise under the Context of Dual Carbon Goals: Carbon Peaking and Carbon Neutrality
- Revealing the New Nexus in Urban Unemployment Dynamics: The Relationship between Institutional Variables and Long-Term Unemployment in Colombia
- The Roles of the Terms of Trade and the Real Exchange Rate in the Current Account Balance
- Cleaner Production: Analysis of the Role and Path of Green Finance in Controlling Agricultural Nonpoint Source Pollution
- The Research on the Impact of Regional Trade Network Relationships on Value Chain Resilience in China’s Service Industry
- Social Support and Suicidal Ideation among Children of Cross-Border Married Couples
- Asymmetrical Monetary Relations and Involuntary Unemployment in a General Equilibrium Model
- Job Crafting among Airport Security: The Role of Organizational Support, Work Engagement and Social Courage
- Does the Adjustment of Industrial Structure Restrain the Income Gap between Urban and Rural Areas
- Optimizing Emergency Logistics Centre Locations: A Multi-Objective Robust Model
- Geopolitical Risks and Stock Market Volatility in the SAARC Region
- Trade Globalization, Overseas Investment, and Tax Revenue Growth in Sub-Saharan Africa
- Can Government Expenditure Improve the Efficiency of Institutional Elderly-Care Service? – Take Wuhan as an Example
- Media Tone and Earnings Management before the Earnings Announcement: Evidence from China
- Review Articles
- Economic Growth in the Age of Ubiquitous Threats: How Global Risks are Reshaping Growth Theory
- Efficiency Measurement in Healthcare: The Foundations, Variables, and Models – A Narrative Literature Review
- Rethinking the Theoretical Foundation of Economics I: The Multilevel Paradigm
- Financial Literacy as Part of Empowerment Education for Later Life: A Spectrum of Perspectives, Challenges and Implications for Individuals, Educators and Policymakers in the Modern Digital Economy
- Special Issue: Economic Implications of Management and Entrepreneurship - Part II
- Ethnic Entrepreneurship: A Qualitative Study on Entrepreneurial Tendency of Meskhetian Turks Living in the USA in the Context of the Interactive Model
- Bridging Brand Parity with Insights Regarding Consumer Behavior
- The Effect of Green Human Resources Management Practices on Corporate Sustainability from the Perspective of Employees
- Special Issue: Shapes of Performance Evaluation in Economics and Management Decision - Part II
- High-Quality Development of Sports Competition Performance Industry in Chengdu-Chongqing Region Based on Performance Evaluation Theory
- Analysis of Multi-Factor Dynamic Coupling and Government Intervention Level for Urbanization in China: Evidence from the Yangtze River Economic Belt
- The Impact of Environmental Regulation on Technological Innovation of Enterprises: Based on Empirical Evidences of the Implementation of Pollution Charges in China
- Environmental Social Responsibility, Local Environmental Protection Strategy, and Corporate Financial Performance – Empirical Evidence from Heavy Pollution Industry
- The Relationship Between Stock Performance and Money Supply Based on VAR Model in the Context of E-commerce
- A Novel Approach for the Assessment of Logistics Performance Index of EU Countries
- The Decision Behaviour Evaluation of Interrelationships among Personality, Transformational Leadership, Leadership Self-Efficacy, and Commitment for E-Commerce Administrative Managers
- Role of Cultural Factors on Entrepreneurship Across the Diverse Economic Stages: Insights from GEM and GLOBE Data
- Performance Evaluation of Economic Relocation Effect for Environmental Non-Governmental Organizations: Evidence from China
- Functional Analysis of English Carriers and Related Resources of Cultural Communication in Internet Media
- The Influences of Multi-Level Environmental Regulations on Firm Performance in China
- Exploring the Ethnic Cultural Integration Path of Immigrant Communities Based on Ethnic Inter-Embedding
- Analysis of a New Model of Economic Growth in Renewable Energy for Green Computing
- An Empirical Examination of Aging’s Ramifications on Large-scale Agriculture: China’s Perspective
- The Impact of Firm Digital Transformation on Environmental, Social, and Governance Performance: Evidence from China
- Accounting Comparability and Labor Productivity: Evidence from China’s A-Share Listed Firms
- An Empirical Study on the Impact of Tariff Reduction on China’s Textile Industry under the Background of RCEP
- Top Executives’ Overseas Background on Corporate Green Innovation Output: The Mediating Role of Risk Preference
- Neutrosophic Inventory Management: A Cost-Effective Approach
- Mechanism Analysis and Response of Digital Financial Inclusion to Labor Economy based on ANN and Contribution Analysis
- Asset Pricing and Portfolio Investment Management Using Machine Learning: Research Trend Analysis Using Scientometrics
- User-centric Smart City Services for People with Disabilities and the Elderly: A UN SDG Framework Approach
- Research on the Problems and Institutional Optimization Strategies of Rural Collective Economic Organization Governance
- The Impact of the Global Minimum Tax Reform on China and Its Countermeasures
- Sustainable Development of Low-Carbon Supply Chain Economy based on the Internet of Things and Environmental Responsibility
- Measurement of Higher Education Competitiveness Level and Regional Disparities in China from the Perspective of Sustainable Development
- Payment Clearing and Regional Economy Development Based on Panel Data of Sichuan Province
- Coordinated Regional Economic Development: A Study of the Relationship Between Regional Policies and Business Performance
- A Novel Perspective on Prioritizing Investment Projects under Future Uncertainty: Integrating Robustness Analysis with the Net Present Value Model
- Research on Measurement of Manufacturing Industry Chain Resilience Based on Index Contribution Model Driven by Digital Economy
- Special Issue: AEEFI 2023
- Portfolio Allocation, Risk Aversion, and Digital Literacy Among the European Elderly
- Exploring the Heterogeneous Impact of Trade Agreements on Trade: Depth Matters
- Import, Productivity, and Export Performances
- Government Expenditure, Education, and Productivity in the European Union: Effects on Economic Growth
- Replication Study
- Carbon Taxes and CO2 Emissions: A Replication of Andersson (American Economic Journal: Economic Policy, 2019)