Optimizing Emergency Logistics Centre Locations: A Multi-Objective Robust Model
-
Quan Gan


Abstract
This article is concerned with emergency material relief in response to major emergencies, concentrating on the difficulties in locating emergency logistics facilities and deploying emergency supplies. Using discrete scenarios, we describe the uncertainty of the demand for emergency supplies at the catastrophe site and the uncertainty of the cost and timing of the shipment of such supplies. Meanwhile, we consider two key objectives, i.e. emergency relief cost and time, and build a multi-objective emergency logistics centre siting model, including deterministic and robust optimization models. In the construction of the siting model, due to the time urgency of emergency logistics, we adopt a bi-objective function, including transportation and transportation time, and consider the construction and inventory costs of the emergency logistics centre. We also introduced a generalized hybrid frog-hopping algorithm to encode facilities that provide emergency material relief services. To verify the effectiveness of the models and algorithms, we designed a multi-scenario simulation experiment, and the results show that the two models and algorithms we propose have good feasibility and effectiveness. The robust optimization model performs well in handling various uncertainties.
1 Introduction
In real life, all kinds of natural disasters, artificial disasters and other significant emergencies have occurred repeatedly, causing severe disruptions to the social order and leading to massive casualties and economic losses (Maharjan & Hanaoka, 2020). Therefore, the research and management of disaster emergency response and disaster emergency response system engineering have significant value and significance. When significant emergencies, especially disasters, occur suddenly, the emergency response system must be activated quickly to provide sufficient supplies to the affected areas and people to cope with the crisis. However, since emergencies are usually difficult to predict in advance and the extent of damage from disasters is difficult to assess accurately, once a severe emergency occurs, especially a natural disaster, it has a wide range of impacts and a long duration of impacts, which poses a significant challenge to emergency rescue.
One of the common emergency response strategies is to pre-position relief supplies in emergency relief facilities close to the potential disaster site. This can reduce the time it takes to deliver the supplies, keep the cost of the relief under control, and increase the effectiveness of the relief. Since post-disaster rescue efforts depend on the effective deployment and delivery of emergency relief supplies, this is also the primary purpose of the emergency logistics system. Emergency rescue network planning is a critical link in emergency rescue and response, and reasonable planning can significantly improve emergency supplies’ deployment efficiency and effectiveness (Eshghi et al., 2022; Karatas & Yakıcı, 2021). This typically entails researching two distinct issues: the placement of emergency facilities and the distribution of emergency supplies.
The research on emergency facilities can be traced back to the P-centre of gravity and P-centre problem proposed by Hakimi (Caglayan & Satoglu, 2021; Ji & Fu, 2023). In the area of emergency facilities location and emergency logistics, studies (Pourghader Chobar et al., 2022; Shariat Mohaymany & Nikoo, 2020). explored the emergency logistics and emergency materials allocation after natural disasters to reduce the time it takes to deliver supplies and treat casualties; a study by Men et al. (2019) established a deterministic emergency logistics location model; a study by Pourghader Chobar et al. (2022) introduced the minimum and maximum critical distance and coverage level function, built a multi-quantity and multi-quality coverage model, and enhanced the genetic algorithm solution; In a study by Beiki et al. (2020), the position of the emergency logistics system was examined in the immediate aftermath of the earthquake, and the genetic algorithm solution was enhanced. The concept, characteristics, system, model design, and solution algorithm of emergency logistics site selection have all been usefully explored in these studies. However, the problem itself and the uncertainty of data acquisition have yet to be considered, and all of the studies discuss and solve the problem using a single-objective model. In terms of multi-objective modelling, Khanchehzarrin et al. (2022) integrated several traditional facility siting models and verified the correctness of the models through examples based on the fairness and efficiency of emergency rescue facilities; de Veluz et al. (2023) constructed a multi-objective emergency facility siting problem considering total cost, fairness, and efficiency. The suggested multi-objective emergency logistics centre site model addresses supply-side uncertainties regarding demand, price, and time by utilizing robust and deterministic optimization techniques. It improves the dependability and effectiveness of emergency response systems by using scenario-based planning and a unique hybrid frog-leaping algorithm. These academic works present the emergency problem as a deterministic issue without considering the emergency problem’s different uncertainties.
In dealing with uncertainty in a problem, two approaches, stochastic optimization and robust optimization, are commonly used. Stochastic optimization is one of the most widely used classical methods, and its goal is often to maximize the expected gain under all circumstances or minimize the anticipated expense under all circumstances. In the research of the maximum coverage siting problem, for instance, a study by Arshad et al. (2022) proposed the idea of scenarios, and its goal was to maximize the number of demands served in all situations; a scenario-based facility siting model was developed by a study (Zahedi et al., 2020) to reduce estimated costs across all scenarios and periods. In addition, some scholars have used fuzzy numbers intervals or interval grey numbers to describe and solve the uncertainty of emergency logistics problems. The robust optimization approach, which can be seen as a complementary substitute for stochastic optimization and sensitivity analysis, is characterized by the requirement to understand the probability distribution of uncertain parameters. It is derived from robust control theory. This minimax type of robust optimization has captured the interest of many scholars. Minimax cost (minimax cost) or regret (minimax regret) form of robust model. For example, Zafari and Shishebori (2019) used a robust optimization method to study the single-objective emergency facility siting model with deadline requirements (Liu, 2020) and constructed a relatively robust model for the siting of emergency logistics and distribution centres for the location of the emergency material reserve store; Ma et al. (2022) built a single-objective robust optimization model and a stochastic optimization model. A method of multi-objective optimization that balances time, money, construction, inventory, and transportation is the emergency logistics centre siting model. Based on urgency or resource limitations, it prioritizes speed while considering supply storage and placement. This organized strategy makes The emergency response system is effective and efficient, guaranteeing a strategic balance between cost, speed, and operational efficiency. All of the research above uses the robust optimization approach to examine where to locate emergency facilities in a context with a single purpose, and the majority use a simplified model that only considers one emergency resource.
To summarize, although some notable research results have been achieved in siting emergency facilities, there are still some information uncertainties and deficiencies in handling uncertainties in siting emergency logistics and mobilizing emergency supplies. Few research studies have addressed the issue of various types of emergency materials; most previous studies have concentrated on single emergency material situations. Reducing many objectives to a single objective is typically used in multi-objective emergency logistics siting studies. Still, these methods must address the unit and order-of-magnitude disparities among multiple objectives. In addition, existing studies mainly focus on the uncertainty of the problem parameters and ignore the different rescue stages in the emergency rescue process that may lead to decision uncertainty. The two objectives of emergency rescue cost and rescue time may be less critical and related to the rescue phase or the decision maker’s requirements.
To address these issues, this study introduces uncertainty scenarios to describe various uncertainty situations for emergency logistics facilities (e.g. material collection points and emergency logistics centres). We developed a multi-objective emergency logistics centre site selection deterministic and robust optimization models. We introduced cost preference weights to consider different rescue stage divisions or decision-making needs. The goal of the deterministic and robust optimization models for emergency logistics centre siting is to reduce rescue times and expenses while considering operational constraints, capacity restrictions, and material flow conservation. Both models provide optimal position and resilience in a variety of emergency circumstances by effectively solving complicated optimization issues through multi-objective approaches and a generalized hybrid frog-leaping algorithm. By converting the objective values to dimensionless values, the multi-objective problem is reduced to a single-objective problem. Then, an optimization solution is developed using a generic hybrid frog leap method.
The study presents a multi-objective model that combines resilient and deterministic optimization for emergency logistics centre locations. It enhances flexibility and decision-making in emergency logistics by solving challenging optimization issues using the generalized hybrid frog-hopping algorithm. The study provides a thorough planning tool that addresses response time and cost-effectiveness. With an emphasis on making decisions in the face of uncertainty, the study offers an innovative method for emergency logistics centre siting. It incorporates robust optimization with multiple objectives, applies the Generalized Hybrid Frog-Hopping Algorithm, uses dynamic scenario-based modelling, and adapts to evolving emergencies. The model’s extensive simulations demonstrate this significant development in emergency logistics planning for thorough assessment and its precise insights into dependability, time, and cost trade-offs. With an emphasis on reducing relief expenses and times, managing uncertainty, and factoring in building and inventory costs when making decisions, this project seeks to create a solid multi-objective optimization model for emergency logistics centres. To effectively encode and decode logistical facilities, a generalized hybrid frog-hopping method is presented along with the use of a bi-objective function. The usefulness and viability of the suggested models and algorithms in managing diverse uncertainties in emergency logistics are evaluated through multi-scenario simulation studies.
The researchers provide a sophisticated optimization framework that balances logistical objectives and manages uncertainty using multi-objective, robust methodologies. They also suggest a hybrid metaheuristic method combining several optimization strategies to find the best solutions in challenging circumstances. They present dynamic models that adjust to changing circumstances, enhancing the flexibility and reactivity of emergency logistics planning. Real-world applications and simulations give empirical validity.
2 Related Work
In an uncertain environment, there are usually three approaches to solving the problem of setting up an emergency logistics centre: stochastic planning, fuzzy planning, and robust optimization. Stochastic planning requires knowledge of the probability distribution of the desired uncertain parameters, which is often difficult to obtain. Fuzzy planning requires a certain amount of sample data and the personal experience of the decision maker to determine the fuzzy affiliation function of the uncertain parameters, which is very dependent on the subjective judgment of the decision maker. Compared with the former two, robust optimization can effectively reduce the interference of the uncertainty of data parameters on the final solution, especially in emergency logistics. The adaptability of the optimal solution obtained by robust optimization is often better.
The study by Ghasemi et al. (2019) combed through the literature on the location of logistics and distribution centres for large-scale emergency rescue and found that there are problems in the current research as well as put forward a future research trend; i.e. it is necessary to focus on solving the problem of multi-party coordination and to optimize the layout of distribution centre location through scientific planning. The study by Yenice & Samanlioglu (2020) considers the uncertainty of emergency cost, establishes a robust siting path optimization model for multi-emergency resources, and solves it through CPLEX and GAMS programming, thus providing decision support for relevant departments. Blockchain technology has transformed payment information management, enabling real-time state information exchange in logistics. The rise of edge computing in IoT has further enhanced shared logistic management. However, challenges such as cold start and long return times remain. A dynamic distributed iterative computational model tackles these issues, providing fast computing assets for shared logistic trading. This algorithm boosts economic performance and privacy, benefiting both borrowers and creditors. It outperforms existing models in performance, user satisfaction, and repayment capability (Yang et al., 2021). The integration of big data analytics, cloud computing, and attribute-based encryption (ABE) significantly enhances financial data security in the digital age. ABE enables fine-grained access control over encrypted data, ensuring both scalability and confidentiality. Big data analytics helps detect fraud, manage risks, and comply with legal requirements. Case studies illustrate the effectiveness of these technologies in financial institutions, demonstrating how on-going improvement and compliance verification can strengthen data security and protect financial information (Yalla, 2021).
A study by Jamali et al. (2021) proposes an emergency site selection and scheduling model based on robust optimization, considering the facility failure problem and storage and transportation costs. In response to the uncertainty of material demand and vehicle transportation time, a study by He & Xie (2022) considered the risk of transportation time overrun and the risk of logistics facility point failure. It then established a robust optimization model for emergency logistics time minimization by using combined vehicle and helicopter transportation, and it demonstrated the risk resistance of the robust optimization method. A study by Zheng et al. (2023) established an uncertain emergency facility siting model with deadline requirements, compared and analysed the solution obtained from robust optimization and the optimal solution in the deterministic case, and proved that the deviation of the robust solution is relatively small, and it can effectively avoid the risk. In the study by Zhou et al. (2023), the effect of random network failure on the location of emergency facilities is proposed, and a heuristic algorithm is used to maximize the coverage for post-disaster relief work. Zhou et al. (2023) suggested a multi-objective, multi-model, multi-commodity, multi-period robust optimization model to control the position of commodities and fatalities in earthquake reactions. Sicuaio et al. (2022) proposed a decision-making model in Artificial Intelligence and designed a coherent network that ensures the operation of specific infrastructures and potential resources even after disaster damage. Ghasemi et al. (2022) proposed a scenario-based stochastic multi-objective location-allocation-routing model for pre- and post-disaster humanitarian aid logistics. The model incorporates the distribution of relief items, equitable evacuation procedures, and operational and strategic decision-making. It makes use of a simulation technique to handle demand unpredictability. For minor- and medium-sized issues, the model is solved using the Epsilon-constraint approach; for large-scale problems, three metaheuristic methods are used. The model may be used in crisis scenarios to find shelters, plan routes, and distribute goods.
In summary, the previous studies in the literature have achieved some results in the emergency logistics centre siting problem. Still, some things could be improved: 1) Insufficient handling of information uncertainty. Most studies used different methods to deal with information uncertainty, such as stochastic planning, fuzzy planning, and robust optimization. However, these methods still need to be improved in dealing with uncertainty. For example, stochastic planning requires knowledge of the probability distribution, while fuzzy planning depends on subjective judgment. Therefore, better methods are needed to cope with uncertainty, especially in emergencies where uncertain parameters cannot be accurately estimated. 2) Inadequate treatment of multi-objective problems. Most studies have addressed the multi-objective emergency logistics centre siting problem. Still, the multi-objective problem is usually transformed into a single-objective problem, which may result in a trade-off between objectives needing to be addressed appropriately. A better approach is developing optimization algorithms applicable to multi-objective problems to handle conflicts and trade-offs among multiple objectives effectively. The study addresses the shortcomings of earlier research in single-objective, deterministic models, robust optimization, multi-objective optimization, and metaheuristic algorithms. It emphasizes the significance of multi-objective optimization in emergency logistics centre design. It suggests a paradigm that uses sophisticated, hybrid metaheuristic algorithms to dynamically adjust to changing situations while integrating multi-objective optimization with reliable approaches. The study evaluated emergency logistics centre location models using multi-scenario simulation studies. The tests tested resilient and predictable optimization models using a generalized hybrid frog-hopping algorithm. Robustness, dependability, time and cost efficiency, algorithm adaptation, and practical feasibility were among the main conclusions. The algorithm successfully balanced several objectives, the robust model performed well, and cost and response times improved.
3 Mathematical Modelling
3.1 Problem Description
We believe it is essential to quickly establish several emergency material collection points and emergency logistics centres in the disaster area or nearby areas after the occurrence of significant emergencies (such as earthquakes, typhoons, and other natural disasters); considerations for space and resources, uncertainty regarding the material requirements of the impacted places (also known as emergency demand points), depreciation of the emergency rescue time and emergency rescue expenses are all taken into account. We will address the issue of how to choose the location for the emergency logistics centre rationally, the appropriate material transfer route, and the amount of transfer while taking into account the uncertainty of the material demand at the disaster point (referred to as the demand point) and the two objectives of minimizing the emergency relief time and the emergency relief cost. This study investigates the influence of cost preference weights on disaster relief expenses and response times. Moderate weights compromise cost and time, whilst lower weights emphasize speed. Greater weights give the building and rehabilitation phases priority in cost reduction. Comparative analysis helps determine the best courses of action for various emergency scenarios.
The emergency logistics system under consideration consists of an emergency materials collection point, an emergency logistics centre, and an emergency demand point. Emergency materials are first transported from the collection point to the emergency logistics centre, where they are then distributed to the emergency demand point based on the current situation; The emergency supplies can also be delivered straight from the collection point to the emergency demand location because emergencies may result in the failure or blockage of rescue highways as well as other conditions. Emergency supplies can also be delivered directly from the collection site to the emergency demand location, considering that emergencies could result in the obstruction of rescue routes or the failure of rescue roads. (1) Every emergency demand location does not require more emergency supplies than a single emergency logistics centre can store, and all emergency supplies can be transported uniformly by vehicles; (2) don’t assume that multiple emergency materials can’t be delivered at the same time because the various types of emergency materials are compatible with transportation; (3) assuming that each emergency material collection point and the emergency logistics centre has an adequate number of transport vehicles and an adequate vehicle carrying capacity and does not consider the limitations on the working hours of the transport vehicles and the limitations on the capacity of the vehicles.
3.2 Explanation of Symbols
3.2.1 Collection
3.2.2 Variables
3.2.3 Decision Variables
3.3 Multi-Objective Deterministic Model Construction
The strategy for detecting emergency logistics facilities and distributing supplies in the event of a significant catastrophe is presented in the article. By building a robust optimization model to handle data parameter uncertainties, a bi-objective function to handle time urgency, and a hybrid frog-hopping algorithm to encode facilities offering emergency material relief services, it tackles the multi-objective optimization problem. A multi-scenario simulation experiment confirms the efficacy of the models and algorithms, demonstrating how well the technique handles the difficulties involved in choosing the site of an emergency logistics centre site in the face of uncertainty. The first emergency relief time target takes into account the turnaround and deployment times of emergency materials in the logistics centre as well as the transportation times of emergency materials between the material collection point, the emergency logistics centre, and the emergency demand point; the second emergency relief cost target is primarily made up of the construction costs. The construction and operation (storage) costs of the emergency logistics centre and the cost of transporting emergency supplies between the material collecting site, the emergency logistics centre, and the emergency demand point make up the bulk of the second emergency relief cost target.
Equations (1) and (2) in the model are the objective functions, and equation (2) is to minimize the cost of emergency rescue, which includes the cost of building the emergency logistics centre, the cost of storing emergency materials there, and the cost of transporting emergency materials. Equation (1) is to minimize the emergency rescue time, including transport and turnaround times. Equation (3) is for the emergency logistics system of the material flow conservation conditions, where equations (3) and (4) show the emergency logistics centre at the flow conservation conditions, formula (5) shows the emergency demand point at the flow conservation or the demand is satisfied, and equation (6) shows the flow at the point of collection of materials conservation or the collection of materials at the point of collection of the transport out; equation (7) indicates that only one logistics centre or collection point can provide material relief for a specific material at each emergency demand point; equation (8) means that only selected logistics centres can transport the material; equation (9) guarantees the supply capacity of each emergency material; the limits on decision variables are shown in equations (10) and (12).
3.4 Multi-Objective Robust Optimization Model Construction
The demand for different types of materials at each emergency demand point is difficult to estimate accurately due to the suddenness of emergencies and the difficulty of accurate prediction, and the transportation costs and times of emergency materials may change due to the possibility of an untimely supply of emergency materials. Considering these uncertainties, the problem scenarios and robust constraint coefficients are introduced. The scenario
where
4 Model Solving
4.1 Multi-Objective Treatment
In the model of this article, it can be challenging to harmonize the time and cost objectives. The cost and time requirements are different in the actual emergency logistics rescue process, so the two’s importance may differ. In addition, the measurement units of time and cost are different, so the traditional linear weighting method is not feasible. Although Hong and Jeong (2019) have used the percentage dimensionless method (using a fixed value of 100 divided by the target value) to eliminate the difference in the units of measurement of the two sub-objectives; there are two shortcomings in this approach: one is that it does not truly reflect the difference in the units of measurement of the two objectives and their order of magnitude, and the other is that it cannot adapt to the changes in the problem data. For this reason, we first eliminated the two target units for each scenario using the following Formula:
where
The objective function of the multi-objective deterministic model is modified to equation (30), and the time and cost values corresponding to the optimal solution obtained under scenario s are set to be
Noting that the primary purpose of equation (29) is to eliminate the unit of measurement and its order of magnitude difference between the two objectives, for all the scenarios of the problem, small changes in the data can also cause changes in the values of optimal time and optimal cost under the single objective, which are usually not too large; based on this consideration, if the solution time of the algorithm is to be saved, it is also possible to use the values of optimal time
4.2 Design of Hybrid Frog Leading Algorithm
The shuffled Frog Leading Algorithm (SFLA) is a new biomimetic intelligent optimization algorithm that imitates frog groups searching for food, proposed by Wan et al. (2023) to solve the combinatorial optimization problem. Its main feature is to divide the group of frogs into multiple subgroups, and each subgroup executes its local search strategy, repeatedly merging and splitting frog groups during the search process and exchanging information among the subgroups. Because the algorithm uses the concept of subgroups, it increases the flexibility and effectiveness of the search process. It avoids falling into local optima more effectively than other intelligent optimization methods.
For any intelligent algorithm, the coding of the problem is the most crucial part. We encode the rescue service facilities (emergency material collection points and alternative emergency logistics centres) that each kind of material at the emergency material demand points receives, i.e. we use the rescue services provided by the emergency material collection points and the alternative emergency logistics centres for each kind of material at all the emergency material demand points as the encoding. Specifically, assuming that there are
The value
For example, assuming that there are two demand points, each of which has three types of emergency material requirements, and that there are three material collection points (numbered I, 2, 3) and three alternative emergency logistics centres (numbered 4, 5, and 6) in the rescue system, the frogs are (1, 4, 2, 5, 4, and 1), indicating that the rescue services provided to the three types of emergency materials at the first demand point are Collection Point 1, Emergency Logistics Centre 4, and Collection Point 2, and the rescue services provided to the three types of emergency materials at the second demand point are Emergency Logistics Centre 5, Emergency Logistics Centre 4, and Collection Point l, respectively. Collection point 1, emergency logistics centre 4 and collection point 2 for the first demand point, and emergency logistics centre 5, emergency logistics centre 4 and collection point l for the second demand point.
Initialization of the total frog population: According to the number of demand points for emergency supplies and the number of emergency supplies, a character will be randomly generated for each locus of individual frogs to represent the facility that will provide services to the corresponding demand point and emergency supplies for that locus (it may be an alternative emergency logistics centre or a collection point for emergency supplies).
The first frog is assigned to the first subpopulation, the second to the second subpopulation, and so on. All frogs are sorted from smallest to most significant in terms of suitability, and so on, with the mth frog assigned to the mth subpopulation, and the m + 1th frog assigned to the m + 1th subpopulation, and so on, until all frogs have been processed.
Local search strategy: Assuming that the optimal and worst individuals of each group are
where
Adaptation function: For the multi-objective deterministic model, we directly use equation (30); for the multi-objective robust optimization model, we use equation (31). If the current individual does not satisfy the robust constraints under a specific scenario S, a significant penalty term is applied to the individual’s adaptability.
In this article, Figure 1 shows the flowchart of the generalized hybrid frog jumping algorithm for solving the multi-objective deterministic model and the multi-objective robust optimization model. In emergency logistics centre siting models, the generalized hybrid frog-hopping algorithm is a metaheuristic technique that helps with complex optimization problems. It breaks down issues into minor issues and evaluates and upgrades facilities for efficiency and cost savings, taking inspiration from the natural behaviours of frogs.
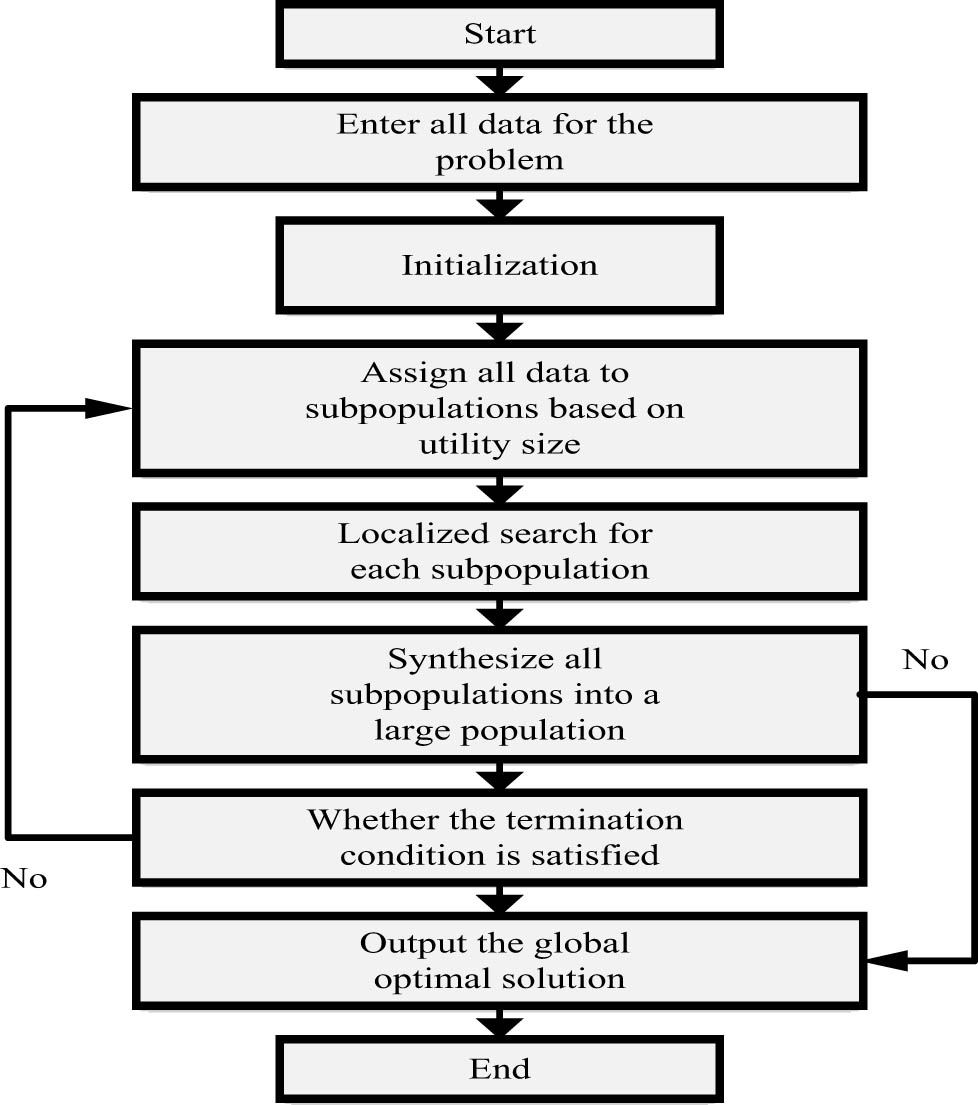
Flowchart of the hybrid frog jump algorithm SFLA (main flow on the left, local search flow on the right).
5 Algorithm Analysis
5.1 Data Description
It is known that an emergency logistics system has three emergency material collection points (numbered 1, 2, and 3), three optional emergency logistics in a tb alternative points (numbered 4, 5, 6), as well as three emergency material demand points (numbered 7, 8, and 9) and three kinds of emergency material (numbered
Alternative emergency logistics centre information
| No. | Construction costs | Unit storage cost | Material turnaround time | Unit transportation cost | Transportation time | ||||||||
|---|---|---|---|---|---|---|---|---|---|---|---|---|---|
|
|
|
|
|
|
|
7 | 8 | 9 | 7 | 8 | 9 | ||
| 4 | 300 | 20 | 35 | 30 | 1 | 2 | 3 | 140 | 110 | 190 | 6 | 4 | 7 |
| 5 | 200 | 20 | 35 | 30 | 3 | 3 | 4 | 140 | 100 | 200 | 3 | 3 | 4 |
| 6 | 200 | 20 | 35 | 30 | 2 | 2 | 1 | 150 | 100 | 200 | 5 | 8 | 3 |
Information on material collection points
| No. | Unit storage cost | Material turnaround time | Unit transportation cost | Transportation time | ||||||||
|---|---|---|---|---|---|---|---|---|---|---|---|---|
| 4 | 5 | 6 | 4 | 5 | 6 | 7 | 8 | 9 | 7 | 8 | 9 | |
| 1 | 50 | 60 | 80 | 5 | 6 | 2 | 150 | 180 | 240 | 12 | 12 | 10 |
| 2 | 50 | 50 | 60 | 2 | 4 | 6 | 150 | 150 | 180 | 4 | 8 | 13 |
| 3 | 50 | 65 | 70 | 8 | 3 | 4 | 150 | 200 | 210 | 10 | 9 | 15 |
Information on emergency supplies
| Maximum collection volume |
|
|
|
Requirements |
|
|
|
|---|---|---|---|---|---|---|---|
| 1 | 400 | 500 | 400 | 7 | 400 | 400 | 400 |
| 2 | 400 | 300 | 300 | 8 | 300 | 300 | 300 |
| 3 | 200 | 200 | 300 | 9 | 200 | 200 | 200 |
5.2 Results and Analysis
The following settings are used to solve the multi-objective model using the hybrid frog hopping algorithm in this study: Up to 100 hybrid iterations, 40 local searches per frog subpopulation, a maximum of four subpopulations, and a maximum of 20 individuals in each subpopulation can be used. In addition, this article sets the robustness constraint coefficient to be the same for all the scenarios, i.e.
5.2.1 Cost Preference Weights
First, the baseline scenario data are taken into account to confirm the reliability of the multi-objective deterministic model. The hybrid frog jump algorithm is used to optimize and solve the cost preference weights, which are taken at intervals of 0.05 from 0 to 1. Table 4 displays the ideal rescue allocation plan for all types of materials at all demand points. According to the optimal rescue allocation programme 2-4-6-6-2-2-5-6-5, Collection Point 2, Emergency Logistics Centre 4 and Emergency Logistics 6 allocate the three emergency supplies at the first demand point. At the same time, Emergency Logistics Centre 6, Collection Point 2 and Collection Point 2 are responsible for providing the three different types of emergency supplies at the second demand point. Emergency Logistics Centre 6 provides rescue services at the third demand point. The findings in Table 4 demonstrate that initially, the decision-maker prioritizes the emergency response time when performing the rescue. As a result, all three emergency logistics centres are opened to meet the initial rescue’s time urgency requirements. However, as the cost preference weights gradually rise (from 0.35 to 0.6), the number of emergency logistics centres is reduced to two (i.e. the locations of Emergency Logistic Centres 5 and 6); when the cost preference weights further increase, the decision maker prioritizes the emergency response cost (i.e. the locations of Emergency Logistic Centres 5 and 6). As the cost preference weight rises, the decision-maker prioritizes contingency costs (from 0.65 to 1), and the number of emergency logistics centres decreases to one (i.e. site selection for Emergency Logistics Centre 4).
Optimal relief allocation scenarios with different cost preference weights
| Cost preference weights | Optimal rescue allocation program |
|---|---|
| [0.05, 0.3] | 2-4-6-6-2-2-5-6-5 |
| [0.35, 0.4] | 2-1-6-5-2-1-5-5-6 |
| [0.45, 0.5] | 2-2-1-6-2-2-5-2-6 |
| [0.55, 0.6] | 2-1-1-1-2-1-5-5-6 |
| [0.65, 0.8] | 2-1-1-1-2-2-5-5-2 |
| 0.85 | 1-1-1-2-2-2-5-6-3 |
| [0.9, 1] | 1-2-1-1-1-2-4-5-3 |
Table 5 shows rescue routes and rescue material transportation results under three cost preference weights in the baseline scenario. When the cost preference weights are 0.35, 0.55, and 0.8, the emergency rescue costs are 557,100, 47,100, and 45,390, and the emergency rescue times are 21,700, 25,000, and 26,400, respectively. When the decision maker assigns different weights to the rescue costs, the emergency rescue costs and times have different optimal values, and it is impossible to achieve the possibility of decreasing both the costs and times of the emergency rescue. When the decision maker assigns different weights to rescue costs, the cost and time of emergency rescue have different optimal values, and it is impossible to achieve the possibility that the cost and time of emergency rescue decrease simultaneously.
Optimal rescue paths and rescue material movement under three cost-preference weights
| w = 0.35 | w = 0.55 | w = 0.8 | ||||||
| Rescue costs 557,100 | Rescue costs 470,021 | Rescue costs 453,900 | ||||||
| Rescue time 21,700 | Rescue time 25,000 | Rescue time 26,400 | ||||||
|
|
|
|
|
|
|
|
|
|
|
|
|
|
|
|
|
|
|
|
| 400 | 400 | 400, 400 | 400 | 400 | 400 | 400 | 400 | 400 |
|
|
|
|
|
|
|
|
|
|
| 300, 300 | 300 | 300 | 300 | 300 | 300 | 300 | 300 | 300 |
|
|
|
|
|
|
|
|
|
|
| 200, 200 | 200, 200 | 200, 200 | 200, 200 | 200, 200 | 200, 200 | 200, 200 | 200, 200 | 200 |
Second, the relationship between cost preference weights and emergency response should be further analysed, especially regarding how to set cost preference weights in different emergency response phases. Figure 2 shows the trend of the mean and standard deviation of cost and time for all scenarios as a function of cost preference weights. Table 5 and Figure 2 show that when the decision maker assigns larger and larger values to the cost preference weights, the optimal value of rescue cost decreases gradually, but the emergency rescue time increases slowly, which is consistent with the actual rescue situation; on the other hand, different values of the cost preference weights can correspond to various stages of the emergency rescue, and in the initial stage of the emergency rescue, the primary consideration is the high timeliness. It is acceptable to have a higher emergency rescue cost, which can be regarded as corresponding to a smaller cost preference weight. In the early stage of emergency rescue, the primary consideration is high timeliness, and it is acceptable to have higher emergency rescue cost, which can be regarded as corresponding to smaller cost preference weights (e.g. 0.35 in Table 5); in the middle stage of emergency rescue, both timeliness and cost have to be taken into account, which can be regarded as corresponding to moderate cost preference weights (e.g. 0.55 in Table 5); in the later stage of emergency rescue, timeliness takes a back seat, and the primary consideration is the cost, which can be regarded as corresponding to larger cost preference weights (e.g. 0.8 in Table 5). Analysing the trends of rescue cost and rescue time in Figure 2, the corresponding weights can be roughly divided into three intervals, with the first interval being [0, 0.45], the second [0.45, 0.75], and the third [0.75, 1], which can be regarded as corresponding to the early, middle, late, and final stages of rescue, respectively. Low-cost preference characterizes the first stage; the optimal rescue time is small, but the rescue cost remains high, which is in line with the time urgency requirement of activating the emergency rescue system after a disaster occurs; the second stage is characterized cost preference weights, which takes into account the urgency requirement of the rescue time, but also considers the cost limitation that the emergency rescue system can afford, and the cost of the rescue decreases rapidly with the slow increase of weights, but the required rescue time increases quickly; the third interval segment is [0.75, 1], and the three cost preference weights can be seen as corresponding to the early, middle, late or final stage respectively. The third stage is characterized by cost preference weight, which mainly considers the cost limitations of the emergency rescue system and is in line with the characteristics of the late or end stage of emergency rescue, in which the cost decreases slowly and the time increases a little faster.
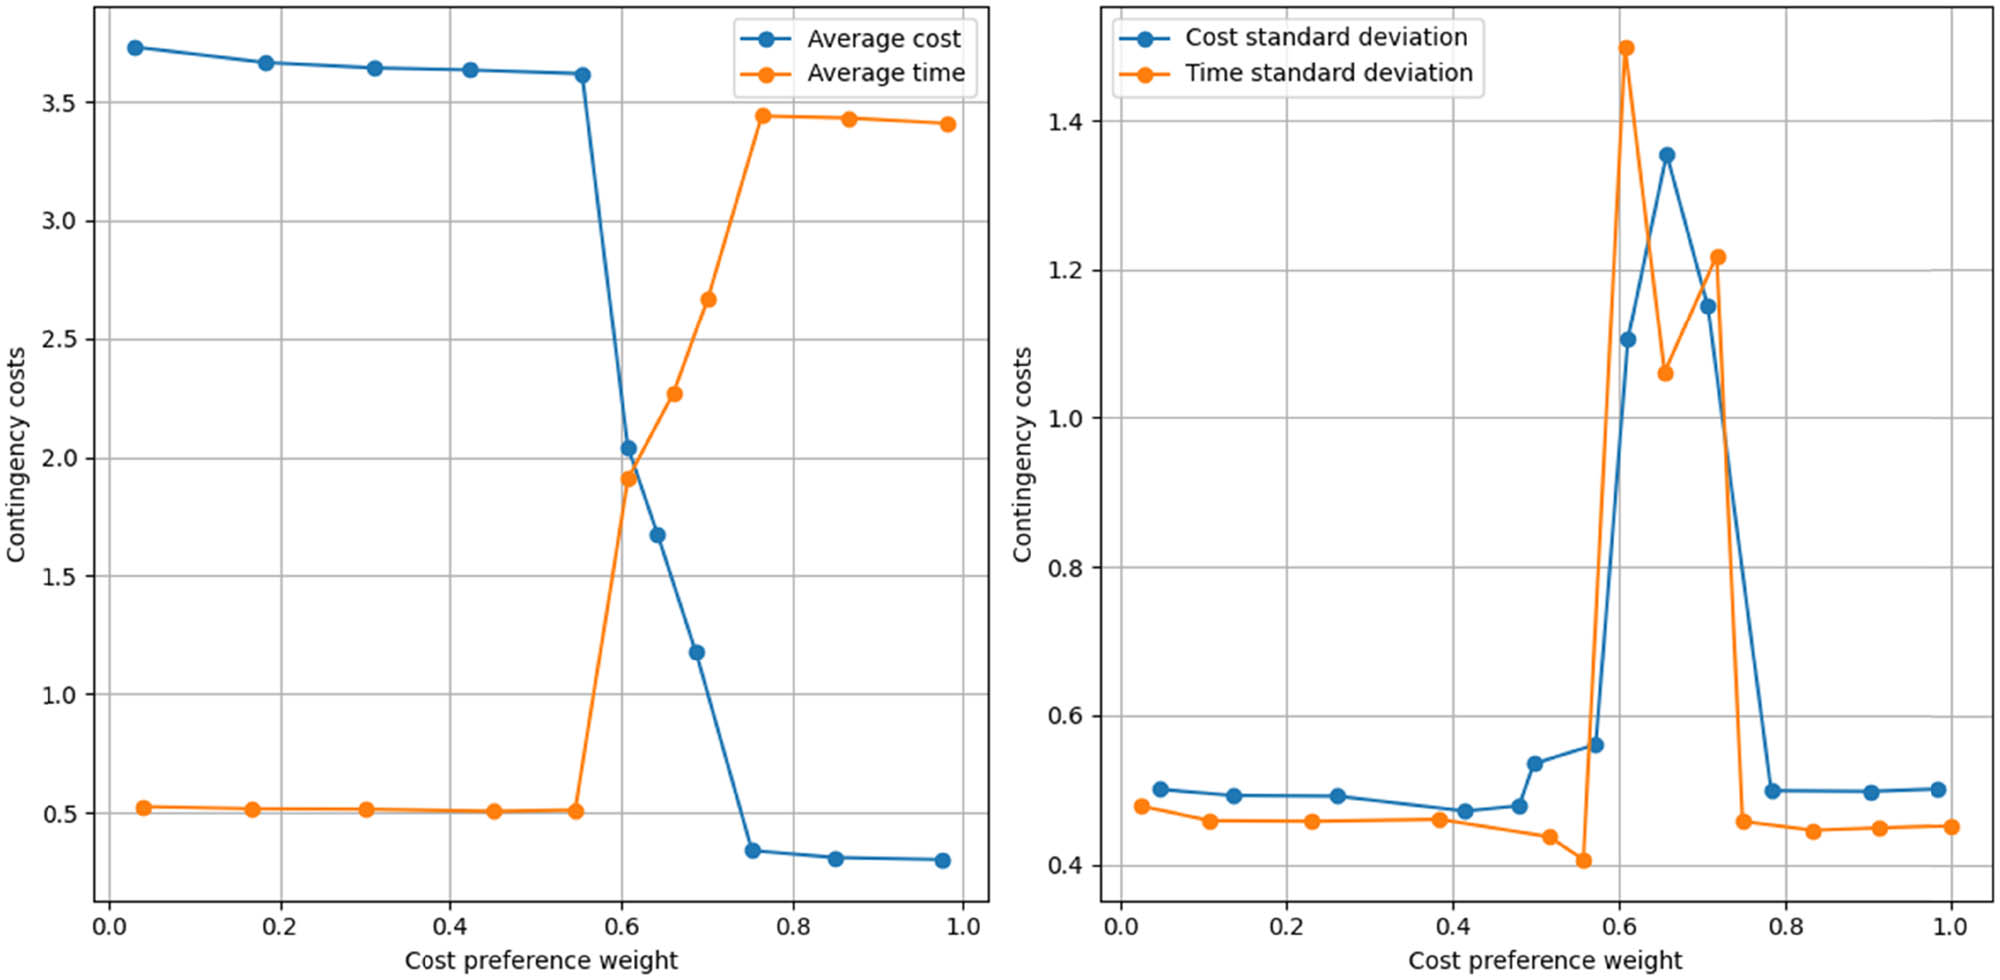
Trends in the mean and standard deviation of the deterministic model.
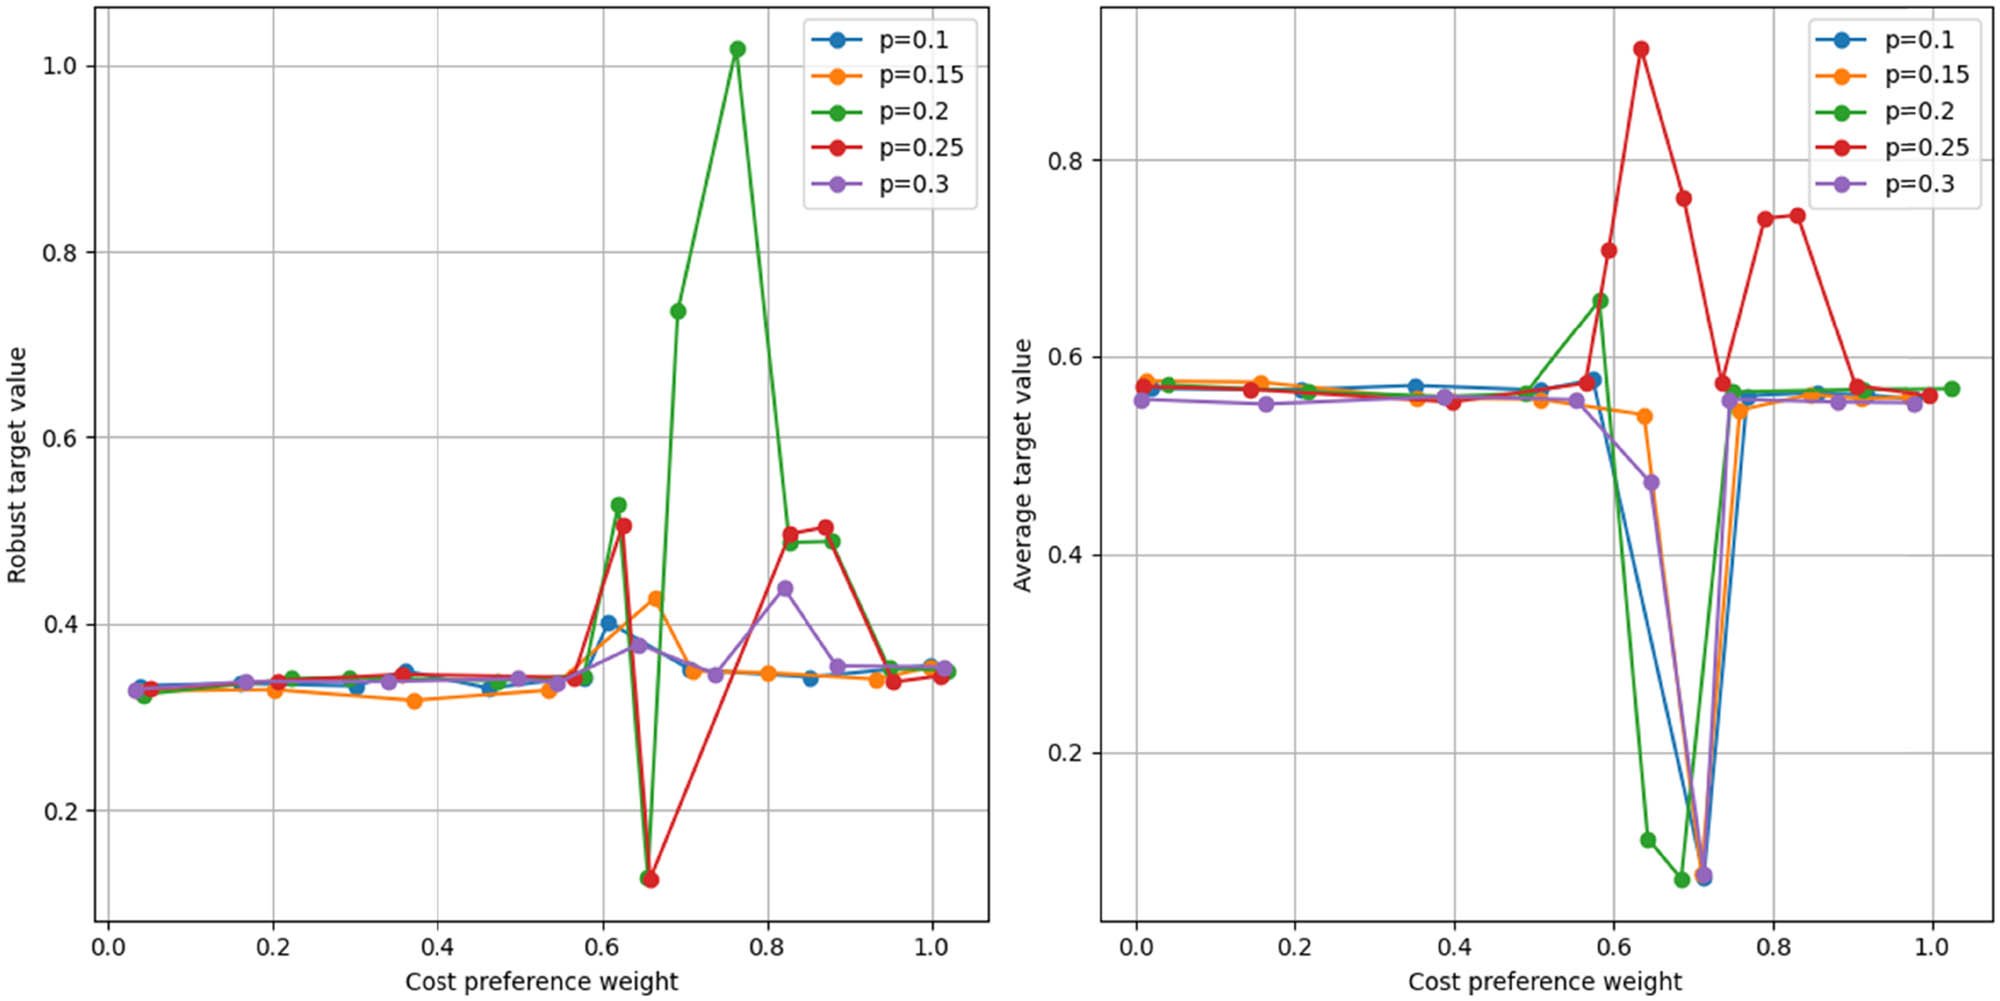
Again, in this research, the robust constraint coefficients of all the scenarios are assumed to be 0.2 to examine the benefits and drawbacks of the multi-objective robust optimization deterministic models. The performance of emergency logistics models is reviewed, and strong constraint coefficients are discussed. It concludes that although lower coefficients enhance cost efficiency but must be prepared for extreme occurrences, more significant coefficients boost conservatism but raise operating expenses. The model’s balance of essential goals is impacted, and for the best emergency reactions, a range of 0.15–0.25 is advised. Figures 3 and 4 show the trend of the mean (time and cost) and standard deviation (time and cost) of the two models with the variation of cost preference weights, respectively. The average results in Figure 3 only indicate little difference between the two models when the cost preference weights are taken at [0, 0.55] and [0.75, 1]. Still, the average cost of the deterministic model is significantly higher than the average cost of the robust optimization when the cost preference weights are taken at [0.6, 0.7]. However, when we focus on the standard deviations (time and cost) of the two models given in Figure 4, We can see that both of the deterministic model’s standard deviations are higher than those of the robust optimization, in particular, when the cost preference weights are taken as [0.55, 0.7], the deterministic model’s standard deviation is about twice as high as that of the robust optimization This suggests that the robust optimization is more resistant to various uncertainties. Specifically, in terms of the general trend, the corresponding cost preference weights of the robust model can be divided into three bands: the first band is [0, 0.45], the second band is roughly [0.45, 0.75], and the third band is roughly [0.75, 1], and the three cost preference weight bands can be regarded as corresponding to the early, middle, and late stages of the rescue, respectively. The improvements are validated by comparing the resilient and deterministic models in the research. The robust model’s higher decision-making abilities and improved uncertainty management are demonstrated by comparison against a baseline benchmark. The comparison uses consistent performance indicators to prove its cost, time, and reliability benefits. The scenario analysis illustrates the robust model’s flexibility and durability in many situations. Setting the stage for future comparisons with more sophisticated models, the comparison places the advances of the robust model within the context of current research.
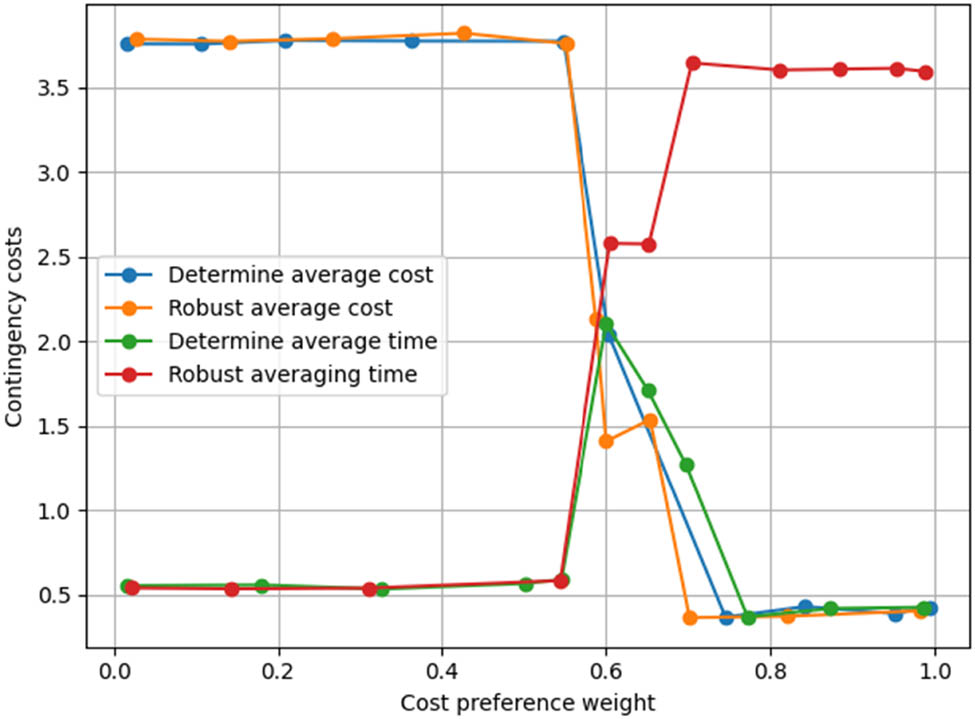
Trends in the mean values of the two models.
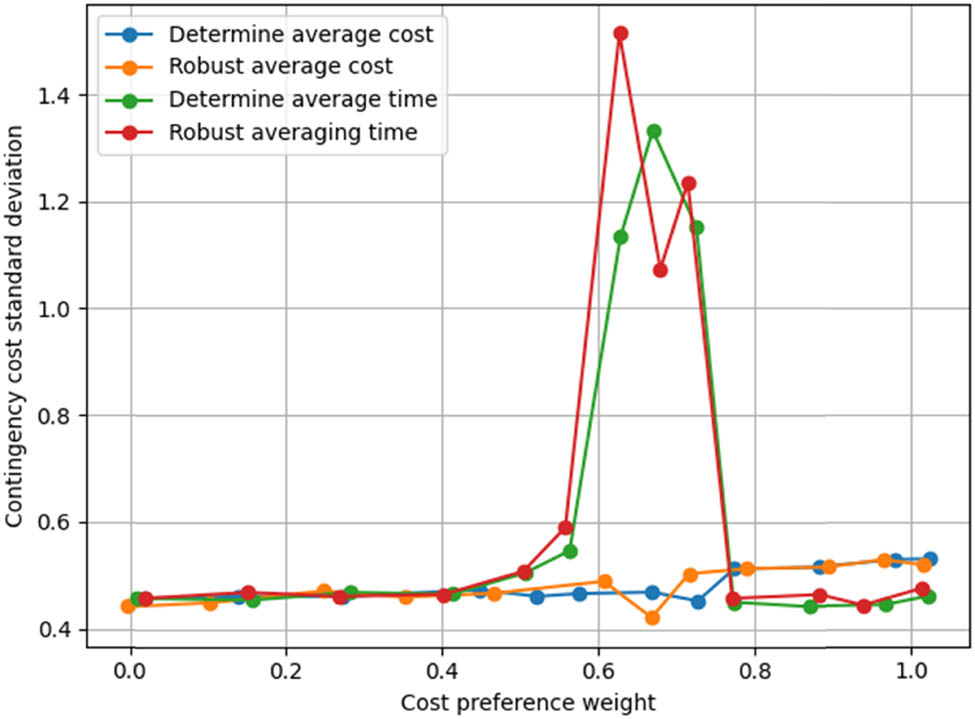
Trend of the standard deviation of the two models.
According to the results of the chart and the previous discussion, we can consider emergency rescue to be divided into three types: the rescue of the early stage of the time urgency, the rescue of the middle stage of the rescue of the cost and the rescue of the late stage of the rescue of the price, decision-making or modelling optimization solution can be chosen to choose a different cost preference weight, and here, according to the discussion of the above will be the cost of the weight of the range of values of the weight of preference for the distinction as [0, 0.45], [0.45, 0.75], [0.45, 0.75], [0.75]. Here, based on the above discussion, the range of cost preference weights is distinguished as [0, 0.45], [0.45, 0.75], and [0.75, 1], or a single value, such as 0.35, 0.55, and 0.8.
5.2.2 Impact Analysis of Robust Constraint Coefficients
To examine the impact of different robust constraint coefficients, we consider five values of robust constraint coefficients, i.e. 0.1, 0.15, 0.2, 0.25, and 0.3. Figure 5 gives the robust objective values obtained by the multi-objective robust optimization with different robust constraint coefficients (left) and the average objective values of all scenarios under the current robust optimal solution (right). The average objective value here means that the optimal robust solution can be obtained for a given robust constraint coefficient, which corresponds to the objective value of each scenario, and the average of these objective values is calculated. As can be seen from Figure 5, when the cost preference weights are taken in [0, 0.45] and [0.75, 1], the robust objective value and the average objective value under different robust constraint coefficients are very stable; in addition, it is noted that when the cost preference weights are taken in [0.75, 1] and all the robust constraint coefficients are taken in 0.1, the robust objective value and the average objective value have large fluctuations, which indicates that the robust coefficients are small (i.e. given the robust constraint coefficient). The average objective value of the cost preference weights could be more stable. The robust optimization offers flexible and adaptable techniques, customized risk levels and event probabilities, making it a more dependable and economical approach to emergency logistics planning. This increases public confidence in emergency management systems. This shows that finding a robust optimal solution is more difficult when the robustness coefficient is small (i.e. the given robustness requirements are more stringent). Even in extreme cases, finding a feasible solution that satisfies all the scenarios may be challenging. When the cost preference weights are within [0.5, 0.75], different robust constraint coefficients have other impacts. When the robust requirements are more stringent (robust coefficient of 0.1), the robust objective value increases rapidly with the increase of the cost preference weights; when the robust requirements are more lenient (robust coefficient of 0.3), the robust objective value fluctuates upward and downward; and when the robust requirements are general (0.15–0.25), the robust objective value is relatively high, and the robust objective value is relatively low. The robustness target value is relatively flat when the robustness requirement is moderate (0.15–0.25). Based on the above analysis, we recommend that the robust constraint coefficients in robust optimization be taken in the range of [0.15, 0.25] or the middle value of 0.2.
Impact analysis of robust constraint coefficients.
5.3 Real Scenario
Since many earthquakes have occurred in Sichuan Province in recent years, the calculation examples in this chapter will use Sichuan Province as the object of analysis. A total of 15 emergency material demand points are set up, including Wenchuan, Mianzhu, Beichuan, and other places, and four alternative points are proposed to establish emergency logistics centres, including Chengdu, Mianyang, and other areas. The emergency material demand of each region is determined according to population data, etc., as shown in Table 6.
Emergency material demand in disaster-stricken regions
| Demand points
|
Demand (million pieces) | Demand points
|
Demand (million pieces) |
|---|---|---|---|
| 1 Wenchuan | 6–14 | 9 Pengzhou | 74–83 |
| 2 Mianzhu | 45–53 | 10 Jiangyou | 81–92 |
| 3 Beichuan | 15–23 | 11 Deyang | 58–66 |
| 4 Qingchuan | 16–25 | 12 Ya’an | 58–66 |
| 5 Mao County | 5–12 | 13 Leshan | 108–116 |
| 6 Dujiangyan | 64–72 | 14 Baoxing | 0–9 |
| 7 Anxian | 39–45 | 15 Ziyang | 105–113 |
| 8 Pingwu | 12–21 |
The construction cost of the emergency logistics centre, capacity based on the construction standards of the disaster relief supplies reserve depot, and related policies are shown in Tables 7 and 8.
Basic parameters of alternative points of the emergency logistics centre
| Alternative points
|
Logistics centre capacity (10,000 pieces) | Construction cost (million yuan) |
|---|---|---|
| 1 Chengdu | 330 | 300 |
| 2 Mianyang | 300 | 230 |
| 3 Guangyuan | 280 | 210 |
| 4 Meishan | 260 | 180 |
Other costs
| Transportation costs (million yuan per 10,000 units. kilometres) | Delayed transportation cost (million yuan/million pieces-hours) | Storage cost (million yuan/million pieces) |
|---|---|---|
| 0.0125 | 5 | 2 |
The distance between the affected area and the alternative point of the emergency logistics centre is calculated according to the road distance between the two cities given by the Baidu map, as shown in Table 9.
Distance between the affected area and the alternative points of the emergency logistics centre Unit: km
| Disaster area
|
Alternative points
|
|||
|---|---|---|---|---|
| 1 Chengdu | 2 Mianyang | 3 Guangyuan | 4 Leshan | |
| 1 Wenchuan | 135 | 215 | 382 | 202 |
| 2 Mianzhu | 92 | 52 | 225 | 18 |
| 3 Beichuan | 200 | 92 | 255 | 292 |
| 4 Qingchuan | 288 | 176 | 94 | 375 |
| 5 Mao County | 175 | 255 | 422 | 242 |
| 6 Dujiangyan | 66 | 144 | 313 | 135 |
| 7 Anxian | 122 | 18 | 178 | 210 |
| 8 Pingwu | 276 | 160 | 202 | 365 |
| 9 Pengzhou | 44 | 95 | 262 | 133 |
| 10 Jiangyou | 158 | 43 | 148 | 252 |
| 11 Deyang | 73 | 52 | 222 | 162 |
| 12 Ya’an | 138 | 152 | 419 | 101 |
| 13 Leshan | 175 | 292 | 459 | 72 |
| 14 Baoxing | 200 | 317 | 478 | 168 |
| 15 Ziyang | 107 | 199 | 366 | 108 |
Emergency supplies transport vehicle speed change range of 30 km/h a 50 km/h, road speed under normal circumstances for 50 km/day, when the emergency supplies transport penalty time for 3 h, that is, the transport time of more than 3 h will produce delayed transportation costs.
5.3.1 Deterministic Model Solution
Based on the parameter setting in 5.1, the deterministic siting model can calculate the demand for emergency materials in the affected area and the transportation time between the affected area and the emergency logistics centre, as shown in Tables 10 and 11.
Demand for emergency materials in the affected area (deterministic)
| Demand points
|
Demand (million pieces) | Demand points
|
Demand (million pieces) |
|---|---|---|---|
| 1 Wenchuan | 9 | 9 Pengzhou | 79 |
| 2 Mianzhu | 49 | 10 Jiangyou | 85 |
| 3 Beichuan | 21 | 11 Deyang | 62 |
| 4 Qingchuan | 18 | 12 Ya’an | 62 |
| 5 Mao County | 9 | 13 Leshan | 110 |
| 6 Dujiangyan | 68 | 14 Baoxing | 5 |
| 7 Anxian | 41 | 15 Ziyang | 107 |
| 8 Pingwu | 15 |
Transportation time between the affected region and the alternative points of the emergency logistics centre Unit: hours
| Disaster area
|
Alternative points
|
|||
|---|---|---|---|---|
| 1 Chengdu | 2 Mianyang | 3 Guangyuan | 4 Leshan | |
| 1 Wenchuan | 2.69 | 4.29 | 7.61 | 6.19 |
| 2 Mianzhu | 1.85 | 1.03 | 4.49 | 5.55 |
| 3 Beichuan | 4 | 1.85 | 5.11 | 7.45 |
| 4 Qingchuan | 5.71 | 3.49 | 1.85 | 9.3 |
| 5 Mao County | 3.49 | 5.09 | 8.43 | 6.97 |
| 6 Dujiangyan | 1.2 | 2.85 | 6.25 | 4.7 |
| 7 Anxian | 2.45 | 0.33 | 3.57 | 5.93 |
| 8 Pingwu | 5.6 | 3.3 | 4.05 | 8.95 |
| 9 Pengzhou | 0.8 | 1.89 | 5.21 | 4.5 |
| 10 Jiangyou | 3.13 | 0.85 | 2.95 | 6.73 |
| 11 Deyang | 1.45 | 1.05 | 4.5 | 4.8 |
| 12 Ya’an | 2.77 | 5.01 | 8.35 | 2.05 |
| 13 Leshan | 3.53 | 5.81 | 9.17 | 1.43 |
| 14 Baoxing | 4 | 6.33 | 9.59 | 3.33 |
| 15 Ziyang | 2.2 | 3.95 | 7.2 | 2.19 |
The weighting of transportation time and cost in the model can be adjusted by adjusting the parameter input, i.e. whether transportation time or transportation cost is more critical to the site selection results in the site selection model. Now, we will take
The solution will be done with the help of a Matlab software toolbox called Robust Stochastic Optimization Made Easy, an algebraic toolbox for general optimization under uncertainty. After Matlab software calculations, the optimal objective function is 25,193,000 yuan, the total cost of a deterministic model site selection. The specific composition is shown in Table 12 and Figure 6.
Deterministic model site selection total cost composition Unit: 10,000 yuan
| Construction costs | Inventory costs | Transportation costs | Delay penalty cost | Objective function |
|---|---|---|---|---|
| 692 | 1,488 | 689 | 22.1 | 2519.2 |
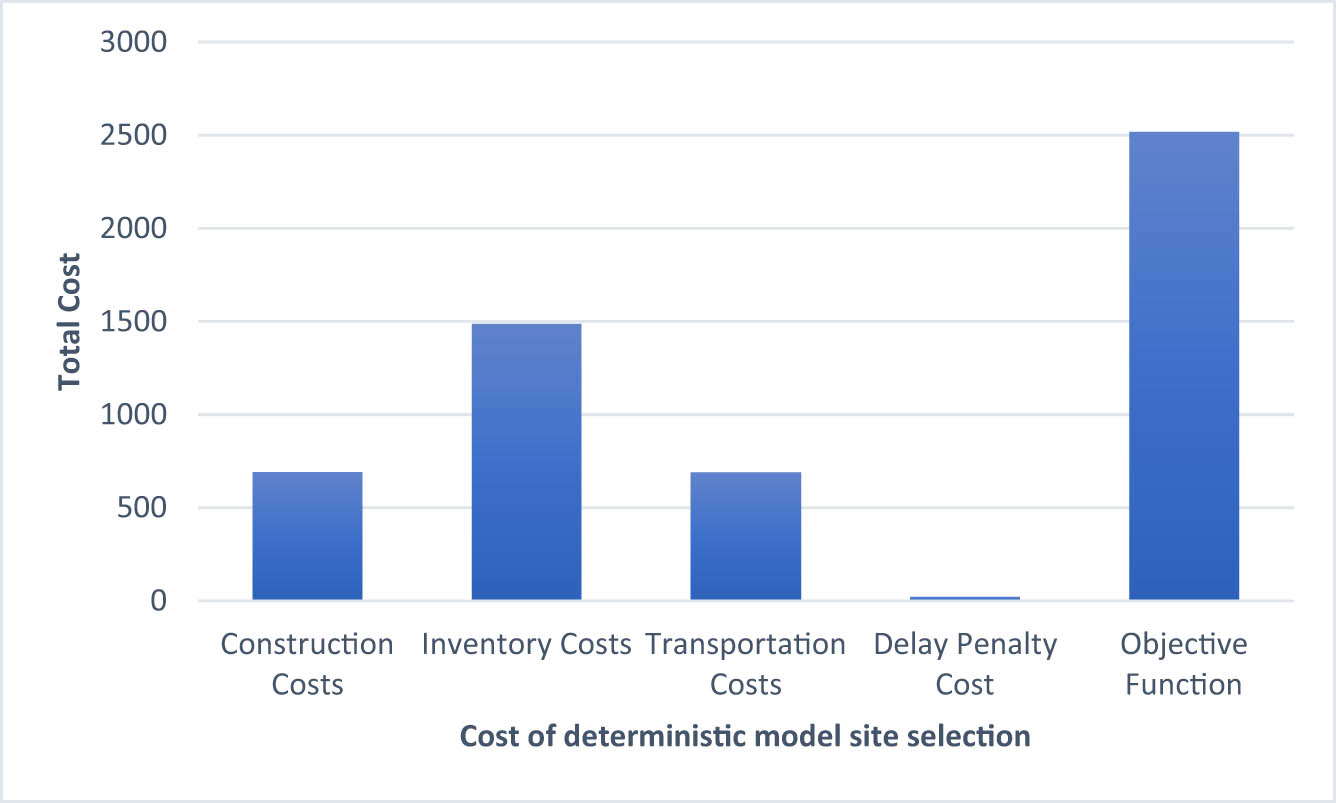
Total cost of deterministic model site selection.
The optimal choice of the emergency logistics centre is shown in Table 13 and Figure 7, where 1 indicates that the location is chosen to establish an emergency logistics centre, and 0 suggests that it is not chosen.
Deterministic model emergency logistics centre selection
| Emergency logistics centre | 1 Chengdu | 2 Mianyang | 3 Guangyuan | 4 Meishan |
|---|---|---|---|---|
| Whether to choose | 1 | 1 | 0 | 1 |
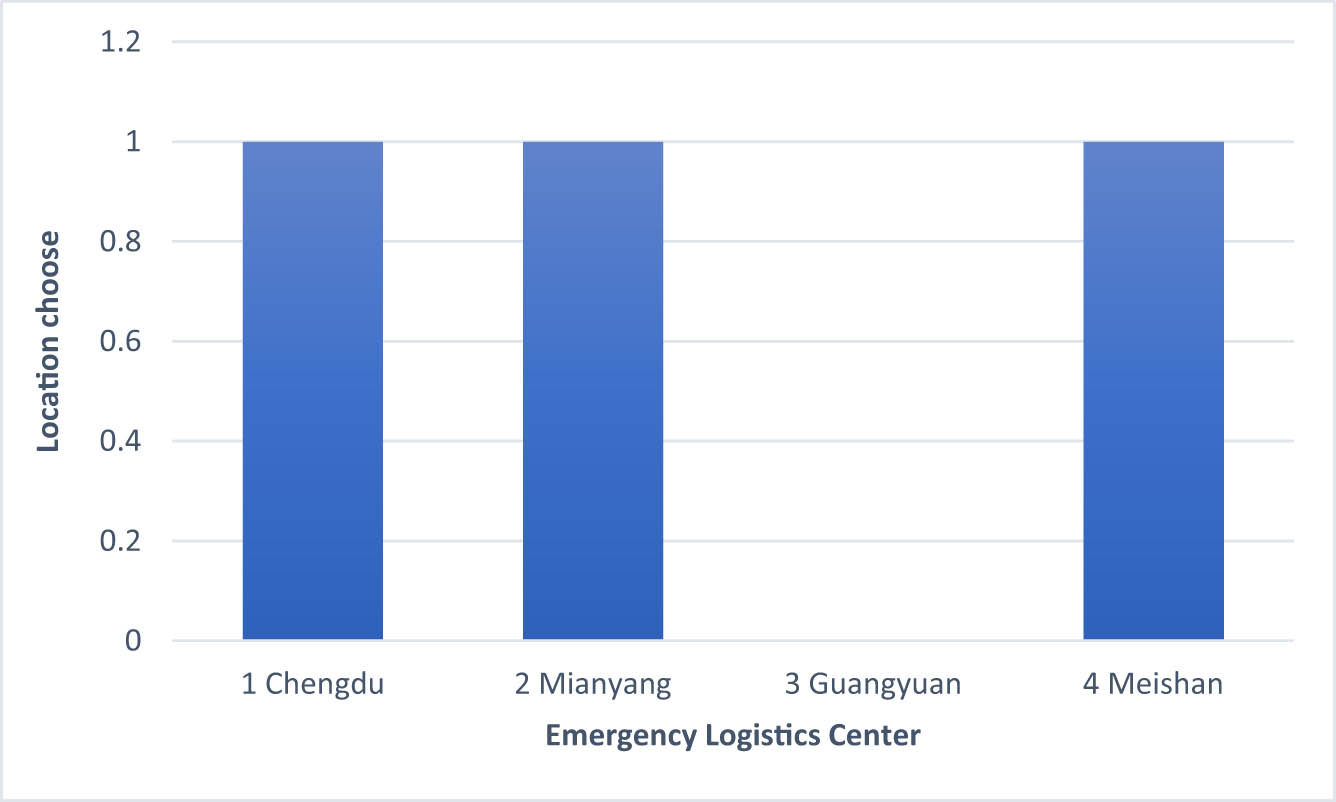
Graphical representation of deterministic model emergency logistics centre selection.
The proportions of needs being met at each emergency material demand point are shown in Table 14.
Proportion of needs met at the point of need for deterministically modelled emergency supplies
| Disaster area
|
Alternative points
|
||
|---|---|---|---|
| 1 Chengdu | 2 Mianyang | 3 Meishan | |
| 1 Wenchuan | 1 | 0 | 1 |
| 2 Mianzhu | 0 | 0 | 1 |
| 3 Beichuan | 0 | 0 | 1 |
| 4 Qingchuan | 0 | 1 | 0 |
| 5 Mao County | 0 | 0 | 0 |
| 6 Dujiangyan | 0 | 0 | 0 |
| 7 Anxian | 1 | 0 | 0 |
| 8 Pingwu | 0 | 1 | 0 |
| 9 Pengzhou | 0 | 1 | 0 |
| 10 Jiangyou | 1 | 0 | 0 |
| 11 Deyang | 1 | 1 | 0 |
| 12 Ya’an | 0 | 0 | 1 |
| 13 Leshan | 0 | 0 | 1 |
| 14 Baoxing | 0 | 1 | 0 |
| 15 Ziyang | 1 | 0 | 0 |
This allows us to determine the volume of emergency supplies the emergency logistics centre will transfer to each location where they are needed and the volume of supplies the centre will stock, as shown in Table 15.
Deterministic model emergency logistics centre to each demand point transport volume Unit: 10,000 pieces
| Disaster area
|
Alternative points
|
||
|---|---|---|---|
| 1 Chengdu | 2 Mianyang | 3 Meishan | |
| 1 Wenchuan | 9 | 0 | 0 |
| 2 Mianzhu | 0 | 47 | 0 |
| 3 Beichuan | 0 | 21 | 0 |
| 4 Qingchuan | 0 | 17 | 0 |
| 5 Mao County | 9 | 0 | 0 |
| 6 Dujiangyan | 66 | 0 | 0 |
| 7 Anxian | 0 | 43 | 0 |
| 8 Pingwu | 0 | 15 | 0 |
| 9 Pengzhou | 79 | 0 | 0 |
| 10 Jiangyou | 0 | 87 | 0 |
| 11 Deyang | 0 | 60 | 0 |
| 12 Ya’an | 0 | 0 | 62 |
| 13 Leshan | 0 | 0 | 110 |
| 14 Baoxing | 0 | 0 | 5 |
| 15 Ziyang | 107 | 0 | 0 |
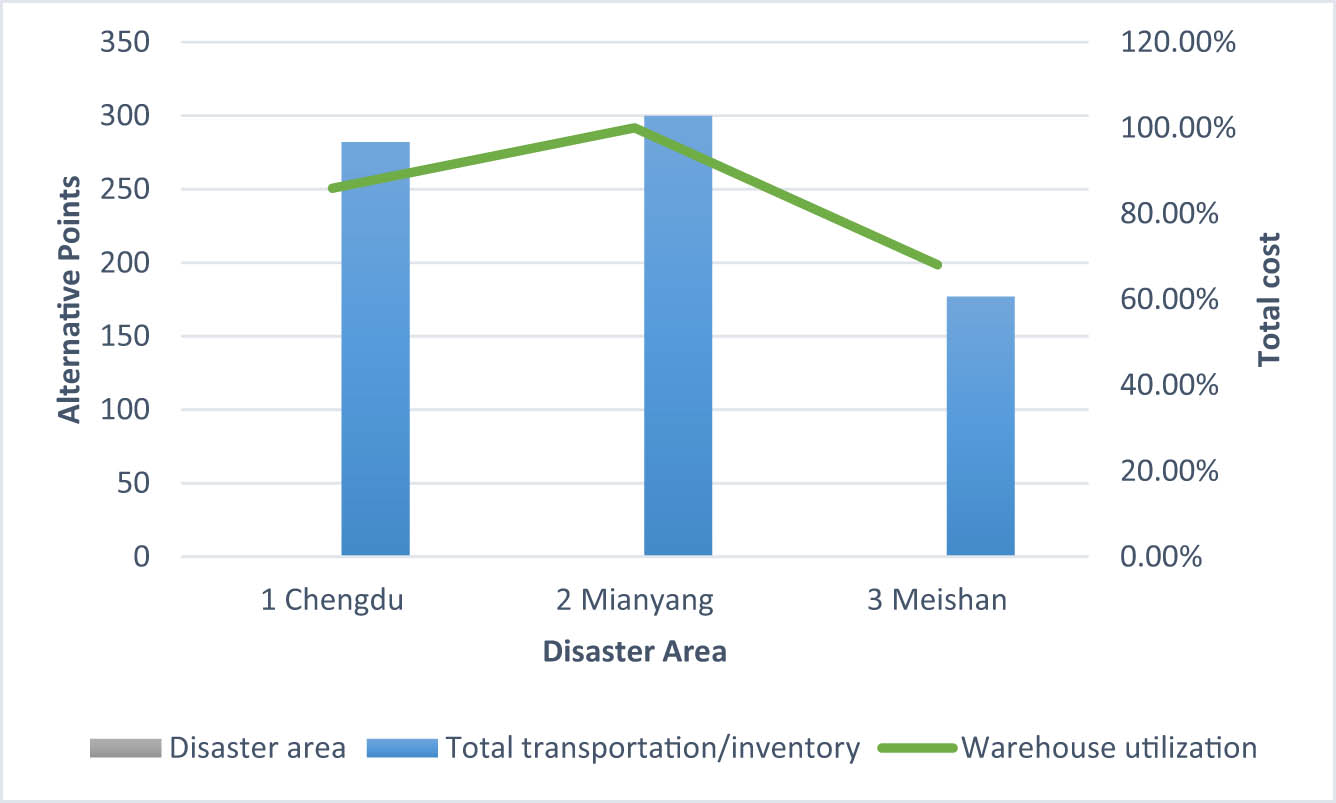
| Total transportation volume | 270 | 290 | 177 |
| Warehouse Utilization | 96.9% | 68.2% | |
5.3.2 Robust Optimization Solution
The parameters the model requires are given in 5.1 and 5.2.1, which are also solved by Matlab programming. Different r is set to adjust the degree of conservatism of the robust optimization so that Γ = 5, the optimal objective function value of 2572.02, robust optimization of the total cost of the site selection of the specific composition of the model, as shown in Table 16, and its graphical representation is shown in Figure 8.
Robust optimization site selection total cost composition Unit: million yuan
| Control level | Construction costs | Inventory costs | Transportation costs | Delay penalty cost | Objective function |
|---|---|---|---|---|---|
| Γ = 5 | 692 | 1,519 | 705.1 | 22.9 | 2572.02 |
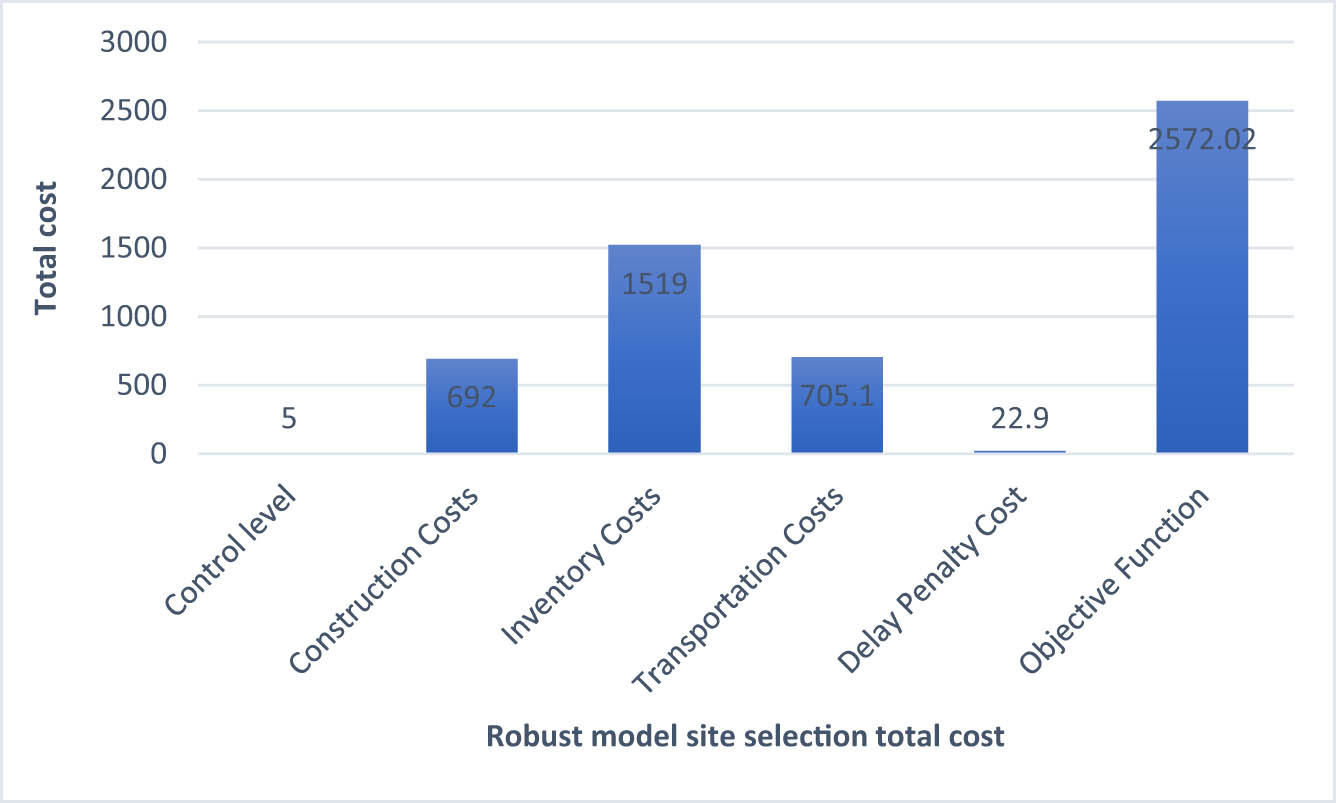
Graphical representation of robust optimization.
The optimal selection of the emergency logistics centre in the robust optimization is shown in Table 17, with 1 indicating that the location is selected to establish the emergency logistics centre and 0 suggesting that it is not specified.
Robust optimization of emergency logistics centre selection
| Emergency logistics centre | 1 Chengdu | 2 Mianyang | 3 Guangyuan | 4 Meishan |
|---|---|---|---|---|
| Whether to choose | 1 | 1 | 0 | 1 |
Table 18 shows the percentage of satisfied demand at each emergency material demand point.
Proportion of emergency material demand point requirements satisfied by robust optimization
| Disaster area
|
Alternative points
|
||
|---|---|---|---|
| 1 Chengdu | 2 Mianyang | 3 Meishan | |
| 1 Wenchuan | 1 | 0 | 0 |
| 2 Mianzhu | 0 | 0 | 0 |
| 3 Beichuan | 0 | 0 | 0 |
| 4 Qingchuan | 0 | 0 | 0 |
| 5 Mao County | 0 | 0 | 1 |
| 6 Dujiangyan | 1 | 1 | 0 |
| 7 Anxian | 0 | 0 | 0 |
| 8 Pingwu | 0 | 0 | 0 |
| 9 Pengzhou | 0 | 0 | 1 |
| 10 Jiangyou | 0 | 1 | 0 |
| 11 Deyang | 1 | 0 | 0 |
| 12 Ya’an | 0 | 0 | 1 |
| 13 Leshan | 0 | 1 | 0 |
| 14 Baoxing | 0 | 0 | 0 |
| 15 Ziyang | 0 | 0 | 1 |
From this, the inventory quantity of the emergency logistics centre can be calculated, as shown in Table 19.
Robust optimization emergency logistics centre to each demand point transport volume Unit: 10,000 pieces
| Disaster area
|
Alternative points
|
||
|---|---|---|---|
| 1 Chengdu | 2 Mianyang | 3 Meishan | |
| Total transportation/inventory | 282 | 300 | 177 |
| Warehouse utilization | 100% | 68.1% | |
Robust Optimal Site Selection Model The optimal site selection scheme and transportation routes are shown in Figure 9.
Graphical representation of inventory quantity of the emergency logistics centre.
5.4 Comparison between the Deterministic Model and Robust Optimization
The above can be derived from the two models of the total site selection composition comparison cost. F = 0 indicates no change in demand; the market is fixed. The model is equivalent to the deterministic site selection model, as shown in Table 20.
Comparison of the total cost of site selection between the two models Unit: 10,000 yuan
| Control level | Construction costs | Inventory costs | Transportation costs | Delay penalty cost | Objective function |
|---|---|---|---|---|---|
| Γ = 0 | 690 | 1,477 | 682 | 21.5 | 2518.8 |
| Γ = 5 | 690 | 1,517 | 705.2 | 23.8 | 2573.02 |
| Γ = 10 | 690 | 1,557 | 725.3122 | 23.8 | 2621.62 |
| Γ = 15 | 690 | 1,597 | 759.411 | 28.9 | 2682.63 |
The cost of building the emergency logistics centre does not change with the increase in control level, as can be seen from comparing the deterministic and robust optimization results. Both models use the same site selection scheme and choose Chengdu, Mianyang, and Meishan as the three locations for constructing the emergency logistics centre. In contrast, the inventory cost, transportation cost, and delayed penalty cost keep increasing with the increase of the number of emergency material demand points with uncertain demand (Boonmee & Kasemset, 2020; Ershadi & Shemirani, 2022).
Table 21 and Figure 10 show that the Mianyang Emergency Logistics Centre utilization is the highest in both models. When the storage capacity of emergency materials in Mianyang Emergency Logistics Centre reaches the upper limit, the emergency materials are preferentially stored in Chengdu Emergency Logistics Centre, i.e. the utilization of Chengdu Emergency Logistics Centre-61N increases faster than the utilization of Meishan Emergency Logistics Centre.
Comparison of the warehouse utilization of two models
| Control level | 1 Chengdu (%) | 2 Mianyang (%) | 3 Meishan (%) |
|---|---|---|---|
| Γ = 0 | 82.2 | 97.2 | 67.8 |
| Γ = 5 | 85.9 | 100 | 67.8 |
| Γ = 10 | 89.2 | 100 | 70.2 |
| Γ = 15 | 94.3 | 100 | 72.4 |
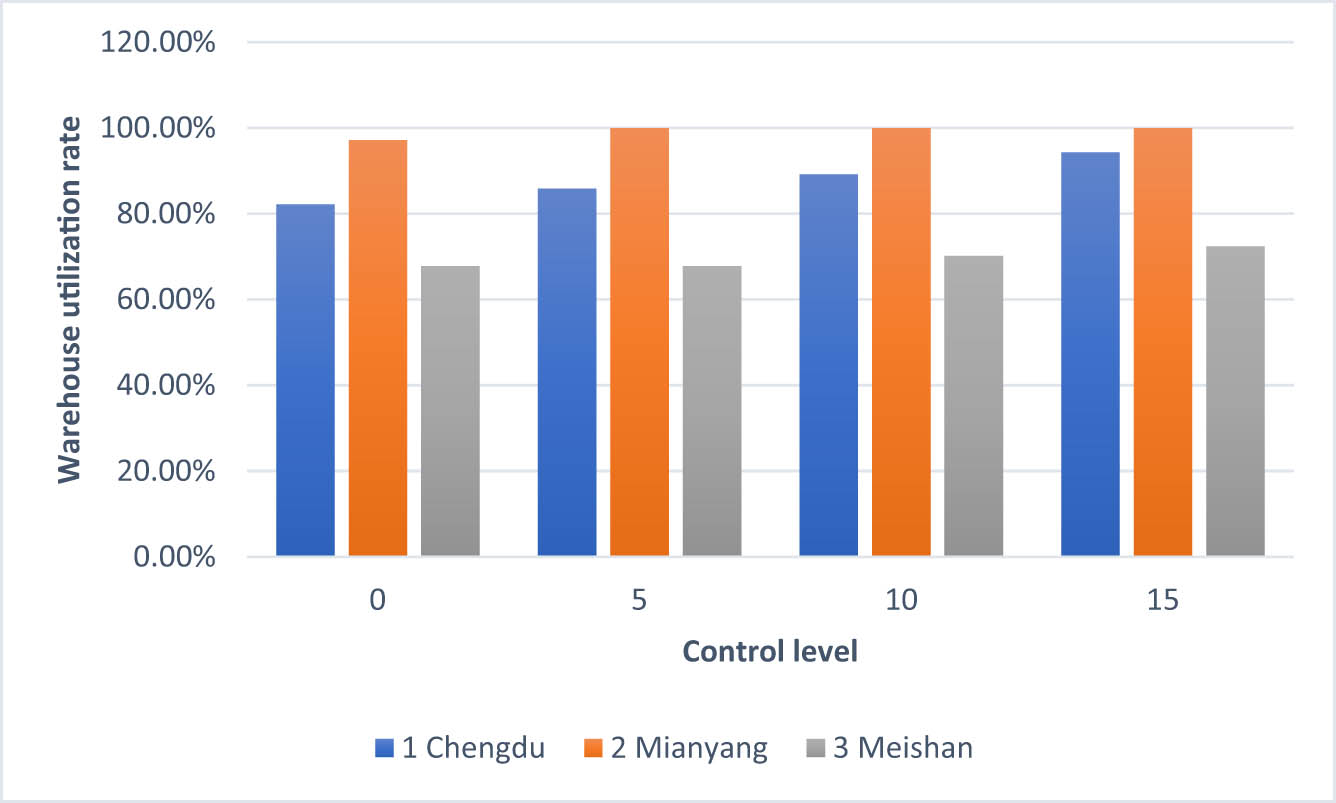
Graphical representation of a comparison of the warehouse utilization of two models.
6 Conclusion
This article considers how to activate the emergency rescue system to carry out emergency rescue operations after a special event, especially a natural disaster. It examines the problems of emergency logistics centre site selection and the corresponding material transfer routes and transfer volumes, incorporating the uncertainties of material demand, transport costs and transport times at the disaster site (demand site) by developing a deterministic multi-objective emergency logistics centre site selection model as well as a robust optimization of multi-objective emergency logistics centre site selection, with the goals of reducing the overall rescue costs as well as the length of time it takes to save people. To transform the bi-objective into a single objective and take into account factors like changes in the order of magnitude of the problem data, a method of transforming the bi-objective into a single objective using the optimal value of a single objective is constructed, which uses a robust optimization for multi-objective emergency logistics centre site selection. A generalized frog jumping algorithm is designed to solve the two models efficiently, and the effectiveness of the model and the algorithm is verified with examples. Based on the results, we discuss the effects of different cost preference weights and robust constraint coefficients and give the rules for setting cost preference weights and the recommended values of robust constraint coefficients in various phases of emergency rescue. However, there are also shortcomings in this study, such as the differences in transportation modes, the road conditions or interruptions of rescue roads, the number and capacity constraints of material carriers, and the price factors of collecting emergency materials in different rescue phases, etc., which approach to further research on the location of emergency logistics centres will be practical. For complicated issues in unpredictable contexts, the article presents a hybrid frog-hopping algorithm and a resilient multi-objective optimization for emergency logistics. It also improves planning and organization programs by balancing robustness and efficiency.
Acknowledgements
The author sincerely acknowledges the existence of the techniques that contributed to this research.
-
Funding information: This work was supported by the Chaohu University Discipline Construction Quality Improvement Project” Digital Financial Technology Innovation and Service Team around Chaohu Lake” (kj22kctd03).
-
Author contributions: Quan Gan is responsible for designing the framework, analysing performance, validating the results, and writing the article.
-
Conflict of interest: The author states no conflicts of interest.
-
Data availability statement: The experimental data used to support the findings of this study are available from the corresponding author upon request.
-
Article note: As part of the open assessment, reviews and the original submission are available as supplementary files on our website.
References
Arshad, M. A., Mahmood, A., Shabbir, M. S., Siddiqi, A. F., Abbas, M., & Sleimany, G. (2022). Modelling a multi-objective problem for emergency response in disaster management: emphasizing the impact of the delay in the severity of the crisis. International Journal of Services and Operations Management, 41(1–2), 224–240.10.1504/IJSOM.2022.121690Search in Google Scholar
Beiki, H., Seyedhosseini, S. M., Ghezavati, V. R., & Seyedaliakbar, S. M. (2020). Multi-objective optimization-vehicle relief logistics considering satisfaction levels under uncertainty. International Journal of Engineering, 33(5), 814–824.Search in Google Scholar
Boonmee, C., & Kasemset, C. (2020). The multi-objective fuzzy mathematical programming model for humanitarian relief logistics. Industrial Engineering & Management Systems, 19(1), 197–210.10.7232/iems.2020.19.1.197Search in Google Scholar
Caglayan, N., & Satoglu, S. I. (2021). Multi-objective two-stage stochastic programming model for a proposed casualty transportation system in large-scale disasters: A case study. Mathematics, 9(4), 316.10.3390/math9040316Search in Google Scholar
de Veluz, M. R. D., Redi, A. A. N. P., Maaliw III, R. R., Persada, S. F., Prasetyo, Y. T., & Young, M. N. (2023). Scenario-based multi-objective location-routing model for pre-disaster planning: A philippine case study. Sustainability, 15(6), 4882.10.3390/su15064882Search in Google Scholar
Ershadi, M. M., & Shemirani, H. S. (2022). A multi-objective optimization for logistic planning in the crisis response phase. Journal of Humanitarian Logistics and Supply Chain Management, 12(1), 30–53.10.1108/JHLSCM-11-2020-0108Search in Google Scholar
Eshghi, A. A., Tavakkoli-Moghaddam, R., Ebrahimnejad, S., & Ghezavati, V. R. (2022). Multi-objective robust mathematical modelling of emergency relief in disaster under uncertainty. Scientia Iranica, 29(5), 2670–2695.Search in Google Scholar
Ghasemi, P., Goodarzian, F., & Abraham, A. (2022). A new humanitarian relief logistic network for multi-objective optimization under stochastic programming. Applied Intelligence, 52(12), 13729–13762.10.1007/s10489-022-03776-xSearch in Google Scholar
Ghasemi, P., Khalili-Damghani, K., Hafezalkotob, A., & Raissi, S. (2019). Uncertain multi-objective multi-commodity multi-period multi-vehicle location-allocation model for earthquake evacuation planning. Applied Mathematics and Computation, 350, 105–132.10.1016/j.amc.2018.12.061Search in Google Scholar
He, L., & Xie, Z. (2022). Optimization of urban shelter locations using a bi-level multi-objective location-allocation model. International Journal of Environmental Research and Public Health, 19(7), 4401.10.3390/ijerph19074401Search in Google Scholar
Hong, J. D., & Jeong, K. Y. (2019). Humanitarian supply chain network design using data envelopment analysis and multi-objective programming models. European Journal of Industrial Engineering, 13(5), 651–680.10.1504/EJIE.2019.102158Search in Google Scholar
Jamali, A., Ranjbar, A., Heydari, J., & Nayeri, S. (2022). A multi-objective stochastic programming model to configure a sustainable humanitarian logistics considering deprivation cost and patient severity. Annals of Operations Research, 319, 1265–1300.10.1007/s10479-021-04014-2Search in Google Scholar
Ji, X., & Fu, S. (2023). Modelling multi-objective optimization updating information on humanitarian response to flood disasters. Water, 15(11), 2122.10.3390/w15112122Search in Google Scholar
Karatas, M., & Yakıcı, E. (2021). A multi-objective location analytics model for temporary emergency service centre location decisions in disasters. Decision Analytics Journal, 1, 100004.10.1016/j.dajour.2021.100004Search in Google Scholar
Khanchehzarrin, S., Panah, M. G., Mahdavi-Amiri, N., & Shiripour, S. (2022). A bi-level multi-objective location-routing optimization for disaster relief operations considering public donations. Socio-Economic Planning Sciences, 80, 101165.10.1016/j.seps.2021.101165Search in Google Scholar
Liu, K. (2020). Post-earthquake medical evacuation system design based on hierarchical multi-objective optimization An earthquake case study. International Journal of Disaster Risk Reduction, 51, 101785.10.1016/j.ijdrr.2020.101785Search in Google Scholar
Ma, Y., Liu, B., Zhang, K., & Yang, Y. (2022). Incorporating multi-criteria suitability evaluation into multi-objective location–allocation optimizations for earthquake emergency shelters. Geomatics, Natural Hazards and Risk, 13(1), 2333–2355.10.1080/19475705.2022.2118623Search in Google Scholar
Maharjan, R., & Hanaoka, S. (2020). A credibility-based multi-objective temporary logistics hub location-allocation model for relief supply and distribution under uncertainty. Socio-Economic Planning Sciences, 70, 100727.10.1016/j.seps.2019.07.003Search in Google Scholar
Men, J., Jiang, P., Zheng, S., Kong, Y., Zhao, Y., Sheng, G., & Zheng, S. (2019). A multi-objective emergency rescue facilities location model for catastrophic interlocking chemical accidents in chemical parks. IEEE Transactions on Intelligent Transportation Systems, 21(11), 4749–4761.10.1109/TITS.2019.2946209Search in Google Scholar
Pourghader Chobar, A., Sabk Ara, M., Moradi Pirbalouti, S., Khadem, M., & Bahrami, S. (2022). A multi-objective location-routing problem model for multi-device relief logistics under uncertainty using meta-heuristic algorithm. Journal of Applied Research on Industrial Engineering, 9(3), 354–373.Search in Google Scholar
Shariat Mohaymany, A., & Nikoo, N. (2020). Designing large-scale disaster response routes network in mitigating earthquake risk using a multi-objective stochastic approach. KSCE Journal of Civil Engineering, 24(10), 3050–3063.10.1007/s12205-020-1844-xSearch in Google Scholar
Sicuaio, T., Niyomubyeyi, O., Shyndyapin, A., Pilesjö, P., & Mansourian, A. (2022). Multi-objective optimization using evolutionary cuckoo search algorithm for evacuation planning. Geomatics, 2(1), 53–75.10.3390/geomatics2010005Search in Google Scholar
Wan, M., Ye, C., & Peng, D. (2023). Multi-period dynamic multi-objective emergency material distribution model under uncertain demand. Engineering Applications of Artificial Intelligence, 117, 105530.10.1016/j.engappai.2022.105530Search in Google Scholar
Yalla, R. K. M. K. (2021). Cloud-based attribute-based encryption and big data for safeguarding financial data. International Journal of Engineering Research and Science & Technology, 14(3), 18–28.10.62643/ijerst.2021.v17.i03.pp18-28Search in Google Scholar
Yang, J., Sivaparthipan, C. B., & Muthu, B. (2021). Dynamic distributed iterative computational model for payment information management in shared logistics using blockchain-assisted Internet of Things approach. Soft Computing, 25(18), 12439–12451.10.1007/s00500-021-05960-6Search in Google Scholar
Yenice, Z. D., & Samanlioglu, F. (2020). A multi-objective stochastic model for an earthquake relief network. Journal of Advanced Transportation, 2020, 1–15.10.1155/2020/1910632Search in Google Scholar
Zafari, F., & Shishebori, D. (2019). Designing a multi-objective three-stage location-routing model for humanitarian logistic planning under uncertainty. Advances in Industrial Engineering, 53(4), 149–167.Search in Google Scholar
Zahedi, A., Kargari, M., & Kashan, A. H. (2020). Multi-objective decision-making model for distribution planning of goods and routing of vehicles in emergency multi-objective decision-making model for distribution planning of goods and routing of vehicles in emergency. International Journal of Disaster Risk Reduction, 48, 101587.10.1016/j.ijdrr.2020.101587Search in Google Scholar
Zheng, F., Du, L., Li, X., Zhang, J., Tian, B., & Jallad, R. F. (2023). Multi-objective medical supplies distribution opens vehicle routing problems with fairness and timeliness under major public health emergencies. Management System Engineering, 2(1), 5.10.1007/s44176-023-00015-6Search in Google Scholar
Zhou, J., Pang, L., Zhang, D., & Zhang, W. (2023). Underwater image enhancement method by multi-interval histogram equalizequalization. Journal of Oceanic Engineering, 48(2), 474–488.10.1109/JOE.2022.3223733Search in Google Scholar
Zhou, J., Sun, J., Zhang, W., & Lin, Z. (2023). Multi-view underwater image enhancement method via embedded fusion mechanism. Engineering Applications of Artificial Intelligence, 121, 105946.10.1016/j.engappai.2023.105946Search in Google Scholar
© 2024 the author(s), published by De Gruyter
This work is licensed under the Creative Commons Attribution 4.0 International License.
Articles in the same Issue
- Regular Articles
- Political Turnover and Public Health Provision in Brazilian Municipalities
- Examining the Effects of Trade Liberalisation Using a Gravity Model Approach
- Operating Efficiency in the Capital-Intensive Semiconductor Industry: A Nonparametric Frontier Approach
- Does Health Insurance Boost Subjective Well-being? Examining the Link in China through a National Survey
- An Intelligent Approach for Predicting Stock Market Movements in Emerging Markets Using Optimized Technical Indicators and Neural Networks
- Analysis of the Effect of Digital Financial Inclusion in Promoting Inclusive Growth: Mechanism and Statistical Verification
- Effective Tax Rates and Firm Size under Turnover Tax: Evidence from a Natural Experiment on SMEs
- Re-investigating the Impact of Economic Growth, Energy Consumption, Financial Development, Institutional Quality, and Globalization on Environmental Degradation in OECD Countries
- A Compliance Return Method to Evaluate Different Approaches to Implementing Regulations: The Example of Food Hygiene Standards
- Panel Technical Efficiency of Korean Companies in the Energy Sector based on Digital Capabilities
- Time-varying Investment Dynamics in the USA
- Preferences, Institutions, and Policy Makers: The Case of the New Institutionalization of Science, Technology, and Innovation Governance in Colombia
- The Impact of Geographic Factors on Credit Risk: A Study of Chinese Commercial Banks
- The Heterogeneous Effect and Transmission Paths of Air Pollution on Housing Prices: Evidence from 30 Large- and Medium-Sized Cities in China
- Analysis of Demographic Variables Affecting Digital Citizenship in Turkey
- Green Finance, Environmental Regulations, and Green Technologies in China: Implications for Achieving Green Economic Recovery
- Coupled and Coordinated Development of Economic Growth and Green Sustainability in a Manufacturing Enterprise under the Context of Dual Carbon Goals: Carbon Peaking and Carbon Neutrality
- Revealing the New Nexus in Urban Unemployment Dynamics: The Relationship between Institutional Variables and Long-Term Unemployment in Colombia
- The Roles of the Terms of Trade and the Real Exchange Rate in the Current Account Balance
- Cleaner Production: Analysis of the Role and Path of Green Finance in Controlling Agricultural Nonpoint Source Pollution
- The Research on the Impact of Regional Trade Network Relationships on Value Chain Resilience in China’s Service Industry
- Social Support and Suicidal Ideation among Children of Cross-Border Married Couples
- Asymmetrical Monetary Relations and Involuntary Unemployment in a General Equilibrium Model
- Job Crafting among Airport Security: The Role of Organizational Support, Work Engagement and Social Courage
- Does the Adjustment of Industrial Structure Restrain the Income Gap between Urban and Rural Areas
- Optimizing Emergency Logistics Centre Locations: A Multi-Objective Robust Model
- Geopolitical Risks and Stock Market Volatility in the SAARC Region
- Trade Globalization, Overseas Investment, and Tax Revenue Growth in Sub-Saharan Africa
- Can Government Expenditure Improve the Efficiency of Institutional Elderly-Care Service? – Take Wuhan as an Example
- Media Tone and Earnings Management before the Earnings Announcement: Evidence from China
- Review Articles
- Economic Growth in the Age of Ubiquitous Threats: How Global Risks are Reshaping Growth Theory
- Efficiency Measurement in Healthcare: The Foundations, Variables, and Models – A Narrative Literature Review
- Rethinking the Theoretical Foundation of Economics I: The Multilevel Paradigm
- Financial Literacy as Part of Empowerment Education for Later Life: A Spectrum of Perspectives, Challenges and Implications for Individuals, Educators and Policymakers in the Modern Digital Economy
- Special Issue: Economic Implications of Management and Entrepreneurship - Part II
- Ethnic Entrepreneurship: A Qualitative Study on Entrepreneurial Tendency of Meskhetian Turks Living in the USA in the Context of the Interactive Model
- Bridging Brand Parity with Insights Regarding Consumer Behavior
- The Effect of Green Human Resources Management Practices on Corporate Sustainability from the Perspective of Employees
- Special Issue: Shapes of Performance Evaluation in Economics and Management Decision - Part II
- High-Quality Development of Sports Competition Performance Industry in Chengdu-Chongqing Region Based on Performance Evaluation Theory
- Analysis of Multi-Factor Dynamic Coupling and Government Intervention Level for Urbanization in China: Evidence from the Yangtze River Economic Belt
- The Impact of Environmental Regulation on Technological Innovation of Enterprises: Based on Empirical Evidences of the Implementation of Pollution Charges in China
- Environmental Social Responsibility, Local Environmental Protection Strategy, and Corporate Financial Performance – Empirical Evidence from Heavy Pollution Industry
- The Relationship Between Stock Performance and Money Supply Based on VAR Model in the Context of E-commerce
- A Novel Approach for the Assessment of Logistics Performance Index of EU Countries
- The Decision Behaviour Evaluation of Interrelationships among Personality, Transformational Leadership, Leadership Self-Efficacy, and Commitment for E-Commerce Administrative Managers
- Role of Cultural Factors on Entrepreneurship Across the Diverse Economic Stages: Insights from GEM and GLOBE Data
- Performance Evaluation of Economic Relocation Effect for Environmental Non-Governmental Organizations: Evidence from China
- Functional Analysis of English Carriers and Related Resources of Cultural Communication in Internet Media
- The Influences of Multi-Level Environmental Regulations on Firm Performance in China
- Exploring the Ethnic Cultural Integration Path of Immigrant Communities Based on Ethnic Inter-Embedding
- Analysis of a New Model of Economic Growth in Renewable Energy for Green Computing
- An Empirical Examination of Aging’s Ramifications on Large-scale Agriculture: China’s Perspective
- The Impact of Firm Digital Transformation on Environmental, Social, and Governance Performance: Evidence from China
- Accounting Comparability and Labor Productivity: Evidence from China’s A-Share Listed Firms
- An Empirical Study on the Impact of Tariff Reduction on China’s Textile Industry under the Background of RCEP
- Top Executives’ Overseas Background on Corporate Green Innovation Output: The Mediating Role of Risk Preference
- Neutrosophic Inventory Management: A Cost-Effective Approach
- Mechanism Analysis and Response of Digital Financial Inclusion to Labor Economy based on ANN and Contribution Analysis
- Asset Pricing and Portfolio Investment Management Using Machine Learning: Research Trend Analysis Using Scientometrics
- User-centric Smart City Services for People with Disabilities and the Elderly: A UN SDG Framework Approach
- Research on the Problems and Institutional Optimization Strategies of Rural Collective Economic Organization Governance
- The Impact of the Global Minimum Tax Reform on China and Its Countermeasures
- Sustainable Development of Low-Carbon Supply Chain Economy based on the Internet of Things and Environmental Responsibility
- Measurement of Higher Education Competitiveness Level and Regional Disparities in China from the Perspective of Sustainable Development
- Payment Clearing and Regional Economy Development Based on Panel Data of Sichuan Province
- Coordinated Regional Economic Development: A Study of the Relationship Between Regional Policies and Business Performance
- A Novel Perspective on Prioritizing Investment Projects under Future Uncertainty: Integrating Robustness Analysis with the Net Present Value Model
- Research on Measurement of Manufacturing Industry Chain Resilience Based on Index Contribution Model Driven by Digital Economy
- Special Issue: AEEFI 2023
- Portfolio Allocation, Risk Aversion, and Digital Literacy Among the European Elderly
- Exploring the Heterogeneous Impact of Trade Agreements on Trade: Depth Matters
- Import, Productivity, and Export Performances
- Government Expenditure, Education, and Productivity in the European Union: Effects on Economic Growth
- Replication Study
- Carbon Taxes and CO2 Emissions: A Replication of Andersson (American Economic Journal: Economic Policy, 2019)