Analysis of a New Model of Economic Growth in Renewable Energy for Green Computing
-
Yunan Long


Abstract
Energy consumption, which works as the physical engine of economic development, significantly influences the environment; using renewable energy, which originates from naturally filled resources, helps mitigate these adverse effects. The high price of fossil fuels, carbon dioxide emissions, and electricity generation are the most difficult aspects of this kind of renewable energy, which is often regarded as one of the main factors holding back economic progress. An artificial neural network-enabled economic growth model (ANN-EGM) has been constructed in this research to predict the restraining and pushing energy variables that impede economic growth. ANN-EGM optimizes the limiting and driving energy forces, which helps to improve the use of renewable energy and assist the economy’s growth. The prominent enhancement in driving economic activity and employment rates may result in cost-effective improvement for the effective production of energy from renewable resources for green computing. The proposed article constructs an ANN-EGM and examines its topological structure and the effect of training errors the network allows on its performance to address issues in green computing technology and sustainable social and economic development. Conventional approaches based on liming and driving energy forces are predicted to be less successful than an ANN-EGM in predicting the increase of the renewable energy industry for green computing and its correlation with quicker economic growth. The study’s findings suggest that the ANN-EGM can accurately forecast and verify the limiting and driving factors in renewable energy generation. The experimental outcome demonstrates that the proposed ANN-EGM model increases the prediction ratio by 85.6% and the performance ratio by 86.4% and has a reduced mean square error rate of 10.1% compared to other existing methods.
1 Introduction
In recent times, renewable energy usage has significantly impacted fossil fuel reduction. Empirical investigations on economic growth factors have been focused on in this research based on renewable energy resources for the production of energy (He et al., 2019). The impact of energy usage on rising renewable energy resources, energy production, and consumption patterns using various statistical models has been focused on (Dogan et al., 2020). Researchers have emphasized the importance of green bonds in financing green projects that aid in the transition to a low-carbon economy and create net-zero emissions. (Wang et al., 2021). Thus, (Eren et al., 2019), researchers investigate the current condition of using renewable energy and the efforts to develop solar photovoltaic (PV) technology to satisfy electricity needs in a low-carbon fashion.
Green computing aims to reduce the environmental impact of the IT sector and its supporting businesses. Green computing is the practice of reducing the negative effects of technology on the environment by making more efficient use of existing resources. It is the process of making the most eco-friendly and economical use of computer resources possible. Some possible Green computing options are power management, energy efficiency, economic growth, and the cloud. The effectiveness of green programs at universities depends on students understanding and embracing of the ideas being taught. Green Computing has many advantages for the environment and the bottom line, but there has to be more education and outreach for people to learn about them.
Green computing has far-reaching, far-ranging, and far-regional effects; its potential effects on the solar energy-generating business may have a bearing on economic growth (Adebayo & Kirikkaleli, 2021). The primary objective is to analyze and evaluate the most pressing issues associated with using renewable energy sources for liming and driving (Usman & Hammar, 2021; Zhou et al., 2020). Economic growth showed that green finance, capital creation, and government educational spending positively correlate with economic growth (Charfeddine & Kahia, 2019). However, governments worldwide make many efforts to boost the economy by investing heavily in economically productive areas (Rita et al., 2021). In addition, the Auto-Regressive Distributed Lag (ARDL) model and Rolling Window Approach (RWA) are used to their fullest potential to boost economic growth (Shahbaz et al., 2015). For green computing to be a just and inclusive transition, a strong economic development model must consider social and equitable factors. A large portion of society should be able to take advantage of the perks of green computing and renewable energy. Promoting affordable access to energy-efficient equipment, particularly in deprived or marginalized populations, may require the development of laws and incentives.
Zhang et al. (2021) in the empirical data suggest that the usage of renewable energy may continue the economic development process. The accuracy of artificial neural network models compared to statistical approaches presents the development of a multilayer artificial neural network model (Aydoğan & Vardar, 2020). The ANN-based approach links the effect of the parameters on renewable energy generation based on accuracy and effectiveness in mapping the intricate connection between traffic flows and the response measures (Shao et al., 2021). The neural network approach’s integrated data-driven models help improve energy efficiency using renewable energy resources (Rahman et al., 2021). Unauthorized access, unsecured communications, and data breaches are potential outcomes of the growth of IoT devices, which introduces risks. Internet-of-Things (IoT) devices and networks are vulnerable to threats such as unauthorized software upgrades, unsecured communication protocols, and improper authentication and authorization (Luqman et al., 2019). As the number of people using mobile devices and wireless networks continues to rise, researchers in the area of communication engineering are devoting more and more time and energy to studying mobile ad hoc networks (Gunjan et al., 2019). Cloud computing’s highly dynamic, dispersed, and transparent architecture makes trust management an enormous challenge (Govindaraj et al., 2021). Utilizing renewable energy sources to power information technology (IT) facilities and data centres is a promising step towards a more sustainable green computing environment. One major step in lessening the IT industry’s environmental impact has been incorporating renewable energy sources like solar, wind, and hydroelectric power. Hydroelectric devices use the flow of water to produce power, wind turbines harness the force of the wind, and solar panels collect the sun’s abundant energy. Using these renewable energy sources helps data centres and IT buildings reduce carbon emissions and positively impact green computing and the environment for the future. The transition towards renewable energy sources is more than a technical development; it represents a dedication to modern-day environmental protection.
Based on the above discussion, the challenging characteristic of improving the limiting and driving energy forces using the Artificial Neural network-enabled Economic Growth Model (ANN-EGM) has been designed. The new economic development model in renewable energy for green computing relies on the idea that economically significant computing processes may be made more sustainable and environmentally friendly by embedding these practices at their core. The model’s goal is to promote economic development while reducing the negative effects of information technology on the environment.
The main objectives of the article:
Providing a framework for discussing energy’s role in economic expansion in renewable energy for green computing. A block structure was devised based on fossil fuel cost, CO2 emission, and electricity output.
The artificial Neural network-enabled Economic Growth Model (ANN-EGM) has been designed and developed to validate the economic growth factor based on energy production from renewable sources for green computing.
The experimental result has been validated with conventional counterparts regarding performance, accuracy, prediction ratio, and mean square error rate.
The rest of the research is organized as follows: Section 2 provides a literature review of studies which examines the effectiveness of the current approach, Section 3 proposes a strategy for ANN-EGM and its impacts, Section 4 presents an experimental analysis, and Section 5 gives a conclusion along with future perspectives.
2 Related Works
Goel et al. (2021) introduced the productivity and national economic development model based on reliable supply chains (RSC). The challenges during the coronavirus outbreak have brought the importance of the supply chain for the effective improvement of economic growth factors. In addition, the author needs to focus on economic growth factors based on input and output facets of energy performance in correlation with quantitative variations. Apergis and Apergis (2021) proposed the Bayesian Panel Vector Autoregressive (BPVAR) approach to estimate industrial energy production. The findings demonstrate the significance of industrial energy production as influenced by green computing. Here, the authors failed to produce an effective model to reduce the cost of fossil fuels, CO2 emission, and power production during the COVID-19 pandemic. Soava et al. (2021) reported Gross Domestic Product (GDP) and energy consumption during the COVID-19 pandemic. The study confirms that the shock of falling activity severely impacted energy consumption and GDP due to the pandemic before recovering. The authors used a linear regression model to determine the long-term connections between GDP and residential and commercial power use updates, leading to less energy production during the pandemic. Sueyoshi et al., (2021) detailed a tool called Data Envelopment Analysis for Environmental Assessment (DEA-EA) and compared OECD (Organization for Economic Co-operation and Development) during the outbreak. This investigation reported undesirable and desirable outcomes as the introductory stage in the DEA-EA. The outcomes include the number of confirmed cases and fatalities. This means that even the top-performing nations must plan for a long-term commitment to the transition to clean, renewable energy. Wang and Wang (2020) proposed panel threshold regression models (PTRM) that were used to explore the non-linear connection between renewable energy and economic development in OECD nations. In existing research, the linear association between renewable energy and GDP expansion is the primary research focus in this area. This finding suggests that increasing our usage of renewable energy sources will positively influence our national economy. Saidi and Omri (2020) detailed Fully Modified Ordinary Least Square (FMOLS) estimation techniques for renewable energy production for effective economic growth. The importance of renewable energy in restoring ecological and economic equilibrium is rising rapidly as a growth element. This study aims to show that renewable energy benefits economic development and reduces carbon emissions by combining growth and environmental roles. Mohsin et al. (2022) introduce a relationship between governmental spending on R&D, renewable energy deployment, and GEG in the Economic Community of West African States (ECOWAS) from 1990 to 2018. The research used a data envelopment analysis (DEA) estimate approach. This study shows that if ECOWAS nations spent more money on education, research, and development into renewable energy sources, the world would benefit from lower carbon growth enabled by more sophisticated manufacturing techniques. Wang et al. (2021) proposed the ARDL-PMG model to investigate the long- and short-term effects of economic growth and financial development on renewable energy consumption for green computing. The findings of the causality tests show a unidirectional causal link between China’s overall and eastern China’s financial growth and the use of renewable energy. Our empirical findings suggest several measures that might be taken to aid in expanding the renewable energy industry.
From the earlier discussion, challenging characteristics such as the cost of fossil fuels, CO2 emission, and power production are taken into consideration as the significant limiting and driving have not been predicted using conventional methods such as (Apergis & Apergis, 2021; Mohsin et al., 2022; Sueyoshi et al., 2021; Wang & Wang, 2020). Further, this research discusses the Artificial Neural Network-enabled Economic Growth Model (ANN-EGM), which helps to predict the limiting and driving energy forces in terms of performance, accuracy, prediction ratio, and mean square error rate.
3 Artificial Neural Network Enabled Economic Growth Model and its Discussion
3.1 Energy Generation Strategy
Energy generation from renewable sources positively correlates with economic growth for green computing. The economic growth factor is validated based on energy from renewable sources discussed below.
Figure 1 illustrates the energy generation strategy to incorporate renewable sources of power that are essential due to the worldwide crises caused by carbon emissions. Many nations’ policies for energy security now emphasize the integration of renewable energy sources into the energy sector for economic growth. One of the sustainable goals is to boost renewable energy use for efficient power generation of energy. The article explores how developing green computing technologies might sustainably help the social economy grow. The green technology, including green computing, describes the ecologically conscious use of computing and other technological resources. The challenging characteristic of such renewable energy for green computing is that the cost of fossil fuels, CO2 emission, and power production are the major limiting forces to slow economic growth. There is a positive relationship between energy usage, inflation, and GDP, even though energy intensity has dropped over time and is often lower in wealthier countries. Energy efficiency is one of several elements that influence the energy intensity of economic growth factors using green computing, as shown in Figure 1.
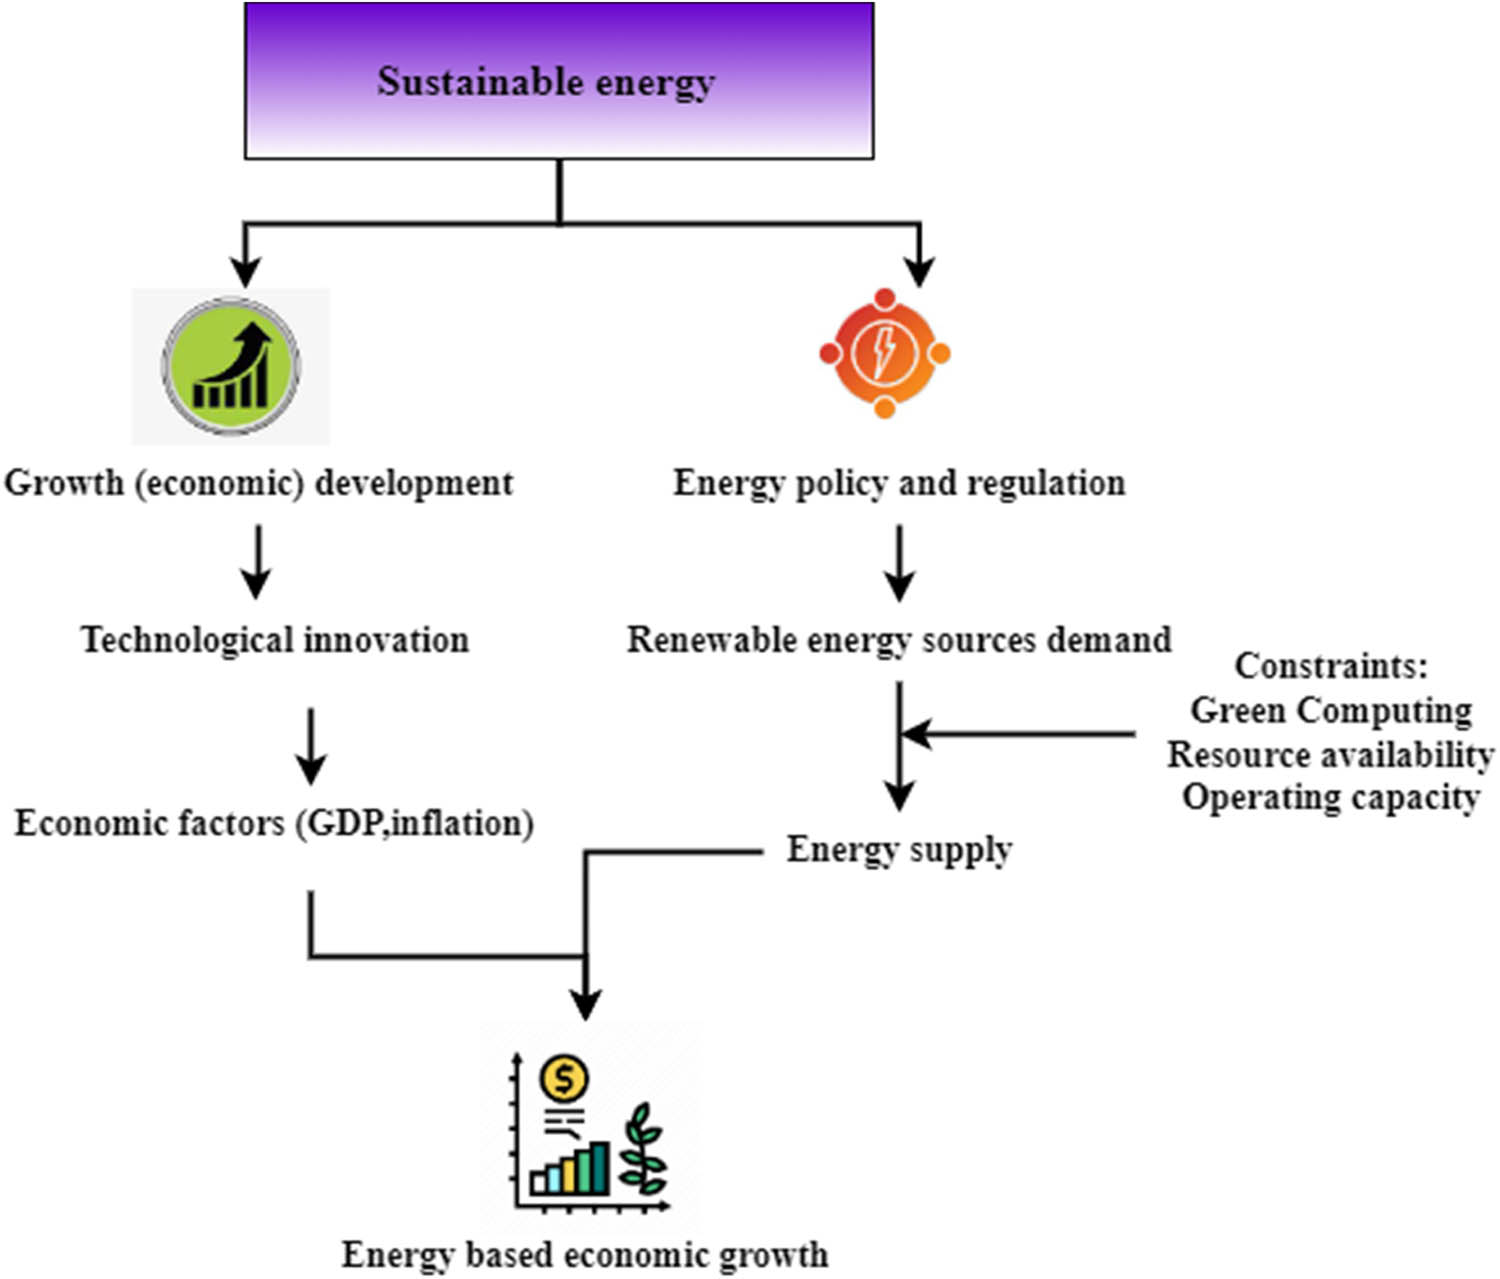
Effective Prediction and validation of Energy-based economic growth.
3.2 Renewable Energy Production Development (REPD)
Further, the renewable energy limiting and driving factors for green computing are discussed in Figure 2a and b for the economic growth factors has been discussed as follows. The geological and climatic features of many locations are unique. The viability and appropriateness of renewable energy sources, including solar, wind, hydro, and geothermal power, must be considered. The model must be adjusted to maximize a region’s rich and practically viable renewable resources.

(a) Limiting forces for the REPD and (b) driving forces for REPD.
Figure 2a illustrates technological advancements and effective legislative frameworks; renewable energy sources are now inexpensive. Various variables might influence the likelihood that a government will implement a Renewable Energy Sources (RESs) policy that affects several elements such as the cost of fossil fuels, CO2 emission, and power production. The degree to which these elements play a role is influenced by a nation’s institutional, technological, and economic development. RES deployment is crucial to address energy needs. Green computing for RES is the practical use of environmental science to protect Earth and sustainably exploit its abundant biological diversity and pristine ecosystems. Energy may be produced from renewable sources with green computing technology. The goal of green technology is to lessen environmental pollution by eliminating or mitigating sources of pollution. In Figure 2, the development and penetration of Renewable Energy Production Development (REPD) are hampered by several crucial hurdles, including social, economic, technical, stability and dispatch ability of renewable energy, geographic constraint, and capacity considerations. These limiting forces are due to the cost of fossil fuels, CO2 emission, and power production. As expected, rising energy costs are proven to be a limiting factor for energy generation from renewable sources for green computing. Data centres are crucial to cloud service providers and information technology (IT). Incorporating renewable energy sources and green computing processes allows these providers to appeal to environmentally conscious customers, boost efficiency, and differentiate in an increasingly competitive industry. Due to the energy required to run data centres and communications networks, the IT sector substantially impacts the environment. Green computing methods and using renewable energy to power data centres may help decrease costs and improve the industry’s environmental footprint. Therefore, factors that mainly influence the driving forces for energy are discussed in Figure 2b. The renewable energy industry is expanding due to rising demand for green energy sources. This includes producing and setting up environmentally friendly technology such as solar panels, wind turbines, etc. Investment patterns, demand for fossil fuels, and employment might all change due to the transition to renewable energy.
Figure 2b denotes renewable energy sources play a significant role in the global economy and society. Long-term economic expansion, in which energy plays an important role in green computing, is an important driving factor for energy consumption. More excellent economic activity often increases energy consumption, necessitating additional capacity and improving the cost of fossil fuel, Co2 emission, and power production. Even while environmental preservation and economic growth are two of the most important driving forces, the quantity of renewable energy for green computing attached to the utility grid, the cost of renewable energy, the feed of renewable energy, and market demand are all significant pulling forces of the energy. Internal pressures include the effect on ongoing investment project plans, talent and technology, renewable energy accommodation infrastructure, and government policy affecting economic growth. Reduced energy usage is one of the main benefits of green computing methods, including adopting energy-efficient hardware and fine-tuning data centre operations. This leads to decreased power bills and operating expenses for enterprises. Among the many practices that contribute to green computing is efficient resource management. Enhanced productivity, less downtime, and fewer errors are all possible outcomes. Therefore, a graphical survey has been conducted to validate China’s energy consumption during 2021 and 2022 to effectively perceive driving forces based on energy demand, as shown in Figure 3. Economic models often support carbon pricing methods, including cap-and-trade or carbon taxes. Businesses and people are incentivized to decrease their carbon footprint via these measures, which impose a monetary penalty on carbon emissions. As a result, there will be an economic incentive to embrace green practices and products.
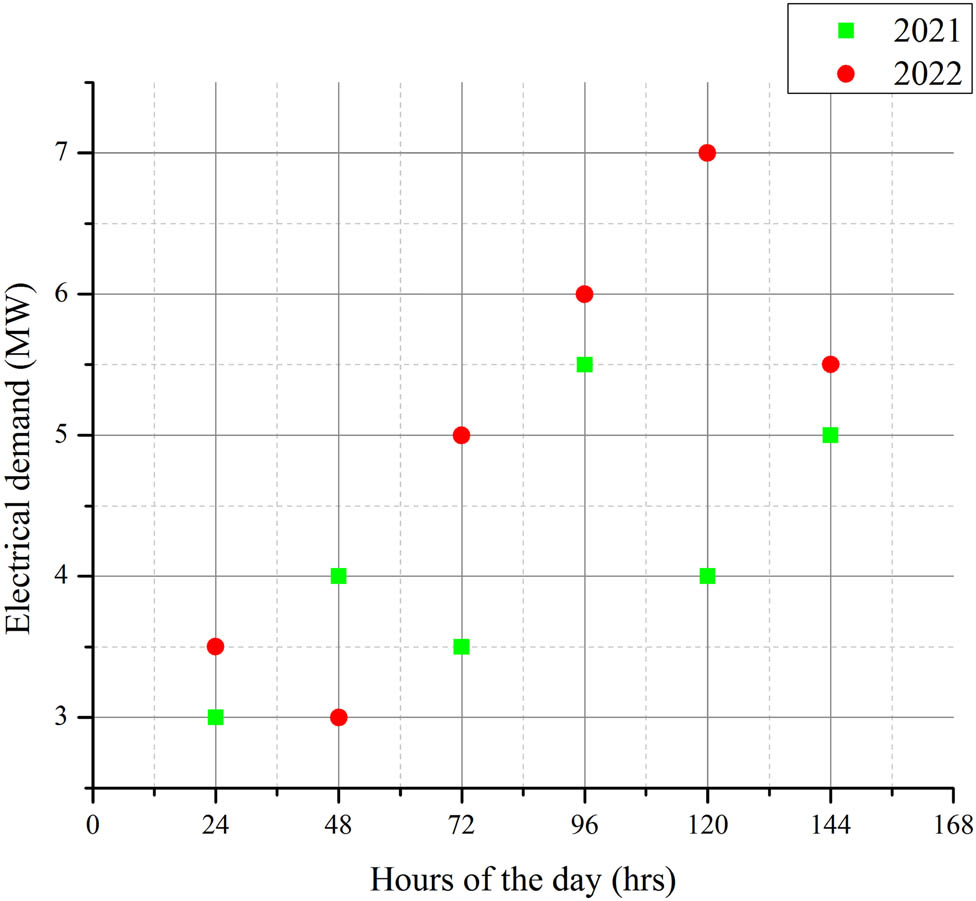
Electrical demand during weekends and weekdays in April 2021 and 2022 for China.
3.3 REPD’s Discussion
In China, the demand for electrical energy in the commercial and industrial sectors is expected to decrease by 20% by 2021. The manufacturing sector in China has seen a decline of 13% in electricity consumption. However, home loads have increased due to safety regulations in most countries; for instance, residential energy consumption has increased by about 40% in China. The load profiles were reorganized in many places with the load composition shift. Figure 3 displays the China load profile changes during the first week of April 2021 and 2022. It can be seen in Figure 4 that the peak load has decreased by around 21% during the week and 13% on the weekends. Businesses and industries that switch to green computing and renewable energy sources save money on energy costs and decrease in carbon emissions connected with computing operations and energy use. The model must follow global renewable energy standards to ensure that renewable energy is integrated using accepted procedures. The approach may be adapted whenever possible to fit in with programs that encourage and support data-driven innovation while protecting the environment. Achieving innovation without compromising environmental objectives necessitates balancing data-driven advances and sustainability. An important consideration is how efficiently renewable energy sources like wind turbines and solar panels use resources. With the continued price decline, green computing solutions are becoming more accessible to consumers and enterprises.

(a) ANN architecture, (b) driving forces to ANN Layer, and (c) conceptual framework prediction based on ANN-EGM.
3.4 Architecture of ANN
From the above discussion on predicting and validating limiting and driving forces, the conventional models such as (Gunjan et al., 2020, pp. 21, 22) need to improve several aspects. Therefore, this advent the pathway for ANN-enabled EGM which helps to predict the limiting and driving growth factor as influenced by fossil fuel, Co2 emission, and power production effectively, as discussed below: Renewable energy sources, including solar, wind, hydro, and geothermal, are fundamental to the proposed new economic growth model. Because of this, less non-renewable energy is used, and instead, computing operations are powered by sustainable and environmentally friendly energy.
Figure 4a illustrates layers in the fundamental structure of an ANN that may be grouped as input, hidden, and output. Depending on the task, ANN may contain one or more of these “hidden layers.” Layers contain one or more synthetic neurons. Directed edges with weights represent the inputs and outputs in a network of neurons. The driving forces of input with the ANN layer are discussed below:

(a) Input vector and (b) renewable energy.
Figure 4b illustrates the estimate of the characteristics of renewable power production and anticipates the spread of carbon emission; the primary predictive model uses two ANN layers, the first of which has 256 neurons and the second of which has 64. State blocks inside the ANN itself take in data at regular intervals. The ANN receives the input vector at each time step and generates an output according to the following formula.
ANN is currently utilized to analyze limiting factors using neuronal networks with dynamic connectivity. Internalized and fleeting, memory is shared among individuals. There is a safety net, and tasks are split up to validate the influenced limiting forces that slow down economic activity. It may be used when there is a lack of knowledge about the rules to follow or when there is incomplete or noisy data. In an ANN, several different signals are sent into each neuron. By applying the functions, the inputs are transformed into neuronal activity. When discussing ANN, each arrow indicates a connection between two neurons, which helps to predict and validate elements such as fossil fuel, Co2 emission, and power production. All times are weighted and given a whole number based on the element’s influence and weight. There is no need to tweak the weights if the network produces the expected outcomes. In contrast, if the network produces incorrect output, it must be nullified.
The input signals to the neuron are added together after being multiplied by the connection weights. If the combined weights total up to zero, a bias is applied to either make the output positive or increase the system’s responsiveness, which is quantified, and its input is always 1. The final output is obtained by feeding the result of the weighted sum into an activation function, which is often non-linear. The driving forces are validated during the feedback process based on technological growth, economic policies, and finance management. An ANN’s activation function may be seen as the collection of transfer functions applied to effectively deciding based on input and feedback, which effectively decides the limiting and driving forces. The suggested economic growth model depends on different technical advancements to be successful. This model is based on green computing and renewable energy. All three of these goals are at the core of the innovations in the sustainable practices industry. Advanced grid management systems improve the reliability of smart grids by optimizing energy distribution, balancing supply and demand, and using automation in response to real-time data.
3.5 Framework of ANN-based EGM
Figure 4c shows the conceptual framework prediction based on ANN-EGM. The data are taken from the global energy consumption and renewable analytics kaggle dataset [25]. Many articles detail certain elements of using renewable energy for green computing. They point to the industry’s lack of long-term financial stability as a major obstacle to its growth. The role of finance has been crucial to the development of the energy industry. Green computing, which uses renewable energy and energy-efficient technology, may help people and companies save money in the long run. Sustainability in the financial realm is aided by decreased energy use and operational expenses. Due to the shift to renewable power, there will be more openings for those interested in working in renewable energy and allied green technology businesses. Investments in renewable energy infrastructure and technological advancements boost economic development. The evaluation uses measures that reflect the economic maturity in line with international norms, which is the significant driving force for energy. For any treatment to be effective, it must be based on a thorough analysis of the current sustainable development condition and any potential risk factors that may keep the issue from improving. It is found that all nations use two basic decision-making techniques: the first represents the data-driven choice-making process. In contrast, the second illustrates an experience-based decision-making process for effectively predicting limiting and driving forces. The evidence indicates that older data are less likely to choose the approach based on the data. Despite this, the framing effect is only evident among those who use a data-based approach, suggesting that it is more closely linked to selecting a particular course of action. Further, the linear and mathematical have been expressed mathematically, as shown in Figure 5(a). Policies and financial incentives are a part of the proposed economic growth framework to encourage more people and organizations to switch to green energy to power their computing devices. A few instances of such efforts include credits for taxes, government funding, and new rules that mandate the usage of green energy. Green computing and renewable energy-based economic growth models should be intrinsically flexible in light of technological advancements and changes in the renewable energy environment. The proposed model’s longevity and continued relevance depend heavily on its capacity to change and evolve. Improving the dependability of renewable energy sources is highly dependent on the accessibility and effectiveness of energy storage technology. Wind and solar power, for example, are intermittent and dependent on factors like the time of day and weather, in contrast to conventional power production that relies on fossil fuels. Renewable energy production may be unpredictable and unreliable; energy storage technologies can mitigate this problem and provide a more consistent and dependable power source.
From the path diagram, equations (1) and (2) are derived as discussed below:
Figure 5(a) illustrates
In Figure 5(b),
ANN-EGM uses the perceptron concept for the effective prediction of limiting and driving factors; perceptron is a network with
where
where
4 Result and Discussion
This study presents the Artificial Neural Network-enabled Economic Growth Model (ANN-EGM) to predict the restraining and push energy variables that impede economic growth. The data are taken from the global energy consumption and renewable analytics Kaggle dataset (Saidi & Omri, 2020). The research experimentally concludes that the ANN-EGM effectively predicts and validates the limiting and driving forces compared with the conventional method based on performance, accuracy, prediction ratio, and mean square error rate, which is discussed as follows.
4.1 Performance of ANN for 2021 and 2022
Table 1 lists the total amount of energy generation from renewable sources for green computing that has been predicted using ANN for 2021 and 2022 for the industry in Chinese cities. In addition, the cumulative output power is 25.703 kW till 2022, as taken from the global energy consumption and renewable analytics kaggle data set (Saidi & Omri, 2020). The energy production has been shown to cause monthly minimum and maximum values, as given in Table 1
Monthly total energy production in industries
| No. of months | 2021 | 2022 |
|---|---|---|
| Jan | 2562.124 | 1927.27 |
| Feb | 3498.877 | 2583.83 |
| Mar | 2159.160 | 1960.25 |
| Apr | 1713.144 | 1479.229 |
| May | 851.610 | 868.188 |
| June | 730.259 | 742.481 |
| July | 716.805 | 838.188 |
| Aug | 1055.555 | 1117.929 |
| Sept | 1083.437 | 878.525 |
| Oct | 985.817 | 1039.039 |
| Nov | 840.599 | 874.679 |
| Dec | 1460.112 | 1483.411 |
| Total (kW) | 27.556 | 25.703 |
Equation (5) denotes
4.2 Energy Production Between 2021 and 2022
Figure 6 is a graph depicting the average monthly energy production between 2021 and 2022 based on the energy production premises of China.

Performance of ANN for 2021 and 2022.
The chart includes two different graphics. The y-axis on the left of the bar chart represents the mean speed. However, the middle y-value on the line chart is the average power. In 2021 and 2022, there was a huge increase in energy production. Compared to other existing methods such as DEA-EA, PTRM, FMOLS, DEA-EA, and BPVAR, the proposed EGM-ANN has a higher prediction of the driving forces for energy production, as shown in Figure 6. For green computing projects to be successfully implemented, an energy infrastructure that is durable and secure is essential. The foundational energy infrastructure must be reliable, resilient, and secure if green computing is to succeed in its mission to lessen the environmental effect of information technology (IT).
Equation (6)
Figure 7 illustrates R-value analysis, which measures how closely one network’s output matches the desired network outcome based on the limiting and driving forces. In this case, the training of the ANN model has been terminated after it passed a maximum validation threshold. Figure 7 illustrates that during the training, validation, and testing phases of ANN design, R equals 1. This is the best result with an R-value of 1 and an MSE of 0, as shown in Figure 7. Further, the graphs show that ANN-EGM equals 1, and existing methods do not equal 1. Hence, the MSE value of the experimental data shows that it must be higher than the MSE value of training data, which is predicted effectively by the ANN-EGM. Encourage governmental and commercial organizations to work together to fund and execute renewable energy initiatives. Private investors may provide Capital and expertise, while the public sector can offer policy support and incentives. Facilitates faster project execution by distributing financial risk and maximizing private sector resources.
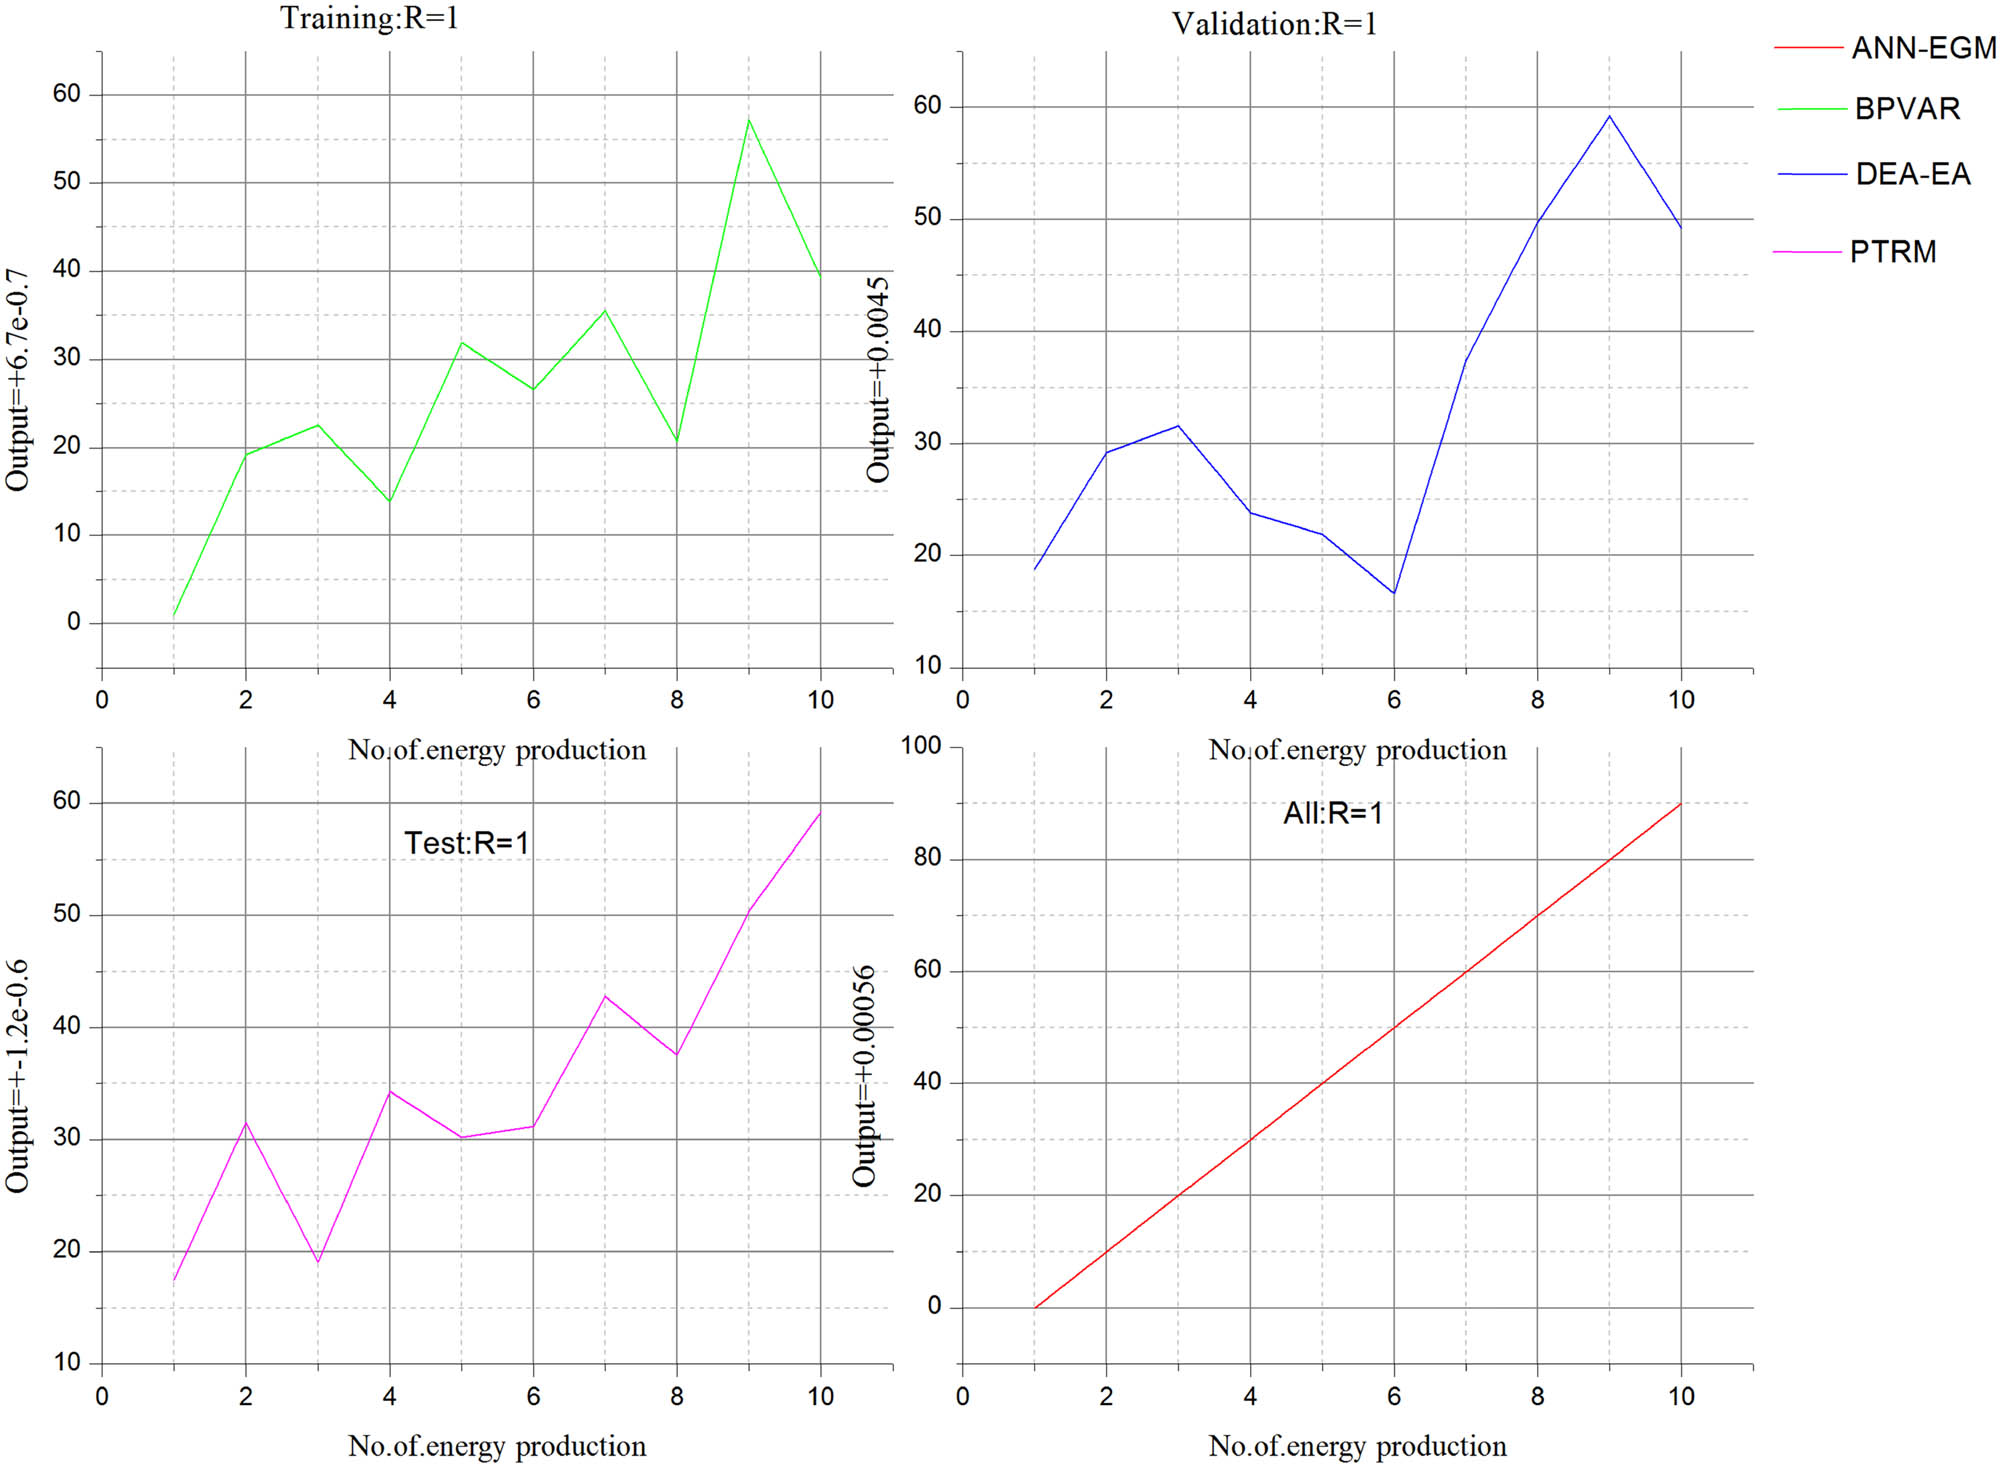
Mean square error rate validations.
4.3 Renewable Energy Production Data (2017–2021) and Forecast (2022–2026)
Equation (7) explained
Table 1 and Figure 8 illustrate the nation’s population as one of the variables included in this research. Here, the risk-free negative findings and hazardous positive results are reported, even though it has been analyzed using the same historical data to determine the model’s accuracy. It is clear from Table 2 that the green computing framing effect is present in all experimental circumstances. Hence, the proposed ANN-EGM helps to predict energy production and forecast more accurately with the help of ANN. Compared to other existing methods, DEA-EA and BPVAR, the proposed method EGM-ANN is higher in accuracy ratio prediction.

Renewable energy production data (2017–2021) and forecast (2022–2026).
Accuracy ratio analysis
| Main effect | R | R 0 | β | γ | N | C | S |
|---|---|---|---|---|---|---|---|
| Frame 1 (Shanghai) | 0.75 | 2.94 | 1.258 | 0.252 | 1,560.00 | 1,139,020 | 321,277 |
| Frame 2 (Beijing) | 0.95 | 1.26 | 1.641 | 2.406 | 412,263 | 82,351 | 229,922 |
| Frame 3 (Guangzhou) | 0.63 | 2.22 | 0.302 | 0.096 | 275,355 | 228,205 | 47,777 |
| Frame 4 (Shenzhen) | 0.73 | 2.27 | 0.417 | 0.246 | 357,377 | 215,721 | 29,206 |
| Frame 5 (Chengdu) | 0.73 | 2.31 | 0.397 | 0.234 | 290,642 | 161,534 | 68,686 |
R is the number of persons infected by a single case β/γ (1 − C/N)); R 0 is just reproducing (β/γ); β is the standard frequency of communication (1/day); γ is the normalized disposal interval (1/day); N is the population size when it was first vulnerable; C is the surplus of recovered individuals; S is the amount of potentially vulnerable people remaining.
4.4 Prediction Ratio
Equation (8) denotes
Figure 9 measures the prediction ratio of the energy obtained from renewable energy in facilities as a proportion of overall renewable energy for green computing. It facilitates internal trend analysis and external benchmarking by evaluating the ratio. The energy produced from renewables will climb 5% this year and more than 6% in 2022. Despite these high increases, renewables will likely provide roughly half of the projected expansion in global demand in 2021 and 2022. Methods for estimating renewable energy’s future contributions to the world’s energy supply are crucial. The proposed ANN-EGM has a higher prediction ratio than other methods, such as DEA-EA and BPVAR. The computing industry may dramatically lessen its carbon footprint by switching to renewable energy sources like solar, wind, or hydropower to power data centres. These data centres help sustainable development using green computing methods, such as energy-efficient hardware and optimizing cooling systems. The proposed new economic model can potentially encourage novel approaches to software design by facilitating the creation of more energy-efficient algorithms. This significant advance is critical for fostering sustainable application development and decreasing the energy consumption of computing operations. The model must be flexible enough to incorporate cutting-edge technologies like artificial intelligence (AI), blockchain, and edge computing. Computing process optimization, energy efficiency enhancement, and general environmental responsibility are all possible with the help of these technologies.

Prediction ratio.
Therefore, future work discusses creating a brand-new hybrid renewable energy dual-system forecasting with ANN-EGM assistance to validate the performance, accuracy, mean square error rate and prediction results.
5 Conclusion and Future Work
This study presents the Artificial Neural Network-enabled Economic Growth Model (ANN-EGM) to predict the restraining and push energy variables that impede economic growth. This study addresses an all-encompassing strategy for economic growth based on green computing and renewable energy social implications and equality challenges and provides wide access to green technology. Ideally, a sustainable economic growth model would be built with scalability and flexibility, making it usable in various contexts and adaptable to evolving technology environments. Many experts believe the global adoption of renewable energy sources for green computing positively correlates with economic growth. Among the world’s leading consumers and providers of renewable energy for computers, the country’s economy is booming. The growth ushered in a serious economic crisis that demanded action from policymakers. Specifically, they should be established on long-term development processes that may be accelerated by investments in renewable energy for green computing in the industry that has been pushed toward producing renewable energy in the last several years. Energy derived from renewable sources is naturally renewing yet flow-limited, meaning that although these sources may be used indefinitely, they can only provide much power at any moment. Each resource may be renewable, with the former having an infinite supply and the latter having a finite one. The experiment showed how to get the best possible outcome by identifying the input that may lead to the economic growth of renewable energy. It’s reasonable to assume that the international economy would suffer. Adopting inefficient policies hastened the transition to a more renewable energy system. The ability of renewable energy to offer a constant flow of electricity without depleting finite resources makes it a precious energy source. The experimental outcome demonstrates that the proposed ANN-EGM model increases the prediction ratio by 85.6% and the performance ratio by 86.4% and has a reduced mean square error rate of 10.1% compared to other existing methods. The requirement for imported fuels is reduced significantly, and there is less chance of environmental concerns like gasoline leaks and small difficulties with emissions. Compared to fossil fuels, they represent less of a threat to the local ecosystem and are cheaper to produce. Any renewable energy source is better than fossil fuels, although electricity is often the cheapest and most dependable. In addition, it identified obstacles and suggested avenues for further study to create green computing in smart cities that are both environmentally benign and sustainable.
-
Funding information: This work was supported by the National Social Science Foundation of China (19BGL266). This work was supported by the Sichuan Province Circular Economy Research Center (XHJJ-2209).
-
Author contributions: All authors accepted the responsibility for the content of the manuscript and consented to its submission, reviewed all the results, and approved the final version of the manuscript. YL: Writing – Original draft preparation. MC: Writing – Reviewing and Editing.
-
Conflict of interest: Authors state no conflict of interest.
-
Data availability statement: Data sharing is not applicable to this article as no datasets were generated or analysed during the current study.
-
Article note: As part of the open assessment, reviews and the original submission are available as supplementary files on our website.
References
Adebayo, T. S., & Kirikkaleli, D. (2021). Impact of renewable energy consumption, globalization, and technological innovation on environmental degradation in Japan: Application of wavelet tools. Environment, Development and Sustainability, 23(11), 16057–16082.Suche in Google Scholar
Anton, S. G., & Nucu, A. E. A. (2020). The effect of financial development on renewable energy consumption. A panel data approach. Renewable Energy, 147, 330–338.Suche in Google Scholar
Apergis, E., & Apergis, N. (2021). The impact of COVID-19 on economic growth: Evidence from a Bayesian Panel Vector Autoregressive (BPVAR) model. Applied Economics, 53(58), 6739–6751.Suche in Google Scholar
Aydoğan, B., & Vardar, G. (2020). Evaluating the role of renewable energy, economic growth and agriculture on CO2 emission in E7 countries. International Journal of Sustainable Energy, 39(4), 335–348.Suche in Google Scholar
Charfeddine, L., & Kahia, M. (2019). Impact of renewable energy consumption and financial development on CO2 emissions and economic growth in the MENA region: A panel vector autoregressive (PVAR) analysis. Renewable energy, 139, 198–213.Suche in Google Scholar
Dogan, E., Altinoz, B., Madaleno, M., & Taskin, D. (2020). The impact of renewable energy consumption to economic growth: A replication and extension of. Energy Economics, 90, 104866.Suche in Google Scholar
Eren, B. M., Taspinar, N., & Gokmenoglu, K. K. (2019). The impact of financial development and economic growth on renewable energy consumption: Empirical analysis of India. Science of the Total Environment, 663, 189–197.Suche in Google Scholar
Goel, R. K., Saunoris, J. W., & Goel, S. S. (2021). Supply chain performance and economic growth: The impact of COVID-19 disruptions. Journal of Policy Modeling, 43(2), 298–316.Suche in Google Scholar
Govindaraj, R., Govindaraj, P., Chowdhury, S., Kim, D., Tran, D. T., & Le, A. N. (2021). A review on various applications of reputation based trust management. International Journal of Interactive Mobile Technologies, 15(10), 87–102.Suche in Google Scholar
Gunjan, V. K., Garcia Diaz, V., Cardona, M., Solanki, V. K., & Sunitha, K. V. N. (2020). ICICCT 2019-System reliability, quality control, safety, maintenance and management (pp. 277–286). Singapore: Springer.Suche in Google Scholar
Gunjan, V. K., Singh, S. N., Duc-Tan, T., Rincon Aponte, G. J., & Kumar, A. (2019). System reliability, quality control, safety, maintenance and management. Springer (Scopus Indexed).Suche in Google Scholar
He, L., Zhang, L., Zhong, Z., Wang, D., & Wang, F. (2019). Green credit, renewable energy investment and green economy development: Empirical analysis based on 150 listed companies of China. Journal of Cleaner Production, 208, 363–372.Suche in Google Scholar
Luqman, M., Ahmad, N., & Bakhsh, K. (2019). Nuclear energy, renewable energy and economic growth in Pakistan: Evidence from non-linear autoregressive distributed lag model. Renewable Energy, 139, 1299–1309.Suche in Google Scholar
Mohsin, M., Taghizadeh-Hesary, F., Iqbal, N., & Saydaliev, H. B. (2022). The role of technological progress and renewable energy deployment in green economic growth. Renewable Energy, 190, 777–787.Suche in Google Scholar
Rahman, M. M., Shakeri, M., Tiong, S. K., Khatun, F., Amin, N., Pasupuleti, J., & Hasan, M. K. (2021). Prospective methodologies in hybrid renewable energy systems for energy prediction using artificial neural networks. Sustainability, 13(4), 2393.Suche in Google Scholar
Rita, E., Chizoo, E., & Cyril, U. S. (2021). Sustaining COVID-19 pandemic lockdown era air pollution impact through utilization of more renewable energy resources. Heliyon, 7(7), e07455.Suche in Google Scholar
Saidi, K., & Omri, A. (2020). The impact of renewable energy on carbon emissions and economic growth in 15 major renewable energy-consuming countries. Environmental Research, 186, 109567.Suche in Google Scholar
Shahbaz, M., Loganathan, N., Zeshan, M., & Zaman, K. (2015). Does renewable energy consumption add in economic growth? An application of auto-regressive distributed lag model in Pakistan. Renewable and Sustainable Energy Reviews, 44, 576–585.Suche in Google Scholar
Shao, X., Zhong, Y., Liu, W., & Li, R. Y. M. (2021). Modeling the effect of green technology innovation and renewable energy on carbon neutrality in N-11 countries? Evidence from advance panel estimations. Journal of Environmental Management, 296, 113189.Suche in Google Scholar
Soava, G., Mehedintu, A., Sterpu, M., & Grecu, E. (2021). The impact of the COVID-19 pandemic on electricity consumption and economic growth in Romania. Energies, 14(9), 2394.Suche in Google Scholar
Sueyoshi, T., Ryu, Y., & Yun, J. Y. (2021). COVID-19 Response and prospects of clean/sustainable energy transition in industrial nations: New environmental assessment. Energies, 14(4), 1174.Suche in Google Scholar
Usman, M., & Hammar, N. (2021). Dynamic relationship between technological innovations, financial development, renewable energy, and ecological footprint: Fresh insights based on the STIRPAT model for Asia Pacific Economic Cooperation countries. Environmental Science and Pollution Research, 28(12), 15519–15536.Suche in Google Scholar
Wang, J., Zhang, S., & Zhang, Q. (2021). The relationship of renewable energy consumption to financial development and economic growth in China. Renewable Energy, 170, 897–904.Suche in Google Scholar
Wang, Q., & Wang, L. (2020). Renewable energy consumption and economic growth in OECD countries: A non-linear panel data analysis. Energy, 207, 118200.Suche in Google Scholar
Zhang, D., Mohsin, M., Rasheed, A. K., Chang, Y., & Taghizadeh-Hesary, F. (2021). Public spending and green economic growth in BRI region: mediating role of green finance. Energy Policy, 153, 112256.Suche in Google Scholar
Zhou, X., Tang, X., & Zhang, R. (2020). Impact of green finance on economic development and environmental quality: A study based on provincial panel data from China. Environmental Science and Pollution Research, 27, 19915–19932.Suche in Google Scholar
https://www.kaggle.com/code/lumierebatalong/global-energy-consumption-renewable-analyticsSuche in Google Scholar
© 2024 the author(s), published by De Gruyter
This work is licensed under the Creative Commons Attribution 4.0 International License.
Artikel in diesem Heft
- Regular Articles
- Political Turnover and Public Health Provision in Brazilian Municipalities
- Examining the Effects of Trade Liberalisation Using a Gravity Model Approach
- Operating Efficiency in the Capital-Intensive Semiconductor Industry: A Nonparametric Frontier Approach
- Does Health Insurance Boost Subjective Well-being? Examining the Link in China through a National Survey
- An Intelligent Approach for Predicting Stock Market Movements in Emerging Markets Using Optimized Technical Indicators and Neural Networks
- Analysis of the Effect of Digital Financial Inclusion in Promoting Inclusive Growth: Mechanism and Statistical Verification
- Effective Tax Rates and Firm Size under Turnover Tax: Evidence from a Natural Experiment on SMEs
- Re-investigating the Impact of Economic Growth, Energy Consumption, Financial Development, Institutional Quality, and Globalization on Environmental Degradation in OECD Countries
- A Compliance Return Method to Evaluate Different Approaches to Implementing Regulations: The Example of Food Hygiene Standards
- Panel Technical Efficiency of Korean Companies in the Energy Sector based on Digital Capabilities
- Time-varying Investment Dynamics in the USA
- Preferences, Institutions, and Policy Makers: The Case of the New Institutionalization of Science, Technology, and Innovation Governance in Colombia
- The Impact of Geographic Factors on Credit Risk: A Study of Chinese Commercial Banks
- The Heterogeneous Effect and Transmission Paths of Air Pollution on Housing Prices: Evidence from 30 Large- and Medium-Sized Cities in China
- Analysis of Demographic Variables Affecting Digital Citizenship in Turkey
- Green Finance, Environmental Regulations, and Green Technologies in China: Implications for Achieving Green Economic Recovery
- Coupled and Coordinated Development of Economic Growth and Green Sustainability in a Manufacturing Enterprise under the Context of Dual Carbon Goals: Carbon Peaking and Carbon Neutrality
- Revealing the New Nexus in Urban Unemployment Dynamics: The Relationship between Institutional Variables and Long-Term Unemployment in Colombia
- The Roles of the Terms of Trade and the Real Exchange Rate in the Current Account Balance
- Cleaner Production: Analysis of the Role and Path of Green Finance in Controlling Agricultural Nonpoint Source Pollution
- The Research on the Impact of Regional Trade Network Relationships on Value Chain Resilience in China’s Service Industry
- Social Support and Suicidal Ideation among Children of Cross-Border Married Couples
- Asymmetrical Monetary Relations and Involuntary Unemployment in a General Equilibrium Model
- Job Crafting among Airport Security: The Role of Organizational Support, Work Engagement and Social Courage
- Does the Adjustment of Industrial Structure Restrain the Income Gap between Urban and Rural Areas
- Optimizing Emergency Logistics Centre Locations: A Multi-Objective Robust Model
- Geopolitical Risks and Stock Market Volatility in the SAARC Region
- Trade Globalization, Overseas Investment, and Tax Revenue Growth in Sub-Saharan Africa
- Can Government Expenditure Improve the Efficiency of Institutional Elderly-Care Service? – Take Wuhan as an Example
- Media Tone and Earnings Management before the Earnings Announcement: Evidence from China
- Review Articles
- Economic Growth in the Age of Ubiquitous Threats: How Global Risks are Reshaping Growth Theory
- Efficiency Measurement in Healthcare: The Foundations, Variables, and Models – A Narrative Literature Review
- Rethinking the Theoretical Foundation of Economics I: The Multilevel Paradigm
- Financial Literacy as Part of Empowerment Education for Later Life: A Spectrum of Perspectives, Challenges and Implications for Individuals, Educators and Policymakers in the Modern Digital Economy
- Special Issue: Economic Implications of Management and Entrepreneurship - Part II
- Ethnic Entrepreneurship: A Qualitative Study on Entrepreneurial Tendency of Meskhetian Turks Living in the USA in the Context of the Interactive Model
- Bridging Brand Parity with Insights Regarding Consumer Behavior
- The Effect of Green Human Resources Management Practices on Corporate Sustainability from the Perspective of Employees
- Special Issue: Shapes of Performance Evaluation in Economics and Management Decision - Part II
- High-Quality Development of Sports Competition Performance Industry in Chengdu-Chongqing Region Based on Performance Evaluation Theory
- Analysis of Multi-Factor Dynamic Coupling and Government Intervention Level for Urbanization in China: Evidence from the Yangtze River Economic Belt
- The Impact of Environmental Regulation on Technological Innovation of Enterprises: Based on Empirical Evidences of the Implementation of Pollution Charges in China
- Environmental Social Responsibility, Local Environmental Protection Strategy, and Corporate Financial Performance – Empirical Evidence from Heavy Pollution Industry
- The Relationship Between Stock Performance and Money Supply Based on VAR Model in the Context of E-commerce
- A Novel Approach for the Assessment of Logistics Performance Index of EU Countries
- The Decision Behaviour Evaluation of Interrelationships among Personality, Transformational Leadership, Leadership Self-Efficacy, and Commitment for E-Commerce Administrative Managers
- Role of Cultural Factors on Entrepreneurship Across the Diverse Economic Stages: Insights from GEM and GLOBE Data
- Performance Evaluation of Economic Relocation Effect for Environmental Non-Governmental Organizations: Evidence from China
- Functional Analysis of English Carriers and Related Resources of Cultural Communication in Internet Media
- The Influences of Multi-Level Environmental Regulations on Firm Performance in China
- Exploring the Ethnic Cultural Integration Path of Immigrant Communities Based on Ethnic Inter-Embedding
- Analysis of a New Model of Economic Growth in Renewable Energy for Green Computing
- An Empirical Examination of Aging’s Ramifications on Large-scale Agriculture: China’s Perspective
- The Impact of Firm Digital Transformation on Environmental, Social, and Governance Performance: Evidence from China
- Accounting Comparability and Labor Productivity: Evidence from China’s A-Share Listed Firms
- An Empirical Study on the Impact of Tariff Reduction on China’s Textile Industry under the Background of RCEP
- Top Executives’ Overseas Background on Corporate Green Innovation Output: The Mediating Role of Risk Preference
- Neutrosophic Inventory Management: A Cost-Effective Approach
- Mechanism Analysis and Response of Digital Financial Inclusion to Labor Economy based on ANN and Contribution Analysis
- Asset Pricing and Portfolio Investment Management Using Machine Learning: Research Trend Analysis Using Scientometrics
- User-centric Smart City Services for People with Disabilities and the Elderly: A UN SDG Framework Approach
- Research on the Problems and Institutional Optimization Strategies of Rural Collective Economic Organization Governance
- The Impact of the Global Minimum Tax Reform on China and Its Countermeasures
- Sustainable Development of Low-Carbon Supply Chain Economy based on the Internet of Things and Environmental Responsibility
- Measurement of Higher Education Competitiveness Level and Regional Disparities in China from the Perspective of Sustainable Development
- Payment Clearing and Regional Economy Development Based on Panel Data of Sichuan Province
- Coordinated Regional Economic Development: A Study of the Relationship Between Regional Policies and Business Performance
- A Novel Perspective on Prioritizing Investment Projects under Future Uncertainty: Integrating Robustness Analysis with the Net Present Value Model
- Research on Measurement of Manufacturing Industry Chain Resilience Based on Index Contribution Model Driven by Digital Economy
- Special Issue: AEEFI 2023
- Portfolio Allocation, Risk Aversion, and Digital Literacy Among the European Elderly
- Exploring the Heterogeneous Impact of Trade Agreements on Trade: Depth Matters
- Import, Productivity, and Export Performances
- Government Expenditure, Education, and Productivity in the European Union: Effects on Economic Growth
- Replication Study
- Carbon Taxes and CO2 Emissions: A Replication of Andersson (American Economic Journal: Economic Policy, 2019)