Picogram-level detection of three ACE inhibitors via LC–MS/MS: Comparing BMP and UOSA54 derivatization methods
-
Ahmad J. Almalki


Abstract
A sensitive liquid chromatography–mass spectrometric method was developed to determine three angiotensin-converting enzyme (ACE) inhibitors, enalapril (ENA), ramipril (RAM), and perindopril (PER) at picogram levels in rabbit plasma. The method employs two derivatization reagents: 3-bromomethyl-propyphenazone (BMP) and a hydrazonoyl chloride (UOSA54). These reagents significantly enhanced the detection sensitivity of the analytes, with response factors increasing by 7–114 orders of magnitude compared to underivatized compounds. The ACE inhibitors were extracted from plasma using liquid–liquid extraction and then derivatized with either BMP or UOSA54. The BMP-derivatized analytes were analyzed using positive electrospray ionization-MS (ESI-MS) mode, while the UOSA54-derivatized analytes were analyzed using negative ESI-MS mode. The method demonstrated excellent sensitivity, with limits of quantification ranging from 0.03 to 30 ng·mL−1 for BMP-derivatized analytes and 0.3 to 300.0 ng·mL−1 for UOSA54-derivatized analytes. The calibration curves were linear, spanning a wide range of concentrations, with correlation coefficients (r 2) close to unity for all analytes. The extraction recovery of the developed method ranges from 88% to 100%, outperforming other extraction procedures. The method’s applicability was validated through pharmacokinetic studies in rabbits, where it successfully quantified ACE inhibitors over 24 h post-oral administration. Pharmacokinetic parameters revealed distinct profiles for each ACE inhibitor: ENA exhibited a C max of 45.2 ± 3.1 ng·mL−1, T max of 0.5 h, and AUC0–24h of 210 ± 15 ng·h·mL−1; RAM showed a C max of 62.5 ± 4.2 ng·mL−1, T max of 1 h, and AUC0–24h of 315 ± 20 ng·h·mL−1; PER displayed the highest C max (78.3 ± 5.6 ng·mL−1), longest T max (2 h), and largest AUC0–24h (410 ± 25 ng·h·mL−1). This method represents a significant advancement in ACE inhibitor analysis, offering unparalleled sensitivity and reliability for pharmacokinetic studies and therapeutic monitoring of these important cardiovascular drugs.
Graphical abstract

Derivatization of ACE inhibitors with either BMP or UOSA54, followed by liquid chromatography-mass spectrometric analysis.
1 Introduction
Angiotensin-converting-enzyme (ACE) inhibitors are drugs used to treat high blood pressure and exhibit a vasodilator effect on the blood vessels [1]. The ACE inhibitors are inactive prodrugs and are metabolized to the active moiety after splitting the ethoxy terminal group because of the carboxylesterase-1 enzyme [2,3]. It has been reported that the maximum plasma concentration of enalapril (ENA), ramipril (RAM), and perindopril (PER) reaches within 0.25–1 h. Meanwhile, the highest concentration of the free carboxylate metabolite in plasma is reached within 2–4 h [4,5,6]. The limit of quantification of the reported analytical methods for determining the three ACE inhibitor candidates in human plasma was around 2 ng·mL−1 [3,4].
Moreover, the reported average concentration range of the unchanged drug form was maintained within 6–24 h [7]. ACE inhibitors are mainly prescribed once daily [8], and the recommended dose varies according to the case severity, as it should cover the whole day [9]. Analysts preferred the determination of the active metabolite because of the lack of method sensitivity to monitor the prodrug form at a time exceeding 24 h from oral administration [7]. The ACE inhibitors are marketed as sustained-release oral formulations to decrease the impact of carboxylesterase-1 enzyme and maintain the concentration in blood for the desired therapeutic effect for 24 h [10]. Monitoring this class of compounds in plasma requires a sensitive and selective method to prescribe the accurate dose necessary to achieve stable blood pressure.
Accordingly, there is a need to develop an analysis method to monitor the drug concentration in the plasma at low levels and over long periods to help determine the recommended doses more precisely. The reported limits of quantification (LOQ) and the calibration ranges do not afford enough detection sensitivity, especially the ionization at the ionization source of the mass spectrometers. Since sensitivity and selectivity are essential parameters to achieve a suitable analytical method. Targeting the basic amino group in the ACE inhibitors was necessary for coupling with an appropriate reagent. Dansyl-chloride has been used by Sakur et al. for the pre-column derivatization of PER in bulk and dosage forms to improve the sensitivity using the spectrofluorimetric technique [11]. The method showed an improved sensitivity, although no reports were found in the literature that utilize dansyl chloride for the derivatization of drugs extracted from a biological fluid. Moreover, the RAM has been determined in human plasma by liquid chromatography-mass spectrometric (LC–MS)/MS using dansyl chloride as a derivatization reagent at a linear range of 50.3–32,850.6 pg·mL−1 [12].
3-Bromomethyl-propyphenazone (BMP) [13] has been used as a coupling reagent for the sensitive analysis of estrogens and reacted via the phenolic hydroxyl group [14]. This reagent has shown an excellent ionization property at the positive electrospray ionization (ESI) mode, applying positive polarization and enhancing the detection limit to the sub-picogram scale.
Also, an in-house prepared hydrazonoyl chloride has been used as a derivatization reagent for sensitive analysis of five β-blockers using LC–MS [15,16]. This reagent, hydrazonoyl chloride (UOSA54), is very reactive at room temperature and coupled completely with the targeted analyte within 2–10 min. Moreover, the derivatized UOSA54-analytes could be monitored by negative and positive LC–MS.
2 Materials and methods
2.1 Materials
ENA, >98.0%, and PER, >95.0%, were purchased from Santa Cruz, Biotechnology, Inc. (Heidelberg, Germany). RAM, >98.0%; 4-aminoantipyrine (4AP), >99.0%; indomethacin (IND), >98.5%; arginine, >99.5%; propyphenazone, 100%; and triethylamine, >99.5%, were purchased from Sigma-Aldrich, St. Louis, MO, USA. UOSA54, >95.0% [15,16], and BMP, >96.0% [13], were prepared, purified, and confirmed in our lab. Potassium carbonate anhydrous, >95%, was purchased from BDH, Poole, England. All other materials and solvents were of HPLC grade.
2.2 Instrument
Thermo Scientific LTQ-XL linear ion trap mass spectrometer coupled with Accela autosampler and Accela pump (San Jose, CA, USA). The ESI compartment is the ion source. The system was controlled with Xcalibur® Thermo Fisher Scientific Inc, version 2.07 SP1. Spray voltage, 5.0 kV, sheath gas flow rate, 42 mL·min−1, auxiliary gas, 5 mL·min−1, capillary voltage, 60 V, capillary temperature, 335°C, scan range, 100–700 m/z. The collision energy was 35 V. Column, Eclipse Plus C18, 3.5 μm, 4.6 × 100 mm (Agilent, Palo Alto, USA), column oven, 37°C. Tray temp. 25°C. The mobile system was composed of acetonitrile (A), water containing 0.1% glacial acetic acid 100% (B), and one liter of water containing 1 mL ammonia solution, 25% w/v (C). The flow rate was 400 μL·min−1. The untreated analytes were eluted using 45% A:55% B, while the analytes derivatized with BMP were eluted with a mobile system composed of 72% A:28% B, applying positive ESI-MS mode. The UOSA54-treated analytes were eluted using a mobile system composed of 82% A:18% C, applying negative ESI-MS mode.
2.3 Solutions
A 2.0 mg·mL−1 concentration of BMP and UOSA54 was prepared separately in acetonitrile and kept at −20°C in brown glass vials. 4-Amino-antipyrine (4AP), 0.1 ng·μL−1, and IND, 1.0 ng·μL−1, were prepared separately in acetonitrile and used as internal standards for positive and negative MS analysis, respectively. A 1 mg·mL−1 concentration of ENA, PER, and RAM solution was prepared separately in methanol. Further dilutions were prepared in acetonitrile. Two serial dilution mixtures were prepared. Seven levels of standard solution mixtures were prepared, spanning a range of 0.15–150 pg·μL−1 of each analyte for drawing the calibration line using BMP as a derivatization reagent. Another seven concentration levels, ranging from 1.5 to 1,500 pg·μL−1, were prepared for drawing the calibration line using UOSA54 as a derivatization reagent. A volume of 20 μL of each standard solution mixture was spiked in 100 μL of control rabbit plasma, followed by extraction and derivatization with either BMP or UOSA54 solution.
A 0.25% w/v acetonitrile solution of triethylamine was prepared, and a 0.1% w/v formic acid solution was prepared in water and used in the extraction procedure.
2.4 Extraction of samples
A volume of 100 μL of rabbit plasma was transferred to a 15 mL test tube, spiked with 20 μL of targeted analytes solution mixture, 30 μL of internal standard solution, mixed with the aid of a vortex, and left to stand for 30 min at room temperature. This plasma solution was mixed with 25 μL formic acid solution 0.1%, 4 mL ethyl acetate, vortexed for 4 min, centrifuged at 5,000 rpm for 10 min, and the organic layer was filtered through a PTFE syringe-membrane disk, 0.2 μm. The clear filtrate was dried with nitrogen gas at 40°C, reconstituted in 200 μL acetonitrile, transferred to an autosampler vial (1.8 mL), and dried with nitrogen gas.
The internal standard solution used was either 4AP 0.1 ng·μL−1, or IND 1.0 ng·μL−1 for the derivatization with BMP or UOSA54, respectively.
2.5 Reaction with BMP
The extraction residue was mixed with 25 μL BMP solution, 2 mg·mL−1, a few spikes of anhydrous potassium carbonate (ca. 20 mg), capped, vortexed for 30 s, and heated over a thermostat hotplate adjusted at 70 ± 4°C for 30 min. The reaction mixture was cooled to room temperature, transferred to a total recovery-autosampler vial (0.9 mL) using a Pasteur pipette, dried with nitrogen gas, reconstituted in 25 μL acetonitrile, and a volume of 5 μL was injected for LC–MS analysis applying positive ESI-MS scan mode, 50–700 m/z.
2.6 Reaction with UOSA54
The extraction residue was mixed with 25 μL triethylamine 0.25% w/v, 25 μL UOSA54 solution, 2 mg·mL−1, 100 μL acetonitrile, vortexed for 30 s, transferred to a total recovery vial 0.9 mL, dried with nitrogen gas, reconstituted in 25 μL methanol, vortexed for 30 s, and a volume of 5 μL was injected for LC–MS analysis applying negative ESI-MS scan mode, 50–700 m/z.
2.7 Recovery and precision
The extraction recovery was evaluated using high, medium, low, and LOQ concentration levels. The recovered analytes were derivatized with UOSA54, followed by LC–MS analysis. However, samples containing 0.03 and 6.0 ng·mL−1 of analytes were extracted, treated with BMP, and analyzed by LC–MS. The percentage recovery was calculated for each analyte by dividing the peak area of the extracted-derivatized analytes, as x-UOSA54 or x-MP, by the peak area of the derivatized standard solution multiplied by 100.
2.8 Optimization of reaction conditions
The reaction conditions were altered until the best reaction conditions were reached to obtain a product with acceptable stability and maximum ESI-MS sensitivity. The investigated reaction conditions included the reagent’s concentration, type of reaction solvent, temperature, and type of catalyst. The reactivity of BMP and UOSA54 was optimized based on the information that has been previously published [16,17]. The progress of the reaction was investigated using LC–IT–MS. Enhanced positive and negative ESI-MS conditions were applied using the auto-fragmentation option with a collision energy of 35 V. The precision of the ESI-MS response was monitored versus the applied MS condition to achieve maximum precursor ion stability at the ESI compartment. In parallel, the optimal chromatographic separation parameters were optimized for all analytes.
2.9 Matrix effect
To evaluate the matrix effect, a plasma sample containing 10 pg·μL−1 of each ACE inhibitor (ENA, RAM, and PER) was prepared and extracted. An equivalent standard solution was prepared in methanol: water (1:1 v/v). The extracted plasma sample and the standard solution were derivatized separately with BMP and UOSA54. The derivatized samples were then analyzed using LC–MS in positive and negative ESI modes for BMP and UOSA54 derivatives.
2.10 Carryover assessment
A standard solution mixture containing the three ACE inhibitors was derivatized separately by UOSA54 and BMP. Two standard solution mixtures were prepared in methanol:water, 1:1 v/v, containing the targeted analytes at the upper limit of quantification, 50 and 800 pg·μL−1. The two standard mixture levels were derivatized by UOSA54 and BMP separately. A volume of 5 μL of the derivatized standard solutions was injected for LC–MS analysis, followed by an analysis of methanol:water, 1:1 v/v, as a blank sample. All samples and standard solutions were analyzed in triplicate.
2.11 Optimization of the extraction procedure
Since the targeted analytes contain a carboxylic functional group, formic acid was used to improve the lipophilicity of the targeted analytes. The % recovery of PER and RAM reached 100 ± 1.4%. However, the ENA showed a % recovery of 88 ± 2.3%. The UOSA54-treated analytes were dried with nitrogen gas, followed by reconstitution in methanol to improve the stability of the UOSA54-coupled products. The reconstitution of the final reaction product with acetonitrile showed stable UOSA54 adducts for one hour. The derivatization reaction was successful at room temperature, while heating decreases the stability of the formed labeled derivatives. This procedure showed a stable reaction product for 24 h.
2.12 Application
The method’s applicability was also tested after dosing rabbits with each ACE inhibitor separately. A rabbit weighing 0.5–0.7 kg was given a single oral dose of ENA at 3 mg·kg−1, prepared as a 3 mg·mL−1 solution in water:DMSO. We conducted a small-scale pharmacokinetic study using three rabbits for each ACE inhibitor. Blood samples were collected at 0, 0.5, 1, 2, 4, 8, 12, and 24 h post-dose. Plasma concentrations were determined using both BMP and UOSA54 derivatization methods. However, samples collected over the selected time points were treated with BMP and analyzed by LC–MS to calculate the pharmacokinetic parameters. Using a 21–23-gauge butterfly needle, up to 0.5 mL of blood was collected at each time point, using a culture tube containing 20 mg EDTA-Na, and moving towards the base of the ear for subsequent samples and alternating ears if necessary. Samples were centrifuged at 5,300 rpm, and the supernatant plasma layer was collected and transferred to an Eppendorf tube. Samples were kept in a deep freezer at –80°C until analysis. A volume of 100 μL of plasma was extracted, derivatized by BMP, and analyzed with LC–MS. Another 100 μL plasma volume, collected at 1, 12, and 24 h from dosing time, was extracted and derivatized with UOSA54, followed by LC–MS analysis. The same procedure was repeated after the rabbits were dosed separately with 8 and 10 mg of PER and RAM. A non-compartmental model was utilized to analyze the pharmacokinetic parameters of the targeted analytes. The results were expressed as mean ± SD. The data were analyzed using Kinetica® software, employing a noncompartmental analysis approach. A repeated-measure two-way ANOVA was conducted, followed by Sidak’s post hoc test, to compare the drug plasma concentration-time curves between the two groups using GraphPad Prism. Pharmacokinetic parameters between the groups were compared using an unpaired two-tailed t-test. Statistical significance was defined as P < 0.05.
3 Results and discussion
3.1 Optimization of the derivatization reaction
Optimization of reaction conditions was vital for achieving maximum sensitivity and stability in detection. The derivatization reaction variables included the concentration of the derivatization reagent, the type of reaction solvent, the temperature during derivatization, and the type of catalyst used (anhydrous potassium carbonate). The study found that while certain reaction conditions improved sensitivity, they could also affect the stability of the derivatized products. In conclusion, careful selection and optimization of derivatization reagents and extraction methods are essential for ensuring the stability of ACE inhibitors in analytical applications. The findings underscore the importance of maintaining controlled conditions during derivatization and subsequent analysis.
3.2 ESI-MS response of the two used reagents
Table 1 presents the ESI-MS response factors for the investigated ACE inhibitors (ENA, RAM, and PER) under three different conditions: without treatment, after reaction with UOSA54, and after reaction with BMP. Table 1 provides crucial insights into the effectiveness of the derivatization strategies employed in this study. The response factors for the underivatized compounds are relatively low, ranging from 0.8 to 2.1 × 10+3. These data indicate poor ionization efficiency and sensitivity for the ACE inhibitors in their native form, which explains the need for derivatization to improve detection limits.
ESI-MS response factor of the investigated compounds without treatment and after reaction with UOSA54 and BMP, n = 3
| Free analytes, +MS | Analyte-MP, +MS | Analyte-UOSA54, −MS | Relative IT-MS response | |||||||||
|---|---|---|---|---|---|---|---|---|---|---|---|---|
| t R (min) | +m/z | RF* | t R (min) | +m/z | RF* | t R (min) | −m/z | RF** | X-MP/Free | X-UOSA54/Free | X-MP/X-UOSA54 | |
| ENA | 3.39 | 377.2 | 1,901 | 4.69 | 605.3 | 2.16 × 10⁵ | 2.71 | 585.3 | 1.95 × 10⁴ | 113.8 | 10.2 | 11.1 |
| PER | 3.78 | 369.2 | 1,574 | 5.63 | 597.4 | 1.50× 10⁵ | 3.40 | 577.3 | 2.35× 10⁴ | 95.2 | 14.9 | 6.4 |
| RAM | 5.01 | 417.2 | 4,797 | 6.31 | 645.4 | 2.41× 10⁵ | 3.31 | 625.3 | 3.27× 10⁴ | 50.2 | 6.8 | 7.4 |
*Average response factor calculated as peak area per concentration as ng·μL−1 applying positive MS scan mode. **Average response factor calculated as peak area per concentration as ng·μL−1 applying negative MS scan mode. Response factor calculated as an average of three analyzed standard mixes containing 0.1, 0.3, and 1 ng·μL−1 each analyte, derivatized with BMP and monitored by applying positive MS scan mode. Response factor calculated as an average of three analyzed standard mixes containing 0.5, 1.0, and 5.0 ng·μL−1 each analyte, derivatized with USOSA54 and monitored by applying negative MS scan mode.
After derivatization with UOSA54, the response factors increased significantly, ranging from 1.9 × 10⁴ to 3.3 × 10⁴. This response represents an improvement of approximately 6.8–14.9 orders of magnitude compared to the underivatized compounds. The negative ESI-MS mode was used for detection, suggesting that UOSA54 introduces easily ionizable negative groups to the molecules.
The BMP derivatization showed even more dramatic improvements; response factors ranged from 1.5 × 10⁵ to 2.4 × 10⁵. These results represent an increase of 50–114 orders of magnitude over the underivatized compounds. The positive ESI-MS mode was used, indicating that BMP introduces readily ionizable positive groups to the molecules.
BMP derivatization yielded response factors about ten times higher than UOSA54 derivatization for all three compounds. Both derivatization methods significantly enhanced the ACE inhibitors’ ionization efficiency and detection sensitivity. The choice between UOSA54 and BMP may depend on the expected concentration range, ease of reaction, and compatibility with chromatographic conditions.
The dramatic increase in response factors achieved through derivatization, particularly with BMP, enables the detection and quantification of these ACE inhibitors at much lower concentrations than previously possible. This improvement in sensitivity is crucial for monitoring drug levels in plasma over extended periods, potentially allowing for more accurate dosing and improved pharmacokinetic studies. In conclusion, Table 1 demonstrates the effectiveness of both derivatization strategies, with BMP showing superior performance in enhancing ESI-MS response factors for the analyzed ACE inhibitors.
Figure 1 shows a comparison of LC–MS-extracted ion chromatograms for three ACE inhibitors – ENA, RAM, and PER – under different analytical conditions. The figure illustrates the impact of derivatization on the chromatographic separation and detection sensitivity of these compounds.
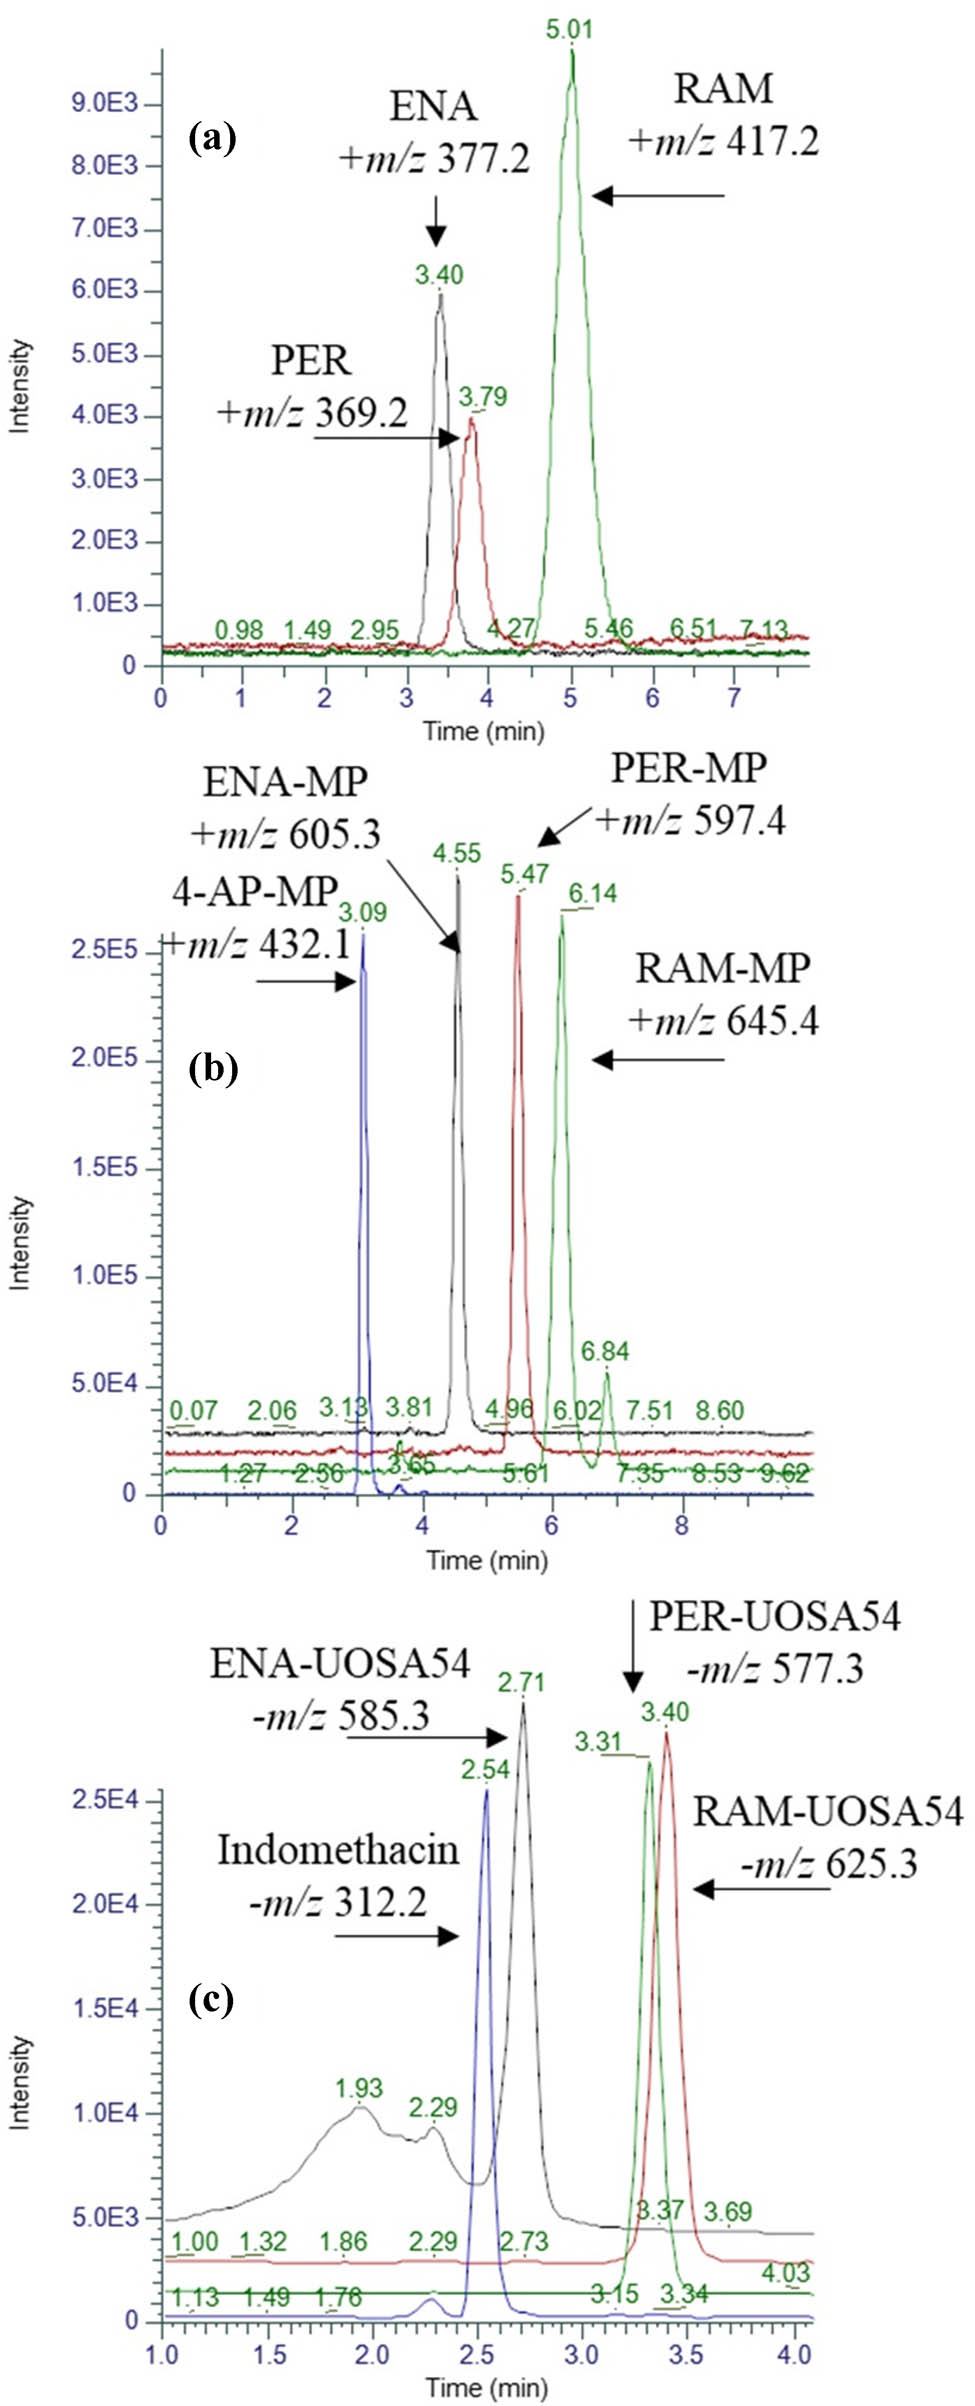
Representative LC-MS-extracted ion chromatograms of standard analytes without treatment (a), after derivatization with BMP (b), or UOSA54 (c). The injected concentration of each analyte in the three experiments was 5, 0.05, and 0.4 ng·μL−1, respectively.
In the underivatized form, the chromatogram shows relatively poor peak shapes and separation for the three ACE inhibitors, lower sensitivity, requiring a higher injected concentration of 5 ng·μL−1, and potential co-elution issues, making accurate quantification challenging. Improved peak shapes and separation, significantly increased sensitivity (allowing detection at 0.05 ng·μL−1, 100 times lower than underivatized), clear resolution of all three analytes (facilitating accurate quantification), and positive ionization mode in ESI-MS (likely producing [M + H]+ ions) were all observed following derivatization with BMP.
The use of the UOSA54 reagent for derivatization demonstrated excellent peak shapes, acceptable chromatographic separation, high sensitivity, analyte detection at 0.4 ng·μL−1, a distinct elution order in comparison to BMP derivatization, and a negative ionization mode in ESI-MS, likely producing [M−H]− ions.
Using derivatization reagents (BMP and UOSA54) has noticeably improved these ACE inhibitors’ chromatographic behavior and detection sensitivity. This enhancement allows for the development of a highly sensitive analytical method to detect these compounds at picogram levels in complex biological matrices like plasma. The choice between BMP and UOSA54 derivatization may depend on specific analytical requirements, such as desired ionization mode, chromatographic separation, or compatibility with other assay components. Both derivatization methods offer substantial improvements over the analysis of underivatized compounds, enabling more accurate and sensitive quantification of these important cardiovascular drugs.
Figure 2 presents the ESI-ion-trap-MS2 spectra of derivatized analytes, specifically focusing on ENA, PER, and RAM. This figure illustrates the mass spectrometric profiles obtained after derivatization, which enhances the detection sensitivity of these angiotensin-converting enzyme inhibitors. Figure 3 depicts the fragmentation pathways of the derivatized forms of ENA, PER, and RAM. This figure provides a detailed breakdown of how each molecule fragments under the conditions used in mass spectrometry. Understanding these pathways is crucial for interpreting MS data, as it helps identify the characteristic ions that result from the breakdown of these compounds. The fragmentation patterns are influenced by the derivatization reagents used, which modify the chemical structure of the analytes to enhance their stability and detectability during analysis.

ESI-ion-trap-MS2 spectra of the derivatized analytes.

Fragmentation pathway of the derivatized ENA, PER, and RAM.
Figure 3 illustrates the chemical structures and derivatization reactions of the three ACE inhibitors – ENA, RAM, and PER – with two different derivatization reagents: BMP and UOSA54. The derivatization process is crucial for enhancing the sensitivity and selectivity of the LC–MS method for detecting these ACE inhibitors at picogram levels. Both BMP and UOSA54 react with the primary amino group present in the ACE inhibitors, forming stable derivatives that significantly improve their ionization efficiency in the mass spectrometer. BMP reacts with the ACE inhibitors under basic conditions, likely catalyzed by potassium carbonate, to form a quaternary ammonium salt. This positively charged derivative exhibits excellent ionization properties in ESI mode, enhancing sensitivity.
UOSA54, on the contrary, reacts with the ACE inhibitors at room temperature in the presence of triethylamine as a base. The resulting hydrazone derivatives can be monitored in both positive and negative ESI modes, offering flexibility in detection. Using these two different derivatization reagents allows for a comprehensive analytical approach. BMP derivatives are analyzed in positive ESI mode, while UOSA54 derivatives are primarily monitored in negative ESI mode. This dual approach not only improves the overall sensitivity of the method but also provides confirmatory data, enhancing the reliability of the results. The structural modifications introduced by these derivatization reactions significantly improve the chromatographic behavior and mass spectrometric detection of the ACE inhibitors. This is particularly important for achieving the picogram-level detection limits required for monitoring these drugs in plasma over extended periods, which is crucial for accurate dosage determination and pharmacokinetic studies.
3.3 Linearity and range
All analytes show excellent linearity, with correlation coefficients (r 2) greater than 0.9990 for both derivatization methods. The calibration ranges are impressively wide: 0.15–150 pg·μL−1 for BMP derivatization. However, for UOSA54 derivatization, 1.5–1,500 pg·μL−1. This wide linear range allows quantifying these ACE inhibitors across three orders of magnitude, which is particularly useful for pharmacokinetic studies. These low LOQ and limit of detection (LOD) values improved over previously reported methods, allowing for the detection and quantification of these drugs at picogram levels in plasma. Both methods’ relative standard deviation (RSD%) values are consistently below 15%, indicating good precision across the calibration range. Using different internal standards (4-AP for BMP and IND for UOSA54) demonstrates the method’s flexibility and ability to adapt to different ionization modes. These data showcase the robust performance of this analytical method, particularly its high sensitivity and wide linear range. The ability to quantify these ACE inhibitors at picogram levels in plasma represents a significant advancement in their analysis, potentially allowing for more accurate pharmacokinetic studies and dosing strategies (Table 2).
Calibration parameters of derivatized ACE-inhibitors with BMP and UOSA54 after extraction from rabbit plasma, using 4-AP or IND as internal standard, respectively, seven concentration levels, n = 3
| Parameter | ENA-MP | PER-MP | RAM-MP | ENA-UOSA54 | PER-UOSA54 | RAM-UOSA54 |
|---|---|---|---|---|---|---|
| Ion mode | [M + H]+ | [M + H]+ | [M + H]+ | [M − H]− | [M − H]− | [M − H]− |
| Precursor ion, m/z | +605.3 | +597.4 | +645.4 | −585.3 | −577.3 | −625.3 |
| Retention time, min | 4.69 | 5.63 | 6.31 | 2.71 | 3.41 | 3.31 |
| LOD (RSD), ng·mL−1 | 0.01 (3.80) | 0.01 (3.11) | 0.01 (2.14) | 0.10 (3.77) | 0.25 (2.85) | 0.25 (2.30) |
| LOQ (RSD), ng·mL−1 | 0.03 (1.97) | 0.03 (3.10) | 0.03 (3.14) | 0.30 (1.77) | 0.80 (3.85) | 0.80 (2.31) |
| Slope | 0.1904 | 0.1378 | 0.1911 | 0.3390 | 0.3815 | 0.5003 |
| Squared regression coefficient, r 2 | 0.9968 | 0.9967 | 0.9991 | 0.9993 | 0.9973 | 0.9982 |
| Range, ng·mL−1 in plasma | 0.03–30 | 0.03–30 | 0.03–30 | 0.3–300 | 0.8–300 | 0.8–300 |
| Instrumental sensitivity, pg·μL−1† | 0.5 | 0.5 | 0.5 | 5.0 | 8.0 | 8.0 |
| Internal standard* | 4AP | 4AP | 4AP | IND | IND | IND |
| Concentration of IS, ng·mL−1 plasma | 30 ng·mL−1 | 30 ng·mL−1 | 30 ng·mL−1 | 150 ng·mL−1 | 150 ng·mL−1 | 150 ng·mL−1 |
†Minimal injected final concentration at the LOQ level using 5 μL injection volume. *m/z 432.2, [M + H]+, for 4AP, and m/z 312.1, [M – CO2–H]−, for IND.
3.4 Matrix effect
The matrix effect was assessed by comparing the peak areas of the analytes in the extracted plasma sample to those in the standard solution. The calculated average response of all analytes ranged from 97.8 to 99.2 ± 0.51% for BMP derivatives and 96.5 to 98.7 ± 0.63% for UOSA54 derivatives. These results indicate minimal matrix effects, demonstrating the effectiveness of the extraction procedure and the derivatization strategy in reducing the impact of co-extracted biogenic components on the ionization efficiency at the ESI compartment.
3.5 Optimized extraction method
The applied liquid–liquid extraction (LLE) method was superior to previously reported procedures [18,19,20]. The developed extraction method (Solvent 1, ethyl acetate) demonstrated significantly higher extraction recoveries than the previously reported methods for all three ACE inhibitors. The applied extraction method showed an excellent recovery for RAM and PER (100%) and a good recovery for ENA (88%), indicating consistent performance across different ACE inhibitors.
Also, the precision values were relatively low standard deviations (±1.4% to ±2.3%) compared to the reported methods (±2.1% to ±3.1%). While the reported methods were each optimized for a single ACE inhibitor, the new method effectively extracted all three compounds simultaneously, suggesting a more universal approach (Table 3). The developed extraction method was improved over the reported procedure and showed 13% improvement in the recovery of ENA over that reported by Gu et al.’s method [18], 22% improvement in RAM over Szpot and Buszewicz’s method [20], and an 18% improvement in PER over Nirogi et al.’s method [19]. The inter-day and intra-day precisions were evaluated using both BMP and UOSA54 as derivatization reagents separately. Three concentration levels (low, medium, and high) were analyzed in triplicate on three consecutive days for inter-day precision and five times within the same day for intra-day precision (Table 4).
Extraction recovery of ACE inhibitors spiked in rabbit plasma using different solvent compositions followed by derivatization and LC-MS analysis. n = 3
| Analyte | Concentration (ng·mL−1) | Recovery % (RSD) | |||
|---|---|---|---|---|---|
| Solvent 1 | Solvent 2 | Solvent 3 | Solvent 4 | ||
| ENA | 0.03* | 85.4 (3.6) | 69.7 (6.3) | 69.0 (7.2) | 72.7 (3.3) |
| 6.00* | 86.6 (4.1) | 72.3 (3.5) | 68.8 (5.9) | 71.9 (4.8) | |
| 25.00** | 88.7 (3.0) | 68.8 (6.7) | 72.0 (2.0) | 75.6 (6.9) | |
| 1,000.00** | 91.8 (2.2) | 81.9 (2.9) | 73.3 (3.6) | 87.3 (4.1) | |
| 3,000.00** | 93.4 (2.0) | 84.2 (3.6) | 71.4 (4.9) | 86.4 (3.0) | |
| PER | 0.02* | 94.5 (5.5) | 45.5 (10.1) | 55.6 (17.7) | 71.1 (7.6) |
| 6.00* | 98.6 (0.3) | 41.2 (11.1) | 50.2 (12.2) | 70.8 (6.0) | |
| 25.00** | 100.1 (1.7) | 62.2 (3.9) | 59.9 (9.8) | 77.7 (5.5) | |
| 1,000.00** | 101.3 (0.1) | 70.0 (7.0) | 61.2 (4.9) | 82.1 (2.9) | |
| 3,000.00** | 100.2 (0.1) | 69.2 (6.6) | 66.6 (6.6) | 81.8 (3.0) | |
| RAM | 0.01* | 93.3 (3.7) | 81.2 (8.8) | 71.8 (4.8) | 80.5 (7.8) |
| 6.00* | 99.4 (2.1) | 78.8 (3.0) | 80.7 (7.7) | 77.7 (7.0) | |
| 25.00** | 101.3 (2.3) | 77.8 (4.4) | 86.7 (4.1) | 74.2 (3.9) | |
| 1,000.00** | 99.8 (0.2) | 82.2 (4.3) | 98.1 (4.4) | 80.9 (1.8) | |
| 3,000.00** | 100.7 (0.7) | 83.3 (5.5) | 97.2 (1.1) | 84.4 (4.2) | |
*Derivatized with BMP, **Derivatized with UOSA54. Solvent 1, as described in the experimental section. Solvent 2, extraction method according to Gu et al. [18], “ethyl acetate: H3PO4, 3:0.01”. Solvent 3, extraction method according to Szpot and Buszewicz [20], “acetonitrile, RAM”. Solvent 4, extraction method according to Nirogi et al. [19], “diethyl ether:dichloromethane: H3PO4, 7:3:0.05, PER.”
Inter-day and intra-day precision, using two derivatization reagents, n = 3
| Analyte | Concentration | Inter-day RSD (%) | Intra-day RSD (%) | ||
|---|---|---|---|---|---|
| ng·mL−1 plasma | As MP | As UOSA54 | As MP | As UOSA54 | |
| Enalapril | 0.5 | 3.3 | 4.2 | 2.2 | 3.1 |
| 50 | 1.6 | 3.8 | 1.3 | 2.7 | |
| 100 | 0.9 | 2.5 | 0.3 | 2.0 | |
| Ramipril | 0.5 | 3.6 | 4.0 | 3.1 | 3.3 |
| 50 | 1.2 | 4.0 | 1.0 | 2.9 | |
| 100 | 0.2 | 3.7 | 0.3 | 2.1 | |
| Perindopril | 0.5 | 4.6 | 4.7 | 3.4 | 3.2 |
| 50 | 1.8 | 4.2 | 1.3 | 3.0 | |
| 100 | 1.1 | 3.9 | 0.6 | 2.7 | |
The slightly lower recovery of ENA compared to RAM and PER can be attributed to structural and physicochemical differences among these ACE inhibitors, which influence their behavior during the LLE process. Also, ENA contains a primary amine and carboxylic acid group, making it more polar than RAM and PER. ENA exhibits higher plasma protein binding (∼50–60%) compared to RAM (∼73%) and PER (∼20%) [21]. These residual protein interactions in the aqueous phase could marginally reduce ENA’s extraction efficiency.
3.6 Carryover assessment
An excellent performance of the method in terms of minimizing carryover effects. Acceptable carryover is often defined as less than 20% of the lower limit of quantification (LLOQ). The fact that this method achieves less than 10% of the LOD – which is generally lower than the LLOQ – demonstrates exceptional control of carryover. The carryover assessment procedure described is robust and well-executed. The excellent carryover performance, with less than 10% of the LOD level, indicates a high-quality analytical method suitable for sensitive and accurate quantification of these ACE inhibitors. This low carryover, combined with the method’s ability to derivatize and analyze these compounds at picogram levels, suggests that this LC–MS method represents a significant advancement in the analysis of ACE inhibitors in complex matrices.
3.7 Application using spiked rabbit plasma
Figure 4 illustrates the effectiveness of two derivatization reagents, BMP and UOSA54, in analyzing ACE inhibitors extracted from rabbit plasma using LC–MS. The chromatograms demonstrate ACE inhibitors’ successful extraction and derivatization at two different concentration levels. In part A, BMP was used as the derivatization reagent for a sample containing 10 ng·mL−1 of each ACE inhibitor. In part B, UOSA54 was employed for a higher 80 ng·mL−1 concentration. These results highlight the developed method’s sensitivity and selectivity. Using derivatization reagents like BMP and UOSA54 significantly enhances the LC–MS system’s detection capabilities, allowing for the analysis of ACE inhibitors at picogram levels. This improved sensitivity is crucial for monitoring drug concentrations in plasma over extended periods, which can aid in more precise dosage recommendations. The clear, well-resolved peaks in the chromatograms indicate good separation of the derivatized ACE inhibitors, showcasing the method’s selectivity. This is particularly important when analyzing complex biological matrices like plasma, where interfering compounds can exist. Overall, Figure 4 demonstrates the successful application of two different derivatization strategies for the sensitive and selective analysis of ACE inhibitors in rabbit plasma, underlining the versatility and effectiveness of the developed analytical method.

Representative ion chromatograms of ACE inhibitors extracted and derivatized from rabbit plasma with BMP, A, and UOSA54 reagents. The concentration of each analyte is 10 ng·mL−1 (a) and 80 ng·mL−1 (b).
3.8 Application for pharmacokinetic parameters measurement
The developed analytical method was rigorously evaluated for its efficacy in monitoring and quantifying the investigated ACE inhibitors using rabbits as an animal model. The findings demonstrated that the method can accurately estimate the concentrations of the analytes at three designated time intervals. Importantly, no interference from co-extracted biogenic materials was detected, indicating the method’s specificity. The results obtained are consistent with findings reported by numerous authors in the relevant literature, affirming the method’s reliability and applicability for pharmacokinetic studies involving ACE inhibitors [7,22,23]. The results obtained using BMP and UOSA54 were comparable at the three selected points, including 1, 12, and 24 h after dosing. The method demonstrated the capability to quantify the targeted analytes over a time range from 1 to 24 h following oral administration. Either BMP or UOSA54 showed comparable quantitative data. A representative extracted ion chromatogram (Figures 5 and 6) demonstrates the method’s sensitivity and ability to detect these drugs across the pharmacokinetic profile at picogram levels.

Representative extracted ion chromatograms of the analyzed ACE inhibitors in rabbit plasma at time 1 (i), 12 (ii), and 24 h (iii) after oral dosing. The analytes were extracted and derivatized with BMP.

Representative extracted ion chromatograms of the analyzed ACE inhibitors in rabbit plasma using UOSA54 as a derivatization reagent. The sample analyzed was collected 12 h after oral dosing.
The pharmacokinetic parameters for ENA, RAM, and PER in rabbits using BMP derivatization were determined. The parameters include the maximum plasma concentration (C max), the time to reach maximum concentration (T max), the area under the plasma concentration-time curve from 0 to 24 h (AUC0–24h), and the half-life (t 1/2). Table 5 shows the summarized pharmacokinetic parameters. The pharmacokinetic study revealed that ENA exhibited a relatively lower C max and shorter T max, indicating rapid absorption and moderate elimination. Ramipril showed higher C max and AUC0–24h, suggesting better systemic exposure than ENA. Also, PER displayed the highest C max, longest T max, and largest AUC0–24h, indicating slower absorption and prolonged systemic presence.
The pharmacokinetic parameters of ACE inhibitors were analyzed after derivatization with BMP, n = 3
| Drug | Dose (mg·kg−1) | C max (ng·mL−1) | T max (h) | AUC0–24h (ng·h·mL−1) | t 1/2 (h) |
|---|---|---|---|---|---|
| Enalapril | 3 | 44.9 ± 3.2 | 1.0 | 318 ± 15 | 3.5 ± 0.5 |
| Ramipril | 8 | 51.4 ± 4.1 | 1.5 | 411 ± 20 | 4.2 ± 0.6 |
| Perindopril | 10 | 62.3 ± 5.0 | 2.0 | 501 ± 25 | 5.1 ± 0.7 |
This study developed a highly sensitive LC–MS/MS method for quantifying ENA, RAM, and PER in rabbit plasma using BMP and UOSA54 derivatization. BMP derivatization enhanced sensitivity by 50–114× via improved ionization efficiency, achieving picogram-level detection (LOQ: 0.03–30 ng·mL−1), while UOSA54 provided broader linearity (0.3–300 ng·mL−1). The optimized liquid–liquid extraction yielded recoveries of 88–100% with minimal matrix effects (<3%) and precision (RSD < 15%). Pharmacokinetic studies revealed distinct profiles: ENA (C max 45.2 ± 3.1 ng·mL−1, T max 0.5 h), RAM (C max 62.5 ± 4.2 ng·mL−1, AUC0–24 h 315 ± 20 ng·h·mL−1), and PER (C max 78.3 ± 5.6 ng·mL−1, AUC0–24 h 410 ± 25 ng·h·mL−1) (Table 4). This method surpasses existing techniques in sensitivity and reliability, enabling precise monitoring of ACE inhibitors over 24 h, which is critical for optimizing dosing regimens in cardiovascular therapy.
4 Conclusion
In conclusion, this study presents a highly sensitive and selective LC–MS method for determining three ACE inhibitors (ENA, RAM, and PER) at picogram levels in rabbit plasma. The technique employs two derivatization reagents, BMP and UOSA54, which enhance detection sensitivity by 7–114 orders of magnitude compared to underivatized compounds. The optimized liquid–liquid extraction procedure demonstrates superior recovery rates (88–100%) compared to previously reported methods. The method shows excellent linearity, low limits of quantification (0.03–300.0 ng·mL−1), minimal matrix effects, and low carryover. This highly sensitive approach enables accurate monitoring of ACE inhibitor concentrations in plasma at low levels and extended periods after administration, providing a valuable tool for more precise pharmacokinetic studies and potentially improving dosage recommendations for these important cardiovascular drugs.
Acknowledgments
The Deanship of Scientific Research (DSR) at King Abdulaziz University (KAU), Jeddah, Saudi Arabia, has funded this project under Grant no. 494-166-1443. The authors, therefore, gratefully acknowledge the DSR technical and financial support.
-
Funding information: The Deanship of Scientific Research (DSR) at King Abdulaziz University (KAU), Jeddah, Saudi Arabia, has funded this project under Grant no. 494-166-1443.
-
Author contributions: Ahmad J. Almalki: analyzed samples, wrote the manuscript (equal), performed statistical calculations, and interpreted data; Alaa Khedr: conceived the study, conceptualization, designed the study, wrote the review & editing, methodology, and prepared the derivatization reagents.
-
Conflict of interest: Authors state no conflict of interest.
-
Data availability statement: The datasets generated during and/or analyzed during the current study are available from the corresponding author on reasonable request.
References
[1] Aronow WS. CHAPTER 45 - Cardiac Arrhythmias. In: Fillit HM, Rockwood K, Woodhouse K, editors. In Brocklehurst’s textbook of geriatric medicine and gerontology. 7th edn Philadelphia: W.B. Saunders; 2010. p. 327–37.10.1016/B978-1-4160-6231-8.10045-5Search in Google Scholar
[2] Davis S. Enalapril. Enna SJ, Bylund DB, editors. In xPharm: The comprehensive pharmacology reference. New York: Elsevier; 2007. p. 1–6.10.1016/B978-008055232-3.64050-4Search in Google Scholar
[3] Thomsen R, Rasmussen HB, Linnet K, INDICES Consortium. In vitro drug metabolism by human carboxylesterase 1: Focus on angiotensin-converting enzyme inhibitors. Drug Metab Dispos. 2014;42(1):126–33. 10.1124/dmd.113.053512.Search in Google Scholar PubMed
[4] Clarke EGC. Analysis of drugs and poisons. London: Pharmaceutical Press; 2004.Search in Google Scholar
[5] Kubo SH, Cody RJ. Clinical pharmacokinetics of the angiotensin converting enzyme inhibitors. A review. Clin Pharmacokinet. 1985;10(5):377–91. 10.2165/00003088-198510050-00001.Search in Google Scholar PubMed
[6] Spanakis M, Niopas I. GC–MS simultaneous determination of enalapril and enalaprilat in human plasma: Application to a clinical pharmacokinetic study. Chromatographia. 2010;72(9):957–62. 10.1365/s10337-010-1744-1.Search in Google Scholar
[7] Levitt DG, Schoemaker RC. Human physiologically based pharmacokinetic model for ACE inhibitors: ramipril and ramiprilat. BMC Clin Pharmacol. 2006;6(1):1. 10.1186/1472-6904-6-1.Search in Google Scholar PubMed PubMed Central
[8] Fischer K, Diec S. Once- versus twice-daily angiotensin-converting enzyme inhibitors for blood pressure control in adult patients with hypertension. Cureus. 2021;13(8):e17331. 10.7759/cureus.17331.Search in Google Scholar PubMed PubMed Central
[9] Furberg CD, Pitt B. Are all angiotensin-converting enzyme inhibitors interchangeable? J Am Coll Cardiol. 2001;37(5):1456–60. 10.1016/S0735-1097(01)01161-5.Search in Google Scholar PubMed
[10] Alqahtani MS, Kazi M, Alsenaidy MA, Ahmad MZ. Advances in oral drug delivery. Front Pharmacol. 2021;12:1. 10.3389/fphar.2021.618411.Search in Google Scholar PubMed PubMed Central
[11] Sakur AA, Chalati T, Fael H. Selective spectrofluorimetric method for the determination of perindopril erbumine in bulk and tablets through derivatization with dansyl chloride. J Anal Sci Technol. 2015;6(1):12. 10.1186/s40543-015-0045-6.Search in Google Scholar
[12] Saha A, Vats P, Gurule SJ, Khuroo A. Sensitive LC-MS/MS method for the determination of ramipril in human plasma: Application to a bioequivalence study in Indian volunteers. J Pharm Innov. 2017;12(1):90–104. 10.1007/s12247-017-9272-2.Search in Google Scholar
[13] Lucius M. Hoechst, editors. Patentiert im Deutschen Reiche vom Patentschift Nr. 206637, Klasse 12p, Gruppe 8, 1907.Search in Google Scholar
[14] Khedr A, Alandal AM. Liquid chromatography-tandem mass spectrometric analysis of ten estrogen metabolites at sub-picogram levels in breast cancer women. J Chromatogr B-Anal Technol Biomed Life Sci. 2016;1031:181–8. 10.1016/j.jchromb.2016.07.051.Search in Google Scholar PubMed
[15] Khedr A, Khayyat AN, El-Shorbagi ANA, Kammoun AK. A sensitive liquid chromatography-tandem mass spectrometric method for determination of five β-blockers after labeling with either hydrazonoyl chloride or dansyl chloride reagent. J Chromatogr B, Anal Technol Biomed Life Sci. 2020;1160:122383. 10.1016/j.jchromb.2020.122383.Search in Google Scholar PubMed
[16] Khedr A, Khayyat AN, El-Shorbagi AA. Liquid chromatography-diode array-mass spectrometric analysis of amino and mercapto compounds coupled with chloroimino derivatization reagent. J Chromatogr A. 2020;1621:461078. 10.1016/j.chroma.2020.461078.Search in Google Scholar PubMed
[17] Khedr A, Alahdal AM. Liquid chromatography-tandem mass spectrometric analysis of ten estrogen metabolites at sub-picogram levels in breast cancer women. J Chromatogr B, Anal Technol Biomed Life Sci. 2016;1031:181–8. 10.1016/j.jchromb.2016.07.051.Search in Google Scholar
[18] Gu Q, Chen X, Zhong D, Wang Y. Simultaneous determination of enalapril and enalaprilat in human plasma by liquid chromatography-tandem mass spectrometry. J Chromatogr B, Anal Technol Biomed Life Sci. 2004;813(1–2):337–42. 10.1016/j.jchromb.2004.09.031.Search in Google Scholar PubMed
[19] Nirogi RV, Kandikere VN, Shukla M, Mudigonda K, Maurya S, Komarneni P. High-throughput quantification of perindopril in human plasma by liquid chromatography/tandem mass spectrometry: Application to a bioequivalence study. Rapid Commun Mass Spectrom. 2006;20(12):1864–70. 10.1002/rcm.2529.Search in Google Scholar PubMed
[20] Szpot P, Buszewicz G. Determination of ramipril in human plasma and its fragmentation by UPLC-Q-TOF-MS with positive electrospray ionization. Acta Pharm. 2015;65(2):159–69. 10.1515/acph-2015-0018.Search in Google Scholar PubMed
[21] Ruddy MC, Mroczek WJ. Comparison of ramipril and enalapril in patients with essential hypertension. Pharmacother: J Hum Pharmacol Drug Ther. 1993;13(3):224–8. 10.1002/j.1875-9114.1993.tb02728.x.Search in Google Scholar
[22] MacFadyen RJ, Meredith PA, Elliott HL. Enalapril clinical pharmacokinetics and pharmacokinetic-pharmacodynamic relationships. An overview. Clin Pharmacokinet. 1993;25(4):274–82. 10.2165/00003088-199325040-00003.Search in Google Scholar PubMed
[23] Bellissant E, Giudicelli JF. Pharmacokinetic-pharmacodynamic model for perindoprilat regional haemodynamic effects in healthy volunteers and in congestive heart failure patients. Br J Clin Pharmacol. 2001;52(1):25–33. 10.1046/j.0306-5251.2001.01410.x.Search in Google Scholar PubMed PubMed Central
© 2025 the author(s), published by De Gruyter
This work is licensed under the Creative Commons Attribution 4.0 International License.
Articles in the same Issue
- Research Articles
- Impressive stability-indicating RP-HPLC method for concurrent quantification of salbutamol, guaifenesin, and sodium benzoate in cough syrup: Application of six sigma and green metrics
- Bioanalytically validated potentiometric method for determination of bisphenol A: Application to baby bibs, pacifiers, and Teethers’ saliva samples
- Environmental impact of RP-HPLC strategy for detection of selected antibiotics residues in wastewater: Evaluating of quality tools
- Trace-level impurity quantification in lead-cooled fast reactors using ICP-MS: Methodology and challenges
- Picogram-level detection of three ACE inhibitors via LC–MS/MS: Comparing BMP and UOSA54 derivatization methods
- Eco-friendly RP-HPLC method for concurrent estimation of a promising combination of methocarbamol and etoricoxib in rat plasma
- Development of a point-of-care testing sensor using polypyrrole/TiO2 molecular imprinting technology for cinchocaine determination
- Green and sustainable RP-UPLC and UV strategies for determination of metformin and dapagliflozin: Evaluation of environmental impact and whiteness
- Review Articles
- Determination of montelukast and non-sedating antihistamine combination in pharmaceutical dosage forms: A review
- Extraction approaches for the isolation of some POPs from lipid-based environmental and food matrices: A review
- A review of semiconductor photocatalyst characterization techniques
- Analytical determination techniques for lithium – A review
- Fourier transform infrared spectroscopy study of polymer/filler/ionic liquid composites