Trace-level impurity quantification in lead-cooled fast reactors using ICP-MS: Methodology and challenges
-
Ana Maria Ivan
 ,
Marioara Abrudeanu
,
Marioara Abrudeanu

Abstract
Lead-cooled fast reactors (LFR), such as the ALFRED Demonstrator, are pivotal in advancing nuclear technology. This study presents a method for quantifying trace-level impurities generated through various nuclear reactions in lead coolant. It combines inductively coupled plasma mass spectrometry with Sr-resin-based matrix separation to analyze trace impurities in lead matrices. The Sr-resin effectively removes lead, a highly interfering matrix, enhancing the precision and reliability of detecting trace elements. The study evaluates the effectiveness of lead matrix removal and assesses the method’s reliability for monitoring trace impurities in LFR systems. The results indicate the method’s suitability for tracking small changes in lead composition during the operation of lead-cooled facilities.
1 Introduction
Lead-cooled fast reactors (LFRs) are at the forefront of Gen IV nuclear technology, representing a promising route for advancing the field [1]. Thanks to the intrinsic features of using lead as a coolant, LFRs can claim unparalleled safety performances [2]. The ALFRED (Advanced Lead Fast Reactor European Demonstrator) project aims to build a 125MWe nuclear reactor demonstrator as a critical milestone toward the commercial deployment of LFR technology [3]. The project addresses the current gaps in infrastructure across Europe that are necessary to support the design of an LFR [4]. In this way, the expanded ALFRED Research Infrastructure (ALFRED-RI) will cover all aspects of technology advancement through a systemic and integrated approach involving universities, research institutions, industry, utilities, and safety authorities [5].
One aspect of LFR technology that requires further investigation is the production of hazardous radioactive elements generated by nuclear fission or neutron activation of the coolant and their volatilization from the liquid metal. These processes are essential role in evaluating the radioactivity released under both normal and accidental conditions [6].
The main phenomena that determine or influence the transport of impurities in the reactor vessel, such as lead activation products (APs) or fission products (FPs) (in the event of fuel cladding failure), include phase transformation, deposition, adsorption/desorption, dissolution/precipitation, and vaporization/condensation leading to the formation of new species in both liquid lead and cover gas [7].
The non-volatile APs or FPs will be retained in lead, while the volatile ones with no or low affinity for lead and a half-life longer than the time needed to cross the lead pool will migrate to the cover gas. The fission and APs that are volatile or show non-negligible volatility in an LFR system are tritium, noble gases (Xe, Kr), some APs (Po, Hg, Cd), and some FPs such as Cd, Cs, I, and Te.
The volatile products are either transported to the cover gas or deposited on the structural materials. While there are studies on their behavior [8], there is still insufficient data on their retention in lead or the chemical species they form with dissolved oxygen or among each other.
An experimental effort is planned for supporting the safety analysis of ALFRED, and a suitable infrastructure to support the R&D efforts, also addressing the challenges related to severe accidents in an LFR system, a dedicated infrastructure will be established in Romania, at the RATEN-ICN platform site. The experimental facility, named Meltin’Pot, is designed to investigate the behavior of impurities in liquid lead and study phenomena associated with severe accidents. It will include four experimental modules, each focused on a specific area of study: fuel–coolant interaction; fuel dispersion and relocation after a severe accident scenario; FPs retention in lead and/or migration in cover gas; investigation on retention in lead of polonium isotopes; and gas/steam – FPs/Po stripping from lead to cover gas [9].
For studying the retention in lead of different impurities, a precise methodology for quantifying trace-level impurities in both lead and the cover gas is essential. This study presents a methodology for measuring trace-level impurities in lead based on a matrix separation procedure followed by inductively coupled plasma mass spectrometry (ICP-MS) analysis.
2 Radionuclide inventory in ALFRED
To gain a comprehensive understanding, it is essential to have a clear picture of all the impurities formed under specific operating conditions, whether normal or abnormal, in a lead-cooled reactor.
To identify volatile hazardous radionuclides transported in the cover gas above the lead coolant-free level of the ALFRED, and to estimate their quantities during normal operation, the inventory of the ALFRED reactor at the End-of-Cycle (EOC) and End-of-Life (EOL) was considered. This evaluation, conducted for all 171 fuel subassemblies [10] and the entire lead coolant [11] after 5 years (EOC) and 40 years of irradiation (EOL), was performed using the Monte Carlo radiation transport computer code (MCNPX 2.7.0) and FISPACT activation code in the framework of EU FP7 – LEADER project [12].
The ALFRED reactor radionuclide inventory is derived from the following dataset:
The total amount of lead coolant is 3,400 tons, equivalent to 1.64 × 10⁷ mol of lead;
FP inventory at EOC, representing the maximum residence time of the fuel in the reactor, was averaged over 171 subassemblies;
The lead AP inventory was calculated for both 5 years (corresponding to EOC) and 40 years (corresponding to EOL) of irradiation;
The inventory includes the isotopes with a half-life greater than 6.5 h.
Figure 1 illustrates the inventory of the APs formed in lead through neutron activation after 5 and 40 years of irradiation, respectively. The elements denoted in the figure in black represent the intrinsic impurities of lead, while the red ones are generated through lead activation. The lead coolant activation analysis was performed for weight compositions similar to the C00 lead brand (purity level of 99.9985%) [11].

The amount of impurities from lead activation: grey columns – Pb initial composition; blue columns – APs formed in lead after 5 years of irradiation; orange columns – APs formed in lead after 40 years of irradiation.
Figure 2 presents the inventory of the FPs at EOC averaged over 171 subassemblies. The inventory of lead impurities may increase only in the case of fuel cladding failure. Even in this case, most of the elements released from the fuel element will be retained by lead, and only a few will end up in the cover gas of the reactor [6]. These are elements that are volatile or exhibit non-negligible volatility in normal operating conditions of a lead-cooled reactor.

The total amount of FPs at EOC.
The critical impurities, either the APs or FPs, are those exhibiting significant volatility or non-negligible volatility under normal operating conditions of the ALFRED reactor and are mainly represented by tritium, noble gases (Xe, Kr), lead APs (Po, Hg, Cd, Te), and FPs (Cs, I, Cd, Te). To study the behavior of these impurities both in gaseous and liquid phases, a dedicated infrastructure is foreseen to be developed at RATEN-ICN Pitesti [13].
The methodology selected for the quantification of impurities, whether volatilized or retained in lead, relies on mass spectrometry. Thus, the volatilized fraction in the cover gas above the molten lead will be measured using a Quadrupole Mass Spectrometer. Additionally, the fraction retained in the liquid lead will be assessed using an ICP-MS.
Measuring the impurities retained in lead represents a methodological challenge due to the trace levels of impurities formed by activation, ranging from parts per trillion (ppt) to parts per billion (ppb). The amount of impurities can increase in case of a fuel cladding failure that leads to the spread of FPs into the molten lead.
Table 1 outlines the maximum concentration of APs that can be found in the ALFRED reactor at EOC and EOL, respectively, without any fuel failure. Also, this estimation takes into account two accident scenarios by considering an increase in concentration resulting from the release of FPs due to either a single subassembly failure (0.6% FPs release) or the worst-case scenario of seven subassemblies failing (5% FPs release).
Maximum impurities concentration within lead in different scenarios for ALFRED
| Volatile impurities | APs concentration (ppb) | APs + FPs concentration at EOC (ppb) | ||
|---|---|---|---|---|
| EOC | EOL | 1 subassembly | 7 subassemblies | |
| Polonium | 2.53 × 10⁻³ | 8.33 × 10⁻³ | — | — |
| Mercury | 5.00 × 1002 | 5.00 × 1002 | — | — |
| Cadmium | 5.03 × 1002 | 5.21 × 1002 | 5.05 × 1002 | 5.13 × 1002 |
| Tellurium | 1.01 × 1001 | 7.93 × 1001 | 1.01 × 1001 | 1.05 × 1001 |
| Iodine | 1.13 × 10⁻⁸ | 7.42 × 10⁻⁶ | 3.71 × 1000 | 2.60 × 1001 |
| Cesium | — | — | 7.11 × 1001 | 4.98 × 1002 |
| Rubidium | — | — | 4.75 × 1000 | 3.33 × 1001 |
Accurate quantification of trace impurities that may be released from the molten lead contributes to better control of the coolant’s chemical composition, essential in maintaining safety in operation and preventing accidental releases into the environment. Additionally, these insights support the reactor design and licensing by providing valuable data on impurity behavior, ensuring compliance with safety standards, and facilitating the development of LFR technology.
This study is focused on two elements, cadmium and tellurium, both generated through lead activation and fission. Cadmium, in particular, holds significance due to its high volatility in normal operating conditions. This high volatility is due to the weak interaction of cadmium with lead, which prevents its retention in the molten metal matrix [7]. It has a melting point of 321°C and a boiling point of 767°C, being completely miscible with lead at temperatures higher than 327°C, but no intermetallic compounds with lead are known indicating no retention of Cd in liquid lead. Although there are studies of pure Cd vapor pressure, investigations of the Cd-Pb system have shown deviations from ideal behavior [8]. As a consequence, a comprehensive study of Cd behavior in molten lead is needed all the more as it is considered as one of the most volatile elements after Mercury.
Tellurium emerges as a noteworthy impurity with a substantial impact on the radioactivity release. It is produced both by lead neutron activation and fission processes. Notably volatile, Te primarily evaporates as a compound with lead [14]. However, recent investigations at the European level suggest the intriguing possibility that Te could also evaporate as a diatomic molecule [15]. This dual behavior emphasizes the complexity of Te’s interactions in the lead cooled reactor environment.
Of particular interest is the tellurium’s homology with the radiotoxic polonium, a by-product formed through lead activation in a lead-cooled reactor [16]. Understanding the behavior of Te in lead becomes essential, not only due to its volatility but also for the insights it provides into the chemistry of Po, which is a radiotoxic element with potential impact on reactor safety and the environment. This knowledge becomes essential for our understanding of the complex processes occurring within a lead-cooled reactor.
To gain a comprehensive understanding of the behavior of impurities in molten lead, it is compulsory to make use of a reliable method for the quantification of trace-level impurities. In this regard, the ICP-MS method was considered in this study due to its versatility as one of the most robust trace elemental analysis techniques available today.
2.1 Trace-level analysis methodology
In trace elemental analysis, X-ray fluorescence (XRF), atomic absorption spectrometry (AAS), and ICP-MS are commonly used techniques. XRF is fast and non-destructive but lacks the sensitivity needed for ultra-trace detection, especially in heavy matrices like lead [17,18,19]. AAS offers comparable sensitivity to ICP-MS but is limited to single-element analysis [20]. ICP-MS, with its ppt-level sensitivity and multi-element capability, is the most suitable for complex matrices [21]. This study applies a methodology that combines ICP-MS with Sr-resin-based matrix separation to analyze trace impurities in lead matrices. The Sr-resin effectively removes lead – a highly interfering matrix – thereby improving the precision and reliability of detecting trace elements such as cadmium (Cd) and tellurium (Te) [22].
The application of ICP-MS combined with matrix separation on crown ether resin has been demonstrated in experiments using lead-bismuth eutectic (LBE), as reported by Tindemans et al. [23]. An offline analyte/matrix separation process was used to diminish matrix effects, using AG 1-X4 anion-exchange resin (100–200 mesh) and extraction chromatographic Pb-Spec resin (100–150 mm). This underscores the versatility of this methodology for similar matrices. The Pb-resin’s high selectivity for lead ensures accurate impurity quantification, even in complex systems where matrix effects are prevalent [24].
While ICP-MS stands out as a powerful analytical technique, it is important to acknowledge the intricate processes that unfold throughout sample introduction, transport to the ICP, within the ICP itself, and during the extraction of ions from the ICP [25]. Furthermore, the subsequent transport of ions through the ion optics to the detector can give rise to both spectroscopic and non-spectroscopic interferences. Spectroscopic interferences occur when another ion is detected at the same mass-to-charge ratio (m/z) as the analyte. On the other hand, non-spectroscopic interferences, often termed matrix effects, encompass variations in analyte signal intensity, involving either suppression or enhancement. These variations are in contrast to the expected signal derived from the same analyte concentration in a matrix-free solution [26].
The influence of the lead matrix on the analyte is substantial, with observed variations of up to 40% suppression in the determined intensity for different constituents [27] in samples with 80% lead matrix content. Given the elevated lead concentration in our samples (≥99.999% Pb), a meticulous approach is imperative to accurately determine trace-level impurities retained by lead. Therefore, the mitigation or elimination of matrix effects becomes a critical prerequisite.
To reduce or eliminate the matrix effect, various techniques have been evaluated, such as diluting the sample, precipitating the lead matrix and solid-phase extraction. Even though dilution will reduce the matrix effect it will also diminish the concentration of the analytes already present at trace level. On the other hand, precipitating the lead matrix carries the risk of co-precipitating analytes, thereby introducing complexities in the separation process.
This study focuses on the solid-phase extraction method, an effective technique for removing the interfering lead matrix while preserving the analyte concentrations. The methodology uses Sr-spec, a crown ether resin derived from the same crown ether as Pb-spec, specifically 4,4′(5′)-di-t-butylcyclohexano 18-crown-6, dispersed in n-octanol and immobilized on an inert polymeric support. In contrast to the Pb-spec resin, Sr-spec contains a higher concentration of the crown ether facilitating stronger lead retention, with a capacity of 29 mg Pb·g−1 dry resin. The maximum lead affinity is observed at 1M nitric acid concentration [22].
The Sr-Spec resin-based solid-phase extraction method was applied to remove the lead matrix from samples similar to those from a lead-cooled facility. Following the removal of the lead matrix, the concentrations of Cd and Te were subsequently determined using ICP-MS and the quantitative recovery from separation was assessed.
3 Materials and methods
3.1 Reagents and instrumentation
Quantitative measurements were conducted using the ICP-MS ELAN DRC II (Perkin Elmer SCIEX). The instrument settings and the data acquisition parameters are summarized in Table 2. Before usage, the instrument was optimized using a standard solution (Elan Smart Tune) containing 10 μg·L−1 of the following elements: Ba, Be, Ce, Co, In, Mg, Pb, Rh, and U in 1% HNO3. The instrument was tuned before starting the measurements for the count rates of 23Mg, 114In, and 238U to the values of ≥5 × 10⁵, 2.5 × 10⁵, and 2 × 10⁵ counts/ppb, respectively.
ELAN DRC II Instrument settings for quantitative analysis
| Setting/parameter | Value/description |
|---|---|
| Nebulizes gas flow | 0.99 L·min−1 |
| Auxiliary gas flow | 1.2 |
| Plasma gas flow | 15 |
| ICP RF power | 1,400 W |
| Detector mode | Dual |
| Runs | 3 |
| Number of replicates | 3 |
| Signal profile processing mode | Average |
| Dead time | 45 ns |
| Total analysis time per run | ∼9 s |
| Nuclides monitored | 111Cd, 130Te |
The quantitative analysis of Cd and Te was achieved through an external calibration method. This method assesses the analyte concentration via a calibration curve established by the analysis of separately measured standards in the range of expected concentration [21]. The intensities of the calibration standards were plotted vs their concentrations, and a linear regression line was calculated. Applying the corresponding linear equation of the form y = ax + b, where a is the calibration slope and b is the y-axis intercept, the analyte concentration in the sample (x) can be calculated from the analyte intensity (y). The calibration curves were plotted linearly through zero. Data from the ICP-MS was collected and visualized using the ELAN 3.4 Instrument Control Software and Microsoft Excel 2016.
The samples and standards were prepared by mass concentration. In this process, reagents and solutions were weighed with high precision using the analytical scale, Mettler Toledo Model XP504, with 0.1 mg readability.
The reagents used in the analytical preparation of both samples and standard solutions were of analytical grade or certified reference material. For lead sample preparation, a Pb powder with a purity exceeding 99% from Thermo Scientific (Cat. No. 198110010, Lot A0451253) was used and further dissolved in a solution of 2M nitric acid prepared from HNO3 67–68 wt% (EcoMold Invest Lot NL20415802). Standard calibration solutions were prepared using ICP multi-element standard solution VI 30 components in 5% HNO3 from CPAchem (ref. 110580.L1) [28]. This standard solution holds certified values for Te and Cd of 9.934 ± 0.051 mg·L−1 and 9.999 ± 0.030 mg·L−1, respectively. Throughout the matrix-removal procedure, all samples, solutions, and dilutions were prepared with ultra-pure water (UP) from Milli-Q SimPak® 2 that had a resistivity of ≥18.2 MΩ.
For the retention of lead, 2 mL prefilled columns containing Sr-resin (SR-C20-A Lot FSRA230821) with a particle size of 100–150 µm and a density of 0.33 g·mL−1 were procured from Triskem International.
3.2 Experimental method
The objective of this study was to assess the effectiveness of lead matrix removal for trace-level elements present in samples extracted from lead-cooled facilities. The study aimed to determine the recovery percentage of these elements after their separation from the matrix.
The lead sample, designed to contain a known lead concentration alongside trace-level impurities, aimed to be representative of an actual sample extracted from the experimental facility or the lead-cooled reactor. The composition of the real sample involves 50 mg of lead, dissolved in 25 mL of nitric acid, resulting in a final sample with a lead concentration of 20 mg·mL−1.
In the dissolution of lead samples, it is important to consider that the solubility of Pb in nitric acid is approximately 0.2 g·mL−1 at a concentration of 2 M, reaching a maximum (∼0.23 g·mL−1) at 2.5 M [29]. Nitric acid is a strong oxidizing agent, reducing metallic lead to Pb(ii) according to reaction (1). At a concentration higher than 2.5 M of HNO3, Pb(ii) changes to Pb(iv), leading to the formation of a PbO2 layer on the metallic surface, which is very difficult to dissolve.
The Pb samples, approximatively 1 g each, were dissolved in quartz vessels in 20 mL of 2M nitric acid on a hot plate set to 80°C and were left overnight to cool. The resulting solution was clear, with no visible impurities. The solution was further diluted with UP water up to a final volume of 50 mL, resulting in a final concentration of approximately 20 mg·mL−1.
The lead stock solution was subsequently spiked with a known quantity of elements that are under investigation, yielding concentrations ranging from 5 to 125 ppb using the ICP-MS standard solution. The amount of trace-level impurities is significant in the context of the element estimation conducted for the ALFRED reactor, as detailed in Table 1.
A volume of 1 mL from the prepared stock solution, spiked with trace-level impurities, was passed through a 2 mL column filled with Sr-resin that had been preconditioned with 10 mL of 0.2 M nitric acid. The crown ether selectively binds Pb(ii) ions, preventing their passage through the column. The column was rinsed with 20 mL of 1M HNO3. The elution process occurred gravitationally, with a solution flow rate of approximately 0.3 mL·min−1. Eluate 1 (E1) was collected, and the elements separated from the lead matrix were measured using ICP-MS. The column was washed again, this time with 20 mL of 0.2 M HNO3, and eluate 2 (E2) was collected and measured accordingly. The schematic representation of the lead matrix separation procedure is presented in Figure 3.
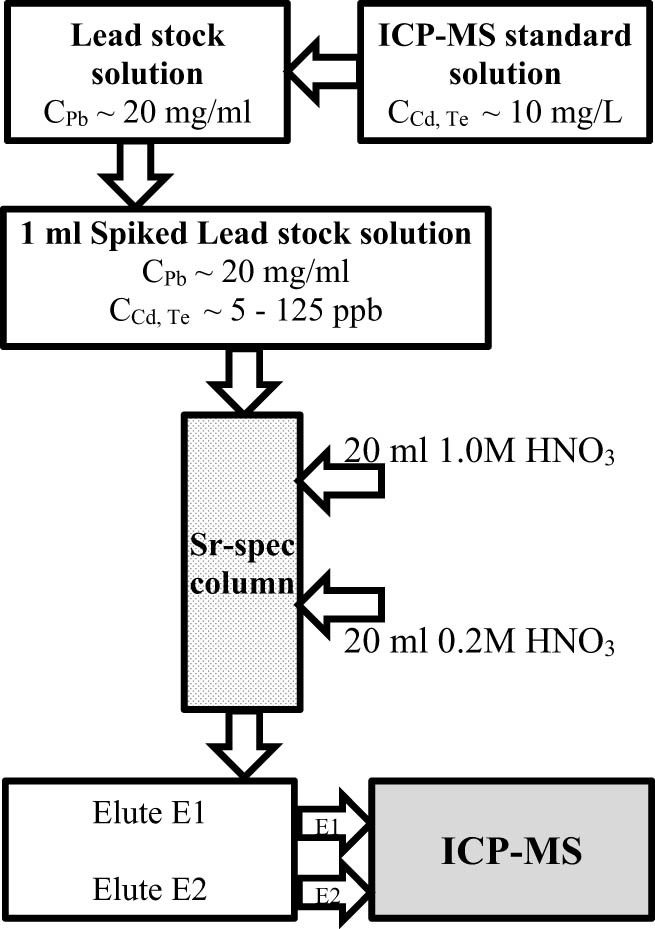
Schematic representation of the lead matrix separation procedure.
In selecting this method, a key consideration was its environmental impact and alignment with the principles of green analytical chemistry [30,31]. This includes reducing the use of hazardous materials, minimizing waste, and ensuring robust, transparent analytical processes [32]. In the context of impurity quantification in LFRs, these factors are particularly relevant due to the environmental risks posed by lead and the hazardous radioactive elements generated during operation. The proposed method for trace-level impurity analysis in lead-cooled reactors supports sustainability by promoting cleaner nuclear energy through safer reactor designs and better impurity control, ultimately contributing to a low-carbon future. Additionally, the use of ICP-MS – an ultra-sensitive analytical technique – further enhances the method’s green profile by conserving resources and reducing the need for repeated experiments.
The procedure described aligns with the integrated management system requirements at RATEN-ICN, complying with quality standards (SR EN ISO 9001:2015 [33]), environmental standards (SR EN ISO 14001:2015 [34]), occupational health and safety standards (SR ISO 45001:2018 [35]), and relevant legal and regulatory requirements.
4 Results and discussion
Several lead samples, each spiked with various amounts of Cd and Te, were meticulously prepared, subjected to separation on Sr-resin and subsequently analyzed. This process aimed to evaluate the effectiveness of matrix removal for lead compositional analysis.
In the lead solution with a concentration of ∼20 mg·mL−1 Pb, the Cd and Te impurities were spiked using an ICP multi-standard solution. The resulting solutions contained trace-level impurities ranging from 5 to 120 ppb, a spectrum reflective of concentrations observed in different scenarios within the ALFRED reactor. The concentrations obtained in the solutions used in these experiments are presented in Table 3.
Initial data of the samples prepared for the matrix separation procedure
| Experiment | Pb concentration (mg·g−1) | Cd concentration (ppb) | Te concentration (ppb) |
|---|---|---|---|
| Exp. 1 | 18.68 | 78.88 | 78.28 |
| Exp. 2 | 18.68 | 125.75 | 124.73 |
| Exp. 3 | 18.68 | 4.24 | 4.21 |
| Exp. 4 | 18.68 | 7.47 | 7.53 |
The Sr-resin column (2 mL prefilled) was first conditioned with 10 mL of 0.2 M nitric acid to activate the resin before sample loading. A 1 mL aliquot of the lead solution, spiked with Cd and Te, was then passed through the column, allowing lead to be retained while the impurities flowed through. To elute the spiked elements, the resin was first rinsed with 20 mL of 1 M HNO3, and the eluent was collected as E1. The separation was conducted under gravitational flow at an approximate rate of 0.3 mL·min−1. A subsequent wash with 20 mL of 0.2 M HNO3 was performed, with the eluent collected as E2, maintaining the same flow rate of 0.3 mL·min−1 throughout the process.
The solutions E1 and E2 were subjected to analysis to determine the recovery of each spiked element that underwent separation from the lead matrix. The recovery of each spiked element was calculated as the percentage of the theoretical concentration expected in case of full separation of the impurity from the lead matrix, relative to the measured concentration, as follows:
To quantify the amounts of the elements of interest in the eluted solutions using ICP-MS, the external standardization method was employed. This methodology involves measuring a blank solution, followed by a series of standard solutions with known concentrations. These standards were used to construct a calibration curve within the desired concentration range.
Four distinct calibration curves were constructed using standard solutions of Cd and Te. These standards were prepared from ICP-MS multi-element standard solution, dissolved in 1% (v/v) nitric acid. The certified value for Cd is 9.999 ± 0.030 μg·mL−1, and for Te, it is 9.923 ± 0.051 μg·mL−1. Using this solution, two calibration curves were developed for each investigated element: one spanning the concentration range from 1 to 7 ppb and another from 0.1 to 1 ppb.
The calibration curves for Cd and Te are visually depicted in Figure 4, showing good linearity (correlation coefficient >0.995) and the calibration equation for each curve. The Limit of Detection was calculated as the analyte concentration giving a signal equal to the blank signal, y B, plus three standard deviations of the blank, s B [36].

The calibration curves for quantitative analysis of Cd (a) and Te (b).
The calibration curves serve as a foundation for accurate quantification of Cd and Te in eluate solutions and samples containing the lead matrix. Each sample was analyzed three times to ensure reliable measurements.
Table 4 provides the measurements of Cd and Te concentrations in the eluate solutions from each experiment. For the first elution (E1 – 20 mL 1M HNO3), the relative standard deviation (RSD) of the measured concentrations was below 2% for most cases, ensuring the precision of the measurements. In the second elution (E2 – 20 mL 0.2 HNO3), Cd and Te concentrations were not measured or were very close to the detection limit, indicating efficient separation.
Obtained recoveries by applying the separation procedure to lead samples ∼20 mg·mL−1 Pb and 5–125 ppb of target elements
| Element | Experiment/elution | Initial concentration (ppb) | Measured concentration (ppb) | Concentration RSD (%) | Recovery (%) |
|---|---|---|---|---|---|
| Cd | Exp. 1/E1 | 3.50 | 6.39 ± 0.05 | 0.8 | 182.3 |
| Exp. 1/E2 | — | 0.05 ± 0.01 | 9.2 | ||
| Exp. 2/E1 | 5.53 | 7.86 ± 0.05 | 0.6 | 142.2 | |
| Exp. 2/E2 | — | 0.04 ± 0.00 | 6.8 | ||
| Exp. 3/E1 | 0.20 | 3.67 ± 0.04 | 1.2 | 1,785.6 | |
| Exp. 3/E2 | — | BDL* | |||
| Exp. 4/E1 | 0.37 | 3.94 ± 0.04 | 1.0 | 1,075.5 | |
| Exp. 4/E2 | — | 0.22 ± 0.04 | 16.2 | ||
| Te | Exp. 1/E1 | 3.48 | 3.62 ± 0.03 | 0.9 | 103.9 |
| Exp. 1/E2 | — | BDL* | |||
| Exp. 2/E1 | 5.48 | 5.19 ± 0.05 | 0.2 | 94.7 | |
| Exp. 2/E2 | — | 0.04 ± 0.00 | |||
| Exp. 3/E1 | 0.20 | 0.93 ± 0.05 | 5.8 | 455.8 | |
| Exp. 3/E2 | — | BDL* | |||
| Exp. 4/E1 | 0.36 | 1.11 ± 0.03 | 2.7 | 304.9 | |
| Exp. 4/E2 | — | BDL* |
*BDL = bellow detection limit.
The recoveries of the target elements are expressed as percentages of their initial theoretical concentrations, as expected in E1 (∼20 g of solution), assuming complete separation from the lead matrix.
The results show strong enrichment of the investigated elements in E1 solutions, while no or very small concentrations were found in the second elution. This enrichment phenomenon raises questions about its source, and a plausible explanation could be traced back to the lead powder used in the sample preparation process. According to the Certificate of Analysis [37], the lead powder has a tested purity of 99.5% Pb, but there is no mention of the impurity contained in the powder.
To assess the Cd and Te content in the Pb powder and to adjust the recovery of each element measured in the eluted solutions, 1 mL aliquot of the lead stock solution (Pb-18.68 mg·mL−1), without any spiked elements, was passed through a 2 mL Sr-spec column. The column was further eluted with 20 mL of 1M HNO3. The eluate was collected, weighed, and analyzed to determine the concentrations of Cd and Te impurities present in the powder. The measurements were repeated three times, yielding the following results: the concentration of Cd in the elute was 3.01 ± 007 ppb (RSD 2.2%), and the concentration for Te 0.54 ± 0.02 (RSD 3.1%). These values correspond to the impurity content of 3.34 μg·g−1 of Cd and 0.60 μg·g−1 of Te in the lead powder.
The intrinsic impurity content of the lead powder is notably high, leading to challenges in measuring the very low concentrations separated from the lead matrix. A discrepancy of three orders of magnitude for Cd and Te highlights the difficulty of precisely measuring extremely small amounts in the presence of such significant inherent contaminants.
The recovery percentages of elements separated from the lead matrix were adjusted based on the measured impurity content in the lead powder. The impurity content that enriched the sample’s concentrations of Cd and Te was assessed for each experiment, considering the lead mass passed through the column, corresponding to the 1 mL aliquot (∼19 mg Pb). The amount of Cd and Te originating from the lead powder (∼0.066 µg Cd and ∼0.012 µg Te) was added to the amount of spiked element for each experiment, corresponding to the 1 mL aliquot passed through Sr-column, and, knowing the mass of elute, the initial theoretical concentration was corrected. Using the relation (2) for recovery, the corrected recovery of each element was determined, where the initial theoretical concentration includes the contribution from the lead powder impurities. The corrected recovery values, along with corresponding data, are presented in Table 5.
Recoveries corrected for the contribution of the lead powder
| Element | Experiment/elution | Mass from spike (µg) | Mass of elution (g) | Corrected initial concentration (ppb) | Corrected recovery (%) | Average recovery from LBE samples [23] (%) |
|---|---|---|---|---|---|---|
| Cd | Exp. 1/E1 | 0.083 | 23.769 | 6.28 | 101.8 | |
| Exp. 2/E1 | 0.132 | 23.819 | 8.27 | 95.0 | ||
| Exp. 3/E1 | 0.004 | 21.798 | 3.23 | 113.6 | ||
| Exp. 4/E1 | 0.008 | 21.782 | 3.40 | 115.9 | ||
| The average recovery of Cd | 106.6 ± 8.6 | 107.5 ± 5.2 | ||||
| Te | Exp. 1/E1 | 0.083 | 23.769 | 3.98 | 90.8 | |
| Exp. 2/E1 | 0.131 | 23.819 | 5.98 | 86.8 | ||
| Exp. 3/E1 | 0.004 | 21.798 | 0.75 | 123.7 | ||
| Exp. 4/E1 | 0.008 | 21.782 | 0.91 | 121.4 | ||
| The average recovery of Te | 105.7 ± 17.0 | 96.0 ± 4.8 | ||||
The recovery values for Cd and Te were largely within the acceptable range for ICP-MS analysis (85–115%) [38], although some values slightly exceeded the upper limit, likely due to intrinsic matrix effects. These deviations were considered acceptable, given the experimental challenges and the corrections applied. Therefore, this method is considered suitable for monitoring small changes in the chemical composition of lead in experimental facilities or a fast reactor.
The average recovery of each element was compared with the results reported by T. Tindemans, who conducted analogous analytical determinations of trace-level impurities in LBE samples using Pb-spec resin for lead retention. The findings of this work are in good agreement with those reported by Tindemans et al. [23].
Using the described method, two samples of approximately 1 g each from commercially available lead ingots (Pb-99.95%) were provided by SC ROM PLUMB Group SRL. Each sample was dissolved in 20 mL of 2M of HNO3, and further diluted to a final volume of 50 mL using UP water. An aliquot of 1 mL was analyzed for their cadmium, tellurium, and bismuth content. Bismuth is one of the most significant intrinsic impurities found in lead, as it can result in the formation of the hazardous volatile impurity polonium-210 (Po-210) through neutron activation in an LFR [39]. The results, presented in Table 6, show that volatile impurities such as Cd and Te are present at parts per million level, while the Bi content is much higher. This higher Bi concentration is expected to impact the production of Po-210 in a lead cooled reactor.
Average measured impurities in lead ingots
| Element | Concentration measured by ICP-MS (μg·g−1) |
|---|---|
| Cd | 2.64 ± 0.02 |
| Te | 0.09 ± 0.01 |
| Bi | 3,530.57 ± 68.96 |
Distinct analyses were conducted to evaluate the impact of the lead matrix on trace-level impurities. In these experiments, an aliquot of 1 mL from the lead stock solution, spiked with Cd and Te at concentrations ranging from 0.005 to 0.01 µg·mL−1, was added to 20 mL of 1 M HNO3 to replicate the matrix of elution E1. Subsequently, the mixture was analyzed using ICP-MS. The results presented in Figure 5 reveal a significant signal suppression, exceeding 86% for Cd and 92% for Te, respectively.

Effect of the lead matrix on the signal intensity of the trace level impurities.
5 Study limitation and future prospect
Though the described method is highly sensitive and reliable for trace impurity measurement in lead, it does present several challenges. The procedure is labor-intensive, requiring careful handling during sample preparation, lead dissolution, and matrix separation.
Another major challenge arises from inherent impurities in the lead matrix. These must be well-characterized to discriminate them from impurities generated through nuclear reactions. Addressing these issues requires the use of higher-purity lead in nuclear facilities to prevent an increase in highly volatile products caused by intrinsic impurities.
This approach can be readily applied to the experimental facilities planned for development at the RATEN-ICN site [13], dedicated to study the behavior of impurities in molten lead. These facilities will use stable isotopes to simulate activation and FPs, and the volume of lead samples will be small enough to avoid the challenge of processing large quantities of samples simultaneously.
The implementation of this method for the ALFRED reactor requires automating the sample collection process and setting a frequency that allows for continuous monitoring of impurities generated by lead activation. These impurities gradually accumulate in the reactor’s coolant during operation. Continuous monitoring of the coolant’s chemical composition can facilitate early detection of any abnormal enrichment, which might indicate a failure in the fuel element cladding and the subsequent release of FPs into the molten lead.
Further investigation will include additional elements, such as Fe, Ni, and Cr, components of the structural materials used in lead-cooled facilities. Additionally, actinides such as U, Am, and Pu, originating from nuclear fuel, will also be examined using ICP-MS technology. The detection of these elements in lead may indicate a potential breach in the fuel cladding and provides insight into the mechanisms of fuel–coolant interaction.
6 Conclusion
The aim of the study was to evaluate the effectiveness of lead matrix removal for detecting trace-level elements in samples from lead-cooled facilities and to assess the method’s reliability for monitoring trace impurities in LFR systems. A solid-phase extraction method using the Sr-spec crown ether resin was applied to remove the lead matrix from mock samples (∼20 mg·mL−1 of lead spiked with 5–125 ppb of Cd and Te) to simulate conditions similar to those found in a lead-cooled facility. After matrix removal, the concentrations of Cd and Te were determined using ICP-MS, and the quantitative recovery from separation was evaluated.
While the method is highly sensitive and reliable for detecting trace impurities in lead, it does present challenges, such as being labor-intensive and time-consuming. Furthermore, inherent impurities in the lead matrix need to be well-characterized to differentiate them from impurities generated during the operation of lead-cooled facilities. To mitigate these challenges, the use of higher-purity lead in nuclear facilities is recommended, as it would reduce the production of volatile by-products caused by intrinsic impurities.
The findings suggest that this approach is effective for monitoring small variations in the chemical composition of lead in experimental facilities.
Acknowledgments
The authors express their full gratitude to the Institute for Nuclear Research, Pitesti, Romania, which facilitated performing experiments in specialized laboratories.
-
Funding information: Authors state no funding involved.
-
Author contributions: Ana Ivan: conceptualization, formal analysis, investigation, methodology, validation, visualization, writing – original draft, and writing – review and editing; Marioara Abrudeanu: writing – original draft, writing – review and editing, project administration, and supervision; Mariano Tarantinto: conceptualization and supervision; Daniela Gugiu: conceptualization, formal analysis, and writing – review and editing; Daniela Diaconu: project administration, resources, and software; Diana Mirita: resources, software, investigation, validation, and writing – original draft.
-
Conflict of interest: Authors state no conflict of interest.
-
Data availability statement: The datasets generated during and/or analyzed during the current study are available from the corresponding author on reasonable request.
References
[1] GenIV International Forum. Lead Fast Reactors (LFR) [Internet]. 2024. https://www.gen-4.org/generation-iv-criteria-and-technologies/lead-fast-reactors-lfr.Search in Google Scholar
[2] Alemberti A, Frogheri M, Hermsmeyer S, Smirnov LA, Takahashi M, Smith C, et al. Lead-cooled fast reactor (LFR) risk and safety assessment white paper. Paris, France: Generation IV International Forum (GIF) — Secretariat at OECD/NEA; 2014.Search in Google Scholar
[3] Alemberti A, Caramello M, Frignani M, Grasso G, Merli F, Morresi G, et al. ALFRED reactor coolant system design. Nucl Eng Des. 2020;370:110884. 10.1016/j.nucengdes.2020.110884.Search in Google Scholar
[4] Constantin M, Grasso G, Tarantino M, Turcu I, Paunoiu C, Toma A, et al. The development of the research infrastructure in support of Alfred demonstrator implementation in Romania. EMERG – Energy Environ Effic Resour Glob. 2021;7:123–32. 10.37410/EMERG.2021.1.10.Search in Google Scholar
[5] Tarantino M, Angiolini M, Bassini S, Cataldo S, Ciantelli C, Cristalli C, et al. Overview on lead-cooled fast reactor design and related technologies development in ENEA. Energies. 2021;14:5157. 10.3390/en14165157.Search in Google Scholar
[6] Jolkkonen M, Wallenius J. TEC064-Report on source term assessment for the ETD (ALFRED). Stockholm, Sweden: KTH (Royal Institute of Technology); 2013.Search in Google Scholar
[7] OECD, Nuclear Energy Agency. Handbook on lead-bismuth eutectic alloy and lead properties, materials compatibility, thermalhydraulics and technologies. Paris, France: OECD Nuclear Energy Agency; 2015. 10.1787/42dcd531-en.Search in Google Scholar
[8] Aerts A, Gonzalez Prieto B, Neuhausen J. Behavior of spallation, activation and fission products in LBE. Comprehensive Nuclear Materials. Amsterdam, Netherlands: Elsevier; 2020. p. 735–65. 10.1016/B978-0-12-803581-8.11612-1.Search in Google Scholar
[9] International Atomic Energy Agency. Analysis and modelling of severe accidents for liquid metal fast reactors. 2025th edn. Vienna, Austria: IAEA; 2025. 10.61092/iaea.xpz1-gu7q.Search in Google Scholar
[10] Petrovich C, Grasso G, Artioli C, Rocchi F, Sciora P. D07 – Definition of the ETDR core and neutronic characteriziation. Rome, Italy: ENEA; Paris, France CEA; 2012.Search in Google Scholar
[11] Gugiu D, Grasso G. ETDR core: DPA rates in the main components, activation, doses, TEC061. Mioveni, Romania: Institute for Nuclear Research; 2013.Search in Google Scholar
[12] Alemberti A. Final Report Summary – LEADER (Lead-cooled European Advanced Demonstration Reactor). Brussels, Belgium: European Commission; 2013. https://cordis.europa.eu/project/id/249668/reporting.Search in Google Scholar
[13] Constantin M, Diaconu D, Gugiu D, Turcu I, Apostol M, Niţoi M, et al. Experimental infrastructure in support of ALFRED licensing process and of lead fast reactor technology development. J Nucl Res Dev. 2023;25:55–62.Search in Google Scholar
[14] Neuhausen J, Koester U, Eichler B. Investigation of evaporation characteristics of polonium and its lighter homologues selenium and tellurium from liquid Pb-Bi-eutecticum. Radiochim Acta. 2004;92:917–23. 10.1524/ract.92.12.917.55105.Search in Google Scholar
[15] Zobnin V, Ivan AM, Neuhausen J, Vögele A, Eichler R. Annual Report of the Laboratory of Radiochemistry/Evaporation of tellurium from liquid lead-bismuth eutectic studied using the thermosublimatography method, 50-51, Paul Scherrer Institute, Villigen, Switzerland, 2022. Accessed: June 05, 2023. [Online]. Available: https://www.psi.ch/en/lrc/annual-reports.Search in Google Scholar
[16] Zivadinovic I, Neuhausen J, Ivan AM, Dressler R, Steinegger P. The influence of impurities on the evaporation behavior of Po from liquid Pb–Bi eutectic at high temperatures. J Radioanal Nucl Chem. 2024;334(1):583–94. 10.1007/s10967-024-09823-w.Search in Google Scholar
[17] Marguí E, Queralt I, De Almeida E. X-ray fluorescence spectrometry for environmental analysis: Basic principles, instrumentation, applications and recent trends. Chemosphere. 2022;303:135006. 10.1016/j.chemosphere.2022.135006.Search in Google Scholar PubMed
[18] Rafeeq A, Ali SA, Tanoli AK, Akhter N, Raza G. Analytical profiling of heavy metals contamination in soils, dismantling dust, and rubber samples in Karachi City using AAS, WD-XRF, and SEM technique. Indones J Soc Environ Issues IJSEI. 2021;2:242–57. 10.47540/ijsei.v2i3.389.Search in Google Scholar
[19] Declercq Y, Delbecque N, De Grave J, De Smedt P, Finke P, Mouazen AM, et al. A comprehensive study of three different portable XRF scanners to assess the soil geochemistry of an extensive sample dataset. Remote Sens. 2019;11:2490. 10.3390/rs11212490.Search in Google Scholar
[20] Ramkumar J. Atomic spectroscopy: Technique of paramount credence. Orient J Phys Sci. 2023;8:04–6. 10.13005/OJPS08.01.02.Search in Google Scholar
[21] Nelms SM, editor. Inductively coupled plasma mass spectrometry handbook. Boca Raton, FL: CRC Press; 2005. 10.1002/9781444305463.Search in Google Scholar
[22] Philip Horwitz E, Dietz ML, Rhoads S, Felinto C, Gale NH, Houghton J. A lead-selective extraction chromatographic resin and its application to the isolation of lead from geological samples. Anal Chim Acta. 1994;292:263–73. 10.1016/0003-2670(94)00068-9.Search in Google Scholar
[23] Tindemans T, Dobney A, Wambeke D, Vanhaecke F. On the determination of trace elements in lead-bismuth eutectic by means of sector-field inductively coupled plasma-mass spectrometry. J Anal Spectrom. 2013;28:1345. 10.1039/c3ja50124h.Search in Google Scholar
[24] Yourd ER, Tyson JF, Koons RD. On-line matrix removal of lead for the determination of trace elements in forensic bullet samples by flow injection inductively coupled plasma-mass spectrometry. Spectrochim Acta Part B Spectrosc. 2001;56:1731–45. 10.1016/S0584-8547(01)00268-3.Search in Google Scholar
[25] Paskar IV, Senchenko SP, Kapiturova OA, Borkovskaya EV, Paskar NG. Development of approaches to the analysis of elemental impurities in titanium dioxide (barium and lead definition). Probl Biol Med Pharm Chem. 2024;27:31–9. 10.29296/25877313-2024-01-04.Search in Google Scholar
[26] Agatemor C, Beauchemin D. Matrix effects in inductively coupled plasma mass spectrometry: A review. Anal Chim Acta. 2011;706:66–83. 10.1016/j.aca.2011.08.027.Search in Google Scholar PubMed
[27] Masson P, Dalix T, Bussière S. Determination of major and trace elements in plant samples by inductively coupled plasma–mass spectrometry. Commun Soil Sci Plant Anal. 2010;41:231–43. 10.1080/00103620903460757.Search in Google Scholar
[28] Stoyanov T, Taralova K. Certified reference material – soultion of 30 components. Stara Zagora, Bulgaria: CPAchem Ltd.; 2023.Search in Google Scholar
[29] Hara N. The dissolving mechanisms of cadmium and lead in nitric acid. Ind Health. 1967;5:60–4. 10.2486/indhealth.5.60.Search in Google Scholar
[30] Warner JC, Cannon AS, Dye KM. Green chemistry. Environ Impact Assess Rev. 2004;24:775–99. 10.1016/j.eiar.2004.06.006.Search in Google Scholar
[31] Prajapati P, Patel M, Kansara Y, Shah P, Pulusu VS, Shah S. Green LC-MS/MS method for in-vivo pharmacokinetics of mirabegron-encapsulated nanostructured lipid carriers in rat plasma: Integrating white analytical chemistry and analytical quality by design approach. Sustain Chem Pharm. 2024;39:101523. 10.1016/j.scp.2024.101523.Search in Google Scholar
[32] Prajapati P, Patel K, Patel A, Pulusu VS, Haque A, Ahmad S, et al. Integrated approach of white analytical chemistry and design of experiments to microwave-assisted sensitive and eco-friendly spectrofluorimetric estimation of mirabegron using 4-chloro-7-nitrobezofuran as biosensing fluorescent probe. Spectrochim Acta A Mol Biomol Spectrosc. 2024;319:124521. 10.1016/j.saa.2024.124521.Search in Google Scholar PubMed
[33] International Organization for Standardization. Quality management systems – Requirements. Geneva, Switzerland: International Organization for Standardization (ISO); 2021.Search in Google Scholar
[34] International Organization for Standardization. Environmental management systems – Requirements with guidance for use. Geneva, Switzerland: International Organization for Standardization (ISO); 2021.Search in Google Scholar
[35] International Organization for Standardization. Occupational health and safety management systems – Requirements with guidance for use. Geneva, Switzerland: International Organization for Standardization (ISO); 2024.Search in Google Scholar
[36] Miller JN, Miller JC. Statistics and chemometrics for analytical chemistry. 6th edn. Harlow: Prentice Hall/Pearson; 2010.Search in Google Scholar
[37] Wygaerts C. Lead, + 99%, powder, thermo scientific chemicals-certificate of analysis. Waltham, MA, USA: Thermo Fisher Scientific; 2020.Search in Google Scholar
[38] Environmental Monitoring Systems Laboratory. Determination of trace elements in waters and wastes by ISP-MS. Methods for the determination of metals in environmental samples. Amsterdam, Netherlands: Elsevier; 1996. p. 88–145. 10.1016/B978-0-8155-1398-8.50011-2.Search in Google Scholar
[39] Agency IAE. Liquid metal coolants for fast reactors cooled by sodium, lead, and lead-bismuth eutectic. Vienna, Austria: International Atomic Energy Agency; 2012.Search in Google Scholar
© 2025 the author(s), published by De Gruyter
This work is licensed under the Creative Commons Attribution 4.0 International License.
Articles in the same Issue
- Research Articles
- Impressive stability-indicating RP-HPLC method for concurrent quantification of salbutamol, guaifenesin, and sodium benzoate in cough syrup: Application of six sigma and green metrics
- Bioanalytically validated potentiometric method for determination of bisphenol A: Application to baby bibs, pacifiers, and Teethers’ saliva samples
- Environmental impact of RP-HPLC strategy for detection of selected antibiotics residues in wastewater: Evaluating of quality tools
- Trace-level impurity quantification in lead-cooled fast reactors using ICP-MS: Methodology and challenges
- Picogram-level detection of three ACE inhibitors via LC–MS/MS: Comparing BMP and UOSA54 derivatization methods
- Eco-friendly RP-HPLC method for concurrent estimation of a promising combination of methocarbamol and etoricoxib in rat plasma
- Development of a point-of-care testing sensor using polypyrrole/TiO2 molecular imprinting technology for cinchocaine determination
- Green and sustainable RP-UPLC and UV strategies for determination of metformin and dapagliflozin: Evaluation of environmental impact and whiteness
- Review Articles
- Determination of montelukast and non-sedating antihistamine combination in pharmaceutical dosage forms: A review
- Extraction approaches for the isolation of some POPs from lipid-based environmental and food matrices: A review
- A review of semiconductor photocatalyst characterization techniques
- Analytical determination techniques for lithium – A review
- Fourier transform infrared spectroscopy study of polymer/filler/ionic liquid composites