Green and sustainable RP-UPLC and UV strategies for determination of metformin and dapagliflozin: Evaluation of environmental impact and whiteness
-
Ghadah M. Al-Senani
 ,
Hoda A. Ahmed
,
Hoda A. Ahmed
 and
Mahmoud A. Mohamed
and
Mahmoud A. Mohamed

Abstract
The sustainability and effectiveness of the chemical industry are greatly enhanced by white and green chemistry. Ten sustainability tools have been developed based on green and white metrics. Several tools can be used to determine how environmentally friendly, innovative, and forthright reversed-phase ultra-performance liquid chromatography (RP-UPLC) and ultraviolet (UV) techniques can simultaneously analyze and separate metformin (MET) and dapagliflozin (DAP) in pure and dosage forms. In addition to the green analytical procedure index and complex green analytical procedure index, analytical greenness, analytical greenness metric for sample preparation, eco-scale assessment, analytical method greenness score, high-performance liquid chromatography-environmental assessment tool, analytical method volume intensity, RGB12, and blue applicability grade index, several tools can be used to evaluate the effectiveness of these techniques. In the RP-UPLC methods under investigation, the isocratic technique was used to configure the optimal system. For RP-UPLC processes, a Waters XSelect HSS T3 C18 column (10 cm × 0.21 cm, 5 μm) was utilized. The sample and column oven temperatures were adjusted to 5°C and 35°C, respectively. The mobile phase in an RP-UPLC procedure was phosphate buffer and ethanol (55:45, v/v) adjusted to pH 7.0 with a 2 min duration, 2.0 μL injection volume, 0.5 mL·min−1 flow rate, and 225 nm UV detection. The second technique was the mean centering of ratio spectra (MCR) method, efficiently resolving the medications’ spectral overlapping at 257.7 and 240.9 nm for MET and DAP, respectively. For every drug, the correlation coefficient between the calibration curves for the UPLC and MCR techniques was more significant than 0.999. With primary recovery rates varying from 99.5% to 100.9%, the strategy produced good results. A validation process has been initiated pursuant to the principles of the International Council for Harmonisation.
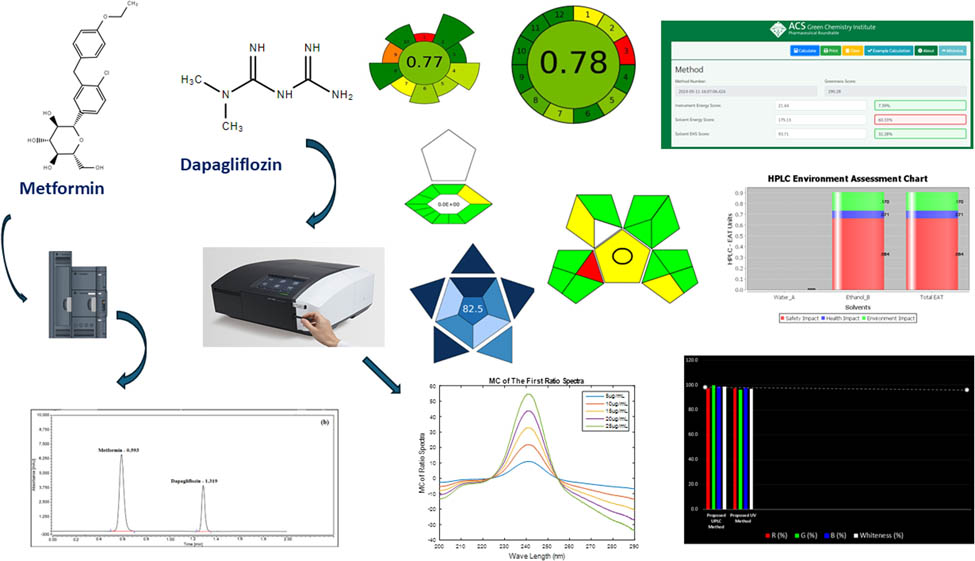
Graphical abstract
1 Introduction
Progress in sustainable chemistry has been a significant focus over the past two decades. Employing renewable resources can enhance the safety and environmental friendliness of chemical reactions. In chemistry, the shift toward green and sustainable practices necessitates the development of sustainable chemical processes and effectively managing these assignments [1]. This method represents a groundbreaking strategy in chemical research and engineering, emphasizing the principles of green and white chemistry. Its comprehensive approach ensures that chemical processes and products are safeguarded against dangerous substances with unmatched efficacy [2].
Having proven their sustainability, analytical chemistry methodologies are likely to gain acceptance. Combining green chemistry principles is necessary for a sustainable future [3]. Quantitative analysis has recently seen an increase in interest in environmentally friendly methods [4]. Analytical chemistry is increasingly recognizing the importance of environmental stewardship and sustainability. As new methods are developed, it is imperative that solvents are used responsibly and waste is reduced. Despite significant advances in sustainability in analytical chemistry, much must be accomplished [5].
A thorough assessment of potential environmental effects is required to ascertain HPLC procedures’ ecological advantages and eco-friendliness [6]. The assessment was conducted using a variety of tools, including the blue applicability grade index (BAGI) and red green blue (RGB) metric. The eco-scale assessment (ESA) is one of several measures that have been developed for environmentally sustainable analytical procedures. Others include complex green analytical procedure index (ComplexGAPI), analytical greenness (AGREE), analytical method greenness score (AMGS), green analytical procedure index (GAPI), high-performance liquid chromatography-environmental assessment tool (HPLC-EAT), analytical greenness metric for sample preparation (AGREEprep), and analytical method volume intensity (AMVI) [7].
A noteworthy and atypical correlation has been discovered between mean centering of ratio spectra (MCR) spectrophotometric method and ultra-performance liquid chromatography (UPLC). The use of UPLC in liquid chromatography is novel. As a result of this method, solvents are used less often, analysis times are shorter, sensitivity is increased, and resolution is improved. There are advantages and disadvantages to both MCR and UPLC for sample analysis, and both are widely used analytical techniques. Since UPLC is capable of efficiently separating and quantitating an extensive range of molecules, it can handle many sample types, including those with complex or closely related ingredients. The autosampler technique allows UPLC to examine more than 100 samples simultaneously. It can be expensive to purchase, maintain, and operate UPLC equipment [8]. Solvents and columns used during operation can also increase operational expenses. A disadvantage of UPLC is the requirement to prepare samples thoroughly, like diluting and filtering them, before they are compatible with it. Some assays can be performed faster using MCR than UPLC, the preparation of samples is easier, and run times are shorter than those required by UPLC. As well as being easier to use, it is also more convenient. When it comes to initial investment and ongoing operating costs, the MCR equipment is generally cheaper than the HPLC equipment [9]. Due to the fact that UV examination usually does not harm samples, the sample can be recovered later. An MCR approach has the limitation of measuring only one sample every time. Sometimes, MCR techniques cannot provide the same level of accuracy and precision as UPLC when analyzing complex mixtures that can only be partially resolved due to their many components. A number of factors must be taken into account when choosing a method, including sample complexity, cost, sensitivity, and selectivity. Complex combinations are better suited to UPLC due to its superior sensitivity and selectivity. Further, UV methods are less expensive and simpler for less complex samples requiring a lower degree of selectivity [10].
In recent years, diabetes has emerged as one of the most prevalent chronic illnesses in the world. Almost every country in the world has an unavoidable death rate associated with diabetes. There are numerous microvascular complications associated with diabetes, including retinal impairment, renal retrogradation, neurological diseases, and macrovascular complications like myocardial infarction and stroke [11]. Type 1 diabetes (insulin-dependent diabetes mellitus – IDDM) happens when the pancreatic cells that produce insulin are destroyed and are characterized by insulin’s absence in the body [12]. In contemporary years, the prevalence of diabetes has increased significantly related to type 2 diabetes (T2DM), which is caused by insulin resistance (non-insulin-dependent diabetes mellitus – NIDDM). Gestational diabetes has also been diagnosed in recent years. The drug treats T2DM using dapagliflozin (DAP) (Figure S1a), an inhibitor of sodium glucose co-transporter 2 (SLGT2). Adults who take the drug experience improved glycemic control and reduced symptoms of NIDDM, as it selectively blocks SGLT2 over SGLT1. Metformin (MET), a biguanide, is an antihyperglycemic medication (Figure S1b). Compared to sulfonylureas and insulin, MET may boost the effects of insulin when taken alone. MET improves glycemic control and may produce weight loss in obese NIDDM patients by lowering the synthesis, absorption, and insulin-mediated glucose uptake of hepatic glucose. It is also utilized in the management of polycystic ovarian syndrome and obesity. DAP and MET are used in combination to treat T2DM. Because of its distinct mode of action and good safety profile, integrating DAP and MET may be an exciting medical option for individuals with T2DM [13].
An exhaustive investigation of the publications discloses that a range of techniques, including spectrophotometry [14,15,16], HPLC [17,18,19], and UPLC methods [20,21], have been effectively utilized to determine MET and DAP, individually and in combination.
While two UPLC approaches for measuring MET and DAP in pharmaceutical formulations have been described, no registered method that complies with green and white chemistry principles simultaneously quantifies DAP and MET using both UPLC and UV techniques.
Our primary purpose is to close this discrepancy by providing cutting-edge, efficient, and eco-friendly UV and UPLC techniques that employ white and green chemistry concepts to fast and accurately analyze DAP and MET in their corresponding dose forms. Eight reliable evaluation techniques have been utilized to appraise the greenness of our approaches: AGREEprep, AMVI, AGREE, AMGS, ComplexGAPI, HPLC-EAT, GAPI, and ESA. Apart from the well-known green measures, the white analytical chemistry (WAC) metrics BAGI and RGB complement greatly. The finding validates our method’s ecological sustainability. Our MCR and UPLC methods can also creatively and sustainably resolve the overlap issue in binary mixtures. These cutting-edge techniques could significantly improve the quality of chromatographic analysis.
2 Materials and methods
2.1 Chemicals and reagents
MSN Laboratories Private Limited (Kondapur, India) supplied a DAP standard, while Wanbury Limited (Maharashtra, India) provided an MET standard. Hikma Pharmaceuticals (Giza, Egypt) provided Forminodab XR 10/1,000 mg FCT in a generic formula. Merck (Taufkirchen, Germany) provided HPLC-grade ethanol and bi-distilled water.
2.2 Apparatuses
Waters’ ACQUITY UPLC System (Milford, USA) is intended to distinguish intricate materials with a high degree of sensitivity and resolution. It has a three-pump configuration for sophisticated 2D LC workflows, a column manager for two independent temperature-controlled columns, high working pressures of up to 18,000 psi, and integrated vacuum degassing. It can handle up to four solvents. Leak sensors and extensive Empower 3 software are included for diagnosis.
UV Shimadzu 1900 (Tokyo, Japan) is well known for its cutting-edge and exquisite design, guaranteeing accurate and dependable results for various applications. The investigations were conducted using two quartz cuvettes with a route length of 1 cm. Spectra were recorded and processed using UVProbe (ver 2.71, Shimadzu) on an UV spectrophotometer. Its distinctive qualities and cutting-edge technology distinguish it from its competitors.
2.3 Buffer preparation
A buffer solution was prepared by dissolving 2.7 g of H2NaO4P and 0.6 g of NaSO4C12H25 in 1 L of ultra-pure water. The mixture was sonicated until complete dissolution. The pH of the solution was adjusted to 7.0 using a 1 N NaOH solution.
2.4 Solvent preparation for UPLC technique
A solvent mixture was prepared by combining purified water and ethanol in a 70:30 (v/v) ratio.
2.5 Solvent preparation for the UV technique
Ultra-pure water was used as a diluent for the spectrophotometric method.
2.6 Chromatographic system
In this experiment, reversed-phase ultra-performance liquid chromatography (RP-UPLC) was configured to work in isocratic mode. A Waters XSelect HSS T3 C18 column (10 cm × 0.21 cm, 5 μm) was used for analysis. A sample oven temperature of 5°C and a column oven temperature of 35°C were set. There was a 55:45 v/v proportion of phosphate buffer (pH 7.0) and ethanol in the mobile phase. It was run for 2 min, with a 2 μL injection volume, a 0.5 mL·min−1 flow rate, and UV detection at 225 nm.
2.7 Standard stock solutions
Standard stock solutions of DAP (5 mg) and MET (500 mg) were prepared by accurately weighing the compounds and transferring them to 100 mL volumetric flasks. A diluent was added to approximately 70% of the final volume. The solutions were sonicated for 10 min and then brought to volume with additional diluent.
2.8 Working standard solutions
Working standard solutions were prepared by transferring 1 mL of the stock solution to a 10 mL volumetric flask and diluting it to the required volume.
2.9 Analysis of commercially traded formulas
Twenty Forminodab XR 10/1,000 mg FCT tablets were weighed, and their average weight was calculated. One tablet was ground, weighed, and transferred to a 100 mL volumetric flask containing 70% diluent. The volume was completed with the same diluent, and the solution was mixed, shaken, and sonicated for 1 h. A 5 mL aliquot of the stock sample solution was transferred to a 100 mL volumetric flask and filtered using a syringe membrane filter.
2.10 Construction of calibration curves
Serial dilutions were made and transferred into a 10 mL volumetric flask, utilizing a stock solution of standard concentration. We obtained concentration ranges of 0.0025–0.05 and 0.06–0.6 mg·mL−1 for DAP and MET in the UPLC method, respectively, and 0.005–0.025 mg·mL−1 for each pharmaceutical drug using UV analytical methods. The process involved is as follows:
Calibrating at two points,
Conducting a test setup,
Performing a recovery injection to verify the standard,
Conducting five injections to assess the system’s suitability, and
Employing a diluent to evaluate potential carryover.
The association between the concentration and the integrated peak areas was determined through regression equations.
2.11 Greenness and whiteness tools for measuring
2.11.1 ESA
By subtracting 100 from the eco-scale score, penalty points were calculated. Chemicals were classified and labeled according to the global system of classification and labeling based on their solvents. There may be a difference in the amount of pictograms and signal words on different solvents or chemicals. Once the penalty points are ascertained through the signal word, they are multiplied by the number of pictograms corresponding to the amount of solvent or reagent used. This final, fully calculated score can then be ranked on a scale. A unique interpretation is given to each score value. Assays that score more than 75 are considered to be exceptionally green. The assay is considered green when the analytical procedure scores between 50 and 75. Having a score below 50 indicates insufficient greenness [22].
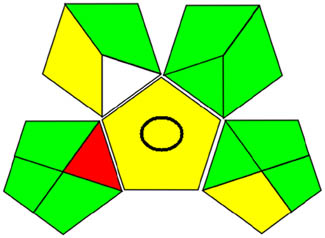
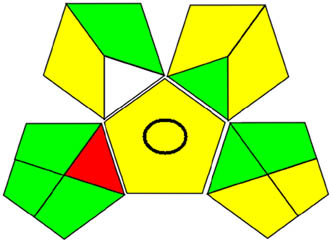
2.11.2 GAPI
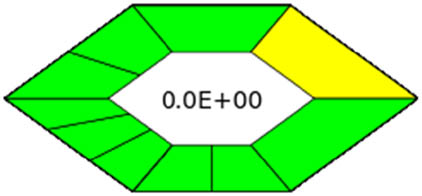
GAPI was used to assess how environmentally friendly various facets of a specific analytical procedure are. Assays related to the five pentagrams of the GAPI pictogram can be classified qualitatively and quantitatively based on their greenness. Green Analytical Chemistry (GAC) meters such as GAPI are straightforward. The GAPI pictogram uses a three-level color scale to depict the greenness of each stage of the complete analytical process. An analytical method is categorized as low, medium, or high in terms of its environmental and human health impact by green, yellow, and red. Analytical assays are represented by each of the pentagrams in the GAPI symbol. If the conditions are met, a green highlight should be displayed for the relevant part. If that is not the case, a yellow or red signal indicates a moderately to severely detrimental effect of the analytical test on the environment or human health in the corresponding segment of the hexagon [23].
2.11.3 AGREE
AGREE is an easy-to-use and thorough tool that evaluates the environmental impact of analytical tests and yields clear and easy-to-understand data. The AGREE metric is computed using the 12 GAC principles, converted into a 0–1 scale. Additionally, evaluating these 12 GAC criteria determines the GAC metric’s final score. The pictogram’s middle area contains 12 segments that reflect the 12 GAC principles. The AGREE pictogram’s section widths show how much weight is given to each concept. Moreover, the AGREE pictogram’s segments can change from dark green to red. As a result, using the 12 GAC principles, the AGREE pictogram offers a straightforward evaluation of how green the analytical test is [24].
2.11.4 AGREEprep
AGREEprep was developed as a comprehensive metric for GAC, rooted in the ten principles of green sample preparation, aimed at bridging the existing gap. It meticulously evaluates the eco-friendliness of sample preparation methods in line with GSP guidelines. The evaluation criteria include the location of sample preparation, the safety and sustainability of solvents and materials, minimizing waste, integrating and automating processes, reducing the volume of samples, increasing sample processing capacity, cutting down on energy use, selecting eco-friendlier options for post-preparation of samples, and ensuring the safety of operators. A scoring range from 0 to 1, based on the above 10 GSP criteria, was used. Moreover, a detailed assessment of how well each of the ten GSP principles is adhered to contributed to the final GAC score [25].
2.11.5 RGB 12 algorithm
In 2021, the RGB 12 algorithm was presented as an updated version of the RGB metric. Based on 12 rules, the algorithm assesses whether analytical assays are green. Some of these criteria are red principles (analytical performance), green principles (green chemistry), and blue principles (practical side). Excel is also used throughout the evaluation procedure of the RGB 12 algorithm [26].
2.11.6 BAGI
A new WAC metric, BAGI, assesses analytical techniques’ viability and environmental friendliness. The analytical test associated with BAGI’s greenness assessment is grounded in the principles of WAC. BAGI employs a symbol, a color scale, and a score to represent how green the tested assays are. This WAC metric has a score range of 25–100. A higher score on the BAGI meter indicates better assay greenness. Ten parameters are included in the BAGI metric to evaluate various tests’ viability and environmental friendliness [27].
2.11.7 ComplexGAPI
The ComplexGAPI methodology employs a semi-quantitative approach. Some instances demonstrating the evaluation of the greenness level in specific tests via ComplexGAPI are given below. Wojnowski and Płotka-Wasylka, who also refined GAPI, developed and improved ComplexGAPI. The initial output chart was upgraded by incorporating an extra hexagonal pictogram, illustrating the greenness level of the various analytical procedures before sample preparation and ultimate detection. The hexagonal pictogram is packed with significant details [28].
2.11.8 AMGS
A new GAC metric called AMGS was proposed by Hicks et al. An analytical assay’s greenness is indicated by its AMGS score. In the examined assay, a lower value denotes better greenness. This metric determines a greenness score based on several factors, including waste generation, instrument energy consumption, safety, health, and the environmental assessment of the reagents used in analytical operations [29].
2.11.9 AMVI
AMVI is often regarded as the most dependable and comprehensive technique for evaluating chromatographic processes. It utilizes waste products and solvents to quantify the waste generated throughout the process. Both sample preparation and HPLC solvents are considered to assess the amount of solvent used by a procedure. The total solvent usage is determined by adding the amounts used for sample preparation and HPLC operations. The solvent required for preparation is determined based on the standard preparation volume, considering the number of preparations and the overall volume within the system suite. AMVI employs HPLC analysis to deliver precise findings. The consumption of solvents in specific peak areas is calculated by multiplying the solvent use of those individual areas, resulting in a combined solvent consumption figure. A decrease in AMVI value enhances the prospects of attaining sustainability. Calculating an analyte’s volume intensity involves multiplying its concentration by consumption. This represents a fraction of the solvent used in preparing samples or HPLC [30].
2.11.10 HPLC-EAT
HPLC procedures are evaluated for environmental impact using a simple and efficient method. As a result of HPLC-EAT, which considers the safety, health, and environmental implications of each solvent used during the chromatographic process, a score can be compared to determine which method is the greenest. Successful applications of HPLC techniques have been derived from published work, such as preparative and analytical chromatography. Once its functionality was confirmed, we combined the tool with another eco-solvent tool, a free tool to evaluate waste disposal options like distillation and incineration. Along with conventional criteria such as accuracy, robustness, and repeatability, HPLC-EAT is often used to assess sustainability [31].
2.12 MCR spectrophotometric method
MCR is the foundation for the suggested MCR approach, whose mathematical justification was provided [32]. This technique solved ternary and binary mixtures in intricate samples whose matrices were unknown.
Abs(Mix) indicates the absorption vector used for mixtures, while C MET and C DAP represent the concentrations of individual drugs. Th molar absorption coefficients of these medicines are denoted by α MET and α DAP. When the absorbance vectors of the mixtures are divided by α DAP, it is possible to derive the initial ratio spectrum, denoted as A, as follows:
To divide the data, it is necessary to disregard the zero values of α DAP. It is possible to obtain a zero value by applying the mean centering to a constant. In light of this,
Through utilization of the mean that was discussed earlier, along with Eq. 2, we obtain
Eq. 4 can be used to analyze binary mixtures statistically. This is accomplished by measuring the concentration of each medication in the mix without allowing the other drug to interfere with the measurement. First, one must plot the MC (MET) concentration against the MET concentrations separately or in binary mixtures to generate calibration curves. For the DAP calibration curves, a process comparable to the one employed for the MET was utilized.
3 Results and discussion
Using UPLC and MCR procedures, this investigation simultaneously identifies DAP and MET in analytical assays with degradation products to evaluate the drugs’ performance in pure and dose forms. Tests were also performed on acidity, oxidation, light-critical stability, alkalinity, and thermal stability.
3.1 Method development and optimization
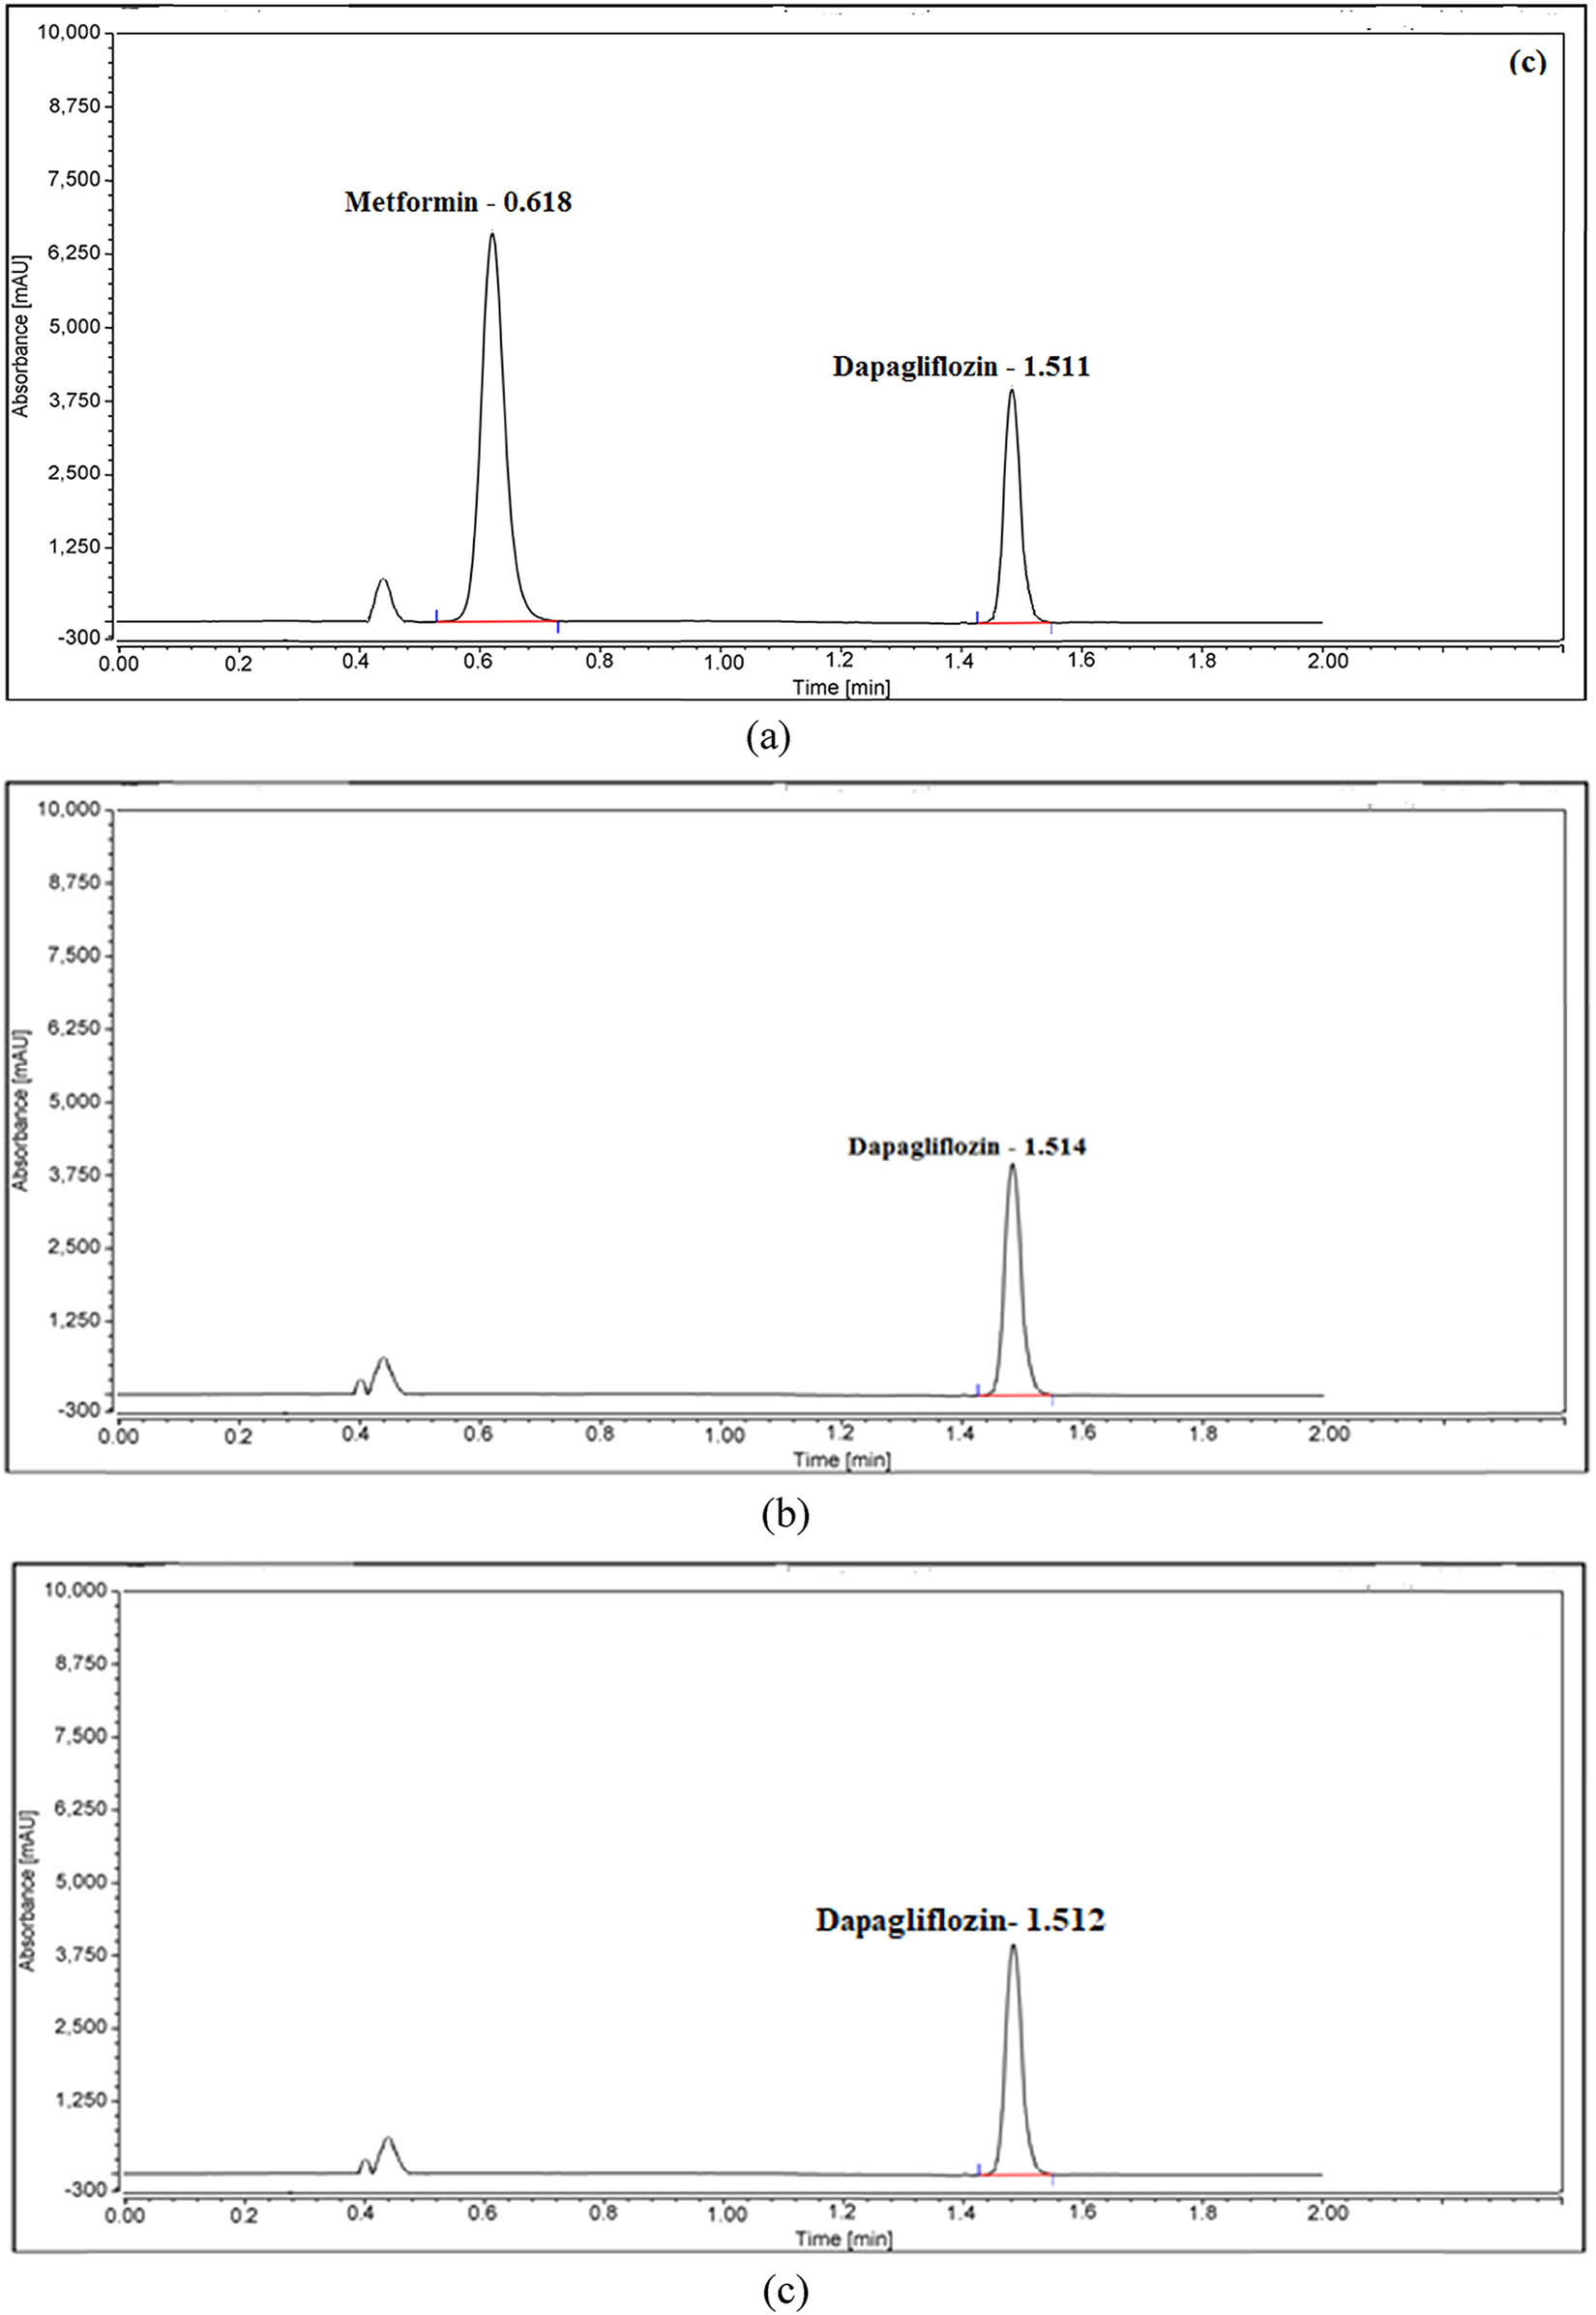
DAP and MET were obtained and measured in medicine tablets and plasma using different mobile phase compositions to develop a new RP-UPLC method. Initial tests were conducted to determine the best conditions for developing an effective process for pharmaceutical analysis. Changes to the detector wavelength, column temperature, and mobile phase composition were made to maximize separation and precision. Several experiments were carried out to manipulate the mobile phase composition experimentally. The experiment was started with a 50:50 volumetric ratio of water to methanol. After that, a different strategy was created using acetonitrile and pH 4 phosphate buffer in a 50:50 volumetric ratio. Flow rates, pH levels, and compositions of the mobile phase influenced the retention durations of the analytes. Analyte retention times first decline as the pH falls below 7.0, but they eventually rise as the pH falls. At pH 7.0, it was possible to obtain crisp peaks with acceptable retention durations and satisfactory symmetry. Similar peak behavior was seen when the composition and flow rate of the mobile phase were altered after utilizing the green solvent of ethanol. The optimal composition was 55:45 v/v phosphate buffer and ethanol, with a 0.5 mL·min−1 flow rate. Additionally, columns of various lengths and packing materials were used in the investigation. The columns included C8, phenyl, and cyano; their lengths varied from 10 mm to 100 mm. The most suitable option was the Waters XSelect HSS T3 C18 column (10 cm × 0.21 cm, 5 μm). The heating of the column took place between 20 and 40°C. Elevated temperatures play a significant role in drug separation. Drug degradation and separation, a critical process, are also affected. As a result, the recommended methods established that 5°C and 35°C – sample and column oven temperatures, respectively – were the optimal separation temperatures. As can be seen in Figure S1, we looked into wavelengths between 200 and 400 nm using the spectrophotometric method. DAP and MET were chosen for their maximum sensitivity and remarkable intensity at 225 nm while having the largest absorbances at 223.2 and 233 nm (Figure S2). To attain clear, discrete peaks with elevated resolution, the subsequent chromatographic parameters were ascertained: For RP-UPLC processes, a Waters XSelect HSS T3 C18 column (10 cm × 0.21 cm, 5 μm) was utilized. The sample and column oven temperatures were adjusted to 5°C and 35°C, respectively. The mobile phase in an RP-UPLC procedure was phosphate buffer and ethanol (55:45, v/v) adjusted to pH 7.0 with a 2 min duration, 2.0 μL injection volume, 0.5 mL·min−1 flow rate, and 225 nm UV detection. Figure 1a and b shows how these issues can be resolved more effectively and quickly following the chromatographic condition with the shortest run time of less than 2 min.

UPLC charts of MET and DAP in (a) binary standard solution and (b) test solution.
3.2 Employing the MCR methodology
The MCR method has been claimed to effectively separate the binary mixture of pharmaceuticals without pre-separation. To enhance the technique, tests were conducted with various divisor concentrations, and the most appropriate concentration was determined to be µg·mL−1. Figure 2a and b shows a spectrum of a substance produced within the 200–290 nm range. A laboratory-prepared combination of drugs, with a concentration range of 525 µg·mL−1, was imported into MATLAB software. The MCR for each drug was calculated using Eqs. 1–4. As illustrated in Figure 2c–f, the 257.7 and 240.9 nm wavelengths were appropriate for estimating MET and DAP. The calibration profiles were established by plotting the amplitudes obtained against their respective concentrations.
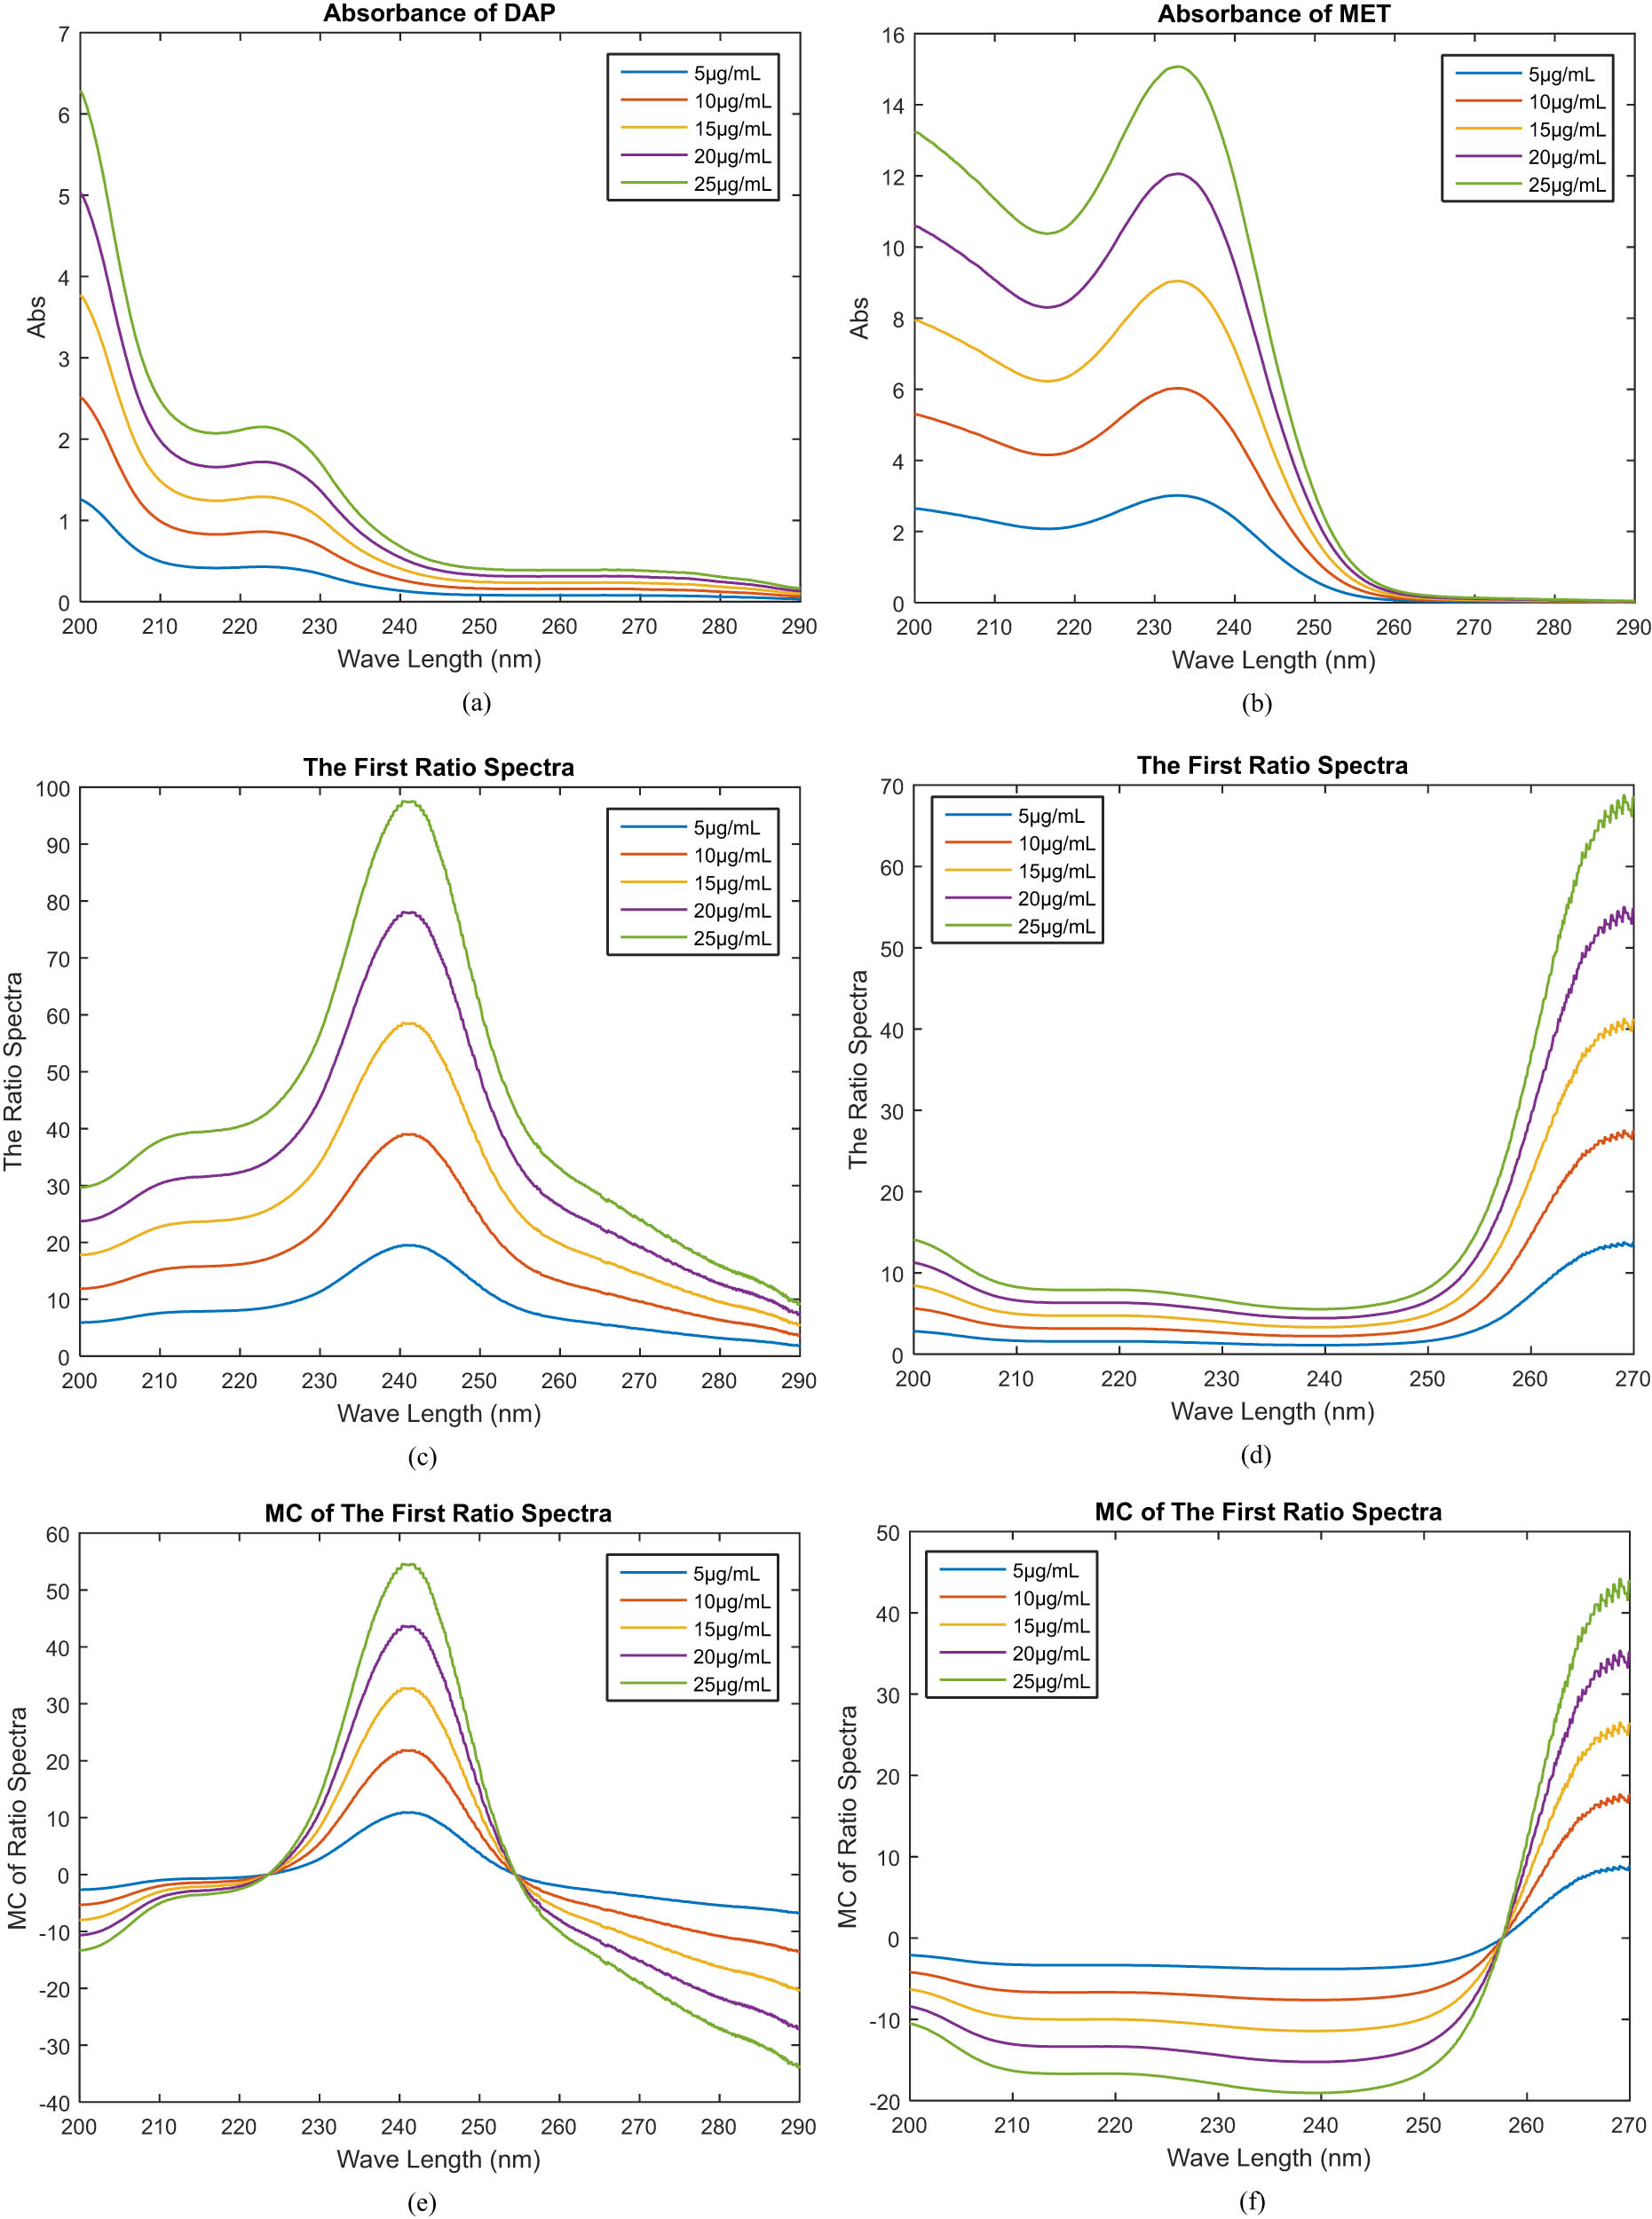
Drug studies with absorbances ranging from 5 to 25 µg·mL−1 for (a) DAP and (b) MET, as well as (c) and (d) drug first ratio spectra and (e) and (f) drug first ratio spectra with spectrum’s MC.
3.3 Evaluation of the whiteness and greenness of the recommended methods
An assessment of the impact of analytical methods on the environment can be made more robust and comprehensive by utilizing multiple approaches. There are a variety of tools focused on sustainability, such as AGREE, GAPI, AMGS, BAGI, and HPLC-EAT. Combining these tools allows analysts to examine all critical aspects of environmental performance thoroughly. As a result of this multi-tool approach, results can be cross-validated, findings become more credible, and specific areas for improvement can be identified. Additionally, a green and white standard for analytical chemistry aligns with evolving industry requirements. Through this approach, not only are scientific findings strengthened but also more sustainable practices are promoted in pharmaceutical and analytical research.
3.3.1 AGREE tool
AGREE is a contemporary approach to assessing green profiles based on the 12 elements of the Green Appraisal Guidelines (Figure S3a and b). A pictogram representing an environmentally friendly product was created using this method, as indicated in Table 1. It shows an AGREE score ranging from 0.7 to 0.74 in the middle for UPLC and UV strategies, along with various intensifying green color combinations.
Comparison of the recommended UPLC and UV strategies for ecological evaluation
| Method | Suggested UPLC | Suggested UV |
|---|---|---|
| AGREE |
 |
 |
| AGREEprep |
 |
 |
| GAPI |
 |
 |
| ComplexGAPI |
 |
 |
| RGB12 |
 |
 |
| BAGI |
 |
 |
3.3.2 AGREEprep tool
AGREEprep is a unique metric for assessing ecological influence. The use of environmentally friendly sample preparation methods streamlines the assessment process. Ten distinct processes make up the AGREEprep technique, which assigns scores between 0 and 1. A perfect performance is indicated with a score of one. A pictogram in Figure S3c and d represents each sector. Table 1 shows that the current methods have ecological sustainability scores of 0.60 and 0.65 for the UPLC and UV approaches, respectively.
3.3.3 GAPI tool
Greenness evaluations in analytical procedures require a reliable tool like GAPI. This technique has 15 components, including 5 unique ones, as shown in Figure S4a and b. Since it takes into account all relevant aspects of the analysis, this method can be used to compare a variety of analytical methods. Table 1 shows that the process proved to be ecologically friendly.
3.3.4 ComplexGAPI tool
The ComplexGAPI measure is utilized when evaluating analytical methods that use GAC features. To account for pre-analysis operations, the GAPI diagram and the traditional GAPI measure are extended by one hexagon, as shown in Table 1. Figure S4c and d illustrates the broad spectrum of subjects these procedures cover.
3.3.5 BAGI tool
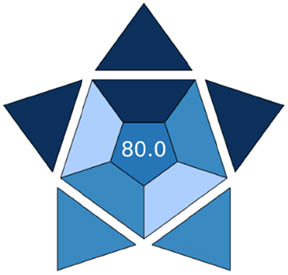
BAGI uses diagrams and scores to illustrate the ten standards and show how beneficial and effective a technique is. Using UPLC, the final UPLC scores are light blue, dark blue, and dark blue. The hue of a solution corresponds to the degree to which it satisfies the requirements. It is made clear in Table 1 that an analytical approach is considered adequate if it scores between 82.5 and 85. The pictograms for the BAGI index are shown in Figure S4e and f.
3.3.6 AMVI
Concerning liquid chromatography, AMVI can calculate solvent usage with accuracy. Techniques for liquid chromatography can be added to the previously mentioned procedures. Lab instruments with cutting-edge technology can be employed for analytical tasks. Table 2 indicates that AMVI has an ecologically friendly score of 117.5 based on the UPLC result.
AMVI assessment of the recommended approach
| Criteria | Recommended UPLC approach |
|---|---|
| Solvent consumption UPLC (mL)= | 15 |
| Flow rate | 0.5 |
| Run time | 2 |
| Number of injections for one complete analysis | 15 |
| Number of analytes | 2 |
| Solvent consumption sample Prep (mL)= | 220 |
| Volume (mL) for standard preparation | 10 |
| Standard preparations numbers | 1 |
| Volume (mL) for test preparation | 100 |
| Test preparation numbers | 2 |
| Volume (mL) for system suitability | 10 |
| System suitability numbers | 1 |
| Total method solvent consumption= | 235 |
| analytical method volume intensity | 117.5 |
| % Consumption UPLC | 6.38 |
| % Consumption preparations | 93.62 |
3.3.7 ESA
Sustainable development was assessed using the ecological pattern, the industry-standard evaluation approach. Penalty points were determined by the ESA tool to evaluate the synchronous method. The method is environmentally sustainable, as evidenced by the high eco-scores of 82 and 96 in UV and UPLC, respectively. Details on the penalty points that were computed are shown in Table 3.
Penalty points for utilizing approved techniques for calculating the ESA score
| ESA | Penalty points | ||
|---|---|---|---|
| UPLC technique | UV technique | ||
| Reagents | Purified water | 0 | 0 |
| Potassium phosphate | 0 | — | |
| Sodium hydroxide | 2 | — | |
| Ethanol | 4 | — | |
| Hydrogen peroxide | 6 | — | |
| Hydrochloric acid | 4 | — | |
| Instruments | Energy for UPLC or UV ≤0.1 kW h/sample | 0 | 0 |
| Occupational hazard | 0 | 0 | |
| Ultrasonic | 1 | 1 | |
| Waste | 1 | 3 | |
| Total penalty points | 18 | 4 | |
| Eco-scale total score | 82 | 96 | |
3.3.8 AMGS
AMGS compares and evaluates different strategies according to how they might impact the environment feasible. Figure S5a shows the analytical analysis process for components, instrumental energy use, solvent waste production, and waste disposal. A perspective-based methodology is used in AMGS inspections, as shown in Figure 3a.

A sustainable UPLC procedure was evaluated using graphs (a) AMGS, (b) HPLC-EAT, and (c) RGB12.
3.3.9 HPLC-EAT
The parameters shown in Figure S5b can be examined using HPLC-EAT, which offers a trustworthy and efficient liquid chromatography process evaluation. This method provides a useful tool for assessing the effects of all solvents used in chromatographic procedures, ensuring their safety and quality. It is possible to evaluate the effects of each process solvent on safety, the environment, and public health, as shown in Figure 3b.
3.3.10 RGB12 algorithm tool
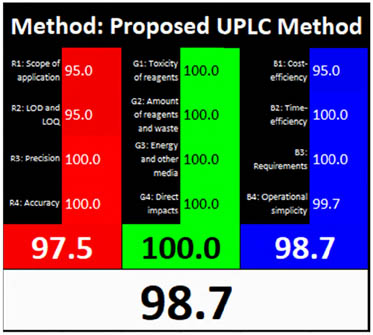
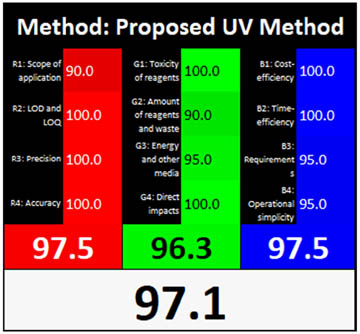
Each of the three colors receives a score using the RGB12 tool, and the results are combined using an algorithm. Based on how closely a technique follows WAC ideas, this metric classifies it as “white” or “black.” Excellent impurity identification was demonstrated by the recently announced analytical UPLC and UV techniques, which scored an optimum 97.5% on the red and 100% and 96.3% on the green. Furthermore, the methodology achieved 98.7% and 97.5% in the blue domain, indicating heightened relevance and efficiency. Moreover, the methodology was sustainable and ecologically sound, resulting in overall whiteness assessment scores of 98.7% and 97.1% for the analytical UPLC and UV techniques, as depicted in Figure 3c and Table 1.
3.4 Method validation
The processes have undergone a thorough evaluation following international council for harmonisation guidelines, and the conclusive results validate their exceptional efficacy and dependability [33].
3.4.1 Linearity and range
The analysts carefully considered how to prepare the solution for the linearity study, considering the different medication concentrations being investigated. However, we obtained impressive findings using the MCR and UPLC procedures, with concentration ranges of 0.0025–0.05 and 0.06–0.6 mg·mL−1 for DAP and MET in the UPLC method, respectively, and 0.005–0.025 mg·mL−1 for each pharmaceutical drug using the MCR analytical method. We found that all drug concentration ranges were linearly correlated with regression coefficients greater than 0.999 using linear regression analysis of the standard calibration curves, indicating the extraordinary linearity of the method. Table 4 displays these data.
DAP and MET estimation procedures use regression modeling and validation analysis
| Parameters | UPLC | UV | ||
|---|---|---|---|---|
| DAP | MET | DAP | MET | |
| Linear | ||||
| Range (µg·mL−1) | 2.5–50 | 60–600 | 5–25 | 5–25 |
| Wavelength (nm) | 225 | 225 | 240.9 | 257.7 |
| Slope | 9,700.0870 | 15,214.2375 | 2.1820 | 0.0908 |
| Intercept | 2,898.2130 | 10,708.7629 | 0.1167 | −0.0492 |
| Correlation coefficient | 0.9994 | 0.9996 | 0.9999 | 0.9996 |
| System precision | 0.3 | 0.1 | 0.04 | 0.07 |
| LOD (µg·mL−1) | 0.58 | 9.89 | 0.23 | 0.82 |
| LOQ (µg·mL−1) | 1.77 | 29.96 | 0.71 | 2.47 |
3.4.2 Limit of detection (LOD) and limit of quantification (LOQ)
The LOQ and LOD of the validated Excel established were ascertained by applying the functions (3.3σ/S) and (10σ/S). These computations are delicate because they employ the calibration curve (S) slope and intercept standard deviation (σ) to determine the LOD and LOQ. The results in Table 4 indicate that reduced LOQ and LOD values are optimal for the proposed solutions.
3.4.3 Accuracy and recovery
The assessment’s accuracy level and methods were suitably confirmed, and Table 5 shows that each level’s medication recovery percentage fell comfortably within the allowed range of 98–102%.
Methods’ recovery and accuracy for MET and DAP estimation are precious and constructive
| Parameters | UPLC | UV | ||
|---|---|---|---|---|
| Relative concentrations % | DAP | MET | DAP | MET |
| Recovery (%) | Recovery (%) | Recovery (%) | Recovery (%) | |
| 50 | 101.13 | 100.02 | 100.26 | 100.26 |
| 100.05 | 100.46 | 100.60 | 99.89 | |
| 101.18 | 100.78 | 99.79 | 100.77 | |
| 100.95 | 99.47 | 100.07 | 100.88 | |
| 100.77 | 100.27 | 99.93 | 100.15 | |
| 101.23 | 99.91 | 101.03 | 99.54 | |
| Mean ± RSD | 100.89 ± 0.44 | 100.15 ± 0.46 | 100.28 ± 0.46 | 100.25 ± 0.51 |
| 100 | 100.24 | 99.42 | 99.36 | 100.45 |
| 100.08 | 100.73 | 101.12 | 100.57 | |
| 100.11 | 101.02 | 99.89 | 99.73 | |
| 99.89 | 100.41 | 100.13 | 99.94 | |
| 99.43 | 99.09 | 99.57 | 100.19 | |
| 99.76 | 99.43 | 99.73 | 99.43 | |
| Mean ± RSD | 99.92 ± 0.23 | 100.02 ± 0.80 | 99.97 ± 0.62 | 100.05 ± 0.43 |
| 150 | 99.26 | 99.43 | 100.25 | 99.33 |
| 99.72 | 101.12 | 99.16 | 100.18 | |
| 99.18 | 99.97 | 100.76 | 99.82 | |
| 99.46 | 100.21 | 100.13 | 100.27 | |
| 99.94 | 100.09 | 100.09 | 100.46 | |
| 99.49 | 99.75 | 99.89 | 99.43 | |
| Mean ± RSD | 99.51 ± 0.29 | 100.10 ± 0.57 | 100.05 ± 0.52 | 99.92 ± 0.47 |
3.4.4 Ruggedness and robustness
Experiments show that the proposed approach is robust against slight variations in flow velocity, pH level, wavelength, column, and analyst. The data in Table S1 further prove the reliability and resilience of this method.
3.4.5 Standard solution stability
The investigation results indicated that the standard solution was of very high caliber. It performed flawlessly after being stored for 72 h at ambient temperature or in the refrigerator. A startling similarity between the recently built solution and an earlier one was discovered. Additionally, the retained and prepared standards had a range of 100% ± 2.0% and an relative standard deviation (RSD) of less than 2.0, demonstrating good complementarity. These results demonstrate the typical solution’s dependability and stability. Table S1 suggests it could be an excellent option for any analytical application.
3.4.6 Assay of the test solution
The assay sample was evaluated using UPLC and UV techniques. Six samples were comprehensively analyzed. The results indicated that the drugs were in a suitable assay form. Additional details on the results can be found in Table S2.
3.4.7 System suitability
The system’s suitability was evaluated after thorough testing and careful examination of the process. Table S3 indicates that all parameters were within the given range. The system is highly reliable and accurate.
3.4.8 Specificity
3.4.8.1 Selectivity
The method’s selectivity was evaluated by analyzing the possible impacts of coating agents, degradation products, and preservatives on the analyte. As shown in Figure S6a–e, no significant difference exists between the two active components when diluted with diluents, placebos, or other medications. These methods could be used to attain a significant degree of selectivity.
3.4.8.2 Forced degradation
Various methods of specificity testing were used, including heat and light as well as acids, bases, and oxidation, to guarantee consistent findings. Figures 4(a–e) and 5(a–d) show that the pharmaceutical compounds and products were subjected to various stressors to assess their forced degradation. Both high and low base concentrations caused MET to degrade completely. Nevertheless, MET and DAP deteriorated by 0.6% and 0.7% when exposed to 1 N HCl for 2 h at 80°C. The degradation percentage in MET increased to 73.2% when exposed to 1 N NaOH for 2 h at 80°C, while DAP degraded slightly by 0.4%. Heating for 2 h at 85°C caused MET and DAP to degrade slightly by 0.2% and 0.8%, respectively. Table 6 illustrates how oxidation treatment with 30% H2O2 for 2 h at 80°C reduced the efficacy of MET and DAP and with the test drug by 10.3% and 4.5%, respectively. There were no interactions between the peaks of MET and DAP, which meant each degradation product could be identified. As MET and DAP had similar peak purity angles, the proposed method had reasonable specificity, as demonstrated by their non-significant differences from the peak purity threshold.
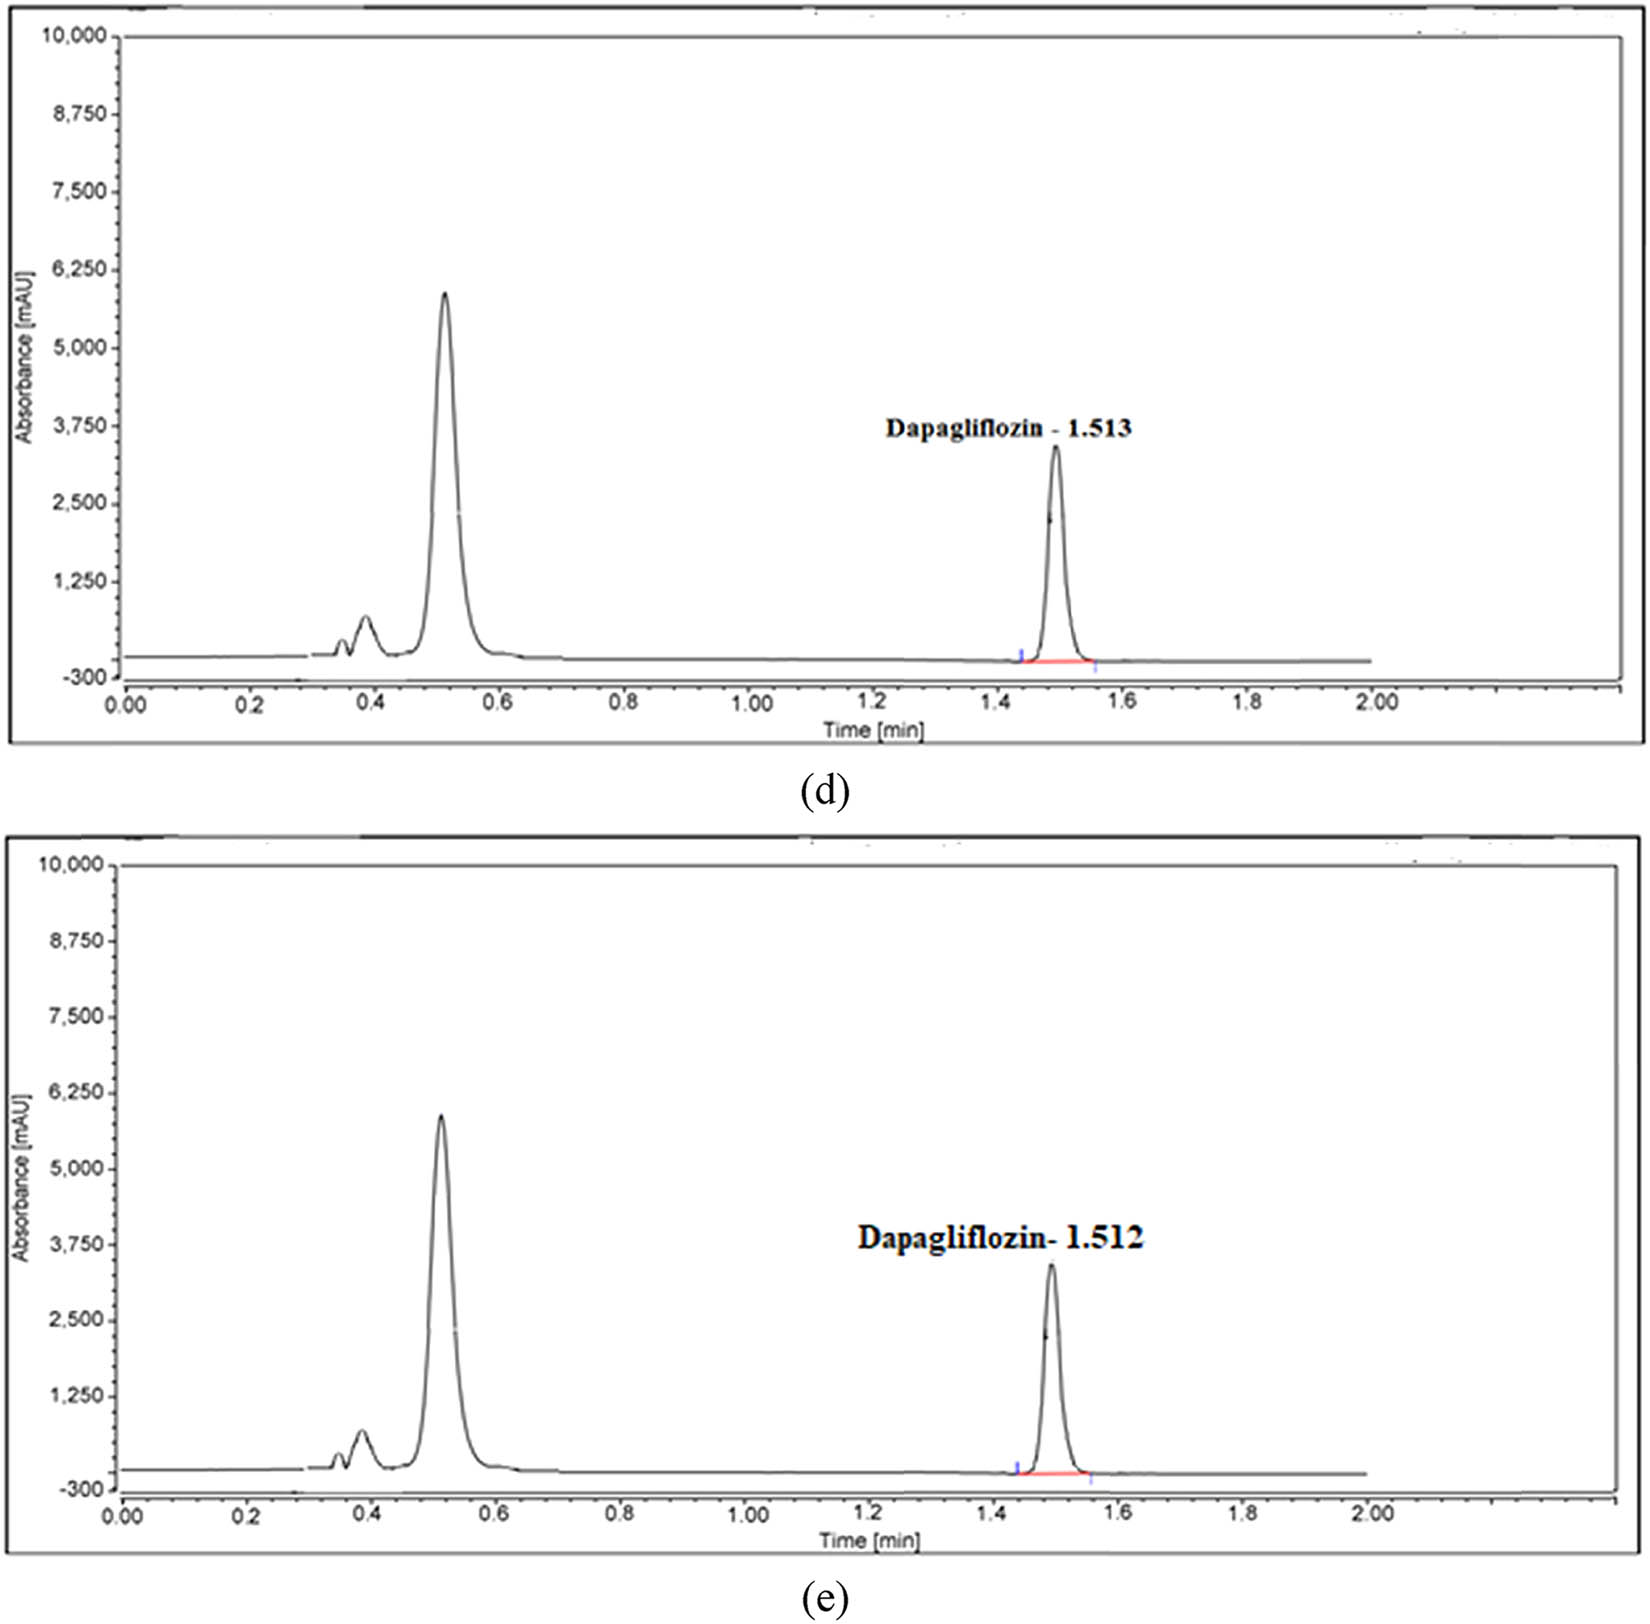
UPLC charts of DAP under (a) normal conditions and forced degradation, including (b) heat, (c) acid, (d) base, and (e) oxidation conditions.
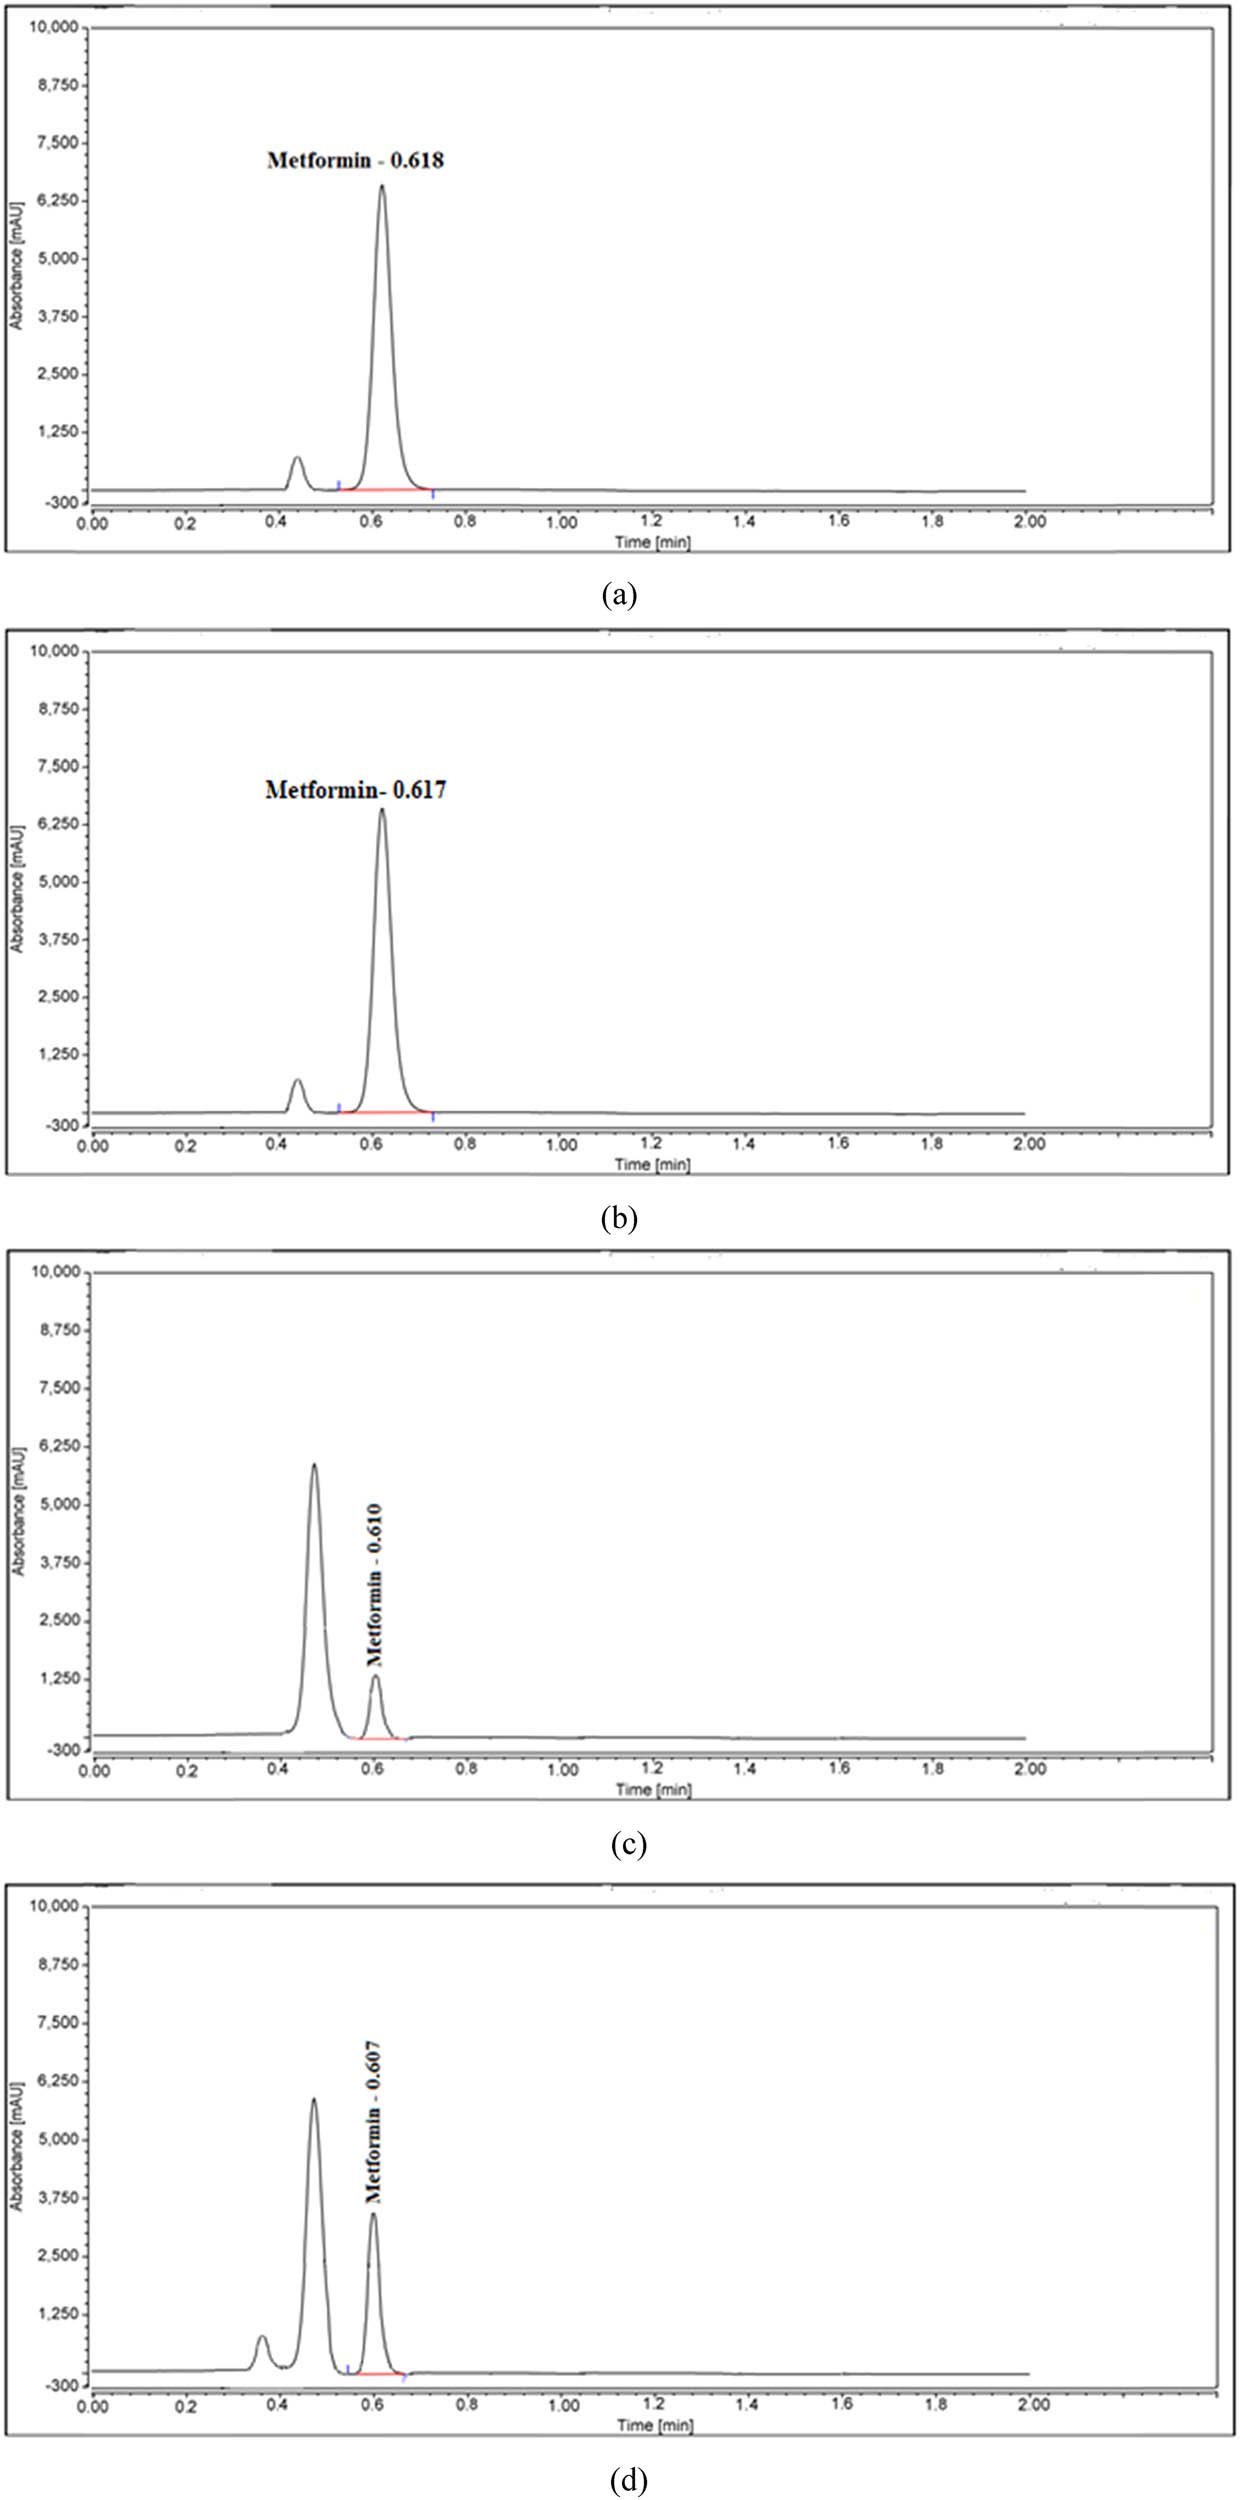
UPLC charts of MET for forced degradation, including (a) heat, (b) acid, (c) base, and (d) oxidation conditions.
Degradation profile and purity assessment of DAP and MET under stress conditions
| Condition | % Degradation | Purity angle | Purity threshold | |
|---|---|---|---|---|
| DAP | Heat | 0.8 | 1.414 | 9.622 |
| Acidic | 0.7 | 1.235 | 11.922 | |
| Basic | 0.4 | 1.849 | 29.543 | |
| Oxidation | 4.5 | 53.324 | 90.000 | |
| MET | Heat | 0.2 | 12.264 | 18.572 |
| Acidic | 0.6 | 10.271 | 28.318 | |
| Basic | 73.2 | 27.744 | 63.438 | |
| Oxidation | 10.3 | 19.501 | 47.619 |
3.5 Evaluation of our methodology
Literature analysis suggests that neither UPLC nor MCR approaches are suitable for determining MET, DAP, and their byproducts in drug formulations that incorporate eight environmental metrics, BAGI, and RGB12, which is a characteristic of sustainable chemistry. Several green criteria were used in our study to evaluate the proposed approach’s ecological sustainability. The tools and software used were AMVI, GAPI, AGREEprep, HPLC-EAT, AGREE, ESA, AMGS, and ComplexGAPI. By using a short column, waste generated during the separation of mobile phases was reduced as well as the retention time. In the current study, purified water and ethanol were used instead of hazardous chemicals for the solvent. Compared to the prior strategy, the new one resulted in higher accuracy and sustainability.
Our cutting-edge UPLC and MCR procedures adhere to sustainability and ecologically friendly chemistry principles most effectively and efficiently. The accuracy and reliability of this method are improved over previous methods [14,15,16,20,21]. The current approaches are the most environmentally friendly and efficient solution for chemical processes. The recommended strategies surpass the previous ones in the literature following a comprehensive evaluation of sustainability strategies [14,15,16,20,21]. Table S4 provides a summary of the results.
As part of our extensive assessment of environmental approaches, we carried out a comparative analysis of the presented techniques via those illustrated in the literature. Table S5 summarizes the findings. We used five green tools AGREE, GAPI, AGREEprep, BAGI, and ComplexGAPI to reach a comprehensive evaluation. Its performance in the AGREE and AGREEprep tools was superior to those of the published techniques [14,15,16,20,21] for several reasons, including the fact that the waste generated was less than 1.0 mL, the hazardous chemical was replaced by ethanol, and the number of samples examined per hour was maximized. Table S5 demonstrates this concept clearly with the AGREE and AGREEprep pictograms, which have central scores of 0.78 and 0.77 for AGREE and 0.77 and 0.76 for AGREEprep, respectively. Likewise, different green hues indicate different levels of environmental sustainability achieved with UPLC and UV. GAPI shows (10) green, (3) yellow, (1) white, and (1) red for the proposed UPLC method, surpassing the previously reported method [15], which scored significantly higher than the other methods [14,15,16,20,21]. We used ethanol as the green solvent and generated waste less than 1.0 mL, as opposed to the waste in the published methods [20,21], which used hazardous reagents and chemicals. The proposed method, however, does not require samples to be preserved, transported, stored under special conditions, or otherwise treated. Table S5 illustrates our investigation’s results, which prove the efficacy of this approach.
The presented technique exceeded those reported [14,15,16,20,21] for the same factors as in the GAPI tool. An eco-friendly reagent and a straightforward technique produce a 99.8% purity. Additionally, an isocratic system and environmental friendly solvent (ethanol and water) are combined with a lower flow rate and a short run time. Several aspects are covered in the strategies, as illustrated in Table S5. With the ComplexGAPI metric, one can evaluate methodologies comprehensively incorporating GAC attributes.
Our investigation has discovered that our technique has a high BAGI score, which indicates that it is more practicable and more applicable than published methods [14,15,16,20,21] with scores of 77.5, 80, 75, 77.5, and 80. Along with its high score, our method performed better on key BAGI attributes such as sample throughput, reagent usage, sample preparation, and automation. In addition to analyzing more samples per hour, reducing reagent and material usage, simplifying sample preparation, and increasing automation, our method offers several other advantages. Several benefits result from these improvements, including increased efficiency, sustainability, and user-friendliness. Compared with existing methods, these methods may have limitations in one or more of these areas, limiting their practicality. For example, Suman and Chaubey [16] used hazardous solvents like methanol, decreasing the environmental impact. Consequently, its score of 75.5 will likely be lower due to this dangerous solvent requirement.
In this study, a simplified method of analytical chemistry was developed, demonstrating a significant breakthrough in the field. In addition to being efficient, sustainable, and easy to use, we address key aspects of the field through this method.
4 Conclusions
In order to evaluate MET, DAP, and their degradation products in test solutions, we need to use eight environmental metrics, and we need to use RGB12 and BAGI related to sustainable chemistry. UPLC and UV procedures are incomprehensible. For this reason, analysts have successfully created and verified a novel strategy. Analysts used software and technologies like AGREE, AGREEprep, GAPI, ComplexGAPI, ESA, AMVI, AMGS, and HPLC-EAT to assess the environmental friendliness of the proposed approach using eight green criteria. Analysts also used a shorter column to decrease waste formation in the mobile phase and during the retention period. The new approach outperformed earlier techniques in terms of performance. Our advanced UPLC and UV processes are the most practical and efficient means of upholding sustainable and environmentally friendly chemistry principles. It is more accurate and dependable than earlier techniques and performs qualitatively and numerically better. This is the most effective and ecologically friendly way to analyze chemicals. The study also highlights the significance of “blue” in white analytical chemistry and its practical applications. The assay of dose forms has been successfully determined using this methodology, and its validity has been confirmed by an examination spanning nine metrics. Due to its low solvent use and lack of expensive equipment requirements, it is both cost-effective and environmentally benign. The single-sample preparation method is simple and will save drug producers’ time and chemicals.
Acknowledgments
The authors acknowledge Princess Nourah bint Abdulrahman University Researchers Supporting Project number (PNURSP2025R67), Princess Nourah bint Abdulrahman University, Riyadh, Saudi Arabia, for the support provided for this study.
-
Funding information: Authors state no funding involved.
-
Author contributions: Ghadah M. Al-Senani: validation, writing – review and editing, investigation, and conceptualization; Salhah D. Al-Qahtani: data curation, software, visualization, and writing – review and editing (equal); Samar M. Mahgoub: validation, investigation (equal), software, and writing – review and editing (equal); Hoda A. Ahmed: software (equal), conceptualization (equal), writing – review and editing (equal), and data curation (equal); Mahmoud A. Mohamed: project administration, writing – original draft, software (equal), investigation (equal), and conceptualization (equal).
-
Conflict of interest: Authors state no conflict of interest.
-
Data availability statement: All data generated or analyzed during this study are included in this published article and its supplementary information files.
References
[1] Shehata N, Rawan AF, Ahmed HA, Alhaddad OA, Amin MS, Nafee SS, et al. Adsorption separation of oxytetracycline hydrochloride using natural and nanostructured clay mineral of silica in synthetic solution: Integration to white and green chemistry metrics. Sustain Chem Pharm. 2024;39:101574. 10.1016/j.scp.2024.101574.Search in Google Scholar
[2] Nassef HM, Ahmed HA, Bashal AH, El-Atawy MA, Alanazi TYA, Mahgoub SM, et al. A novel Six Sigma approach and eco-friendly RP-HPLC technique for determination of pimavanserin and its degraded products: Application of Box–Behnken design. Rev Anal Chem. 2024;43(1):20230073. 10.1515/revac-2023-0073.Search in Google Scholar
[3] Mahgoub SM, Mahmoud MR, Binsaleh AY, Almalki MA, Mohamed MA, Nassar HF. Analytical assessment of a novel RP-HPLC method for the concurrent quantification of selected pharmaceutical drugs levodopa and carbidopa using eight greenness metrics comparing to the lean six sigma approach. Sustain Chem Pharm. 2023;36:101291. 10.1016/j.scp.2023.101291.Search in Google Scholar
[4] Assirey EA, Ahmed HA, AL‐Faze R, Amin MS, Mahgoub SM, Abo El‐Ela FI, et al. Novel RP‐HPLC method for estimation of a newly developed combination of tizanidine and etoricoxib in rat plasma: Eight criteria for greens evaluation. Arch Pharm. 2024;357:e2400025. 10.1002/ardp.202400025.Search in Google Scholar PubMed
[5] Nassef HM, Ahmed HA, El-Atawy MA, Alanazi TYA, Mohamed MA. Greens assessment of RP-UPLC method for estimating Triamcinolone Acetonide and its degraded products compared to Box-Behnken and Six Sigma designs. Green Chem Lett Rev. 2024;17(1):2301315. 10.1080/17518253.2023.2301315; Morgan EM, Lotfy HM, Obaydo RH, Fayez YM, Abdelkawy M, Boltia SA. Whiteness and greenness assessment with efficacy evaluation of two UPLC systems applied for the quantification of cinnarizine and dimenhydrinate along with their toxic impurities. Sustain Chem Pharm. 2023;36:101225. 10.1016/j.scp.2023.101225; Rostom Y, Rezk MR, Wadie M, Abdel-Moety EM, Marzouk HM. State-of-the-art mathematically induced filtration approaches for smart spectrophotometric assessment of silodosin and solifenacin mixture in their new challenging formulation: Multi-tool greenness and whiteness evaluation. Spectrochim Acta - A: Mol Biomol. 2024;307:123650. doi: 10.1016/j.saa.2023.123650.Search in Google Scholar
[6] Alanazi TYA, Adel Pashameah R, Binsaleh AY, Mohamed MA, Ahmed HA, Nassar HF. Condition optimization of eco-friendly RP-HPLC and MCR methods via Box–Behnken design and six sigma approach for detecting antibiotic residues. Sci Rep. 2023;13:15729. 10.1038/s41598-023-40010-1.Search in Google Scholar PubMed PubMed Central
[7] Ahmed HA, El-Atawy MA, Nassef HM, Amin MS, Jaremko M, Emwas AH, et al. Eco-friendly chromatographic techniques for appraisal of Amlodipine, Hydrochlorothiazide, Telmisartan, and their related substances in dosage form: Application to six sigma and content uniformity approaches. Sustain Chem Pharm. 2024;38:101469. 10.1016/j.scp.2024.101469.Search in Google Scholar
[8] Alanazi TYA, Almalki MA, Mohamed MA, Nassar HF. Five greenness assessments of novel RP-UPLC and MCR methods for concurrent determination of selected pharmaceutical drugs in comparison with the lean Six Sigma approach. Microchem J. 2023;194:109359. 10.1016/j.microc.2023.109359.Search in Google Scholar
[9] Al-Kadhi NS, Mohamed MA, Ahmed HA, Nassar HF. Facile synthesis and eco-friendly analytical methods for concurrent estimation of selected pharmaceutical drugs in their solutions: application to quality by design, lean six sigma, and stability studies. BMC Chem. 2023;17:136. 10.1186/s13065-023-01028-8.Search in Google Scholar PubMed PubMed Central
[10] Hassouna MEM, Mohamed MA. Modeling and optimization of a novel RP-UPLC and MCR spectrophotometric methods for simultaneous determination of five cephalosporins in spiked human plasma: Application to lean six sigma thinking hats and antimicrobial activity. Microchem J. 2019;150:104161. 10.1016/j.microc.2019.104161.Search in Google Scholar
[11] Carlson CJ, Santamarina ML. Update review of the safety of sodium-glucose cotransporter 2 inhibitors for the treatment of patients with type 2 diabetes mellitus. Expert Opin Drug Saf. 2016;15(10):1401–12. 10.1080/14740338.2016.1216100.Search in Google Scholar PubMed
[12] Glovaci D, Fan W, Wong ND. Epidemiology of diabetes mellitus and cardiovascular disease. Curr Cardiol Rep. 2019;21:1–8. 10.1007/s11886-019-1107-y.Search in Google Scholar PubMed
[13] Rawshani A, Rawshani A, Franzén S, Eliasson B, Svensson AM, Miftaraj M, et al. Mortality and cardiovascular disease in type 1 and type 2 diabetes. N Engl J Med. 2017;376(15):1407–18. 10.1056/NEJMoa1608664.Search in Google Scholar PubMed
[14] Antakli S, Kabbani R, Labban R. Analytical spectrometric study for determining dapagliflozin propanediol monohydrate individually or in presence of metformin hydrochloride in Tablets formulation. J Adv Chem. 2020;17:80–7. 10.24297/jac.v17i.8812.Search in Google Scholar
[15] Sen DB, Jatu S, Maheshwari RA, Zanwar AS, Velmurugan R, Sen AK. New Eco-friendly UV-spectroscopic Methods for Simultaneous Assessment of Dapagliflozin, Saxagliptin and Metformin in Ternary Mixture. Indian J Pharm Educ Res. 2023;57(2):559–69. 10.5530/ijper.57.2.69.Search in Google Scholar
[16] Suman SS, Chaubey R. Simultaneous spectrophotometric estimation of metformin, saxagliptin and dapagliflozin in marketed formulations. J Pharm Res Int. 2021;33(61B):167–73. 10.9734/jpri/2021/v33i61B35495.Search in Google Scholar
[17] Chaitali RD, Rao JR. Stability indicating HPLC method development and validation for the simultaneous estimation of metformin hydrochloride and dapagliflozin in API and pharmaceutical dosage form. Int Res J Pharm. 2021;12(8):52–7. 10.7897/2230-8407.1208157.Search in Google Scholar
[18] Bhavyasri K, Surekha T, Begum S, Sumakanth M. RP-HPLC method for dapagliflozin and metformin HCl in bulk and combined formulation. Arch Pharm Pract. 2022;12(4):106–10. 10.51847/Czxl0wYrYr.Search in Google Scholar
[19] Dighe NS, Varade PR, Shinde GS, Rao PS. Quantitative estimation and validation of dapagliflozin and metformin hydrochloride in pharmaceutical dosage form by RP-HPLC. Asian J Res Chem. 2019;12(3):136–42. 10.5958/0974-4150.2019.00028.2.Search in Google Scholar
[20] Vyas AJ, Jadav CD, Patel KJ, Patel R, Vadile HM, Patel AB, et al. Diode array detector based RP-UPLC method for simultaneous estimation of dapagliflozin propanediol monohydrate and metformin. Res J Pharm Technol. 2024;17(3):991–6. 10.52711/0974-360X.2024.00153.Search in Google Scholar
[21] Zaghary WA, Mowaka S, Hendy MS. Kinetic degradation study of dapagliflozin coupled with UHPLC separation in the presence of major degradation product and metformin. Chromatographia. 2019;82:777–89. 10.1007/s10337-019-03702-3.Search in Google Scholar
[22] Gałuszka A, Migaszewski ZM, Konieczka P, Namieśnik J. Analytical eco-scale for assessing the greenness of analytical procedures. TrAC Trends Anal Chem. 2012;37:61–72. 10.1016/j.trac.2012.03.013.Search in Google Scholar
[23] Płotka-Wasylka J. A new tool for the evaluation of the analytical procedure: Green analytical procedure index. Talanta. 2018;181:204–9. 10.1016/j.talanta.2018.01.013.Search in Google Scholar PubMed
[24] Pena-Pereira F, Wojnowski W, Tobiszewski M. AGREE—analytical GREEnness metric approach and software. Anal Chem. 2020;92(14):10076–82. 10.1021/acs.analchem.0c01887.Search in Google Scholar PubMed PubMed Central
[25] Pena-Pereira F, Tobiszewski M, Wojnowski W, Psillakis E. A tutorial on AGREEprep an analytical greenness metric for sample preparation. Adv Sample Prep. 2022;3:100025. 10.1016/j.sampre.2022.100025.Search in Google Scholar
[26] Nowak PM, Wietecha-Posłuszny R, Pawliszyn J. White analytical chemistry: an approach to reconcile the principles of green analytical chemistry and functionality. TrAC Trends Anal Chem. 2021;138:116223. 10.1016/j.trac.2021.116223.Search in Google Scholar
[27] Manousi N, Wojnowski W, Płotka-Wasylka J, Samanidou V. Blue applicability grade index (BAGI) and software: a new tool for the evaluation of method practicality. Green Chem. 2023;25(19):7598–604. 10.1039/D3GC02347H.Search in Google Scholar
[28] Płotka-Wasylka J, Wojnowski W. Complementary green analytical procedure index (ComplexGAPI) and software. Green Chem. 2021;23(21):8657–65. 10.1039/D1GC02318G.Search in Google Scholar
[29] Hicks MB, Farrell W, Aurigemma C, Lehmann L, Weisel L, Nadeau K, et al. Making the move towards modernized greener separations: introduction of the analytical method greenness score (AMGS) calculator. Green Chem. 2019;21(7):1816–26. 10.1039/C8GC03875A.Search in Google Scholar
[30] Hartman R, Helmy R, Al-Sayah M, Welch CJ. Analytical method volume intensity (amvi): a green chemistry metric for HPLC methodology in the pharmaceutical industry. Green Chem. 2011;13(4):934–9. 10.1039/C0GC00524J.Search in Google Scholar
[31] Gaber Y, Törnvall U, Kumar MA, Amin MA, Hatti-Kaul R. HPLC-EAT (Environmental Assessment Tool): a tool for profiling safety, health and environmental impacts of liquid chromatography methods. Green Chem. 2011;13(8):2021–5. 10.1039/C0GC00667J.Search in Google Scholar
[32] Al-Wasidi AS, Ahmed HA, Alshammari MFA, Nafee SS, Mohamed MA. Cutting-edge HPLC and MCR techniques for synchronically quantifying anticholinergic drugs in the presence of C12 and C14 homologs: Robust application to green and white chemistry. Arch Pharm. 2024;357:e2400256. 10.1002/ardp.202400256.Search in Google Scholar PubMed
[33] I.H.T. Guideline, Validation of analytical procedures Q2 (R2), ICH Geneva, Switz, 2022Search in Google Scholar
© 2025 the author(s), published by De Gruyter
This work is licensed under the Creative Commons Attribution 4.0 International License.
Articles in the same Issue
- Research Articles
- Impressive stability-indicating RP-HPLC method for concurrent quantification of salbutamol, guaifenesin, and sodium benzoate in cough syrup: Application of six sigma and green metrics
- Bioanalytically validated potentiometric method for determination of bisphenol A: Application to baby bibs, pacifiers, and Teethers’ saliva samples
- Environmental impact of RP-HPLC strategy for detection of selected antibiotics residues in wastewater: Evaluating of quality tools
- Trace-level impurity quantification in lead-cooled fast reactors using ICP-MS: Methodology and challenges
- Picogram-level detection of three ACE inhibitors via LC–MS/MS: Comparing BMP and UOSA54 derivatization methods
- Eco-friendly RP-HPLC method for concurrent estimation of a promising combination of methocarbamol and etoricoxib in rat plasma
- Development of a point-of-care testing sensor using polypyrrole/TiO2 molecular imprinting technology for cinchocaine determination
- Green and sustainable RP-UPLC and UV strategies for determination of metformin and dapagliflozin: Evaluation of environmental impact and whiteness
- Review Articles
- Determination of montelukast and non-sedating antihistamine combination in pharmaceutical dosage forms: A review
- Extraction approaches for the isolation of some POPs from lipid-based environmental and food matrices: A review
- A review of semiconductor photocatalyst characterization techniques
- Analytical determination techniques for lithium – A review
- Fourier transform infrared spectroscopy study of polymer/filler/ionic liquid composites