Impressive stability-indicating RP-HPLC method for concurrent quantification of salbutamol, guaifenesin, and sodium benzoate in cough syrup: Application of six sigma and green metrics
-
Tahani Y. A. Alanazi
 ,
Osama A. Mohammed
,
Osama A. Mohammed

Abstract
Analytical chemistry research has shifted towards environmentally friendly substitutes that reduce waste and avoid hazardous substances. These efforts align with broader environmental goals and inspire sustainable and responsible science. The objective of this work is to develop and validate an analytical method and verify its greenness using specific tools, including analytical GREEnness (AGREE), analytical greenness metric for sample preparation (AGREEprep), green analytical procedure index, complex green analytical procedure index, analytical Eco-Scale, analytical method volume intensity, analytical method greenness score, and HPLC-EAT (Environmental Assessment Tool). Effective treatment of chronic cough relies heavily on adequately utilizing salbutamol (SAL) and guaifenesin (GUA) in the presence of sodium benzoate (SOB) preservative. The isocratic elution mode used the Zorbax Eclipse Plus C18 column (15 cm × 4.6 mm, 3.5 µm). It could move 1.5 mL·min−1, hold 50 µL, have a column temperature of 30°C, and have an autosampler temperature of 5°C. It could detect UV light at 276 nm and had a mobile phase of 80:20 v/v buffer solution and acetonitrile. We have successfully established highly accurate calibration curves for the three components SAL, GUA, and SOB within the optimal range of 2–50 µg·mL−1. The coefficient of correlation (r) for these curves was at an impressive 0.9999 for SAL and GUA, while it was 0.9998 for SOB. The recovery values were 100.15%, 100.47%, and 100.92% for SAL, GUA, and SOB, respectively. The selectivity and sensitivity to the ingredients were confirmed according to the International Council for Harmonisation guidelines, as no interference occurred from any of the used sample components. We implemented Six Sigma, resulting in precision and productivity.
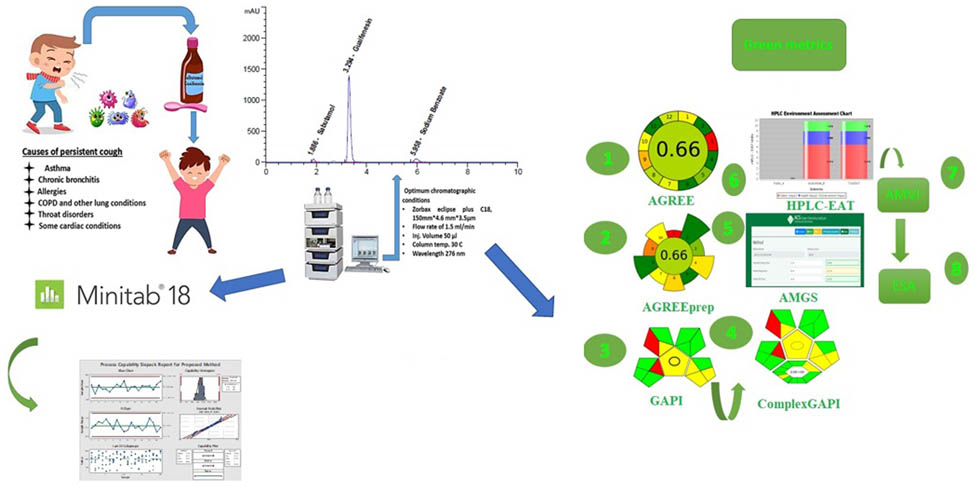
Graphical abstract
1 Introduction
Coughing is a natural response that clears the airways of irritants like asthma, allergies, and other lung conditions. Additionally, it may be caused by throat disorders and heart conditions. Unfortunately, coughing can last up to eight weeks, which can be difficult for patients. Cough enhancers may be recommended to help reduce infection length, especially for younger patients [1,2]. The concept of “green chemistry” has been gaining popularity since the 1990s [3]. This cutting-edge approach to chemical manufacturing and procedures seeks to eliminate or minimize the use of hazardous substances. It has become an essential topic in the field of environmentally friendly chemistry. The aim is to ensure that chemical goods and processes are created safely for humans and the environment [4]. Green chemistry has revolutionized sustainable design, paving the way for a thoughtful and sustainable approach to chemistry. With the 12 Principles of Green Chemistry guiding chemists, the importance of green chemistry will only continue to grow. It is crucial for avoiding environmental waste and achieving sustainability. Incorporating method validation criteria for the greenness evaluation of analytical procedures is crucial for those looking to promote green chemistry [5]. By doing so, the sustainability of techniques can be confirmed, and community perceptions of analytical chemistry can be improved. To develop a sustainable future, it is crucial to incorporate green chemistry projects [6]. The advancements in chromatographic methods that emphasize sustainable processes are genuinely remarkable. We must carefully evaluate the potential environmental impact of high-performance liquid chromatography (HPLC) techniques to guarantee they are genuinely beneficial and environmentally friendly.We have access to various tools to aid in this review, including the widely recognized AGREE tool. In addition, there are many other tools available that have been specifically designed to promote the adoption of sustainable analytical procedures, such as green analytical procedure index (GAPI), AGREEprep, complex green analytical procedure index (ComplexGAPI), analytical method volume intensity (AMVI), HPLC-EAT, analytical method greenness score (AMGS), and Eco-Scale (ESA). We might enhance research using these resources while fulfilling our environmental responsibilities [7]. Many assessment tools have recently been established. However, no singular tool can provide a complete coverage assessment. Thus, adopting a multiple toolkit methodology allows for a deeper analysis [8,9,10]. Industries have indeed come a long way in terms of improving their operations. Quality tools, routine analytical procedures, and lean Six Sigma approaches have been implemented to anticipate and eliminate process flaws and increase efficiency [11,12,13]. The pharmaceutical industry is no stranger to these methods, as they have adopted them to boost overall process capabilities. Six Sigma is one of the process improvement methodologies employed by the industry that strongly emphasizes managing factor volatility [14,15]. Another strategy, Lean Six Sigma, utilizes many efficient techniques to ensure process quality. The sector uses statistical methodologies like process capability (Cp) and process capability index (Cpk) to measure process performance and capability, which have yielded promising results [16,17,18].
Salbutamol (SAL) is a highly effective, short-acting medicine frequently used to treat coughs. Its mechanism of action revolves around relaxing the muscles in the airways, thus making breathing easier. The chemical name for SAL (Figure 1a) is 4-[2-tert-butylamino)-1-hydroxyethyl]-2-(hydroxymethyl) phenol [19]. Guaifenesin (GUA) is another key ingredient commonly used in cough suppressant formulas and is known for its potent expectorant and antitussive properties [20,21,22]. GUA works by dislodging mucus from the airways and reducing coughing. Its chemical name is 3-(2-methoxyphenoxy) propane-1,2-diol (Figure 1b). Additionally, it is crucial to incorporate preservatives into cough syrup compositions to extend their shelf life and prevent bacterial growth. Sodium benzoate (SOB) (Figure 1c) is a highly effective preservative commonly used in cough syrup manufacturing [23].

Chemical structures of (a) SAL, (b) GUA, and (c) SOB.
Various methods, such as gas chromatography [24], spectrophotometric studies [25,26], and HPLC analyses, can accurately estimate SAL and GUA levels [27,28,29,30,31,32,33]. The literature extensively describes these methods, ensuring their reliability and precision.
The proposed HPLC method introduces significant innovations by integrating green chemistry principles and Six Sigma methodology to enhance both environmental sustainability and analytical efficiency. It utilizes eco-friendly solvents and minimizes waste, aligning with sustainability goals in analytical chemistry. The method allows for the simultaneous quantification of SAL, GUA, and SOB, along with their degraded products, demonstrating high sensitivity and selectivity without interference from other substances. Additionally, it employs rigorous validation through eight credible evaluation tools to ensure its greenness and reliability, all while achieving rapid analysis times. This comprehensive approach sets a new standard for environmentally responsible and efficient analytical techniques in the pharmaceutical industry.
2 Experimental
2.1 Chemicals and reagents
The reagents used in the study are of the highest quality. All reagents are HPLC-grade, ensuring suitability for use in HPLC. SAL sulfate, obtained from Supriya(Mumbai, India), has an impressive purity of 99.78%. Similarly, GUA sourced from Stellar (Mumbai, India) has a purity of 99.84%. SOB from Wuhan Youji Industries Co., Ltd. (Wuhan, China) is of outstanding quality with a purity of 100.12%. We obtained Octovent Plus syrup from the local market. The syrup is packaged in a 100 mL bottle and blends GUA, SAL, and SOB. Each 5 mL of syrup contains 50 mg of GUA, 2 mg of SAL, and 5 mg of SOB. Lastly, the highest quality is the hexane-1-sulfonic acid, sodium salt monohydrate, and acetonitrile obtained from Supelco (Pennsylvania, USA). Bidistilled water and glacial acetic acid from Scharlau(Barcelona, Spain) complete the outstanding group of reagents.
2.2 Instrumentation
Chromatographic analysis was conducted using an Agilent 1200 HPLC system equipped with a UV detector, a quaternary solvent delivery pump, and an autosampler originating from Santa Clara, USA. The Chemstation software was employed to process and monitor the output signal. For the separation process, a Zorbax Eclipse Plus C18 HPLC Column (150 × 4.6 mm, 3.5 μm particle size) was utilized, operating at a temperature of 30°C and employing a UV detection wavelength of 276 nm. Additionally, a Sonix TV ss-series ultrasonicator(Florida, USA) and a Sartorius Digital Balance (Saxony, Germany) were used in the procedure.
2.3 Mobile phase and diluent
The mobile phase was prepared by mixing a buffer solution and acetonitrile in a ratio of 20:80 (v/v). The buffer was composed of 1.13 g of sodium salt monohydrate hexane-1-sulfonic acid dissolved in 1,200 mL of water, along with 12 mL of glacial acetic acid, ensuring thorough mixing.
2.4 Working standard solutions
SAL sulfate equivalent to 2 mg of SAL was weighed precisely to prepare the standard solution, in addition to 50 mg of GUA and 5 mg of SOB. Then, we mixed the solution with the mobile phase in a 100 mL volumetric flask and utilized ultrasonic waves to sonicate it for 10 min. After cooling it to room temperature, we added the remaining mobile phase to fill the flask to the mark. We transferred 2 mL of the initial solution into a 20 mL volumetric flask and added the same solvent. Then, we thoroughly mixed the solution.
2.5 Application of dosage form
The bottles of Octovent Plus syrup were prepared as instructed on the label by adding the quantity of water to the mark, then it was shaken vigorously for 10 min. A precise amount of the finished syrup was transferred, which must be fresh and bubble-free (approximately 5 mL) and quantitatively diluted with solvent in a volumetric flask of 100 mL. In a 20 mL volumetric flask, 2 mL of this solution was taken, diluted with solvent to volume, and thoroughly mixed. It was briefly sonicated, if necessary, to achieve dissolution, and heating the solution was avoided. The first 4.0 mL was discarded, then filtered through (PTFE or PVDF) 0.45 µm filter.
2.6 Chromatographic conditions
We meticulously examined the sample using advanced analytical equipment, specifically the Agilent Series 1200 HPLC system. This study employed a Zorbax Eclipse Plus C18 column measuring 15 cm × 4.6 mm, maintained at 30°C. This column featured a particle size of 3.5 µm and operated at a constant flow rate of 1.5 mL·min−1. To ensure precise results, an isocratic elution technique was applied using a buffer solution of acetonitrile in a proportion of 20:80. The buffer was prepared by dissolving 1.13 g of sodium salt monohydrate hexane-1-sulfonic acid in 1,200 mL of water and 12 mL of glacial acetic acid, followed by thorough mixing. Samples were injected at 50 µL each, with a fixed detection wavelength set at 276 nm [34].
2.7 Establishing calibration curves
After finalizing the dilutions, we meticulously introduced the diluent to achieve the target concentrations. We graphically represented the relationship between the drug concentrations and their corresponding peak area responses to ensure a precise analysis.
2.8 Application of Six Sigma methodology
Industries use the process capability index (Cpk) to improve manufacturing processes. Industries can use this index to improve product quality and uniformity, eliminate scrap, and drastically lower production costs and losses resulting from subpar quality. Industries must observe the behavior of the process to find the Cpk value. A high Cpk figure indicates that the process maintains its stated center limit even with significant swings. A low Cpk score, on the other hand, indicates that the procedure must be improved. A Cpk of 1.33 (4 sigma) or above is what industries should strive for to satisfy the expectations of most customers [35].
3 Results
3.1 Initial assessment
After conducting several tests, we determined the best chromatographic conditions. We experimented with varying the flow rate from 0.5 to 2 mL·min−1 until we finally found the ideal flow rate of 1.5 mL·min−1. We also tried different columns with various C8, C18, and other lengths and packaging materials, phenyl, and cyano columns, ranging in size from 100 mm to 250 mm. Ultimately, we settled on the Zorbax Eclipse plus C18 specification of 15 cm × 4.6 mm, 3.5 µm, which produced a higher-definition column with quick resolution. By scanning the 200–400 nm wavelengths, we produced a breakable chromatogram with distinct peaks and a high resolution of 276 nm. The wavelength selection played a crucial role in achieving these results. We experimented with a variety of mobile phase combinations, including methanol/water (50:50, v/v), acetonitrile/water (50:50, v/v), and ethanol/potassium dihydrogen phosphate buffer pH 3 (50:50, v/v) and pH 5.0 (50:50, v/v). However, we have yet to get any clear peaks. Finally, we found that the best development system for separating SAL, GUA, and SOB was a mobile phase of a mixture of buffer solution and acetonitrile (80:20), which showed distinct and sharp peaks with high resolution. To prepare the buffer solution, we added 1.13 g of the sodium salt of hexane-1-sulfonic acid to 12 mL of glacial acetic acid and mixed it well. We maintained the column oven’s temperature at 30°C, as shown in Figure 2a and b.
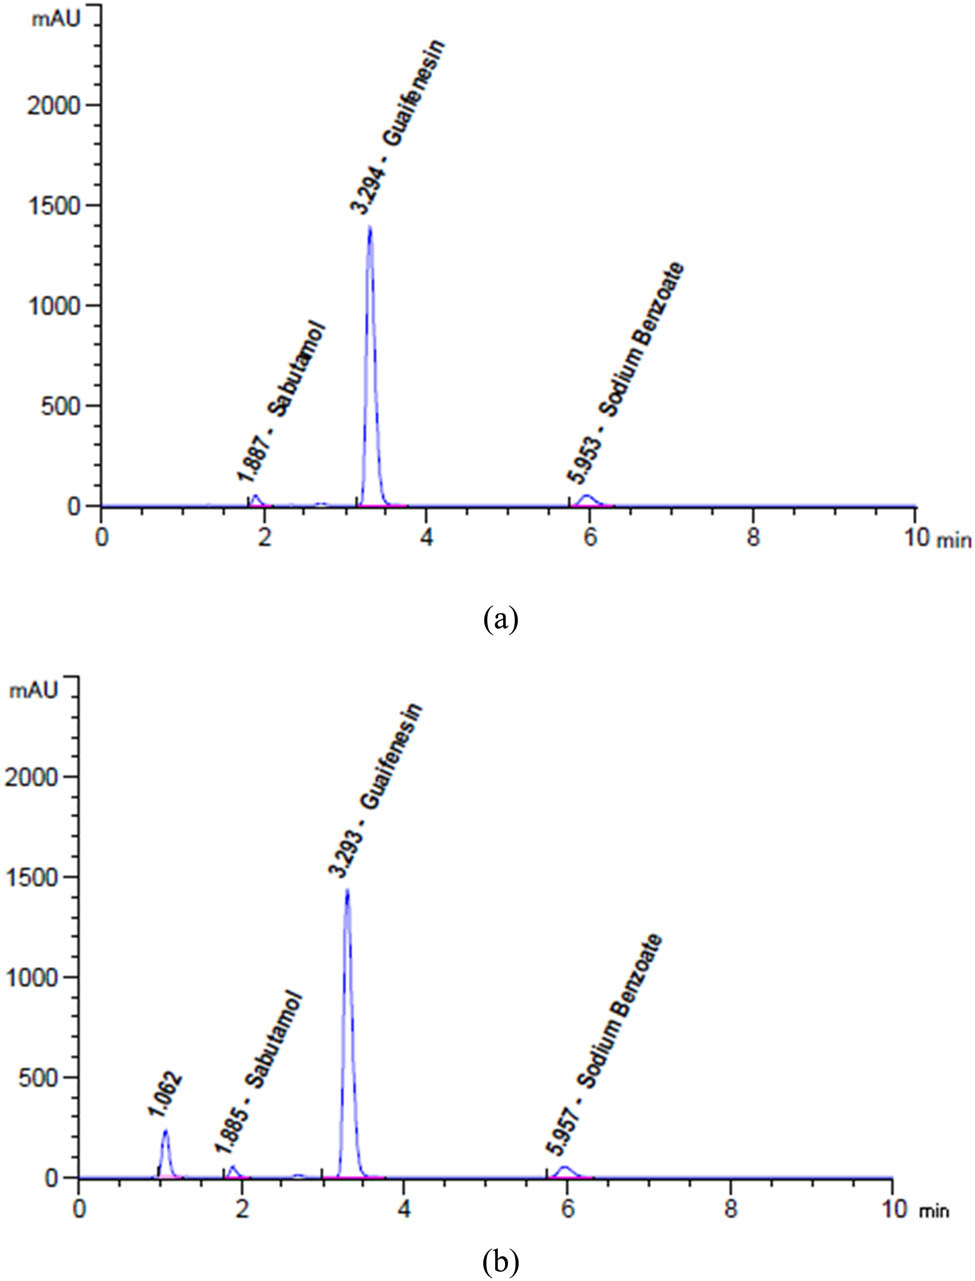
HPLC chromatograms of SAL, GUA, and SOB for (a) laboratory mixture and (b) Octovent plus syrup recorded at an optimum wavelength of 276 nm.
3.2 Assessing the greenness of approaches
3.2.1 AMVI tool
The volume of solvent utilized and disposal produced throughout an inevitable analytical process is measured using the AMVI metric. According to a study by Hartman et al., the lower the AMVI score, the better it is for the environment [36]. It is crucial to note how analytical methods are evolving to help minimize the impact on the environment. Using equations is required to guarantee correct calculations of solvent consumption during an analytical technique. With this equation, which considers every chemical and solvent used in chromatographic analysis and sample preparation, researchers may rapidly and reliably calculate the total amount of solvent utilized. The total amount of solvent used is equal to the sum of the solvents used for HPLC and sample preparation multiplied by the number of duplicates. When evaluating different analytical techniques, it is important to consider the AMVI score. This score is calculated by dividing each approach’s prominent peaks by the amount of solvent consumed. The resulting AMVI grade is a valuable tool for experts looking to assess the potential environmental impact of a given procedure.
The AMVI approach, which can calculate the total solvent consumption in liquid chromatography systems, is incredibly flexible and efficient. It is a versatile instrument used in laboratory settings, particularly for liquid chromatography operations. It benefits from applying a range of analytical methods. Based on Tables 1 and 2, the recommended method is more environmentally friendly, with a lower AMVI score of 177.
Comparison between the suggested method and the previously published ones employing environmentally friendly metrics
| Method | Proposed method | Reported method [27] | Reported method [27] | Reported method [29] | Reported method [30] | Reported method [31] | Reported method [32] | Reported method [33] |
|---|---|---|---|---|---|---|---|---|
| AGREE |
 |
 |
 |
 |
 |
 |
 |
 |
| AGREEprep |
 |
 |
 |
 |
 |
 |
 |
 |
| GAPI |
 |
 |
 |
 |
 |
 |
 |
 |
| ComplexGAPI |
 |
 |
 |
 |
 |
 |
 |
 |
| AMVI | 177 | 223.3 | 263.3 | 216.7 | 227.5 | 1,313.3 | 210 | 193.3 |
| ESA | 81 | 71 | 69 | 77 | 71 | 79 | 67 | 81 |
AMVI evaluation of the suggested approach
| Specification | Proposed technique |
|---|---|
| Solvent consumption HPLC (mL) | 450 |
| Flow rate | 1.5 |
| Run time | 10 |
| Number of injections for one complete analysis | 10 |
| Number of analytes | 3 |
| Solvent consumption sample prep (mL) | 80 |
| Volume (mL) for standard preparation | 20 |
| Standard preparation numbers | 1 |
| Volume (mL) for test preparation | 20 |
| Test preparation numbers | 2 |
| Volume (mL) for system suitability | 20 |
| System suitability numbers | 1 |
| Total method solvent consumption | 530 |
| AMVI | 177 |
| % consumption HPLC | 85 |
| % consumption preparations | 15 |
Bold values represent key findings or significant differences that are important for interpreting the data.
3.2.2 ESA
The suggested method has undergone a rigorous ecological impact analysis using the ESA tool. We left no stone unturned in assessing its viability, considering chemical usage, potential hazards, energy consumption, and waste production variables. As a result of our hard work, we are delighted to report that the method achieved an exceptional eco-score, indicating a high level of environmental sustainability [37]. We went above and beyond to remove penalty points from a perfect score of 100 to complete this remarkable eco-score. The ESA has classified the technique as “excellent green,” with a penalty point of 85 (see Table 3).
Deduction of points for utilizing the prescribed technique for determining the ESA score
| Analytical ESA | Penalty points | |
|---|---|---|
| Reagents | Bidistilled water | 0 |
| 1-Hexane sulfonic acid sodium salt | 2 | |
| Glacial acetic acid | 4 | |
| Acetonitrile | 8 | |
| Instruments | Energy for HPLC ≤ 1.5 kW·h/sample | 1 |
| Occupational hazard | 0 | |
| Ultrasonic | 1 | |
| Waste | 3 | |
| Total penalty points | 19 | |
| ESA total score | 81 |
Bold values represent key findings or significant differences that are important for interpreting the data.
3.2.3 AGREE tool
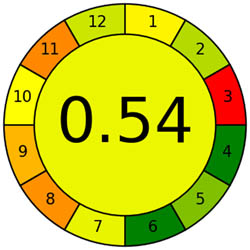
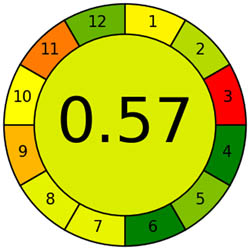
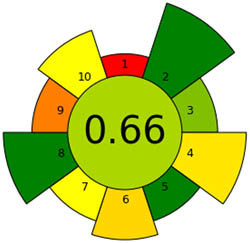
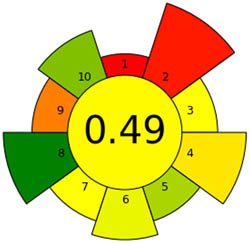
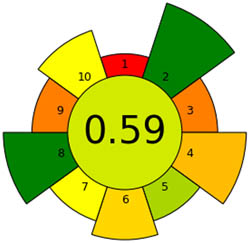
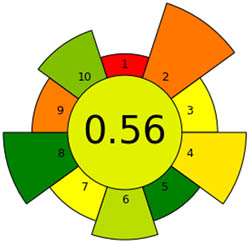
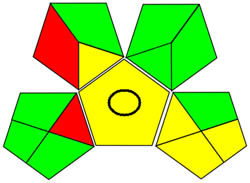
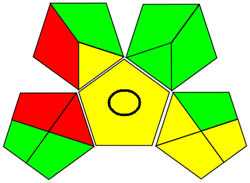
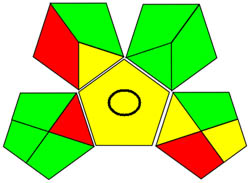
The AGREE tool is a remarkable way of evaluating sustainability, particularly when it comes to environmental sustainability. It uses the 12-item GAC guidelines and assesses each on a scale of 0 to 1 based on how effectively it promotes ecological sustainability. AGREE has become extremely popular over the years, and its graph is one of the most powerful tools [38]. The colors red, yellow, and green for each metric correspond to different performance levels. The methodology used for this assessment is highly effective as it adheres to the 12 criteria shown in Figure S1a and is environmentally friendly. Figure 3a shows the AGREE symbol for ecological sustainability, highlighting the evaluation tool’s importance. The center score of 0.66 provides strong support for the sustainability concept. As more sustainability is attained, the pictogram’s green tones become darker and more graphic. A helpful tool for assessing the method’s sustainability is the AGREE pictogram.
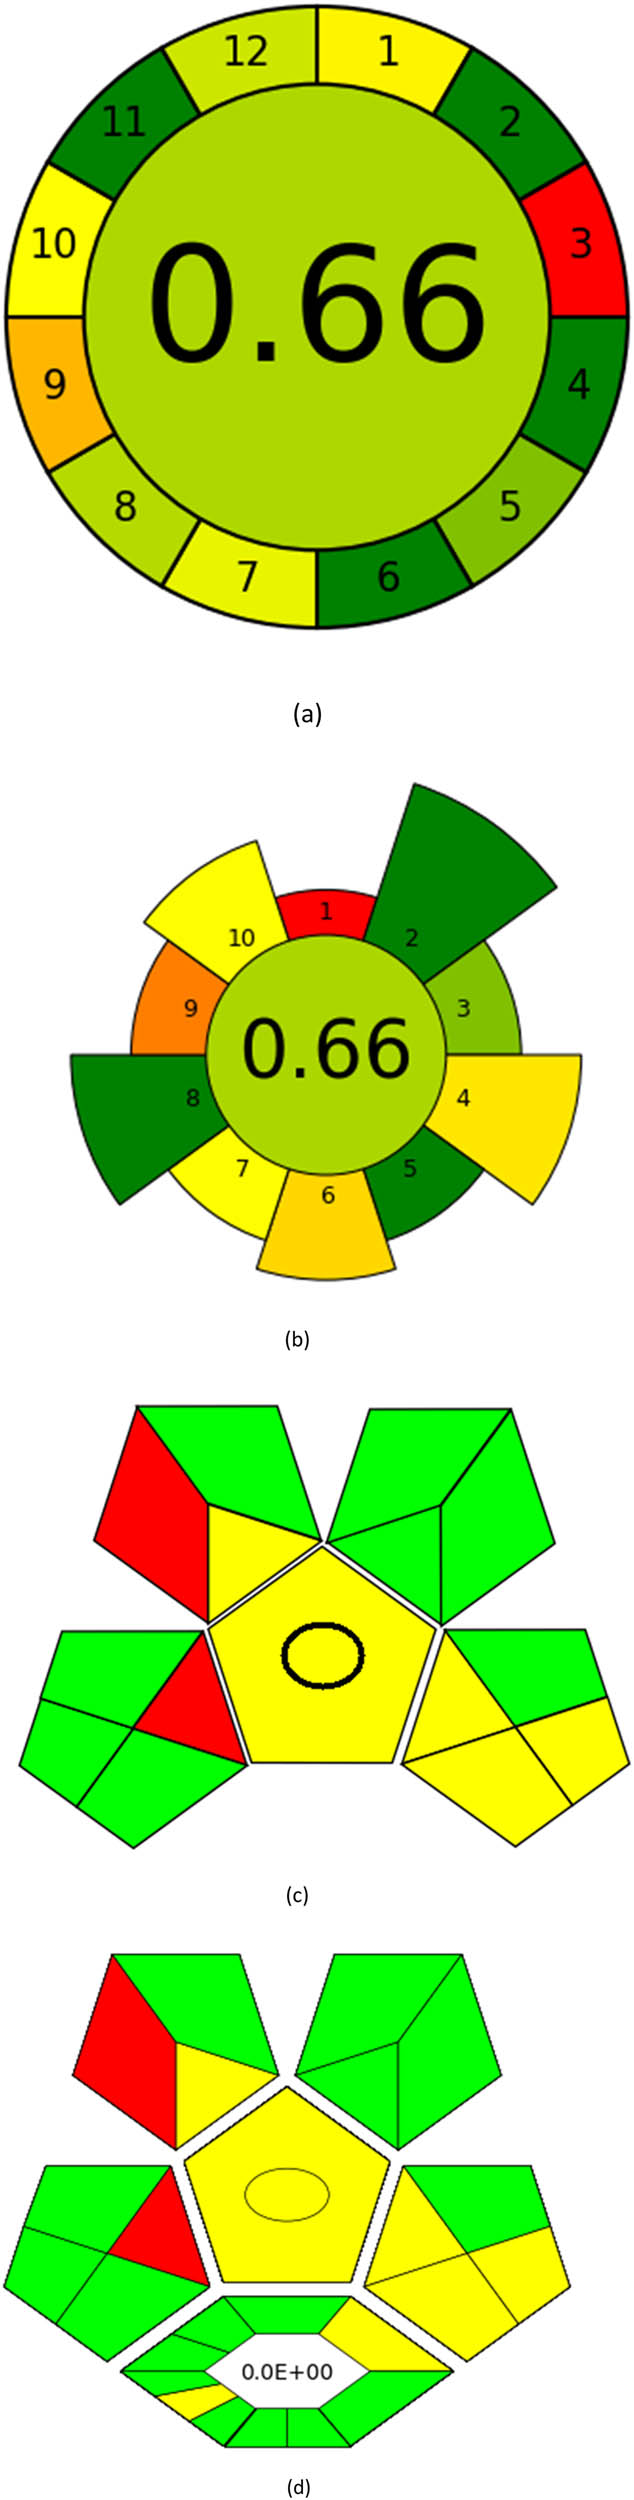

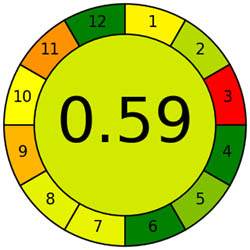
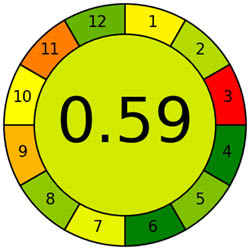
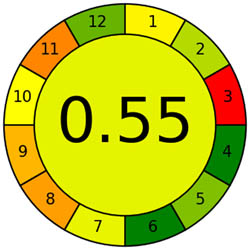
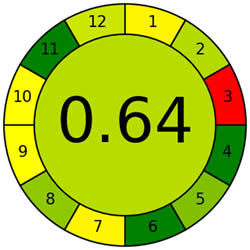
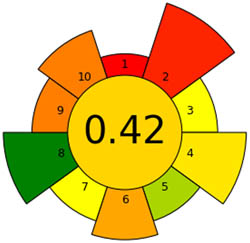
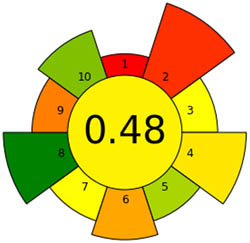
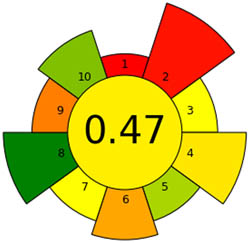
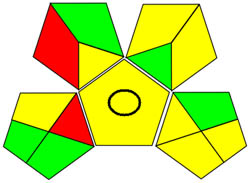
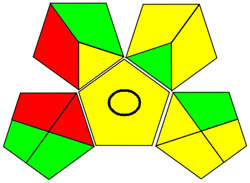
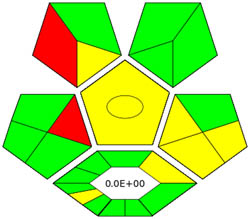
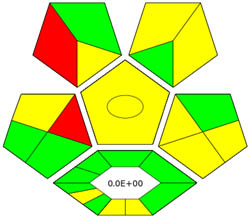
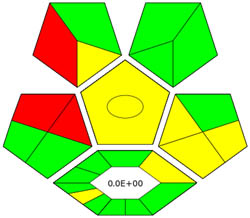
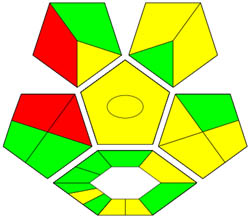
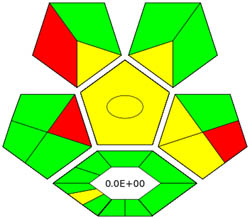
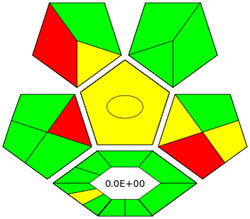
Appraisal of the “greenness” for the proposed approach, using (a) AGREE, (b) AGREEprep, (c) GAPI, (d) ComplexGAPI pictograms, (e) AMGS, and (f) HPLC-EAT.
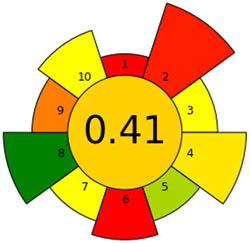
3.2.4 AGREEprep tool
An essential stage in the analytical process is sample preparation. We go to considerable lengths to ensure the methods have as little detrimental effect on the environment as possible. We assess our sample preparation techniques with the AGREEprep measure. We may conduct sustainable and ecologically responsible sample preparation operations by following the GAC’s 12 leading items and the GSP’s ten standards through the AGREEprep measure. This methodology performs with improved accuracy and precision when evaluating the effects of different sample preparation techniques on the environment. By integrating ten essential concepts into the review process, the AGREEprep technique allows us to expedite the sample preparation procedure. We found it impressive because the proficiency of each segment is assigned a number between 0 and 1, where 1 represents the maximum efficiency level [39]. Figure S1b provides a pictorial representation of each of the ten sections, facilitating comprehension. With an acceptability score of 0.66, the approach used is ecologically relevant based on the findings of Figure 3b.
3.2.5 GAPI tool
Using a metric for ecologically friendly to evaluate the potential ecological impacts of various techniques is beneficial. A green, yellow, or red category is assigned to each stage of the process, from collecting samples to analyzing the results. A green category denotes a process considered ecologically friendly, while a yellow category denotes one that is not. For more clarification of the total evaluation of the process, these levels are categorized into three categories: high, moderate, and low. We can evaluate the environmental impact of our analytical procedures and implement more environmentally friendly practices via technology. We have a thorough and dependable way to assess the ecological impact of analytical processes because of the GAPI approach and have access to the information we need to assess our environmental impact [40]. The GAPI system performs better than conventional analytical techniques when all pertinent aspects are considered during the stages, as depicted in Figure 3c. Its five unique characteristics and fifteen descriptive elements, encompassing sample preparation to decision-making, may account for its superiority. The benefits of this strategy for the environment, as illustrated in Figure S2a, strengthen the case for its effectiveness. To sum up, the GAPI system provides valuable data about the systems and is a robust analytical tool.
3.2.6 ComplexGAPI tool
ComplexGAPI metric has been identified as an advanced approach for assessing the sustainability impact of different components on GAC features, as illustrated in Figure S2b. This method distinguishes itself from the traditional GAPI metric by enhancing performance by incorporating an additional hexagonal layer for preliminary analysis procedures. It considers various factors, including environmental considerations, reactants, solvents, alignment with enduring economic frameworks, measurement tools, and post-reaction treatment and purification processes. The sustainability impact for each component is determined using a color-coded system akin to that of the GAPI method. The red, yellow, and green indicators signify the severity of environmental concerns, with red indicating severe, yellow indicating moderate, and green indicating mild ecological impacts [41]. As shown in Figure 3d, the ComplexGAPI measure employs various tactics to evaluate GAC characteristics using different approaches, making it comprehensive and cutting-edge.
3.2.7 AMGS tool
Several studies have shown that the AMGS approach is the most effective way of assessing the environmental impact of different operations. Environmental safety and well-being are promoted through this approach by considering factors like energy consumption, solvent requirements, and solvent waste generation. The AMGS technique considers multiple factors when comparing various processes, including energy, solvent energy, and solvent safety. The results are displayed in three colored sections based on a numerical scoring system [42]. Figure 3e provides a clear example of this system. The AMGS methodology provides a greenness score of 200.29, which is a very insightful way to evaluate the suitability of a method. Figure S3a shows this score in action.
3.2.8 HPLC-EAT
After reviewing the liquid chromatographic procedures, we found that the HPLC-EAT software program is an excellent research tool. It makes assessing each solvent’s safety, influence on the environment, and health impacts easier. The simple and easy-to-use program, as displayed in Figure 6f, impressed us. It is crucial to remember that the tool only considers how solvents affect the environment; it ignores other GAC components like energy, equipment, and sample processing conditions. The program determines a score of 10.729 based on the data, as seen in Figure S3b, suggesting that the approach under investigation is environmentally friendly [43].
3.3 Lean Six Sigma technique
One tool that can be incredibly valuable is the Cpk measure. This statistical term helps organizations minimize inefficiencies caused by low-quality processes. Cpk evaluates process fluctuations by comparing them to their desired center limits. When the Cpk score is higher, we can rely on the results and performance of the process, but if the score is lower, improvement is needed. A process capability six-pack report was produced using the Minitab computer by analyzing the data collected from a pharmaceutical product analysis batch using the recommended method for the assay test. When the X bar chart and the R chart consistently fall within the regulated limits, we can be assured that inspection procedures are of the highest quality. Analyzing the most recent 20 subgroups, it was observed that the data distribution was homogeneous and random. This technique was demonstrated to deliver the desired results using statistical tools such as capability charts, mean probabilities, and histograms. Figure 4a–c shows that the suggested methods have successfully achieved the 1.33 cutoff limit for the drug Cpk values. According to the data, the proposed technique showed Cpk values of 3.0, 2.75, and 3.34 for SAL, GUA, and SOB, respectively. Additionally, the proposed strategy displays lower variance, standard error, and deviation values, further validating the findings in Table S1. These outcomes imply the proposed approach may enhance the precision and accuracy of future research.
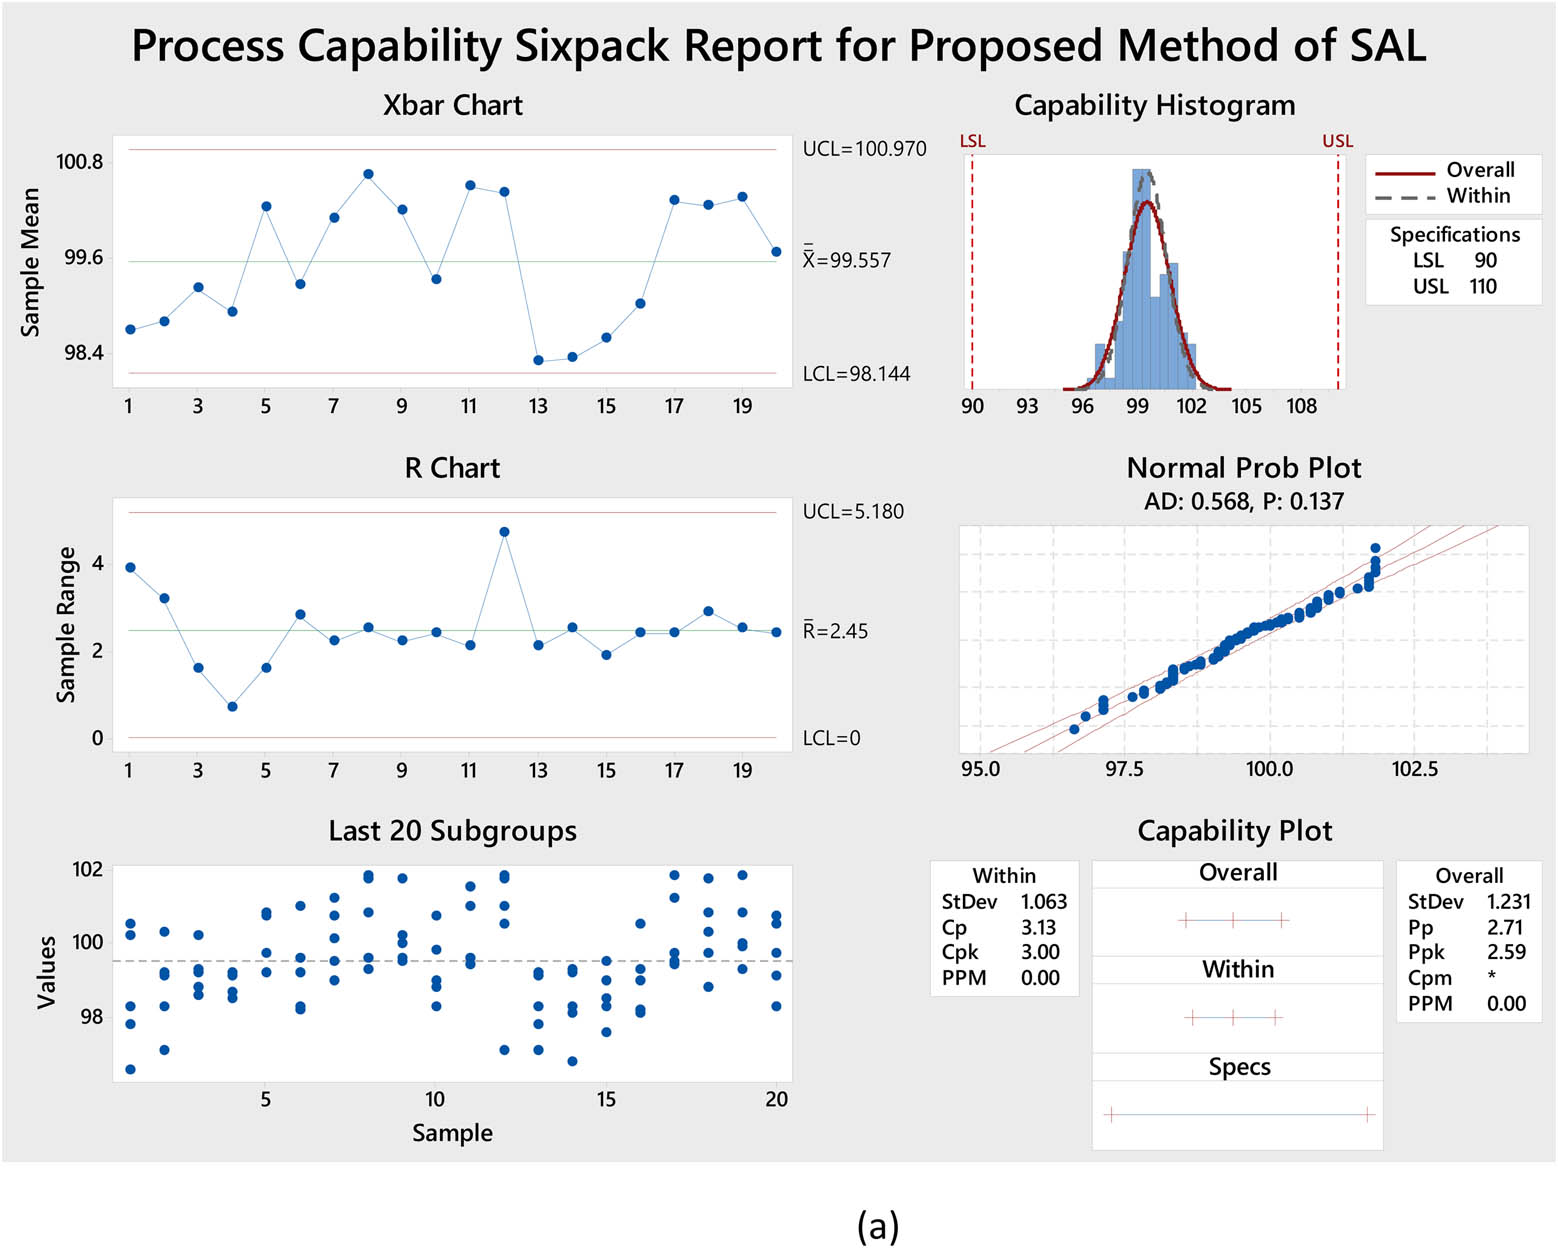
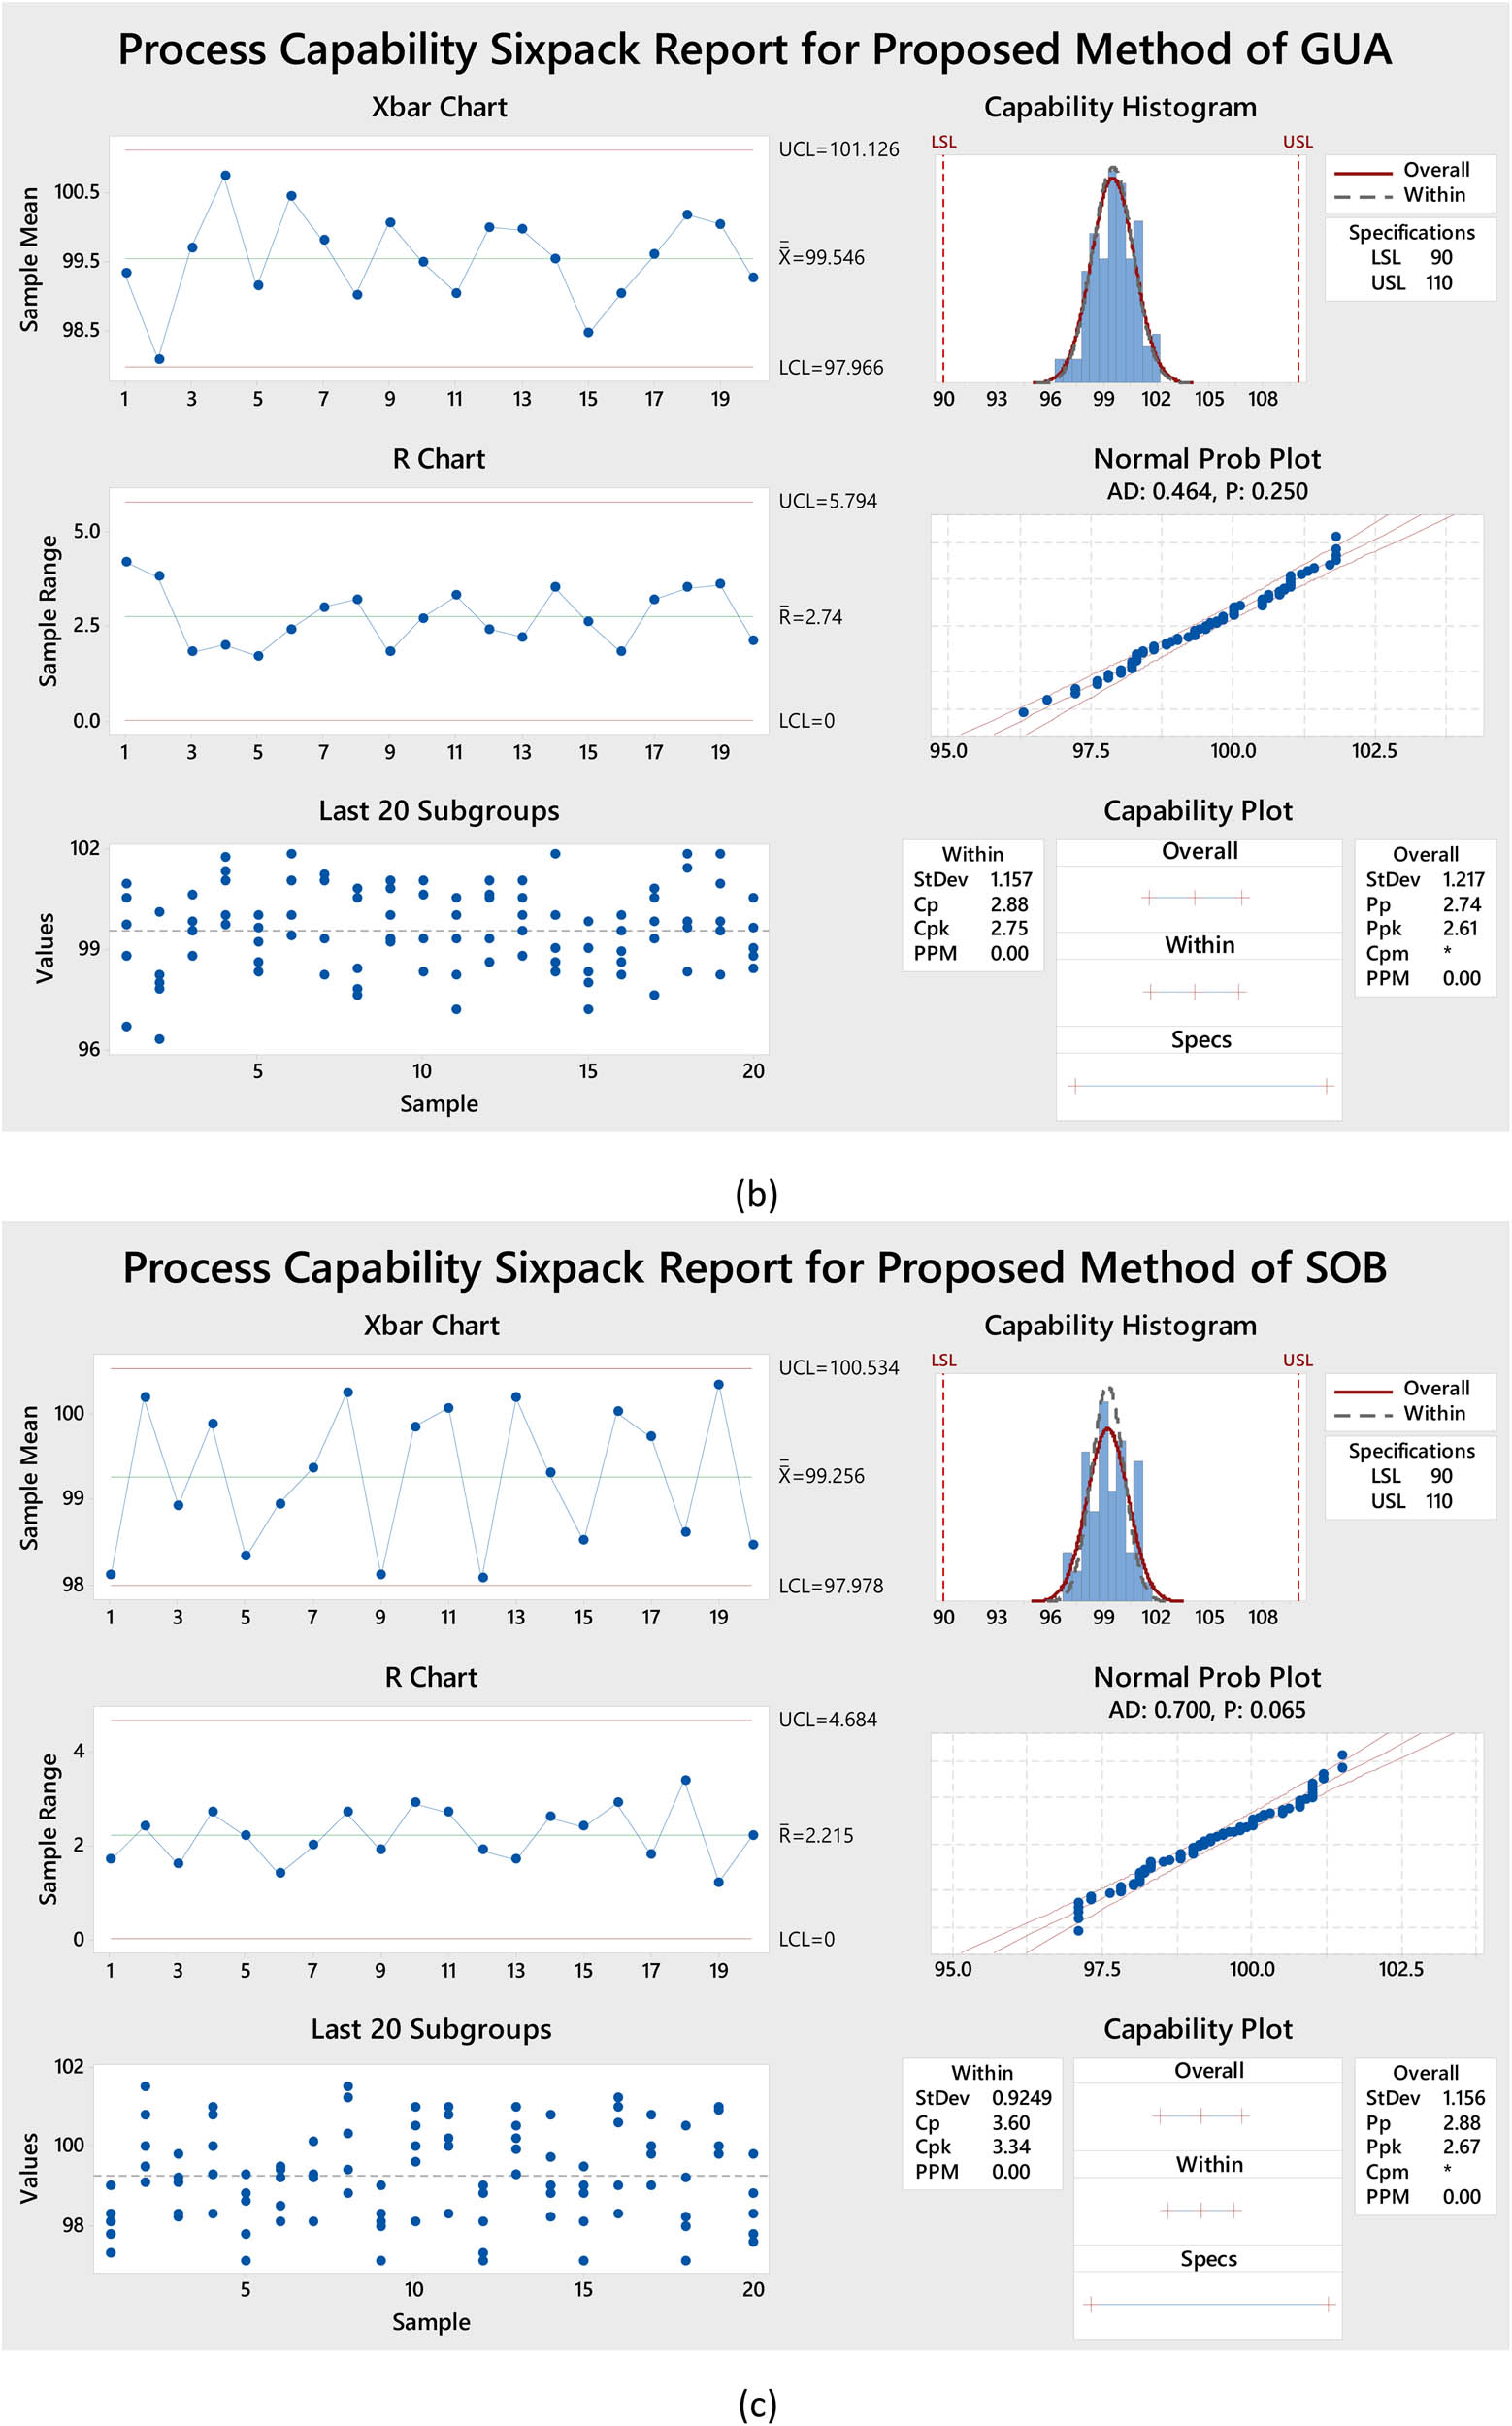
Process capability six-packs for the proposed method of (a) SAL, (b) GUA, and (c) SOB using Minitab18.
3.4 Method validation
The International Council for Harmonisation standards were used to evaluate the suggested procedures. The information demonstrates the validity and value of these techniques for analysts [44].
3.4.1 Linearity and range
We assessed the linearity of the calibration curves in the 2–50 µg·mL−1 range. We employed a sequence of dilutions, beginning with a standard stock solution of 1,000 µg·mL−1 to achieve this and ending with various concentrations between 2 and 50 µg·mL−1. As shown in Figure S4, the coefficient of correlation (r) for these curves was 0.9999 for SAL and GUA, while it was 0.9998 for SOB, indicating a high level of accuracy, as listed in Table 4.
Regression and validation parameters for SAL, GUA, and SOB
| Parameter | HPLC | ||
|---|---|---|---|
| SAL | GUA | SOB | |
| Wavelength (nm) | 276 | 276 | 276 |
| Range (µg·mL−1) | 2–50 | 2–50 | 2–50 |
| Slope | 12.748 | 22.287 | 13.814 |
| Intercept | –2.3759 | –2.4905 | –1.8882 |
| Correlation coefficient | 0.9999 | 0.9999 | 0.9998 |
| Regression equation | y = 12.748x – 2.3759 | y = 22.287x – 2.4905 | y = 13.814x – 1.8882 |
| LODa (µg·mL−1) | 0.49 | 0.44 | 0.38 |
| LOQa (µg·mL−1) | 1.49 | 1.34 | 1.17 |
| Accuracy and recovery | 100.15 | 100.47 | 100.92 |
| Repeatability | 0.11 | 0.15 | 0.17 |
aLOD = (3.3 × σ/slope); LOQ = 10 × σ/slope.
3.4.2 Limit of detection (LOD) and limit of quantification (LOQ)
By utilizing approved Excel spreadsheets and algorithms, specifically incorporating 3.3 σ/S and 10 σ/S, we calculated the LOD and LOQ values with accuracy. The y-intercept standard deviation and slope of the calibration curve can only be ascertained with these numbers. The results of our analysis, shown in Table 4, clearly show that the sensitivity of the suggested approaches and the associated LOD and LOQ values are inversely correlated.
3.4.3 Precision
To examine the repeatability and intermediate precision of the proposed approach, we derived six criteria from our investigations and conducted extensive evaluations on days 1 and 2. We used RSD = (SD × 100)/mean to calculate the relative standard deviation%, and we were pleased to discover that RSD was less than 2%, indicating exceptional precision. Table 4 demonstrates that the suggested method was highly accurate.
3.4.4 Accuracy and recovery
According to Table 5, the SAL, GUA, and SOB concentration levels were evaluated by adding different amounts of these substances to a placebo. The various amounts ranged from 2 to 50 µg·mL−1 and encompassed an interval of 50–150% of the theoretical value. Three samples for each concentration level totalingnine samples were prepared. After measuring each sample three times, the recovery % representations were computed.
Results of SAL, GUA, and SOB accuracy in commercial oral syrups
| Test (%) | Standard addition (mL) to 200 mL flask | Calculated amount (µg·mL−1) | Amount found (µg·mL−1) | Recovery (%) | ||||||
|---|---|---|---|---|---|---|---|---|---|---|
| Oral cough syrups | ||||||||||
| SAL | GUA | SOB | SAL | GUA | SOB | SAL | GUA | SOB | ||
| 50 | 5 | 9.99 | 247.59 | 25.15 | 10.02 | 249.89 | 25.42 | 100.33 | 100.93 | 101.08 |
| 100 | 10 | 19.98 | 495.19 | 50.31 | 19.99 | 496.15 | 50.77 | 100.05 | 100.30 | 100.94 |
| 150 | 15 | 29.96 | 742.78 | 75.46 | 29.98 | 729.24 | 76.01 | 100.06 | 100.19 | 100.73 |
| Minimum | 100.05 | 100.19 | 100.73 | |||||||
| Maximum | 100.33 | 100.93 | 101.08 | |||||||
| Average | 100.15 | 100.47 | 100.92 | |||||||
| SD | 0.14 | 0.40 | 0.18 | |||||||
| RSD% | 0.139 | 0.397 | 0.174 | |||||||
3.4.5 Robustness
The study was conducted by varying the wavelength (276 nm ± 2 nm), the flow rate (1.5 mL·min−1 ± 0.1 mL·min−1), and the mobile phase composition proportion (acetonitrile ± 1%) to demonstrate the resilience of the suggested technique even when there were minor deviations from the ideal chromatographic conditions (refer to Table S2).
3.4.6 System suitability
To confirm the suitability of the system, certain important factors must meet the specification limits set by the European Pharmacopeia. These factors include a resolution of at least 2.0 between three consequential peaks, a minimum of 2,000 theoretical plates to demonstrate the efficiency of the column used and a tailing or asymmetry factor of no more than (T ≥ 2). See Table S3 for further details.
3.4.7 Assay of pharmaceutical formulation
After conducting the HPLC method on Octovent Plus syrup with three duplicate samples, we reported that the medications, SAL, GUA, and SOB, met the requirements. Table 6 clearly shows the positive outcomes we obtained from the assay test, and we are confident that these results will go a long way in ensuring the safety and efficacy of these medications.
Results of assay test for SAL, GUA, and SOB in commercial oral cough syrups
| Test | SAL | GUA | SOB |
|---|---|---|---|
| Test 1 | 100.2 | 100.3 | 101.21 |
| Test 2 | 100.12 | 100.1 | 100.89 |
| Test 3 | 100.08 | 99.96 | 100.75 |
| Test 4 | 100.02 | 100.1 | 101.14 |
| Test 5 | 100.14 | 99.86 | 100.74 |
| Test 6 | 100.05 | 100.1 | 100.69 |
| Average | 100.10 | 100.07 | 100.90 |
| SD | 0.065 | 0.14 | 0.22 |
| RSD | 0.065 | 0.14 | 0.21 |
| Limit | 90–110% | 90–110% | 80–120% |
Bold values represent key findings or significant differences that are important for interpreting the data.
3.4.8 Specificity
3.4.8.1 Selectivity
This measurement aims to assess the specificity of our devised method in determining SAL, GUA, and SOB while ensuring that solvents and excipients do not interfere with the results. The specificity research was conducted by injecting the blank and placebo into the HPLC method to assess their impact on the conspicuous peaks, as depicted in Figure 5a–c. The placebo was prepared to closely mimic the composition of the syrup without the active constituents. Upon analysis, we observed that there were no overlapping peaks or interactions between the excipients present in the placebo and the peaks of the active constituents. This finding strongly indicates that our method can distinguish the active ingredients from any potential interferences in the matrix. Additionally, the absence of interactions in the chromatograms suggests that the sample preparation procedure effectively isolates the active constituents, minimizing any potential matrix effects. This specificity is critical for ensuring accurate quantification in complex formulations.
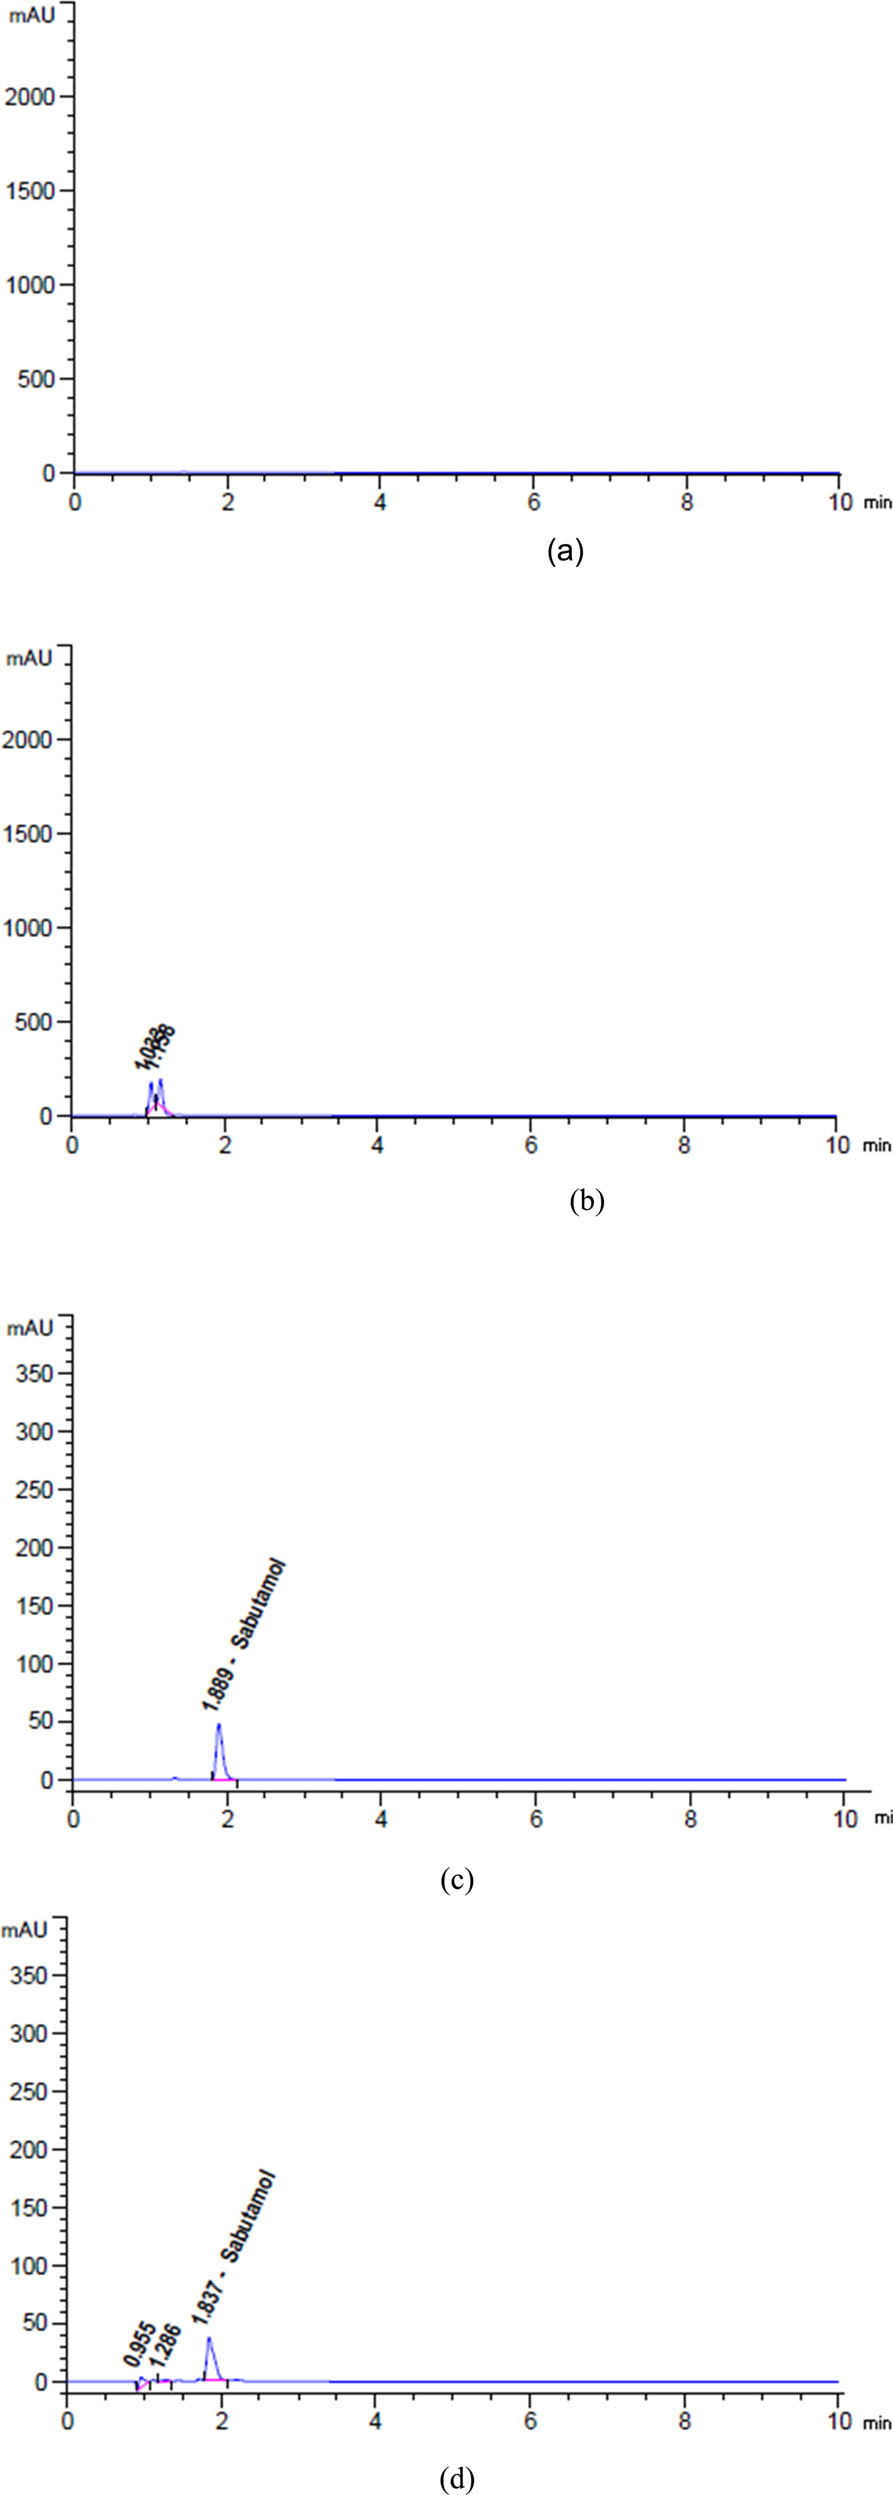
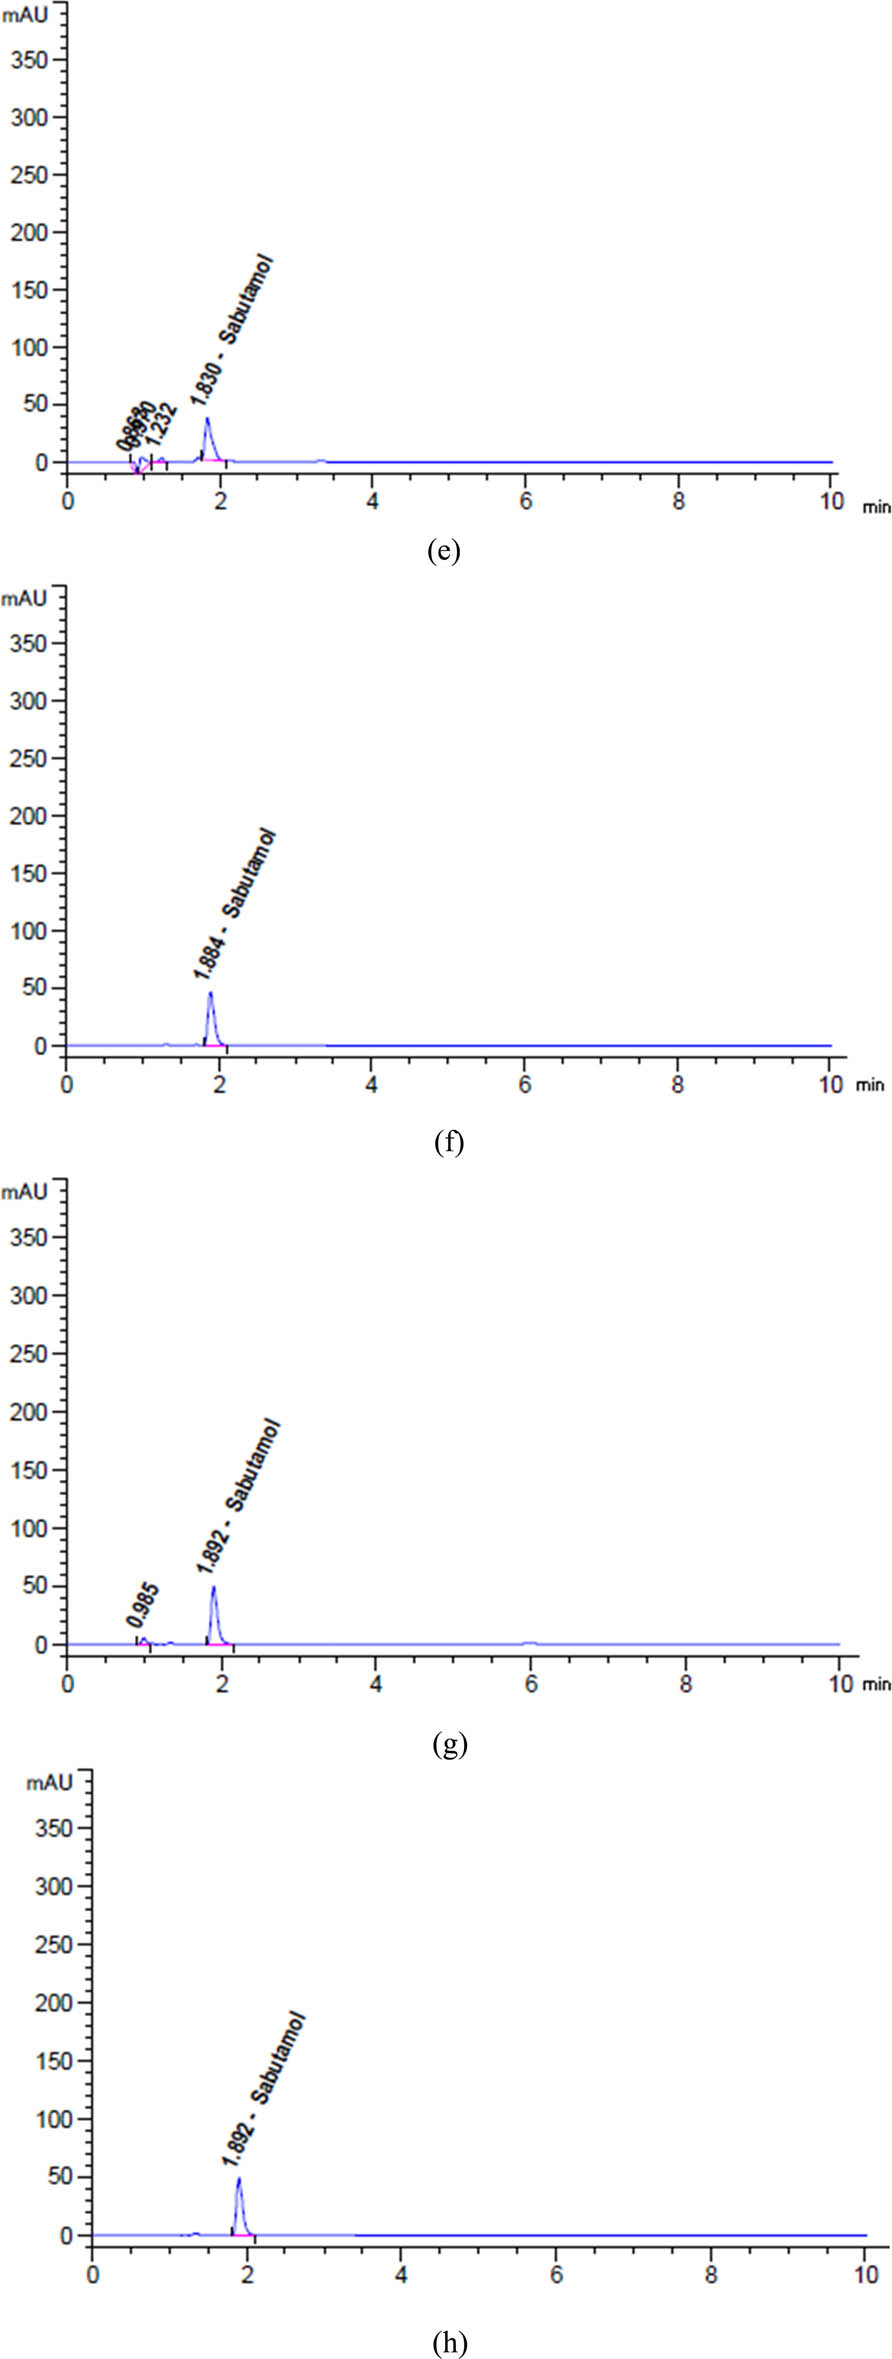
Chromatograms of (a) diluent, (b) placebo, (c) unstressed, and degradation profiles of SAL after exposure to (d) 2 N HCl for 24 h at 25°C, (e) 2 N NaOH for 1 h at 95°C, (f) heat for 17 h at 95°C, (g) 10% H2O2 for 1 h at 95°C, and (h) sunlight for 6 h.
3.4.8.2 Forced degradation
Based on the investigation findings, it was found that the recommended approach is unique to SAL, GUA, and SOB medicines, even when the given stress conditions have produced degraded byproducts. Notably, the proposed approach’s capacity to recognize and quantify SAL, GUA, and SOB medicines was not significantly impacted by acid, base, oxidative degradation, photodegradation, or heat. This indicates that the suggested method is reliable and resilient, as it can effectively examine SAL, GUA, and SOB samples under various stresses. The information in Table S4 is highly valuable, as it can be used to develop detection and quantification methods for SAL, GUA, and SOB medicines applicable in various scenarios.
3.4.8.2.1 Acid hydrolysis
Based on the data presented in Figures 5d, 6a, b, and 7a, b, it can be observed that SAL, GUA, and SOB experienced degradation of roughly 9.27%, 3.89%, and 1.94%, respectively, when subjected to 5 mL of 2 N HCl at a temperature of 25C for 24 h.
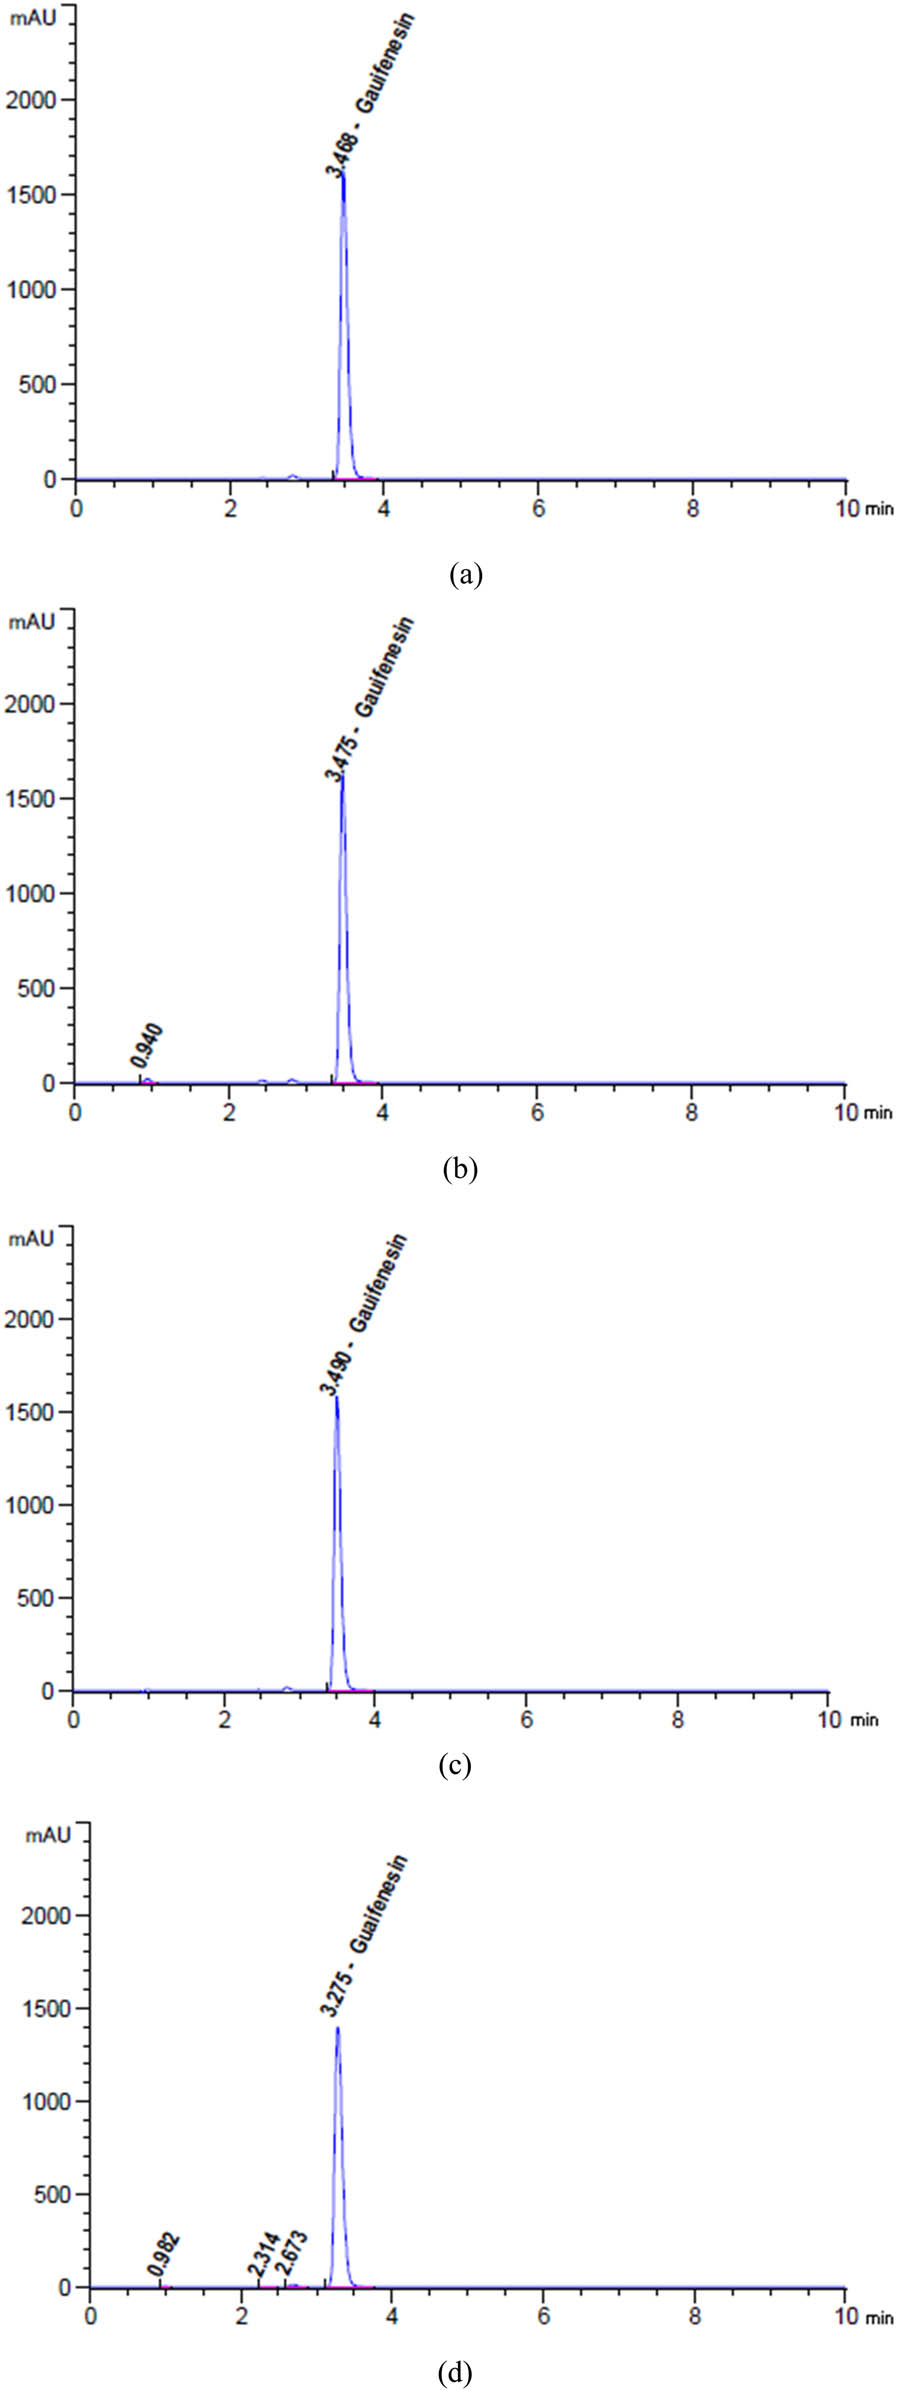
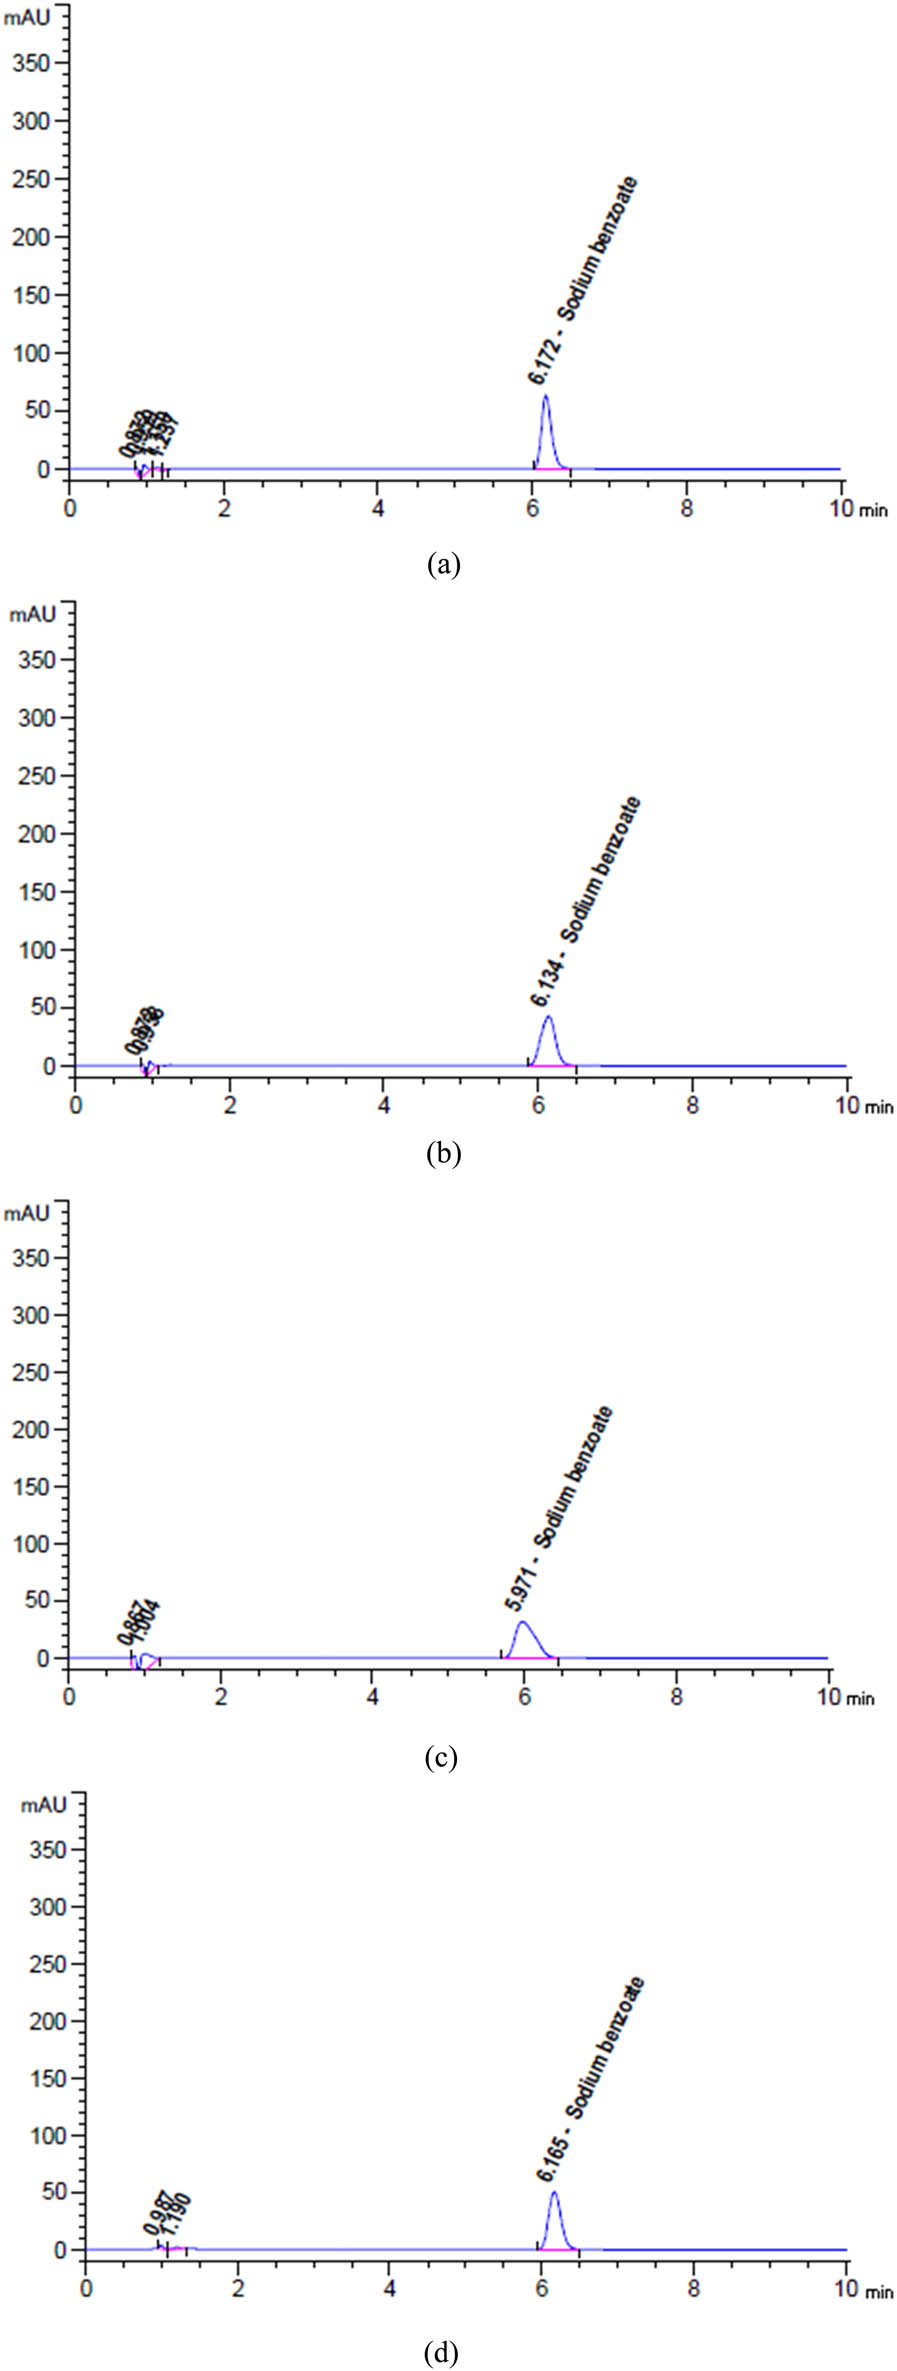
Chromatograms of (a) unstressed and degradation profiles of GUA after exposure to (b) 2 N HCl for 24 h at 25°C, (c) 2 N NaOH for 1 h at 95°C, (d) heat for 17 h at 95°C, (e) 10% H2O2 for 1 h at 95°C, and (f) sunlight for 6 h.
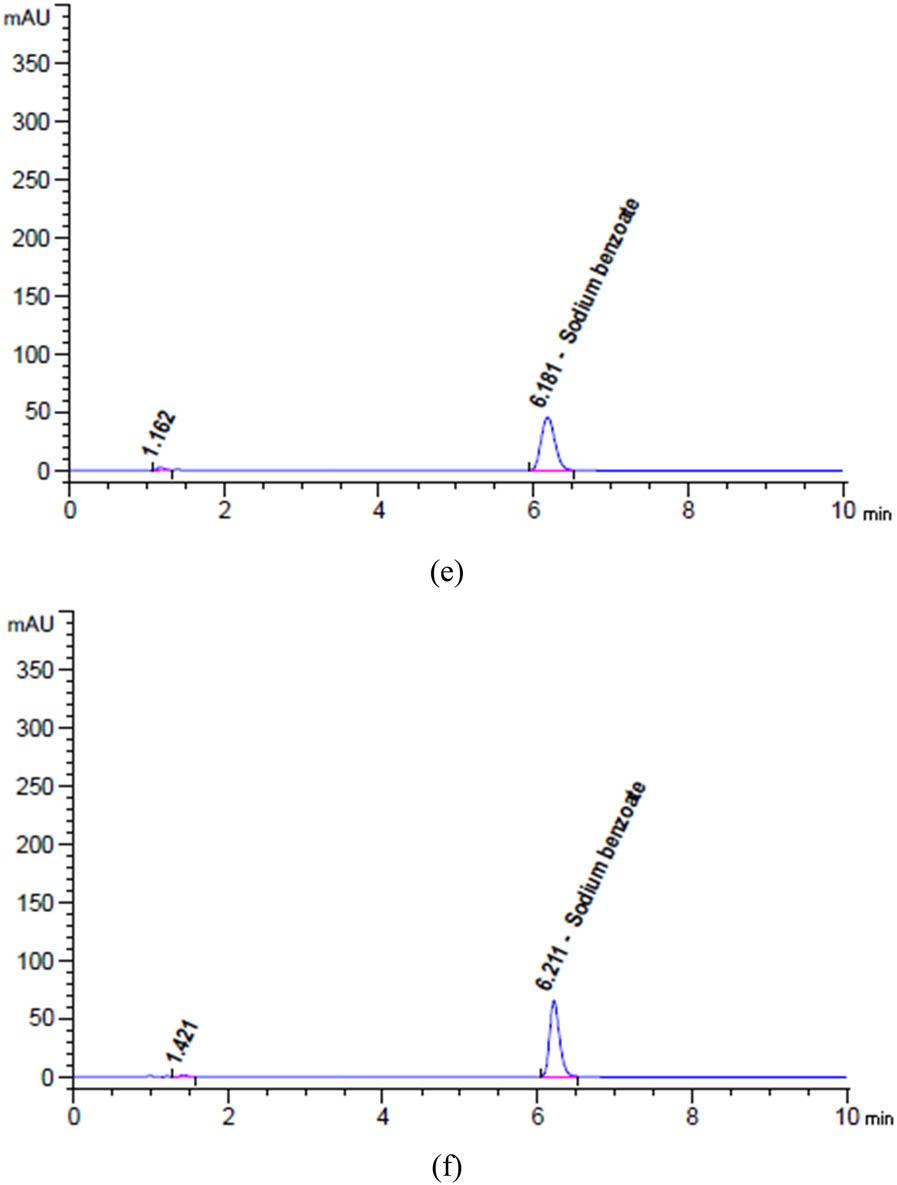
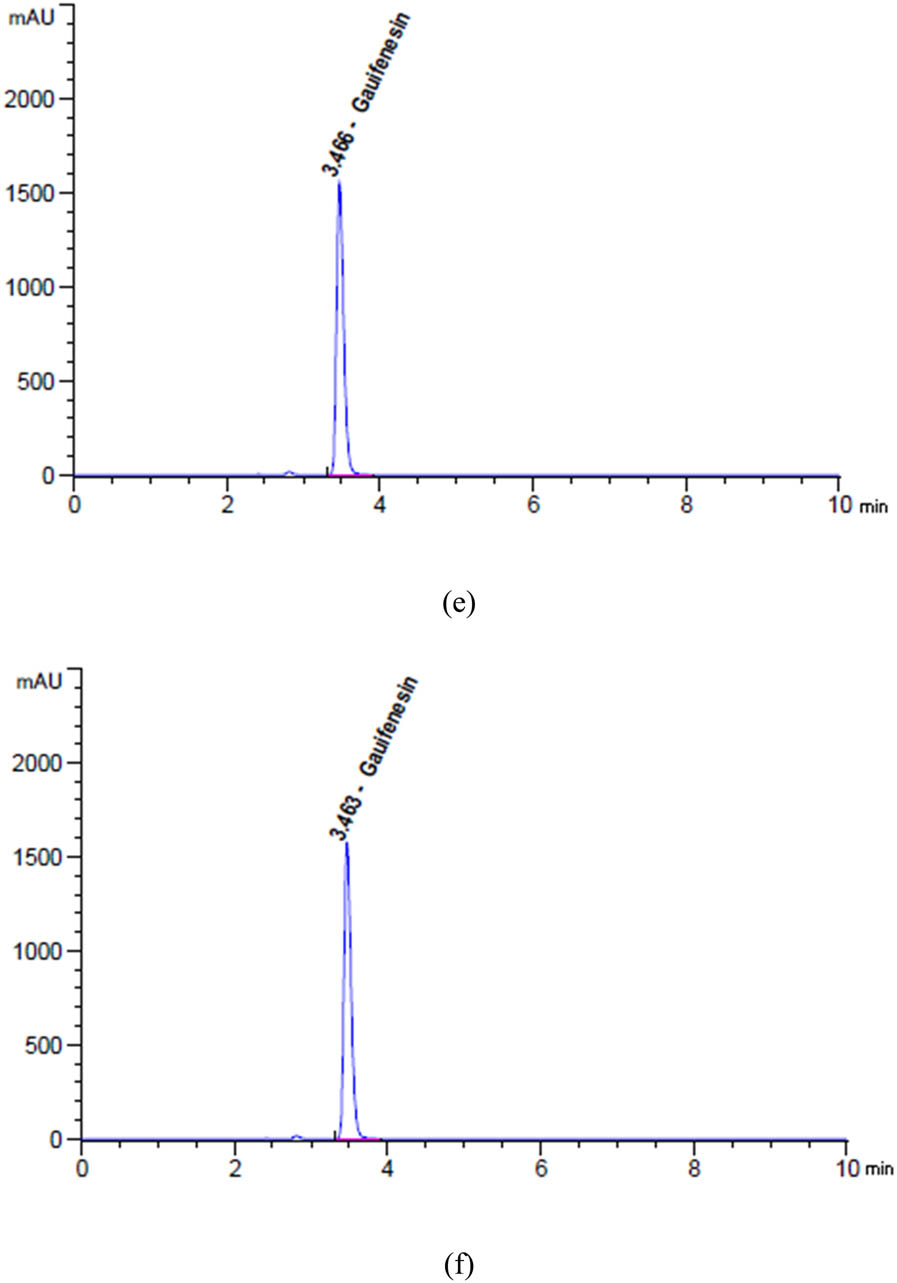
Chromatograms of (a) unstressed and degradation profiles of SOB after exposure to (b) 2 N HCl for 24 h at 25°C, (c) 2 N NaOH for 1 h at 95°C, (d) heat for 17 h at 95°C, (e) 10% H2O2 for 1 h at 95°C, and (f) Sunlight for 6 h.
3.4.8.2.2 Basic hydrolysis
The findings in Figures 5e, 6c and 7c indicate that after being exposed to 5 mL of 2 N NaOH at a temperature of 90C for 1 h, SAL, GUA, and SOB all experienced varying degrees of degradation. Specifically, SAL was degraded by approximately 17.90%, GUA by 6.35%, and SOB by only 0.23%. These results highlight the importance of carefully handling and storing these compounds to maintain their integrity and effectiveness.
3.4.8.2.3 Thermal degradation
Based on the data presented in Figures 5f, 6d and 7d, it is evident that varying degrees of degradation were observed in SAL, GUA, and SOB after being subjected to 17 h of heat stress at 95°C. The data indicated that SOB experienced the most significant drop at approximately 3.81%, followed by SAL at 2.20% and GUA at only 0.69%. These results highlight the importance of monitoring the effects of heat stress on these substances and implementing appropriate measures to mitigate their degradation.
3.4.8.2.4 Oxidative degradation
Based on the data presented in Figures 5g, 6e and 7e, it is evident that SAL, GUA, and SOB displayed varying degrees of degradation when exposed to 5 mL of 10% H2O2 at a temperature of 95C for 1 h. It is noteworthy that SAL exhibited the most significant reduction at approximately 4.84%, followed by GUA at 1.50% and SOB at only 2.76%.
3.4.8.2.5 Photolytic degradation
Based on the given data from Figures 5h, 6f and 7f, it is evident that SAL, GUA, and SOB underwent varying degrees of degradation after being exposed to sunlight for 6 h. GUA experienced the highest decline of about 2.07%, while SAL declined 1.51%, and SOB declined 1.08%. These findings strongly suggest that GUA is more vulnerable to the effects of sunlight exposure than the other two substances.
4 Discussion
Based on the degradation data presented in Table S4, the concerned drugs (SAL and GUA) exhibit the highest stability against photodegradation, with only 1.51% and 2.07% degradation of SAL and GUA, respectively. Heat stress also results in relatively low degradation, with 2.20% and 0.69% degradation for SAL and GUA, respectively. Acid hydrolysis leads to moderate degradation of both SAL and GUA (9.27% and 3.89%, respectively), while basic hydrolysis shows the highest degradation of both components (17.90% and 6.35%, respectively). Therefore, to minimize degradation and ensure the optimal shelf life of Octovent Plus syrup, it is recommended to store the product in a cool, dark environment protected from direct sunlight and excessive heat. Avoiding exposure to strong acids and bases is also crucial. Adhering to these storage conditions will help maintain the integrity and efficacy of the syrup over time.
After conducting a comprehensive analysis of several environmental sustainability methodologies, we evaluated the proposed strategy and drew comparisons with the existing literature methods [27,28,29,30,31,32,33]. The evaluation encompassed the simultaneous estimation of SAL, GUA, and SOB pharmaceuticals individually or in conjunction with additional pharmaceutical agents. A novel methodology has been developed that exhibits superior performance compared to prior approaches within the AGREE and AGREEprep metrics. This approach effectively reduces waste and employs a less dangerous chemical than a dangerous one. Moreover, it can evaluate many analytes within an hour, rendering it a beneficial asset. The AGREE and AGREEprep pictograms listed in Table 1 visually represent the concept. These pictograms have a central score of 0.66 for each metric and depict various green approaches that promote ecological sustainability. Comprehensive research has determined that the proposed HPLC technique within the GAPI tool exhibits more environmental sustainability than prior methodologies. This is because it can reduce dangerous chemicals and generate less waste, displaying five yellow, eight green, and two red colors. Furthermore, this approach methodology obviates the necessity for sample preservation, transportation, specialized storage conditions, or supplementary treatment. The data analysis in Table 1 supports the efficacy of this method. The suggested strategy surpasses the ones outlined in the ComplexGAPI tool due to its utilization of a straightforward process with potency above 98% and less dangerous chemicals. The strategies encompassed many subjects, as illustrated in Table 1. The ComplexGAPI metric provides a distinctive and all-encompassing tool for assessing approaches that employ genetic algorithm properties. Moreover, the investigation has demonstrated that the suggested techniques yield outcomes like the documented HPLC approach. No significant differentiation was observed between the two groups of results, suggesting that the approaches exhibit high reliability and accuracy. According to the data analysis, the approach suggested by the AMVI metric outperforms the recent methodologies in several ways. Despite the higher solvent consumption in HPLC, our method successfully assessed three analytes and their contaminants within 10 min of run time. Despite the improved solvent consumption scores observed in the reported methods for HPLC [32,33], there remains room for improvement in the AMVI score. This is primarily due to the increased solvent consumption required for sample preparation and the limited quantification of analytes. In summary, the AMVI tool provides a more effective and pragmatic method for this procedure. Nevertheless, the procedure proposed in Table 1 has a lower AMVI score of 177, suggesting it is more environmentally friendly than the previously published methods. Based on the published techniques [27,28,29,30,32], the ESA score varied between 67 and 77 due to employing more hazardous chemicals and producing more waste. Nevertheless, the above method [31,33] was comprehensively met, yielding ratings of 79 and 81 in the study. In addition, the system attained an Environmental Sustainability Assessment (ESA) score of 81, signifying a notable degree of environmental sustainability.
The new approach performed better than the previous one. The most effective and efficient way to adhere to sustainable and eco-friendly chemistry principles is through our state-of-the-art HPLC technique. It performs better in terms of accuracy and reliability than previous methods. This technology is the most eco-friendly and efficient technique for handling chemical processes. Following a comprehensive evaluation of sustainability approaches, the proposed strategy was then contrasted with those that were already in the literature. Table S5 lists all the HPLC methods, including the suggested one. Comparing the established method to alternative approaches will yield useful information.
4.1 Study limitation and future prospect
While this study presents significant advancements in developing an eco-friendly HPLC method, several limitations should be acknowledged. The focus was primarily on quantifying SAL, GUA, and SOB, with other potentially relevant compounds in cough syrups not analyzed. The method’s applicability may vary with different formulations or matrix effects, impacting sensitivity and accuracy. Although the environmental impact assessment utilized selected evaluation tools, further analysis with additional metrics could provide a more comprehensive understanding of sustainability. Additionally, while the method demonstrates excellent precision and recovery, the long-term stability of its analytical performance over extended periods remains to be fully validated. Future research could address these limitations by expanding the method to include a broader range of active ingredients and excipients, exploring its applicability to various sample matrices, and integrating real-time monitoring and advanced data analytics to enhance efficiency. Optimizing the method for reduced analysis times and resource consumption will further contribute to sustainability goals in the pharmaceutical industry and beyond.
5 Conclusion
Our study evaluated different chromatographic methods using several greenness assessment tools. For a sustainable approach, we used HPLC-EAT, AMGS, AMVI, ComplexGAPI, AGREE, AGREEprep, and GAPI. In addition, we used Lean Six Sigma techniques and the Cpk to evaluate our current process. The results indicate that our recommended approach is cost-effective and environmentally friendly. HPLC with a shorter column promotes green chemistry and minimizes laboratory waste. In laboratories that prioritize sustainability and security, utilizing this approach is essential. The test is highly accurate when identifying and measuring specific medications, even when leftover medications are degraded. In this way, both selectivity and sensitivity are maintained since the target peak and its degradation products are unaffected by each other.
Acknowledgments
The authors would like to thank the Deanship of Scientific Research at Shaqra University for supporting this work. The authors are thankful to the Deanship of Graduate Studies and Scientific Research at the University of Bisha for supporting this work through the Fast-Track Research Support Program.
-
Funding information: Authors state no funding involved.
-
Author contributions: Tahani Y. A. Alanazi: software, visualization, data curation, and writing – review & editing (equal); Samar M. Mahgoub: writing – review & editing, methodology, conceptualization, and investigation; Hoda A. Ahmed: investigation (equal), validation, writing – review & editing (equal), and software; Manal A. Almalki: writing – review & editing (equal), resources, conceptualization (equal), and data curation (equal); Bandar R. Alsehli: visualization, resources, writing – review & editing, and investigation; Mustafa Ahmed Abdel-Reheim: conceptualization (equal), software(equal), writing – review & editing (equal), and data curation (equal); Osama A. Mohammed: investigation, writing – review & editing (equal), resources, and data curation (equal); Mahmoud A. Mohamed: formal analysis, writing – original draft, software(equal), investigation (equal), and project administration.
-
Conflict of interest: Authors state no conflict of interest.
-
Data availability statement: The datasets generated during and/or analyzed during the current study are available from the corresponding author on reasonable request.
References
[1] Ahmed HA, El-Atawy MA, Nassef HM, Amin MS, Jaremko M, Emwas AH, et al. Eco-friendly chromatographic techniques for appraisal of Amlodipine, Hydrochlorothiazide, Telmisartan, and their related substances in dosage form: Application to six sigma and content uniformity approaches. Sustain Chem Pharm. 2024;38:101469. 10.1016/j.scp.2024.101469.Search in Google Scholar
[2] Smith J, Woodcock A. Cough and its importance in COPD. Int J Chron Obstruct Pulmon Dis. 2006;1:305–14. 10.2147/copd.2006.1.3.305.Search in Google Scholar PubMed PubMed Central
[3] Linthorst JA. An overview: origins and development of green chemistry. Found Chem. 2010;12:55–68. 10.1007/s10698-009-9079-4.Search in Google Scholar
[4] Anastas P, Eghbali N. Green chemistry: principles and practice. Chem Soc Rev. 2010;39:301–12. 10.1039/B918763B.Search in Google Scholar PubMed
[5] Mahgoub SM, Mahmoud MR, Binsaleh AY, Almalki MA, Mohamed MA, Nassar HF. Analytical assessment of a novel RP-HPLC method for the concurrent quantification of selected pharmaceutical drugs levodopa and carbidopa using eight greenness metrics comparing to the lean six sigma approach. Sustain Chem Pharm. 2023;36:101291. 10.1016/j.scp.2023.101291.Search in Google Scholar
[6] Nassef HM, Ahmed HA, El-Atawy MA, Alanazi TYA, Mohamed MA. Greens assessment of RP-UPLC method for estimating Triamcinolone Acetonide and its degraded products compared to Box-Behnken and Six Sigma designs. Green Chem Lett Rev. 2024;17(1):2301315. 10.1080/17518253.2023.2301315.Search in Google Scholar
[7] Shehata N, Rawan AF, Ahmed HA, Alhaddad OA, Amin MS, Nafee SS, et al. Adsorption separation of oxytetracycline hydrochloride using natural and nanostructured clay mineral of silica in synthetic solution: Integration to white and green chemistry metrics. Sustain Chem Pharm. 2024;39:101574. 10.1016/j.scp.2024.101574.Search in Google Scholar
[8] Gamal M, Naguib IA, Panda DS, Abdallah FF. Comparative study of four greenness assessment tools for selection of greenest analytical method for assay of hyoscine N-butyl bromide. Anal Methods. 2021;13(3):369–80. 10.1039/D0AY02169E.Search in Google Scholar
[9] Sajid M, Płotka-Wasylka J. Green analytical chemistry metrics: A review. Talanta. 2022;238:123046. 10.1016/j.talanta.2021.123046.Search in Google Scholar PubMed
[10] Imam MS, Abdelrahman MM. How environmentally friendly is the analytical process? A paradigm overview of ten greenness assessment metric approaches for analytical methods. Trends Environ Anal Chem. 2023;38:e00202. 10.1016/j.teac.2023.e00202.Search in Google Scholar
[11] Alanazi TYA, Almalki MA, Mohamed MA, Nassar HF. Five greenness assessments of novel RP-UPLC and MCR methods for concurrent determination of selected pharmaceutical drugs in comparison with the lean Six Sigma approach. Microchem J. 2023;194:109359.10.1016/j.microc.2023.109359Search in Google Scholar
[12] Lubamba B, Jensen T, McClelland R. Rapid detection of direct compound toxicity and trailing detection of indirect cell metabolite toxicity in a 96-well fluidic culture device for cell-based screening environments: tactics in six sigma quality control charts. Appl Sci. 2022;12(6):2786. 10.3390/app12062786.Search in Google Scholar PubMed PubMed Central
[13] Mohamed MA. Simultaneous quantification of cephalexin and sodium benzoate in their dosage forms by high analytical technique. Application of lean six sigma and in-vitro dissolution. Ann Pharm Fr. 2021;79(2):152–69. 10.1016/j.pharma.2020.09.006.Search in Google Scholar PubMed
[14] El-Attar AA, Mohamed AA, Hasan MA, Abdel-Raoof AML. C-tandem mass spectrometry for quantifying three drugs simultaneously utilized for treating Chlamydia Trachomatis infection in Rabbit’s aqueous humor: Experimental central composite aided design augmented Lean Six Sigma. Microchem J. 2021;169:106571. 10.1016/j.microc.2021.106571.Search in Google Scholar
[15] Kumbhar P, Waghmare P, Nadaf S, Manjappa A, Shah R, Disouza J. QbD and Six Sigma quality approach for chromatographic estimation of repurposed simvastatin from nanostructured lipid carriers. Microchem J. 2023;185:108310. 10.1016/j.microc.2022.108310.Search in Google Scholar
[16] Byrne B, McDermott O, Noonan J. Applying lean six sigma methodology to a pharmaceutical manufacturing facility: A case study. Processes. 2021;9(3):550. 10.3390/pr9030550.Search in Google Scholar
[17] Hassouna MEM, Mohamed MA. Modeling and optimization of a novel RP-UPLC and MCR spectrophotometric methods for simultaneous determination of five cephalosporins in spiked human plasma: Application to lean six sigma thinking hats and antimicrobial activity. Microchem J. 2019;150:104161. 10.1016/j.microc.2019.104161.Search in Google Scholar
[18] Mahmoud OA, Omran AA, Binsaleh AY, Almalki MA, Mohamed MA. Chromatographic techniques for assessment of bisoprolol fumarate and perindopril arginine in solid formulations under various stress conditions and application to Six Sigma, content uniformity, and comparative dissolution approaches. J AOAC Int. 2023;106(5):1165–79. 10.1093/jaoacint/qsad077.Search in Google Scholar PubMed
[19] Cai Z, Lin Y, Liang J. Efficacy of salbutamol in the treatment of infants with bronchiolitis: A meta-analysis of 13 studies. Medicine. 2020;99(4):e18657. 10.1097/MD.0000000000018657.Search in Google Scholar PubMed PubMed Central
[20] Albrecht HH, Dicpinigaitis PV, Guenin EP. Role of guaifenesin in the management of chronic bronchitis and upper respiratory tract infections. Multidiscip Respir Med. 2017;12:1–11. 10.1186/s40248-017-0113-4.Search in Google Scholar PubMed PubMed Central
[21] Farid NF, El Ragehy NA, Hegazy MA, Abdelkawy M, Metwally FH. Simultaneous determination of a quaternary mixture of oxomemazine, sodium benzoate, guaifenesin and paracetamol by chromatographic methods. Beni-Suef Univ J Basic Appl Sci. 2014;3(4):260–8. 10.1016/j.bjbas.2014.11.006.Search in Google Scholar
[22] Ali MS, Karim AE, Mohye MZ, Al-metwali AM, Ibrahim SN. Simultaneous determination of Guaifenesin, codeine phosphate, phenylephrine hydrochloride, and sodium benzoate in syrup pharmaceutical form by RP-HPLC. Al-Kitab J Pure Sci. 2023;7(2):173–83.10.32441/kjps.07.02.p13Search in Google Scholar
[23] Mohamed MA, Hassouna MEM. Ecofriendly spectrophotometric and chromatographic methods for simultaneous analysis of a quaternary mixture of cephalexin, sodium benzoate, methylparaben and propylparaben with application of the holding time study in bulk and pharmaceutical dosage forms. Pharm Chem J. 2023;57(1):146–59. 10.1007/s11094-023-02862-9.Search in Google Scholar
[24] Sharaf MH, Stiff DD. Determination of guaifenesin in human serum by capillary gas chromatography and electron capture detection. J Pharm Biomed Anal. 2004;35(4):801–6. 10.1016/j.jpba.2004.01.028.Search in Google Scholar PubMed
[25] Patel NC, Patel DB, Chaudhari PK. Spectrophotometric estimation of ambroxol hydrochloride, guaifenesin and levosalbutamol sulphatein syrup. Asian J Res Chem. 2013;6(4):407–14. 10.5958/0974-4150.Search in Google Scholar
[26] Raval K, Srinivasa U. Development and validation of dual wavelength spectrophotometric methods for simultaneous estimation of ketotifen and salbutamolin in bulk and pharmaceutical dosage form. Scholars Acad J Pharma. 2015;4(1):16–23.Search in Google Scholar
[27] Sagathiya K, Bagada H. Development and validation of RP-HPLC and HPTLC method of analysis for simultaneous estimation of ambroxol HCL, dextromethorphan HBR and guaifenesin in pharmaceutical cough cold preparation and statistical comparison of developed methods. Int J Pharm Pharm Sci. 2014;6:312–6.Search in Google Scholar
[28] Sravanthi K, Bhauvaneswara RC, Priyanka MV, Anusha M, Kalyani T. Simultaneous estimation of guaifenesin, levocetirizine hydrochloride and ambroxol hydrochloride in syrup dosage form by RP-HPLC. Int J Pharm Res Sch. 2016;5:231–58.Search in Google Scholar
[29] Nidhi D, Sandeep S, Singh GN. Development of HPLC method for simultaneous estimation of ambroxol, guaifenesin and salbutamol in single dosage form. Indian J Chem. 2012;15:1633–6.Search in Google Scholar
[30] Njaria PM, Abuga KO, Kamau FN, Chepkwony HK. A versatile HPLC method for the simultaneous determination of bromhexine, guaifenesin, ambroxol, salbutamol/terbutaline, pseudoephedrine, triprolidine, and chlorpheniramine maleate in cough–cold syrups. Chromatographia. 2016;79:1507–14. 10.1007/s10337-016-3158-1.Search in Google Scholar
[31] Rao KLN, Krishnaiah C, Babu KS, Reddy KP. Development and validation of a stability-indicating LC method for simultaneous determination of related compounds of guaifenesin, terbutaline sulfate and ambroxol HCl in cough syrup formulation. J Saudi Chem Soc. 2014;18(5):593–600. 10.1016/j.jscs.2012.01.006.Search in Google Scholar
[32] Sharkawi MMZ, Safwat MT, Abdelaleem EA, Abdelwahab NS. Chromatographic analysis of triple cough therapy; bromhexine, guaiafenesin and salbutamol and pharmaceutical impurity: in-silico toxicity profile of drug impurity. BMC Chem. 2024;18(1):19. 10.1186/s13065-024-01122-5.Search in Google Scholar PubMed PubMed Central
[33] Naguib IA, Farag SA, Zaazaa HE, Abdelaleem EA. High-performance liquid chromatography method for simultaneous determination of guaifenesin, salbutamol sulfate and guaifenesin impurity (Guaiacol). J Chromatogr Sci. 2021;59(5):419–24. 10.1093/chromsci/bmaa128.Search in Google Scholar PubMed
[34] Rao SS, Rachana G, Sahoo S. Analytical method development for inhalation formulation by using RP-HPLC. Int J Res Publ Rev. 2024;5:2153–8.Search in Google Scholar
[35] Alanazi TYA, Adel Pashameah R, Binsaleh AY, Mohamed MA, Ahmed HA, Nassar HF. Condition optimization of eco-friendly RP-HPLC and MCR methods via Box–Behnken design and six sigma approach for detecting antibiotic residues. Sci Rep. 2023;13:15729. 10.1038/s41598-023-40010-1.Search in Google Scholar PubMed PubMed Central
[36] Hartman R, Helmy R, Al-Sayah M, Welch CJ. Analytical Method Volume Intensity (AMVI): A green chemistry metric for HPLC methodology in the pharmaceutical industry. Green Chem. 2011;13(4):934–9. 10.1039/C0GC00524J.Search in Google Scholar
[37] Gałuszka A, Migaszewski ZM, Konieczka P, Namieśnik J. Analytical Eco-scale for assessing the greenness of analytical procedures. TrAC Trends Anal Chem. 2012;37:61–72. 10.1016/j.trac.2012.03.013.Search in Google Scholar
[38] Kowtharapu LP, Katari NK, Sandoval CA, Rekulapally VK, Jonnalagadda SB. Green chromatographic method for determination of active pharmaceutical ingredient, preservative, and antioxidant in an injectable formulation: Robustness by design expert. ACS Omega. 2022;7(38):34098–108. 10.1021/acsomega.2c03387.Search in Google Scholar PubMed PubMed Central
[39] Wojnowski W, Tobiszewski M, Pena-Pereira F, Psillakis E. AGREEprep–Analytical greenness metric for sample preparation. TrAC Trends Anal Chem. 2022;149:116553. 10.1016/j.trac.2022.116553.Search in Google Scholar
[40] Płotka‐Wasylka J. A new tool for the evaluation of the analytical procedure: Green Analytical Procedure Index. Talanta. 2018;181:204–9. 10.1016/j.talanta.2018.01.013.Search in Google Scholar PubMed
[41] Płotka‐Wasylka J, Wojnowski W. Complementary green analytical procedure index (ComplexGAPI) and software. Green Chem. 2021;23(21):8657–65. 10.1039/D1GC02318G.Search in Google Scholar
[42] Gundecha S, Patel M, Mayur YC. An application of quality by design and analytical greenness assessment approach for the development of erlotinib stability indicating method. Chromatographia. 2022;85(7):575–88. 10.1007/s10337-022-04167-7.Search in Google Scholar
[43] Gaber Y, Törnvall U, Kumar MA, Amin MA, Hatti-Kaul R. HPLC-EAT (Environmental Assessment Tool): a tool for profiling safety, health and environmental impacts of liquid chromatography methods. Green Chem. 2011;13(8):2021–5. 10.1039/C0GC00667J.Search in Google Scholar
[44] ICH Harmonized Tripartite Guideline. Validation of analytical procedures: text and methodology Q2 (R1). Curr Step. 2005;4:1–17.Search in Google Scholar
© 2025 the author(s), published by De Gruyter
This work is licensed under the Creative Commons Attribution 4.0 International License.
Articles in the same Issue
- Research Articles
- Impressive stability-indicating RP-HPLC method for concurrent quantification of salbutamol, guaifenesin, and sodium benzoate in cough syrup: Application of six sigma and green metrics
- Bioanalytically validated potentiometric method for determination of bisphenol A: Application to baby bibs, pacifiers, and Teethers’ saliva samples
- Environmental impact of RP-HPLC strategy for detection of selected antibiotics residues in wastewater: Evaluating of quality tools
- Trace-level impurity quantification in lead-cooled fast reactors using ICP-MS: Methodology and challenges
- Picogram-level detection of three ACE inhibitors via LC–MS/MS: Comparing BMP and UOSA54 derivatization methods
- Eco-friendly RP-HPLC method for concurrent estimation of a promising combination of methocarbamol and etoricoxib in rat plasma
- Development of a point-of-care testing sensor using polypyrrole/TiO2 molecular imprinting technology for cinchocaine determination
- Green and sustainable RP-UPLC and UV strategies for determination of metformin and dapagliflozin: Evaluation of environmental impact and whiteness
- Review Articles
- Determination of montelukast and non-sedating antihistamine combination in pharmaceutical dosage forms: A review
- Extraction approaches for the isolation of some POPs from lipid-based environmental and food matrices: A review
- A review of semiconductor photocatalyst characterization techniques
- Analytical determination techniques for lithium – A review
- Fourier transform infrared spectroscopy study of polymer/filler/ionic liquid composites