A review of semiconductor photocatalyst characterization techniques
-
Chunnan Hao
 ,
Jian Wang
,
Jian Wang

Abstract
Photocatalysis is expected to solve both energy and environmental problems at the same time. Photocatalysis technology has received increasing attention, and systematically understanding the reaction mechanism of the photocatalytic process is very important for better utilization of solar energy. With the aim of establishing property-performance relationships and discovering the reaction mechanisms, several characterization techniques have been adopted to evaluate the properties of semiconductor photocatalysts, such as UV–visible absorption spectroscopy, photoluminescence spectroscopy, Raman spectroscopy, electrochemical impedance spectroscopy, and cyclic voltammetry. In this review, the principles and characteristics of different characterization techniques are demonstrated with concrete examples to give a clear picture and promote the research of photocatalysis in the future.
1 Introduction
In order to cope with the continuous spread of energy shortage and environmental pollution, human beings have to focus on developing and utilizing sustainable energy [1]. Because of its inexhaustible and clean peculiarities, solar energy has been considered the great potential to replace traditional fossil fuels [2,3].
Photocatalysis is one of the most promising research directions in the utilization of solar energy [4,5], and sunlight could be used as the energy source to promote reactions. As a milestone discovery in the 1970s, Fujima and Honda introduced visible light into an electrochemical water-splitting system and revealed that the introduced light can promote the chemical reaction. It is worth mentioning that their work played a pioneering role and provided a powerful foundation for the research of other researchers in the following decades [6,7,8]. Since then, researchers on photocatalysis bloomed, and a lot of photocatalytic reactions such as water splitting, CO2 reduction, decomposition of inorganic/organic pollutants, and synthesis of fine chemicals have been studied deeply [9,10,11].
Nevertheless, photocatalytic systems generally suffer from low light utilization efficiency because the mechanism of photocatalysis is not thoroughly studied. In order to improve the utilization of solar energy, a lot of work has been done to make clear the reaction mechanism [12,13]. As reported, the light absorption properties, structure, composition, charge transfer resistance, and separation efficiency of photogenerated electron–hole pairs could affect the reaction and these factors could be tested via optical properties [14,15,16,17,18,19]. Even though UV–visible (UV–vis) absorption spectroscopy was discovered more than 100 years ago, it was not commonly used due to the complicated operation as well as the lack of understanding of the principle [20]. Until 1995, the Kubelka–Munk equation was found to reflect the light absorption performance of photocatalysts and characterize the optical properties of photocatalysts. The formulation of the Kubelka–Munk equation has set up a strong link to the investigation and in-depth study of the optical properties of semiconductor photocatalysts [21]. After that, researchers can determine the type of semiconductor catalysts and the position of flat band potential by the Mott–Schottky plot [22]. In 2000, the photocurrent technique entered people’s vision, and it is now widely used to test the transfer ability of photogenerated electrons [23]. In Scheme 1, the semiconductor photocatalyst characterization techniques are usually carried out including UV–vis absorption spectroscopy, photoluminescence spectroscopy (PL spectroscopy), Raman spectroscopy, electrochemical impedance spectroscopy (EIS), cyclic voltammetry (CV), and linear sweep voltammetry (LSV).
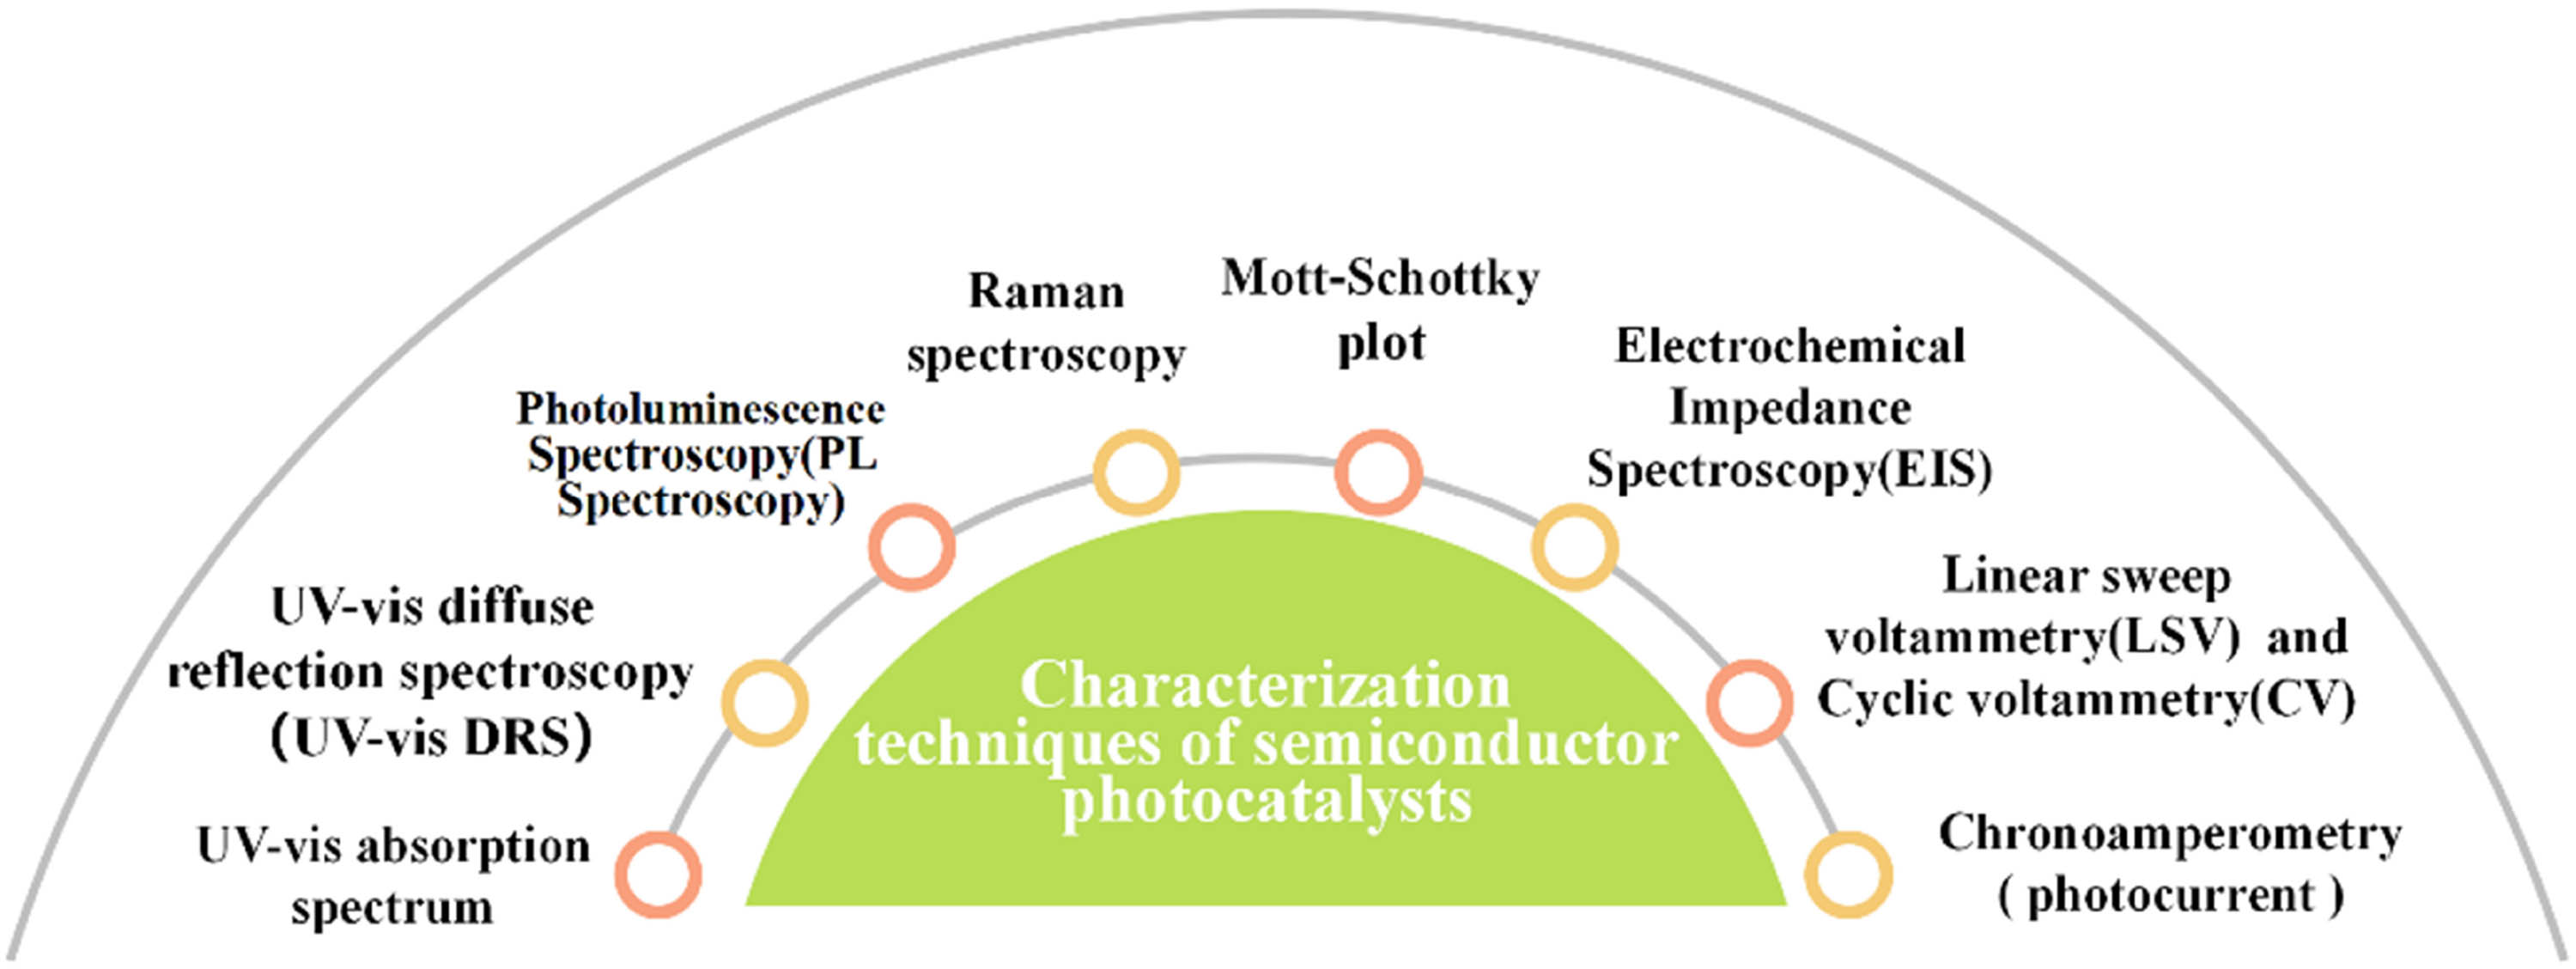
Characterization techniques of semiconductor photocatalysts.
Zhang et al. [24] provide an overview of the current state-of-the-art preparation methods and characterization techniques for diatomic catalysts (DACs). The authors use the characterization techniques to determine the active center, the bond energy, electron transfer number, bond length, and other parameters of the diatoms at different adsorption sites; the most favorable adsorption sites can be determined by comparing them with the experimental data, which provides a theoretical basis for the preparation of new efficient and stable DACs. Besides, Ali et al. [25] summarized the relevant characterization techniques of iridium nanoparticle catalysts, such as transmission electron microscopy, scanning electron microscopy (SEM), X-ray diffraction, Fourier transform infrared spectroscopy, and other characterization techniques, to obtain the properties of the iridium catalysts such as the structures, phases, and functional groups, which can promote further development of the iridium catalysts. Luo et al. [26] focus on a review of advanced characterization techniques for the structure and photocatalytic properties of TiO2-based materials, leading to the design of novel photocatalysts with high solar energy conversion efficiency. Moreover, Janáky et al. [27] summarized the photoinduced interaction at the semiconductor interface and explored the specific surface area, carrier mobility, and charge transfer kinetics of the photocatalyst through some characterization. Zhang et al. [28] focus on evaluating the physical properties and chemical composition of semiconductor catalysts and the band structure through characterization techniques.
Therefore, in this article, the main characterization techniques of semiconductor photocatalysts are reviewed, and the principle and the use are elaborated in detail, which could help newcomers quickly understand the basic principles and functions of these characterization techniques. In addition, for people can understand these characterization techniques more intuitively and systemically, various characterization techniques of semiconductor photocatalysts are supplemented by examples. Importantly, on the basis of summarizing the information obtained by various characterization techniques, the performance–performance relationship and reaction mechanism are revealed, so that researchers can regulate the most suitable reaction conditions and prepare excellent semiconductor photocatalysts. In conclusion, by summarizing the characterization technology and mechanism of photocatalysis, this article will effectively help scientific researchers explore the mechanism of semiconductor catalysts more deeply and also provide useful guidance for the development of photocatalysis technology and semiconductor.
2 Techniques for the characterization of properties of the semiconductor photocatalysts
2.1 UV–vis absorption spectroscopy
It is accepted that UV–vis absorption spectroscopy takes advantage of the electron transition in the photocatalyst under light irradiation [29,30]. Chromophores are the structural systems in which molecules can absorb ultraviolet or visible light. The type of electron transition varies with the structure of the chromophores [31,32]. Therefore, different chromophore structures in the photocatalysts lead to disparate types of electronic transitions [33,34,35]. Meanwhile, each material exhibits a unique and fixed absorption peak at a specific location in the UV–vis absorption spectra [21]. According to the position and intensity of the absorption peak, the structure information of the semiconductor photocatalyst could be inferred [20].
UV–vis absorption spectroscopy could be used to characterize the ability of catalysts to harvest UV light and visible light [36]. For example, He et al. prepared the Cu/ZnO catalyst for photocatalytic CO2 hydrogenation, where pure Cu and ZnO were used as reference catalysts [37]. Cu and ZnO were studied on the UV–vis spectrophotometer (UV-2600, Shimadsu, Japan) equipped with a photometric integrating sphere. As can be seen from Figure 1(a), ZnO exhibits a strong absorption peak in the range from 200 to 500 nm, and the maximum absorption peak is 372 nm, indicating that ZnO can absorb UV light effectively, but cannot absorb visible light. The Cu/ZnO catalyst has two absorption peaks at 387.5 and 578.6 nm, corresponding to the absorption of ZnO and plasma Cu, respectively. The absorption peak area of Cu was obviously lower than that of Cu/ZnO. The larger absorption peak area means that more light was absorbed over the photocatalyst. Therefore, it proved that the structure information of photocatalysts can be calculated according to the position and intensity of the absorption peak. The results in Figure 1(a) indicated that the Cu/ZnO catalyst could absorb UV and visible light, and the strongest light absorption capacity was also illustrated. During photocatalytic CO2 hydrogenation reaction under UV–vis light irradiation, the electrons excited by plasmonic Cu and semiconductor ZnO accelerated the pyrolysis of H2 and the adsorption of CO2, which promoted the catalytic reaction. As shown in Figure 1(b), the yield of CH4 over the Cu/ZnO catalyst was significantly increased under light illumination.
![Figure 1
(a) UV–vis absorption spectra of the prepared catalysts; (b) yields of CH4 and CO over Cu/ZnO catalyst in photocatalytic CO2 hydrogenation reaction [37].](/document/doi/10.1515/revac-2023-0061/asset/graphic/j_revac-2023-0061_fig_001.jpg)
(a) UV–vis absorption spectra of the prepared catalysts; (b) yields of CH4 and CO over Cu/ZnO catalyst in photocatalytic CO2 hydrogenation reaction [37].
UV–vis absorption spectroscopy could also be used to calculate semiconductor band gap width via the Tauc equation (also known as the Tauc Plot method, Eq. 1), which plays a practical role in measuring the conductivity of semiconductors [38].
In Eq. 1, hν for the photon energy, α for the absorption index, h for Planck constant (h ≈ 4.13567 × 10⁻¹⁵ eV·s), ν for the frequency, B for the proportional constant, and E g for the semiconductor band gap width. Exponent n is straightly connected with the type of semiconductor, n = 1/2 for direct bandgap semiconductor, while n = 2 for indirect bandgap semiconductor.
Specific operation of this method is shown as follows. First, (αhv)1/n and hν are calculated. c means the speed of light (c = 3.0 × 10⁸ m·s−1) and λ means the wavelength of light in the formula of ν = c/λ. In general, α = 2.303 × A/d, where A is the absorbance, which can be measured by spectrophotometer. For liquid, d is the thickness of the colorimeter; for solid, d is the thickness of the film; and for powder, d is the thickness of the powder tablet. Then, we can plot (αhv)1/n with respect to hν (hν is the x-coordinate, (αhv)1/n is the y-coordinate), and a curve approximating a straight line is obtained. After that, the straight-line part of the graph is extrapolated to the x-axis, where the intersection is the band gap value. There is another easy way to calculate the band gap width of semiconductors [39,40]. The fundamental theory is that the band edge wavelength of semiconductor (also named absorption threshold, λ g) is determined by the band gap width E g. The Eq. 2 shows the quantitative connection of above two parameters.
On the curve of the absorption spectrum, a tangent line is made along the point where the curve changed the most, and the intersection of the tangent line and X-axis is recorded as λ g, and then Eq. 2 is used to calculate the band gap E g.
A typical example for the calculation of band gap width from UV–vis absorption spectrum was provided by Nor and Amin’s study [41]. The C-doped TiO2 photocatalysts with different C content were prepared for CO2 reduction reaction, and Eq. 1 was used to calculate the band gap. As shown in Figure 2(a), the band gap of TiO2 and 6C–TiO2 were obtained (TiO2 and 6C–TiO2 are direct band gap semiconductors, so n is equal to 1/2). Apparently, the band gap of 6C–TiO2 was narrowed from 3.37 to 3.10 eV (inset of Figure 2(a)). The narrow band gap of 6C–TiO2 is conducive to the movement of photogenerated electrons, and the electron-hole has a high possibility of absorbing visible light. In addition, the narrow band gap of 6C–TiO2 helped to absorb visible light, generating a huge visible light response in the reaction process. As can be seen from Figure 2(b), compared with pure TiO2, the yield of the target product methanol was almost doubled over the 6C–TiO2 catalyst.
![Figure 2
(a) UV–vis absorption spectra of TiO2 and 6C–TiO2, with the inset displaying the Tauc plot for band gap recognition of TiO2 and 6C–TiO2; (b) yield and quantum yield of methanol over the catalysts [41].](/document/doi/10.1515/revac-2023-0061/asset/graphic/j_revac-2023-0061_fig_002.jpg)
(a) UV–vis absorption spectra of TiO2 and 6C–TiO2, with the inset displaying the Tauc plot for band gap recognition of TiO2 and 6C–TiO2; (b) yield and quantum yield of methanol over the catalysts [41].
2.2 UV–vis diffuse reflection spectroscopy (UV–vis DRS)
UV–vis DRS can be used to characterize the light reflection ability of a small number of powder photocatalysts [42,43]. Similar to UV–vis absorption spectroscopy, UV–vis DRS also utilizes the electron transition of photocatalysts upon light irradiation. It mainly takes advantage of the reflection of light on the surface of a substance to obtain the information of the semiconductor photocatalysts, which is closely related to its electronic structure. In addition, compared with the UV–vis absorption spectrum, the UV–vis DRS spectrum of the measured solution sample state is required. These solution samples cannot be clarified, but rather suspension or emulsion [44,45,46].
Light would be reflected and scattered when it strikes a solid surface. If the light causes specular reflection, the magnitude of the angle of reflection is the same as the magnitude of the angle of incidence. When light strikes the surface of a powdered particle, some light is reflected onto the surface of each particle [47,48] and other light is refracted inside the surface particles. After part of absorption, the radiation would transfer to the internal grain interface and then reflected, refracted and absorbed. It is repeated many times and eventually reflected from the powder surface in all directions, which is called diffuse light. In addition, when the diffuse light passes through a solid powder, if absorbed by the powder, the diffused light is weakened, and there is a relationship between the wavelength and intensity of the diffused light, resulting in a diffuse spectrum [49,50,51].
UV–vis DRS depends on the physicochemical properties and color of the semiconductor photocatalyst surface, so characterizing the optical properties of the semiconductor photocatalyst is very useful. The Kubelka–Munk equation (also known as the law of diffuse reflection, Eq. 3) is commonly used to describe the optical relationship on a solid that can both absorb and reflect light [52,53].
Here, K is for the absorption coefficient, S for the scattering coefficient, R ∞ for the reflectivity of an infinitely thick sample, and F(R ∞ ) for the reductive of Kubelka–Munk function.
Pascariu gave a representative example for the characterization of optical properties of photocatalysts via UV-vis DRS [54]. TiO2 and Cu/TiO2 nanocomposites (T400, TCu1, TCu2, TCu3, TCu4, and TCu5 were used to represent the catalysts with Cu/TiO2 ratios of 0, 0.05, 0.1, 0.5, 1, and 2, respectively) by electrostatic spinning calcination method. From Figure 3, the photocatalyst without Cu doping (T400) reflected more light than other catalysts and TCu1 exhibited the least reflectance. It could be assumed that TCu1 possessed better light absorption capacity than other catalysts. The better light harvesting capacity of TCu1 made it the best catalyst for the removal of amaranth dye from synthetic wastewater, with a degradation efficiency of 99.84%. In addition, the band gap width can be calculated by Eqs. 1 and 3.
![Figure 3
UV–vis DRS spectra of TiO2 (T400) and Cu/TiO2 photocatalysts [54].](/document/doi/10.1515/revac-2023-0061/asset/graphic/j_revac-2023-0061_fig_003.jpg)
UV–vis DRS spectra of TiO2 (T400) and Cu/TiO2 photocatalysts [54].
In order to give a better understanding of the usage of UV–vis absorption spectrum and UV–vis DRS in the field of photocatalysis, several examples in the last 3 years (as shown in Table 1) are added. It is generally accepted that a lower band gap could improve degradation efficiency.
Examples of applications of UV–vis absorption spectroscopy or UV–vis DRS
| Catalyst | Absorption peak range | Synthesis method | Band gap of catalysts | Degradation efficiency (%) | Ref. |
|---|---|---|---|---|---|
| rGO/ZnO | 274 and 376 nm | Ecofriendly hydrothermal method | ZnO: 3.06 eV rGO/ZnO: 2.35 eV | 97 | [55] |
| Zn–TiO2 | 400−700 nm | Sol−gel method | TiO2: 3.0 eV Zn-TiO2: 2.8 eV | 99.64 | [56] |
| MnMoO4/NiFe2O4 | 400−800 nm | Coprecipitation and hydrothermal routes | NiFe2O4: 1.20 eV MnMoO4/NiFe2O4: 1.06 eV | 96 | [57] |
2.3 PL spectroscopy
When the semiconductor is excited by light with a photon energy greater than or equal to its band gap E g, electrons would be photoexcited and leave holes in the valence band (VB) in the process of conveying from VB to conduction band (CB). For semiconductor photocatalysts, their thickness is small, so the absorption of photogenerated electrons and holes by themselves is negligible. At the same time, the electrons and holes generated in CB and VB on semiconductor photocatalytic materials are still in nonequilibrium state, and they will reach an equilibrium state (quasi-equilibrium state) after a period of diffusion and further recombination [58]. Partial of the electrons and holes could be directly or indirectly captured by the defect levels and holes, while some of the quasi-equilibrium electrons and holes could recombine, and some electrons may return from the excited state to the ground state under photoexcitation. The captured, recombined, or returned electrons and holes would emit light at different frequencies and form the PL spectrum [59]. PL Spectroscopy is an important method to evaluate the recombination of electrons and holes of semiconductor photocatalysts. Generally, higher PL strength will lead to a higher photoelectron–hole pair recombination rate, which is not conducive to electron transition in photocatalytic reactions [60]. Moreover, PL spectroscopy could also provide significant information on the optical and photochemical properties, electronic structure, and the potential defects in the interfacial region of semiconductor photocatalysts [61].
Kumari et al. gave a representative demonstration of the application of PL spectroscopy to describe the optical properties of photocatalysts [62]. The h-BN-MoS2 heterostructures (MoS2 was uniformly distributed on hexagonal boron nitride (h-BN) nanosheets) were prepared by hydrothermal method, and MoS2 as well as h-BN were used as references. According to Figure 4(a), h-BN and MoS2 exhibited wide emission bands in the wavelength ranges of 435−560 and 460−580 nm, respectively. h-BN-MoS2 gave the PL spectrum within the narrowest wavelength range. Most importantly, the PL intensity of h-BN-MoS2 was observably lower than those of the reference catalysts, proving the better photoelectron-hole pair separation and photoelectron transfer capacity. In other words, the higher the PL intensity, the higher the recombination rate of photoelectron hole pairs. The highly efficient photoelectron–hole pair separation and photoelectron transfer capacity of h-BN-MoS2, together with its strong light-harvesting capacity, endowed it with the best catalytic performance in photocatalytic CO2 reduction into CH3OH, with the maximum yield toward methanol of 5,994 μmol·g−1 (Figure 4(b)).
![Figure 4
(a) PL Spectra of prepared catalysts. (b) Change of methanol yield over h-BN-MoS2 with visible light irradiation time [62].](/document/doi/10.1515/revac-2023-0061/asset/graphic/j_revac-2023-0061_fig_004.jpg)
(a) PL Spectra of prepared catalysts. (b) Change of methanol yield over h-BN-MoS2 with visible light irradiation time [62].
To further illustrate the application of PL spectroscopy in the characterization of semiconductor photocatalysts, several examples from the past 3 years have been supplemented (as shown in Table 2). The performance of the examples can also be seen: the lower the PL intensity, the lower the recombination rate of photoelectron-hole pairs, and the stronger the capability of the photocatalysts.
Examples of applications of PL spectroscopy
| Catalyst | Synthesis method | PL intensity | Photoelectron-hole pairs recombination rate | Photocatalytic capability | Ref. |
|---|---|---|---|---|---|
| MnMoO4, NiFe2O4, MnMoO4/NiFe2O4 | Coprecipitation and hydrothermal routes | NiFe2O4 > MnMoO4 > MnMoO4/NiFe2O4 | NiFe2O4 > MnMoO4 > MnMoO4/NiFe2O4 | NiFe2O4 < MnMoO4 < MnMoO4/NiFe2O4 | [57] |
| MnS, MnS@Ag2S | Microwaveassisted solvothermal and ion-exchange approach | MnS > MnS@Ag2S | MnS > MnS@Ag2S | MnS < MnS@Ag2S | [63] |
| BiOCl, 10% Ag2WO4/BiOCl | A facile Coprecipitation method | BiOCl>10% Ag2WO4/BiOCl | BiOCl > 10% Ag2WO4/BiOCl | BiOCl < 10% Ag2WO4/BiOCl | [64] |
2.4 Raman spectroscopy
Raman effect was reported by Raman in 1928 [65,66]. When the material (gas, liquid, or transparent substance) is illuminated by monochromatic light whose wavelength is much shorter than the common size of sample, a large part of the light will be transferred along the direction of the incident light, while a small number of the light will be scattered at other angles to produce scattered light [67].
In the vertical direction, there are not only scattered light owning the same frequency with the incident light, but also a variety of symmetrically distributed extremely weak Raman spectrum lines offset with the incident light frequency. Generally, the frequency of the variable scattering rays is lower than that of the incoming rays. Occasionally, the frequency of the scattering rays is higher than that of the incoming rays, while the intensity is weaker. Moreover, the quantity, the displacement, and the length of Raman lines are directly connected with the vibrational or rotational energy level of the molecular structure of the material [68,69,70]. The message of the vibration and rotation of molecules could be obtained from the scattering spectrum with different frequencies from the incident light [71,72].
Raman spectroscopy is often used to determine the structure and electronic properties of solid semiconductor photocatalysts. For a given semiconductor photocatalytic material (doped semiconductor photocatalytic material, semiconductor alloy photocatalyst, etc.), the effect of light, namely the light wave vibration and optical phonon displacement caused by light incident on semiconductor photocatalyst, could be explained by Raman spectroscopy. The general structural information of a given photocatalyst can be obtained by a variety of Raman spectral lines. The displacement of optical phonons also reflects the amount of photogenerated charge carriers generated by the doping of semiconductor photocatalysts. For example, Raman spectroscopy can be used to determine whether heterojunction structures are formed between the two components to further understand the performance of the photocatalyst [73,74,75].
An effective help for understanding the properties of photocatalysts via Raman spectroscopy was provided by Hamad et al. [76]. The CuO@TiO2 heterojunction nanocomposite catalyst was prepared, and the Raman spectra of CuO@TiO2 as well as the reference catalysts TiO2 and CuO are shown in Figure 5. According to the Raman spectrum, the double E g modes at 145 and 606 cm−1 were corresponding to the symmetric vibration of O–Ti–O, and the B1g mode at 437 cm−1 was related to the symmetric bending vibration of O–Ti–O. The A1g peak of CuO was located at 272 cm−1 which was distinctive for analyzing the CuO phase. In CuO@TiO2, the positions of Raman peaks of B1g and A1g vibration modes of TiO2 were modified by CuO. In addition, there was a blue shift for the B1g mode from 437 to 404 cm−1, which indicated a strong interaction between CuO and TiO2 in CuO@TiO2. At the same time, it was also proved that heterostructure was formed between CuO and TiO2. As reported, the heterojunction structure of CuO@TiO2 endowed it with high catalytic activity in the photocatalytic degradation of organic pollutants.
![Figure 5
Raman spectra of TiO2, CuO, and its binary CuO@TiO2 heterojunction nanocomposite catalyst [76].](/document/doi/10.1515/revac-2023-0061/asset/graphic/j_revac-2023-0061_fig_005.jpg)
Raman spectra of TiO2, CuO, and its binary CuO@TiO2 heterojunction nanocomposite catalyst [76].
Several examples from the last 3 years (shown in Table 3) are used as references. Raman spectroscopy can be used to determine whether a heterostructure is formed between two substances.
Examples of applications of Raman spectroscopy
| Catalyst | Synthesis method | Positions of Raman peaks (cm−1) | The corresponding structure | Ref. |
|---|---|---|---|---|
| rGO/ZnO | Ecofriendly hydrothermal method | 438 | 438 cm−1: ZnO | [55] |
| 1,351 | 1,351 cm−1: D band | |||
| 1,586 | 1,586 cm−1: G band | |||
| GO/Ag2O | Modified Hummers method | 112.97 | 112.97 cm−1: Ag–O bond | [77] |
| 1,350 | 1,350 cm−1: D band | |||
| 1,587 | 1,587 cm−1: G band | |||
| CuO/CdS | The ultrasound-assisted wet impregnation method | 216 | 216, 413, 601 cm−1: CdS | [78] |
| 283 | ||||
| 332 | ||||
| 413 | 283, 332, 627 cm−1: CuO | |||
| 601 | ||||
| 627 |
2.5 Mott–Schottky plot
Photocatalyst is usually a composite material of semiconductor or single component semiconductor. The type of semiconductors, the position of the CB, the position of the VB, and the width of the bandgap influence the performance of photocatalysts efficiently [79]. Hence, it is of great significance to investigate these properties of semiconductor photocatalysts. UV–vis absorption spectrum, mentioned above, is powerful for characterizing the bandgap width of the semiconductors, and Mott–Schottky plot is a characterization technique that is broadly used to determine the type of semiconductors and band potentials [27,80].
Mott–Schottky equation derivation starts from the Poisson equation (as shown in Eq. 4), which expresses the connection with charge density and potential difference Φ, where the position x away from the semiconductor surface’s charge density is ρ, Φ is the potential difference, ε is the dielectric constant, and ε 0 is the vacuum dielectric constant. Boltzmann distribution is used to explain the distribution of electrons in the space charge region, and Gauss’ law between the electric field passing through the interface and the charge contained in the region. Poisson equation can be solved, and Mott–Schottky equation can be obtained [81].
Eq. 5 is the Mott–Schottky equation, which expresses the connection between the space charge layer differential capacitance (C sc) of a semiconductor and other parameters [82], where U is the applied potential, ε is the dielectric constant, ε 0 is the vacuum dielectric constant, e is the electron charge, k B is the Boltzmann constant, and T is the absolute temperature.
On account of the data in the formula, a graph could be obtained, with U as the x-coordinate and
It is worth noting that, by combining the bandgap width E g measured by UV–vis absorption spectroscopy, the position of VB could be calculated via Eq. 6. The type of semiconductors, the width of bandgap, as well as the positions of VB and CB play crucial roles in photocatalytic reaction, as they directly affect the photocatalytic reaction process [86].
Yadav’s work is a representative pattern of using Mott–Schottky plots to determine the flat band potential of photocatalysts [87]. They synthesized a catalyst with Pt nanoparticles incorporated by Si sites on mesoporous Ti x Si1−x O2 support (the catalyst was denoted as PtSi-Ti0.72Si0.28O2 in the case that x = 0.72), where Pt–TiO2 and Pt–Ti0.72Si0.28O2 were adopted as reference catalysts. The tangent lines of the Mott–Schottky curves of the three semiconductor photocatalysts in Figure 6 showed that the slopes of the three tangent lines are all positive, which indicate that the three catalysts are n-type semiconductors. In addition, they utilized Eq. 5 to determine the flat-band potential, which is obtained by making a tangent to the curve in Figure 6. Pt–TiO2, Pt–Ti0.72Si0.28O2, and PtSi–Ti0.72Si0.28O2 catalysts’ flat-band potentials, which were directly described as E CB, were −0.30, −0.54 and −0.40 eV. The relative negative potential (−0.40 eV) of CB of PtSi–Ti0.72Si0.28O2 relative to the potential of CO2 for CO, CH4, and CH3OH and its strong light response endow PtSi–Ti0.72Si0.28O2 with higher photocatalytic activity for CO, CH4, and CH3OH reduction by CO2.
![Figure 6
Mott-Schottky plots of Pt-TiO2, Pt-Ti0.72Si0.28O2, and PtSi-Ti0.72Si0.28O2 [87].](/document/doi/10.1515/revac-2023-0061/asset/graphic/j_revac-2023-0061_fig_006.jpg)
Mott-Schottky plots of Pt-TiO2, Pt-Ti0.72Si0.28O2, and PtSi-Ti0.72Si0.28O2 [87].
The position of VB is an important factor to determine whether a semiconductor can reasonably carry out the oxidation-half reaction, since the position of VB should be more positive than the redox potential of the reactants.
An example to illustrate how to solve VB through Mott–Schottky plots and UV–vis absorption spectroscopy was shown by the study of Zhu et al. [88]. Typically, ZnO and CeO2 photocatalysts were prepared, and Eq. 5 was used to determine the flat-band potentials, which were obtained by targeting the curve in Figure 7(a). The flat band potentials of ZnO and CeO2 were −0.61 and −0.87 eV, respectively. It was clear that both photocatalysts were n-type semiconductors. The flat band potential is nearly equivalent to E CB as far as know. Therefore, the E CB of ZnO and CeO2 were −0.61 and −0.87 eV, respectively. And the relatively negative position of CB of CeO2 and ZnO was more negative than that of O2 reduced to ˙O2− radical. Then, they obtained the E g of CeO2 and ZnO using UV–vis absorption spectroscopy in Figure 7(b) and Tauc equation (Eq. 1), and the E g of ZnO and CeO2 which is shown in Figure 7(c) were 3.13 and 2.86 eV, respectively. According to Eq. 6, E VB of ZnO and CeO2 could be calculated as 2.52 and 1.99 eV, separately. The redox potential of water oxidation to ˙OH radical is 2.24 eV. Therefore, OH radical could be generated at the VB position of ZnO; at the same time, it could not be generated at the VB position of CeO2. However, due to the fast recombination of photoinduced electron-hole pairs on ZnO, the photocatalytic activity of ZnO was poor. ZnO/CeO2 Z-scheme heterostructure with CB more negative than CeO2 and VB more positive than ZnO exhibited stronger reduction and oxidation ability. As a result, the optimal ZnO/CeO2 Z-scheme heterostructure (denoted as ZnO/CeO2-3, in which the mass fraction of CeO2 was 30%) performed better photostability and higher efficiency for the photodegradation of RhB, which was 2.5 times and 1.7 times of pure ZnO and CeO2.
![Figure 7
(a) Mott–Schottky plots, (b) UV−vis absorption spectra, and (c) band gap energies of different catalysts [88].](/document/doi/10.1515/revac-2023-0061/asset/graphic/j_revac-2023-0061_fig_007.jpg)
(a) Mott–Schottky plots, (b) UV−vis absorption spectra, and (c) band gap energies of different catalysts [88].
2.6 EIS
EIS, also known as alternating current (AC) impedance, is currently used to understand the charge transfer situation in photoelectrochemical catalytic reactions. It is also one of the widely used characterization methods for photocatalysts and is very intuitive and effective [89,90]. The electrochemistry involved in photocatalysis is relatively complex. Hence, electrochemical systems can be considered simply as equivalent circuits and studied, and the essential components (such as inductors (L), capacitors (C), and resistors (R)) are connected in series or parallel. The structure of the equivalent circuit and the information of each element can be specified via EIS, and the composition of the electrochemical system as well as the properties of the electrode can be analyzed by the electrochemical significance of these elements [91,92].
EIS measures the variation of the ratio of AC potential to current signal with the change of sinusoidal frequency ω, applying small amplitude AC sinusoidal potential waves of distinct frequencies. In other words, the phase angle of impedance varies with ω by applying small amplitude AC sinusoidal potential waves of different frequencies [93]. It is equivalents to entering a disturbance function X in an electrochemical workstation, and it will output a response signal Y. It forms a function that describes the effect of the disturbance on the response, and it is named the transfer function G(ω). If the internal structure of the system is a stable linear structure, there is a linear function relationship between the output signal and the disturbance signal [94]. It could be expressed by Eq. 7:
If the angular frequency is ω, X is its sinusoidal current signal, and then, Y is its sinusoidal potential signal. In cases like that, the transmission function G(ω) is also a frequency function, which is called the frequency response function. The function of this frequency response is called the impedance of the system, and it is represented by Z.
If the angular frequency is ω, X is its sinusoidal potential signal, and Y is its sinusoidal current signal. In cases like that, the frequency response function G(ω) is called the admission of the system and is expressed by Y.
Impedance and admittance are collectively referred to as resistance, and they are denoted by G. Impedance and admittance are reciprocal: Z = 1/Y.
Resistive G is a vector that varies with ω, and it is usually expressed as a complex function of angular frequency ω. There is a quantitative relationship between the parameters (Eq. 8). Here, G′ is the real section of the resistance and G ″ is the imaginary component of the resistance, and j is an imaginary unit,
From the Eqs. 7−11, we can get different frequencies of impedance real section Z′, imaginary component Z″, modulus value |Z|, and phase angle φ. Finally, the real part Z′ and the imaginary part Z″ are taken as X-axis and Y-axis, respectively, to form the EIS spectrum. In the characterization of semiconductor photocatalysts, the obtained EIS spectrum usually looks like a semicircle curve [95]. In general, we can know the charge transferability of the catalyst according to the radius of the arc in the EIS spectrum of the catalyst. The larger the arc radius, the larger the charge transfer resistance and the weaker the charge transfer capability [27].
A typical example of adopting the EIS spectrum to characterize photocatalysts was provided by Wu [96]. TiO2 and Cu−TiO2 catalysts were produced by the sol–gel method, and a series of NCT catalysts by further impregnating different amounts of Ni onto Cu−TiO2. The EIS spectra in Figure 8(a) revealed that the arc radius of NCT catalysts was smaller than those of other catalysts. Among them, the radius lengths of 0.5 NCT and 1.0 NCT arcs were the smallest. It could be assumed that 0.5 NCT and 1.0 NCT possessed a smaller charge transfer resistance than other catalysts and accelerated charge transfer capacity. Together with the weaker photoelectron-hole pair recombination rate characterized via PL spectra in Figure 8(b), 0.5 NCT exhibited good catalytic performance in photocatalytic H2O reduction to H2, with its catalytic yield almost 40 times higher than that of bare TiO2 (Figure 8(c)).
![Figure 8
(a) The EIS of modified TiO2 catalysts; (b) PL emission spectrum of NCT samples; (c) hydrogen yield from pure water on different catalysts [96].](/document/doi/10.1515/revac-2023-0061/asset/graphic/j_revac-2023-0061_fig_008.jpg)
(a) The EIS of modified TiO2 catalysts; (b) PL emission spectrum of NCT samples; (c) hydrogen yield from pure water on different catalysts [96].
Several examples of EIS in the field of photocatalysis in the last 3 years (as shown in Table 4) can fully demonstrate its importance. The data in Table 4 are also consistent with the above conclusion (the smaller the arc radius, the stronger the photocatalytic capacity).
Examples of applications of EIS
| Catalyst | Synthesis method | Arc radius | Charge transfer resistance | Charge transfer capability | Photocatalytic capability | Ref. |
|---|---|---|---|---|---|---|
| CuO CuO/CdS | The ultrasound-assisted wet impregnation method | CuO > CuO/CdS | CuO > CuO/CdS | CuO < CuO/CdS | CuO < CuO/CdS | [78] |
| BiOBr–H2O BiOBr–EG | One-step hydrolysis method | BiOBr–H2O > BiOBr–EG | BiOBr–H2O > BiOBr–EG | BiOBr–H2O < BiOBr–EG | BiOBr–H2O < BiOBr–EG | [97] |
| CdS 6% MoS2/CdS | Simple sonication method | CdS > 6% MoS2/CdS | CdS > 6% MoS2/CdS | CdS < 6% MoS2/CdS | CdS < 6% MoS2/CdS | [98] |
2.7 LSV and CV
LSV is a standard photocatalytic characterization method. It applies a voltage that changes in a linear relationship on the electrode and records the electrolytic current on the working electrode [99]. If there is electron transfer (redox reaction), the current will increase. Meanwhile, the position of the current peak reflects diverse redox reactions, and the intensity of the current peak reflects the activity of redox reactions [100,101,102]. LSV is often used for quantitative analysis, and it is suitable for the determination of adsorbable substances. CV has the same working principle as LSV, but it is a cyclic process. Therefore, it is often used to judge the reversible electrode process as well as study the active substance in the electrode adsorption–desorption process [103,104,105].
The potential at any time after the start of scanning E can be expressed by Eq. 12 [106]:
where E i is the initial potential, t is the time, and v is the voltage scanning speed. The peak current of the reversible electrode reaction is shown in Eq. 13:
where F is Faraday constant, D is the reactant diffusion coefficient, C θ is the reactant concentration in oxidation state, n is the electron exchange number, and A is the effective electrode area. When the effective area of the electrode remains unchanged, Eq. 13 can be simplified into the following form:
It can be seen from Eq. 14 that the peak current is proportional to the 1/2 power of the potential scanning velocity v, and the peak current is proportional to the bulk concentration of the reactants, which is the basis of the quantitative analysis of the linear scanning voltammetry.
However, if the reaction process of the electrode is irreversible, the peak potential will shift in the positive or negative with the increase of the scanning speed [107,108,109]. There is a quantitative relationship between the parameters (Eq. 15).
Li et al.’s work gives a representative example of the characterization of optical properties of photocatalysts via LSV and CV [110]. Pt/GNs, Pt/WO3-GNs, and Pt-WO3@W/GNs were prepared by the solid phase approach, with 30% PtRu/C as a reference catalyst. The four catalysts were used for electrocatalytic oxygen reduction reaction (ORR), with or without the illumination of a 0.25 mW·cm−2 Xenon lamp. From Figure 9(a) and (b), it is suggested that the onset potential of Pt-WO3@W/GNs was higher than those of other photocatalysts. The half-wave potentials of Pt-WO3@W/GNs were higher than those of other photocatalysts. Since initial potential and half-wave potential are the most important performance indexes of the catalysts used for electrocatalytic ORR, it can be speculated that Pt-WO3@W/GNs exhibited better catalytic activity in ORR than the other three photocatalysts. In other words, the current peak mentioned earlier reflected the activity of the reaction. The initial potential and half-wave potential of Pt-WO3@W/GNs were the largest, which expresses that Pt-WO3@W/GNs have the highest catalytic activity. In Figure 10, the mass activities of the four catalysts for electrocatalytic ORR with or without light radiation were demonstrated. As shown in Figure 10(a), the peak current of Pt-WO3@W/GNs was the highest in the presence of light radiation, which was 1.7 times higher than that without light. As shown in Figure 10(b), the mass activity of Pt/WO3-GNs also increased under light irradiation, but the increased amplitude was obviously smaller than that of Pt-WO3@W/GNs. On the contrary, the current density of 30% PtRu-C and Pt/GNs in Figure 10(c) and (d) increased negligibly under light irradiation, which might be due to the lack of light-responsive W species. Notably, the mass activity (peak current density) of Pt-WO3@W/GNs for ORR was the highest under light illumination, with a digital of 21.34 mA·mg−1. Hence, Pt-WO3@W/GNs exhibited the most photocatalytic advantages compared with the other three catalysts for ORR. All in all, it could be inferred Pt-WO3@W/GNs gave higher photoelectrocatalytic performance in ORR.
![Figure 9
LSV Curves in oxygen-saturated H2SO4: a. Pt-WO3@W/GNs, b. 30% PtRu/C, c. Pt/WO3-GNs, d. Pt/GNs. (a) the specific activity and (b) mass activity given as current normalized against electrode surface area and the mass of Pt [110].](/document/doi/10.1515/revac-2023-0061/asset/graphic/j_revac-2023-0061_fig_009.jpg)
LSV Curves in oxygen-saturated H2SO4: a. Pt-WO3@W/GNs, b. 30% PtRu/C, c. Pt/WO3-GNs, d. Pt/GNs. (a) the specific activity and (b) mass activity given as current normalized against electrode surface area and the mass of Pt [110].
![Figure 10
CV Curves in oxygen saturated H2SO4 without a and with b light irradiation: (a) Pt-WO3@W/GNs, (b) Pt/WO3-GN, (c) 30% PtRu-C, (d) Pt/GNs [110].](/document/doi/10.1515/revac-2023-0061/asset/graphic/j_revac-2023-0061_fig_010.jpg)
CV Curves in oxygen saturated H2SO4 without a and with b light irradiation: (a) Pt-WO3@W/GNs, (b) Pt/WO3-GN, (c) 30% PtRu-C, (d) Pt/GNs [110].
So as to better understand the application of CV or LSV in photocatalysis, several examples in the past 3 years (as shown in Table 5) are added to further illustrate. Generally speaking, CV or LSV can compare the current density of photocatalysts to judge the catalytic activity.
Examples of applications of CV or LSV
| Catalyst | Synthesis method | Current density | Max current density | Catalytic activity | Ref. |
|---|---|---|---|---|---|
| γ-Al2O3 CuO/α-Fe2O3/γ-Al2O3 | Wet chemical method | γ-Al2O3 < CuO/α-Fe2O3/γ-Al2O3 | 69 μA·mg−1 | γ-Al2O3 < CuO/α-Fe2O3/γ-Al2O3 | [111] |
| g-C3N4 g-C3N4-La2O3 g-C3N4-CoO g-C3N4-La2O3-CoO | Hydrothermally prepared | g-C3N4 < g-C3N4-La2O3 < g-C3N4-CoO < g-C3N4-La2O3-CoO | 3.75 mA·mg−1 | g-C3N4 < g-C3N4- La2O3 < g-C3N4-CoO < g-C3N4-La2O3-CoO | [112] |
| ZW4 | Facile | ZW4< | 70 | ZW4< | [113] |
| 5GZW4-I | Coprecipitating | 5GZW4-I | μA·mg−1 | 5GZW4-I | |
| 10GZW4-I | Method | <10GZW4-I | <10GZW4-I |
2.8 Chronoamperometry (photocurrent)
Photocurrent is a simple and extensively used photoelectrochemical detection technology [114,115]. When light energy is used to excite a semiconductor, VB electrons are excited and transit to the CB. By adding a strong electric field, the CB electrons will move directionally and form a current. Photogenerated current potentiated is used in electrolytic cells to reduce some electroactive substances in solution. The current time curve, namely photocurrent spectrum, is obtained by recording the change of current with time [116,117].
Photocurrent is an electrochemical analysis method and technology for studying the kinetics of electrochemical processes. It represents a functional relationship, which is a change in current over time after applying a single or double potential to the working electrode of a photochemical system [118,119]. The research on the principle of the photocurrent method can be traced back to 1902 when the Cottrell equation appeared. Cottrell equation was mathematically derived from the diffusion law of linear diffusion on a planar electrode and Laplace transform [120]. There is a quantitative relationship between the parameters (Eq. 16).
where i 1 is the limiting current, n is the quantity of electron transfer in the electrode reaction, A is the electrode area, F is the Faraday constant, D is the diffusion coefficient of the active substance, C 0 is the initial molar concentration of the active substance in the solution, and t is the electrolytic time.
The concentration of the active substance on the electrode surface will decrease gradually due to electrolysis, so the current will decrease correspondingly as time increases, which is reflected in the Cottrell equation. In addition, i 1 is proportional to C 0 [121,122,123].
Photocurrent is an efficient characterization technique with high sensitivity and less detection time for the analysis and understanding of photodynamics occurring in semiconductors [124,125]. Traditional photocurrent can explore the morphology, material properties, and contact interface of semiconductor catalytic materials [126]. At present, it is considered one of the effective methods to determine the separation capacity of photo-borne carriers. When the photocurrent energy is absorbed by the semiconductor, the higher photocurrent response indicates a better charge separation ability [127].
Wang’s work gives a classic example of the characterization of optical properties of photocatalysts via photocurrent [128]. The non-stoichiometric degree of In2O3 was controlled by them to adjust the color of the catalyst and make its color turn from light yellow to black. Photocatalysts S1 and S4 (S1 was In2O3 nanocrystals, which was obtained by thermally dehydroxylating In(OH)3 nanocrystals in air at 700℃ for 5 h. S4 was produced by placing the as prepared S1 with hydrogen at 400℃ for 1 h, to form In2O3−x /In2O3) were prepared. The photocurrent responses of S1 and S4 catalysts were characterized. As can be seen from Figure 11(a), under the condition of light illumination, compared with S1, S4 excited electrons within a shorter saturation time, indicating that S4 was strong in light absorption. Under the cases of light-off, the photocurrents of S1 and S4 decayed gradually. S4 took more decay time than S1, probably due to the more oxygen vacancy traps and longer photoelectron lifetimes. The increase of oxygen vacancies in S4 was beneficial to increase the lifetime of photoelectrons and consequently boosted the catalytic performance. In other words, the higher photocurrent response mentioned above indicated better charge separation ability. In Figure 11(a), we can see that the photocurrent response of S4 was higher than that of S1, which indicates that the charge separation ability of S4 was higher than that of S1. Apparently, in Figure 11(b), S4 recorded a better catalytic performance in photocatalytic CO2 hydrogenation reaction, with a CO productivity of 160.99 μmol·h−1·m−2.
![Figure 11
(a) Photocurrent saturation and decay plot acquired at ∼200℃ with a 1:1 ratio of CO2/H2 and under a 100 W LED white lamp. (b) Catalytic performance of S4 in photocatalytic CO2 hydrogenation reaction at different temperatures [128].](/document/doi/10.1515/revac-2023-0061/asset/graphic/j_revac-2023-0061_fig_011.jpg)
(a) Photocurrent saturation and decay plot acquired at ∼200℃ with a 1:1 ratio of CO2/H2 and under a 100 W LED white lamp. (b) Catalytic performance of S4 in photocatalytic CO2 hydrogenation reaction at different temperatures [128].
For photocurrent as a characterization technique, several examples from the last 3 years are added in Table 6. The ability of charge separation was evaluated by photocurrent response.
Examples of applications of photocurrent
| Catalyst | Synthesis method | Photocurrent response | Charge separation ability | Ref. |
|---|---|---|---|---|
| CdS 6% MoS2/CdS | Sonication method | CdS < 6% MoS2/CdS | CdS < 6% MoS2/CdS | [98] |
| ZnWO4 | Coprecipitating method | ZW4 < 5GZW4-I < | ZW4 < 5GZW4-I < | [113] |
| 5GZW4-I | ||||
| 10GZW4-I | 15GZW4-I < | 15GZW4-I < | ||
| 15GZW4-I | ||||
| 10GZW4-I | 10GZW4-I | |||
| Cu2O | Hydrothermal route | Cu2O < | Cu2O < | [129] |
| Cu2O-MoS2 | Cu2O-MoS2 < | Cu2O-MoS2 < | ||
| Cu2O-MoS2/rGO | Cu2O-MoS2/rGO | Cu2O-MoS2/rGO |
3 Conclusions and outlooks
Photocatalysis is a research hotspot for both energy and environment. As effective tools for the characterization of photocatalysts, the related techniques are becoming increasingly necessary.
Catalysts for photocatalysis are mainly consist of semiconductor materials, and characterization techniques for photocatalysts are also of significance. (Main point characterization techniques are shown in Table 7.) According to the information (such as the energy band positions, the light absorption ability, and the recombination ability of photogenerated electron–hole pairs) obtained from several tests, researchers could obtain theoretical support to understand the properties of semiconductor photocatalysts comprehensively.
Brief summary of techniques for the characterization of optical properties of photocatalysts
| Techniques | Principles | Main information obtained | Advantages | Disadvantages |
|---|---|---|---|---|
| UV-vis absorption spectroscopy | Electronic transition | Light absorption capacity and band gap | Simple operation, fast analysis speed, and high accuracy | High concentrations are not applicable, and high cost |
| UV-vis diffuse reflection spectroscopy (UV-vis DRS) | Electronic transition | Light reflection capacity | Simple operation, fast analysis speed, and high accuracy | High cost |
| PL | Electronic transition | Electron hole recombination rate | Simple operation, and high resolution, | High requirements for temperature, and it can’t be used for quantitative analysis |
| Raman spectroscopy | Light scattering | Vibrational or rotational energy level of molecules | Simple operation, and high sensitivity | Nonlinearity of curve |
| Mott–Schottky plot | Mott–Schottky equation | The position of the flat band potential | Simple operation | Data processing is complex |
| EIS | The change of impedance with frequency | Charge transfer capacity | Simple operation and high accuracy | There is no unique correspondence between impedance spectrum and equivalent circuit |
| LSV | Current varies with voltage | The position of the effective potential | Simple operation, low detection cost and fast test process | Poor stability |
| CV | Current varies with voltage | Current density generated by photocatalysts | Simple operation | Unable to analyze from dynamics |
| Chronoamperometry (photocurrent) | Change in current over time | Evaluate the separation ability of photogenerated electron-hole pairs | Simple detection and high sensitivity | Data processing is complex |
Nowadays, there are more and more advanced characterization techniques for semiconductor photocatalysts; however, these techniques still have some practical deficiencies including sensitivity, resolution, and skills for in-situ tests. Therefore, researchers should not only be fully familiar with the working principles of existing characterization techniques but also optimize the richness and relevance of device applications, which is conducive to making clear the photocatalytic reaction mechanism. In addition, although the present CV can analyze the activity of redox reactions in photocatalysis from the perspective of thermodynamics (Gibbs free energy and entropy increase principle), it is still incapable of studying the reaction process through kinetics. Therefore, the development of a new method that can be analyzed from the perspective of thermodynamics as well as the view of dynamics and will play a key part in promoting the development of photocatalysis.
Acknowledgements
We acknowledge the financial support from the National Natural Science Foundation of America China (No. 21902116), Scientific Research Foundation of Liaoning Province (2022JH2/101300125), and the Education Department of Liaoning Province (JQL202015401 and LJKMZ20220982).
-
Funding information: Authors state no funding is involved.
-
Author contributions: Chunnan Hao: writing − original draft, writing – review & editing; Zenan Ni: funding acquisition, writing – original draft; Jian Wang: writing – review & editing; Huimin Liu: funding acquisition, writing – review & editing; Ze Zheng: formal analysis; Yuqiao Li: formal analysis; Jiawen Guo: formal analysis; Ruiqi Zhang: formal analysis; Qijian Zhang: conceptualization, supervision, funding acquisition, writing – review & editing.
-
Conflict of interest: Authors state no conflict of interest.
References
[1] Lu Y, Zhang H, Fan D, Chen Z, Yang X. Coupling solar-driven photothermal effect into photocatalysis for sustainable water treatment. J Hazard Mater. 2022;423:127–8.10.1016/j.jhazmat.2021.127128Search in Google Scholar PubMed
[2] Sagir M, Tahir MB, Waheed U. Akram J in Role of Photocatalysis in Green Energy Production. Oxford: Elsevier; 2022. p. 590–6.10.1016/B978-0-12-815732-9.00031-0Search in Google Scholar
[3] Wu J, Zheng W, Chen Y. Definition of photocatalysis: current understanding and perspectives. Curr Opin Green Sustainable Chem. 2022;33:100580–5.10.1016/j.cogsc.2021.100580Search in Google Scholar
[4] Xing X, Tang S, Hong H, Jin H. Concentrated solar photocatalysis for hydrogen generation from water by titania-containing gold nanoparticles. Int J Hydrogrn Energ. 2020;45(16):9612–23.10.1016/j.ijhydene.2020.01.197Search in Google Scholar
[5] Prasannalakshmi P, Shanmugam N. Fabrication of TiO2/ZnO nanocomposites for solar energy driven photocatalysis. Mat Sci Semicon Proc. 2017;61:114–24.10.1016/j.mssp.2017.01.008Search in Google Scholar
[6] Fujishima A, Honda K. Electrochemical photolysis of water at a semiconductor electrode. Nature. 1972;238(5358):37–8.10.1038/238037a0Search in Google Scholar PubMed
[7] Fujishima A, Sugiyama E, Honda K. Photosensitized electrolytic oxidation of iodide ions on cadmium sulfide single crystal electrode. Bull Chem Soc Jpn. 2006;44(1):304.10.1246/bcsj.44.304Search in Google Scholar
[8] Calzaferri PG, Forss L, Spahni W. Photovoltaische umwandlung und speicherung der sonnenenergie. Chem Unserer Zeit. 1987;21(5):161–74.10.1002/ciuz.19870210504Search in Google Scholar
[9] Yi M, Wang X, Jia Y, Chen X, Li C. Titanium dioxide-based nanomaterials for photocatalytic fuel generations. Chem Rev. 2014;114(19):9987–10043.10.1021/cr500008uSearch in Google Scholar PubMed
[10] Wang Z, Song H, Liu H, Ye J. Coupling of solar energy and thermal energy for carbon dioxide reduction: status and prospects. Angew Chen Int Edit. 2020;59(21):8016–35.10.1002/anie.201907443Search in Google Scholar PubMed
[11] Schneider J, Matsuoka M, Takeuchi M, Zhang J, Horiuchi Y, Anpo M, et al. Understanding TiO2 photocatalysis: mechanisms and materials. Chem Rev. 2014;114(19):9919–86.10.1021/cr5001892Search in Google Scholar PubMed
[12] Zhou WC, Zhang WD. Anchoring nickel complex to g-C3N4 enables an efficient photocatalytic hydrogen evolution reaction through ligand-to-metal charge transfer mechanism. J Colloid Interf Sci. 2022;616:791–802.10.1016/j.jcis.2022.02.122Search in Google Scholar PubMed
[13] Shyamala R, Devi LG. Reduced graphene oxide/SnO2 nanocomposites for the photocatalytic degradation of rhodamine B: preparation, characterization, photosensitization, vectorial charge transfer mechanism and identification of reaction intermediates. Chem Phys Lett. 2020;748:137385–96.10.1016/j.cplett.2020.137385Search in Google Scholar
[14] Laohhasurayotin K, Pookboonmee S. Multifunctional properties of Ag/TiO2/bamboo charcoal composites: Preparation and examination through several characterization methods. Appl Surf Sci. 2013;282(11):236–44.10.1016/j.apsusc.2013.05.110Search in Google Scholar
[15] Huang S, Si Z, Weng D. The synthesis, activity, stability and the charge transfer identification of Ag:AgBr/γ-Al2O3 photocatalyst for organic pollutant decomposition in water. Appl Surf Sci. 2015;357:1792–800.10.1016/j.apsusc.2015.10.058Search in Google Scholar
[16] Yang L, Si Z, Weng D, Yao Y. Synthesis, characterization and photocatalytic activity of porous WO3/TiO2 hollow microspheres. Appl Surf Sci. 2014;313:470–8.10.1016/j.apsusc.2014.05.230Search in Google Scholar
[17] Fan W, Hu J, Jing H, Xin W, Qiu X. Electronic structure and photocatalytic activities of (Bi2-δYδ)Sn2O7 solid solution. Appl Surf Sci. 2015;357:2364–71.10.1016/j.apsusc.2015.09.242Search in Google Scholar
[18] Chen LC, Tu YJ, Wang YS, Kan RS, Huang CM. Characterization and photoreactivity of N-, S-, and C-doped ZnO under UV and visible light illumination. J Photoch Photobio A. 2008;199(2−3):170–8.10.1016/j.jphotochem.2008.05.022Search in Google Scholar
[19] Niño-Martínez N, Martínez-Castañón GA, Aragón-Piña A, Martínez-Gutierrez F, Martínez-Mendoza JR, Ruiz F. Characterization of silver nanoparticles synthesized on titanium dioxide fine particles. Nanotechnology. 2008;19(6):065711–9.10.1088/0957-4484/19/6/065711Search in Google Scholar PubMed
[20] Garrett DeYoung H. UV/VIS Spectroscopy: Something old, something new. Bio-Technol. 1987;5(10):1088–9.10.1038/nbt1087-1088Search in Google Scholar
[21] Schramm H. UV-Vis vapor absorption spectrum of antimony(iii) chloride, antimony(v) chloride, and antimony(iii) bromide. the vapor pressure of antimony(iii) bromide. J Chem Eng. 1995;40(4):963–7.10.1021/je00020a051Search in Google Scholar
[22] Xw A, Yz B, Kw A, Shuai ZA, Xq A, Liang SA, et al. In-situ construction of Bi/defective Bi4NbO8Cl for non-noble metal based Mott-Schottky photocatalysts towards organic pollutants removal. J Hazard Mater. 2020;393(5):122408–16.10.1016/j.jhazmat.2020.122408Search in Google Scholar PubMed
[23] Polignano ML, Caricato AP, Modelli A, Zonca R. Surface characterization by photocurrent measurements. Appl Surf Sci. 2000;154:276–82.10.1016/S0169-4332(99)00447-XSearch in Google Scholar
[24] Zhang J, Huang Q, Wang J, Zhang J, Zhao Y. Supported dual-atom catalysts: Preparation, characterization, and potential applications. Chinese J Catal. 2020;41(5):783–98.10.1016/S1872-2067(20)63536-7Search in Google Scholar
[25] Ali I, AlGhamdi K, Al-Wadaani FT. Advances in iridium nano catalyst preparation, characterization and applications. J Mol Liq. 2019;280:274–84.10.1016/j.molliq.2019.02.050Search in Google Scholar
[26] Luo C, Ren X, Dai Z, Zhang Y, Qi X, Pan C. Present perspectives of advanced characterization techniques in TiO2-based photocatalysts. ACS Appl Mater Inter. 2017;9(28):23265–86.10.1021/acsami.7b00496Search in Google Scholar PubMed
[27] Janáky C, Rajeshwar K. Current trends in semiconductor photoelectrochemistry. ACS Energy Lett. 2017;2(6):1425–8.10.1021/acsenergylett.7b00413Search in Google Scholar
[28] Zhang L, Ran J, Qiao S, Jaroniec M. Characterization of semiconductor photocatalysts. Chem Soc Rev. 2019;48(20):5184–206.10.1039/C9CS00172GSearch in Google Scholar PubMed
[29] Chen X, Peng X, Jiang L, Yuan X, Zhang J, Yu H. Terephthalate acid decorated TiO2 for visible light driven photocatalysis mediated via ligand-to-metal charge transfer (LMCT). Colloid Surface A. 2020;603:125188–99.10.1016/j.colsurfa.2020.125188Search in Google Scholar
[30] Wang N, Tan F, Zhao Y, Tsoi CC, Fan X, Yu W, et al. Optofluidic UV-Vis spectrophotometer for online monitoring of photocatalytic reactions. Sci Rep-Uk. 2016;6(1):28928–35.10.1038/srep28928Search in Google Scholar PubMed PubMed Central
[31] Roig B, Touraud E, Thomas O. Photochemical reaction monitoring by ultra-violet spectrophotometry. Spectrochim Acta A. 2002;58(13):2925–30.10.1016/S1386-1425(02)00076-8Search in Google Scholar
[32] Mustafa YF, Khalil RR, Mohammed ET, Bashir M, Oglah MK. Effects of Structural Manipulation on the Bioactivity of some Coumarin-Based Products. Arch Razi Inst. 2021;76(5):1297–305.Search in Google Scholar
[33] Timothy N, Envelope Z. The promise and pitfalls of photocatalysis for organic synthesis. Chem Catalysis. 2022;2(3):468–76.10.1016/j.checat.2021.12.015Search in Google Scholar
[34] Jing Z, Feng C, Zhang J. Carbon-Deposited TiO2: Synthesis, Characterization, and Visible Photocatalytic Performance. J Phys Chem C. 2010;114(2):933–9.10.1021/jp909835mSearch in Google Scholar
[35] Zhang X, Yuan X, Jiang L, Zhang J, Zeng G. Powerful combination of 2D g-C3N4 and 2D nanomaterials for photocatalysis: Recent advances. Chem Eng J. 2020;390:124475–503.10.1016/j.cej.2020.124475Search in Google Scholar
[36] Wang N, Zhang X, Wang Y, Yu W, Chan H. Microfluidic reactors for photocatalytic water purification. Lab Chip. 2014;14:1074–82.10.1039/C3LC51233ASearch in Google Scholar
[37] He X, Liu M, Liang Z, Wang Z, Wang P, Liu Y, et al. Photo-enhanced CO2 hydrogenation by plasmonic Cu/ZnO at atmospheric pressure. J Solid State Chem. 2021;298(1):122113–20.10.1016/j.jssc.2021.122113Search in Google Scholar
[38] Willardson P, Beer A. Physics of III-V Compounds. Semiconductors & Semimetals. Oxford: Elsevier; 1966. p. 3–472.Search in Google Scholar
[39] Li C, Zhang D, Han S, Liu X, Tang T, Zhou C. Diameter-Controlled Growth of Single-Crystalline In2O3 Nanowires and Their Electronic Properties. Adv Mater. 2003;15(2):143–6.10.1002/adma.200390029Search in Google Scholar
[40] Ohhata Y, Shinoki F, Yoshida S. Optical properties of r.f. reactive sputtered tin-doped In2O3 films. Thin Solid Films. 1979;59(2):255–61.10.1016/0040-6090(79)90298-0Search in Google Scholar
[41] Nor N, Amin N. Glucose precursor carbon-doped TiO2 heterojunctions for enhanced efficiency in photocatalytic reduction of carbon dioxide to methanol. J CO2 Util. 2019;33:372–83.10.1016/j.jcou.2019.07.002Search in Google Scholar
[42] Lam S, Sin J, Abdullah A, Mohamed AR. Transition metal oxide loaded ZnO nanorods: Preparation, characterization and their UV–vis photocatalytic activities. Sep Purif Technol. 2014;132:378–87.10.1016/j.seppur.2014.05.043Search in Google Scholar
[43] Hannus I, Tóth T, Méhn D, Kiricsi I. UV–vis diffuse reflectance spectroscopic study of transition-metal (V, Ti) containing catalysts. J Mol Struct. 2001;563:279–82.10.1016/S0022-2860(01)00439-2Search in Google Scholar
[44] Yuan M, Zhang J, Song Y, Luo G, Qian X, Xiang W, et al. Effect of Nd2O3 addition on the surface phase of TiO2 and photocatalytic activity studied by UV Raman spectroscopy. J Alloy Compd. 2011;509(21):6227–35.10.1016/j.jallcom.2011.03.010Search in Google Scholar
[45] Li H, Gao Y, Xiong Z, Liao C, Shih K. Enhanced selective photocatalytic reduction of CO2 to CH4 over plasmonic Au modified g-C3N4 photocatalyst under UV–vis light irradiation. Appl Surf Sci. 2018;439:552–9.10.1016/j.apsusc.2018.01.071Search in Google Scholar
[46] Morawski AW, Kusiak N, Wanag A, Narkiewicz U, Edelmannová M, Reli M, et al. Influence of the calcination of TiO2-reduced graphite hybrid for the photocatalytic reduction of carbon dioxide. Catal Today. 2021;380:32–40.10.1016/j.cattod.2021.05.017Search in Google Scholar
[47] Christy AA, Ozaki Y, Gregoriou VG. Modern Fourier transform infrared spectroscopy. Comprehensive Analytical Chemistry. New York, Amsterdam: Elsevier; 2011.Search in Google Scholar
[48] Hanssen LM, Kaplan S. Infrared diffuse reflectance instrumentation and standards at NIST. Anal Chim Acta. 1999;380:289–302.10.1016/S0003-2670(98)00669-2Search in Google Scholar
[49] Griffiths PR, Yeboah SA, Hamadeh IM, Duff PJ, Yang W, Van K. Analytical applications of diffuse reflectance infrared fourier transform spectroscopy. In: Recent Advances in Analytical Spectroscopy. New York: Pergamon Press; 1982.10.1016/B978-0-08-026221-5.50030-1Search in Google Scholar
[50] Höpe A. In: Chapter 6 - Diffuse Reflectance and Transmittance. New York: Academic Press; 2014.10.1016/B978-0-12-386022-4.00006-6Search in Google Scholar
[51] Krivácsy Z, Hlavay J. Determination of quartz in dust samples by diffuse reflection FTIR spectroscopy. J Mol Struct. 1993;294:251–4.10.1016/0022-2860(93)80362-YSearch in Google Scholar
[52] Shen J, Li Y, He J. On the Kubelka–Munk absorption coefficient. Dyes Pigments. 2016;127:187–8.10.1016/j.dyepig.2015.11.029Search in Google Scholar
[53] Christy AA, Kvalheim OM, Velapoldi RA. Quantitative analysis in diffuse reflectance spectrometry: A modified Kubelka-Munk equation. Vib Spectrosc. 1995;9(1):19–27.10.1016/0924-2031(94)00065-OSearch in Google Scholar
[54] Pascariu P, Cojocaru C, Samoila P, Airinei A, Olaru N, Rotaru A, et al. Cu/TiO2 composite nanofibers with improved photocatalytic performance under UV and UV–visible light irradiation. Surfaces and Interfaces. 2022;28:101644–58.10.1016/j.surfin.2021.101644Search in Google Scholar
[55] Singhal N, Selvaraj S, Sivalingam Y, Venugopal G. Study of photocatalytic degradation efficiency of rGO/ZnO nano-photocatalyst and their performance analysis using scanning Kelvin probe. J Environ Chem Eng. 2022;10(2):107293–304.10.1016/j.jece.2022.107293Search in Google Scholar
[56] Karuppasamy P, Nisha N, Pugazhendhi A, Kandasamy S, Pitchaimuthu S. An investigation of transition metal doped TiO2 photocatalysts for the enhanced photocatalytic decoloration of methylene blue dye under visible light irradiation. J Environ Chem Eng. 2021;9(4):105254–62.10.1016/j.jece.2021.105254Search in Google Scholar
[57] Paul A, Dhar SS. Construction of hierarchical MnMoO4/NiFe2O4 nanocomposite: Highly efficient visible light driven photocatalyst in the degradation of different polluting dyes in aqueous medium. Colloid Surface A. 2020;585:124090–9.10.1016/j.colsurfa.2019.124090Search in Google Scholar
[58] Sanguinetti S, Guzzi M, Gurioli M. In: 6 − Accessing structural and electronic properties of semiconductor nanostructures via photoluminescence. New York: Academic Press; 2008.10.1016/B978-0-444-53099-8.00006-3Search in Google Scholar
[59] Anpo M, Che M. Applications of photoluminescence techniques to the characterization of solid surfaces in relation to adsorption, catalysis, and photocatalysis. Adv Catal. 1999;44(2):119–257.10.1016/S0360-0564(08)60513-1Search in Google Scholar
[60] Stevanovic A, Buettner M, Zhang Z, Yates J. Photoluminescence of TiO2: Effect of UV light and adsorbed molecules on surface band structure. J Am Chem Soc. 2012;134(1):324–32.10.1021/ja2072737Search in Google Scholar PubMed
[61] Santos N, Rodrigues J, Pereira S, Fernandes A, Monteiro T, Costa F. Electrochemical and photoluminescence response of laser-induced graphene/electrodeposited ZnO composites. Sci Rep. 2021;11:17154–68.10.1038/s41598-021-96305-8Search in Google Scholar PubMed PubMed Central
[62] Kumari S, Gusain R, Kumar A, Manwar N, Khatri OP. Direct growth of nanostructural MoS2 over the h-BN nanoplatelets: An efficient heterostructure for visible light photoreduction of CO2 to methanol. J CO2 Util. 2020;42:101345–55.10.1016/j.jcou.2020.101345Search in Google Scholar
[63] Chang CJ, Teng MC, Chen J, Lin YG, Chen CY. Microwave solvothermal synthesis of cubic MnS@Ag2S core-shell photocatalysts with improved charge separation and photocatalytic activity. Appl Surf Sci. 2021;558:149875–84.10.1016/j.apsusc.2021.149875Search in Google Scholar
[64] Cen S, Lv X, Liu Q, Li D, Jiang Y, Hou C, et al. Direct Z-scheme Ag2WO4/BiOCl composite photocatalyst for efficient photocatalytic degradations of dissolved organic impurities. Optik. 2021;243:166847–56.10.1016/j.ijleo.2021.166847Search in Google Scholar
[65] Swaminathan V, Jayaraman A. Encyclopedia of Materials: Science and Technology. 2nd edn. New York: Academic Press; 2001. p. 8387–91.10.1016/B0-08-043152-6/01500-XSearch in Google Scholar
[66] Cantarero A. Raman scattering applied to materials science. Procedia Mater Sci. 2015;9:113–22.10.1016/j.mspro.2015.04.014Search in Google Scholar
[67] Du X, Liu D, An K, Jiang S, Wei Z, Wang S, et al. Advances in oxide semiconductors for surface enhanced Raman scattering. Appl Mater Today. 2022;29:101563.10.1016/j.apmt.2022.101563Search in Google Scholar
[68] Larkin PJ. Infrared and Raman Spectroscopy. Oxford: Academic Press; 2018. p. 1–5.10.1016/B978-0-12-804162-8.00001-XSearch in Google Scholar
[69] Marzi J, Brauchle E, Carvajal Berrio DA, Lee Layland S, Schenke K. 3.7 Raman Spectroscopy. Oxford: Academic Press; 2017. p. 108–27.10.1016/B978-0-12-803581-8.09323-1Search in Google Scholar
[70] Akshhayya C, Okla MK, Al-ghamdi AA, Abdel-Maksoud MA, AbdElgawad H, Das A, et al. Construction of S-scheme heterojunction CuFe2O4/α-MnO2 with tuned bandgap for enhanced white light harvesting: Insights of photoluminescence, Raman scattering and photocatalysis. Surfaces and Interfaces. 2021;27:101523.10.1016/j.surfin.2021.101523Search in Google Scholar
[71] Ribeiro-Claro P, Nolasco MM, Araújo C. Chapter 5 − Characterization of Microplastics by Raman Spectroscopy. Oxford: Academic Press; 2017. p. 119–51.10.1016/bs.coac.2016.10.001Search in Google Scholar
[72] Hurai V, Huraiová M, Slobodník M, Thomas R. Chapter 7 − Raman and Infrared Spectroscopic Analysis. Oxford: Academic Press; 2015. p. 231–79.10.1016/B978-0-12-803241-1.00007-1Search in Google Scholar
[73] Wolverson D. Chapter 17 - Raman Spectroscopy. Oxford: Academic Press; 2013. p. 753–802.10.1016/B978-0-444-59551-5.00017-0Search in Google Scholar
[74] Zhang M, Zhao S, Lu Q. Enhanced photocatalytic performance of silver–based solid solution heterojunctions prepared by hydrothermal method. Mat Sci Semicon Proc. 2018;85:52–8.10.1016/j.mssp.2018.05.034Search in Google Scholar
[75] Tristao JC, Magalhaes F, Corio P, Sansiviero MT. Electronic characterization and photocatalytic properties of CdS/TiO2 semiconductor composite. J Photoch Photobio A. 2006;181:152–7.10.1016/j.jphotochem.2005.11.018Search in Google Scholar
[76] Hamad H, Elsenety MM, Sadik W, El-Demerdash A, Nashed A, Mostafa A, et al. The superior photocatalytic performance and DFT insights of S-scheme CuO@TiO2 heterojunction composites for simultaneous degradation of organics. Sci Rep. 2022;12(1):2217–36.10.1038/s41598-022-05981-7Search in Google Scholar PubMed PubMed Central
[77] Dutta K, Sherley Saraffin R, Dutta B, Datta A, Kapuria A, Ghosh S, et al. Room temperature synthesis of GO/Ag2O nanocomposite: Broad spectral ranged solar photocatalyst and high efficacy antibiotic for waste water treatment. J Environ Chem Eng. 2022;10(2):107175–86.10.1016/j.jece.2022.107175Search in Google Scholar
[78] Hossain SS, Tarek M, Munusamy TD, Karim KM, Khan M. Facile synthesis of CuO/CdS heterostructure photocatalyst for the effective degradation of dye under visible light. Environ Res. 2020;188:109803–12.10.1016/j.envres.2020.109803Search in Google Scholar PubMed
[79] Grätzel M. Photoelectrochemical cells. Nature. 2001;414(6861):338–44.10.1038/35104607Search in Google Scholar PubMed
[80] Xiong D, Zhang Q, Verma SK, Bao XQ, Li H, Zhao X. Crystal structural, optical properties and mott-schottky plots of p-type Ca doped CuFeO2 nanoplates. Mater Res Bull. 2016;83:141–7.10.1016/j.materresbull.2016.05.031Search in Google Scholar
[81] Gelderman K, Lee L, Donne SW. Flat-Band Potential of a Semiconductor: Using the Mott-Schottky Equation. J Chem Educ. 2007;84(4):685–8.10.1021/ed084p685Search in Google Scholar
[82] Adán M, Silva T, Demourgues G, Montemor M. Application of the Mott-Schottky model to select potentials for EIS studies on electrodes for electrochemical charge storage. Electrochim Acta. 2018;289(1):47–55.10.1016/j.electacta.2018.08.077Search in Google Scholar
[83] Liu D, Feng L, Cao L, Xiao T, Huang J. W/O site replace by Ce/N of Bi2WO6 as cations/anions to regulate the reduction potential of conduction band for enhanced photocatalytic degradation and hydrogen evolution capacity. J Alloy Ccompd. 2022;890:161920–33.10.1016/j.jallcom.2021.161920Search in Google Scholar
[84] Cao J, Kako T, Peng L, Ouyang S, Ye J. Fabrication of p-type CaFe2O4 nanofilms for photoelectrochemical hydrogen generation. Electrochem Commun. 2011;13(3):275–8.10.1016/j.elecom.2011.01.002Search in Google Scholar
[85] Cardoso J, Stulp S, Brito J, Flor J, Frem J, Zanoni M. MOFs based on ZIF-8 deposited on TiO2 nanotubes increase the surface adsorption of CO2 and its photoelectrocatalytic reduction to alcohols in aqueous media. Appl Catal B:Environ. 2018;225(5):563–73.10.1016/j.apcatb.2017.12.013Search in Google Scholar
[86] Preethi LK, Antony RP, Mathews T, Walczak L, Gopinath CS. A Study on Doped Heterojunctions in TiO2 Nanotubes: An Efficient Photocatalyst for Solar Water Splitting. Sci Rep. 2017;7(1):14314–28.10.1038/s41598-017-14463-0Search in Google Scholar PubMed PubMed Central
[87] Yadav R, Verma V, Mishra A, Pal N, Khan A, Sinha AK. Si incorporated Pt nanoparticles on TixSi1-xO2 support: Photo-thermal CO2 reduction-ScienceDirect. J CO2 Util. 2021;47:101502–12.10.1016/j.jcou.2021.101502Search in Google Scholar
[88] Zhu L, Li H, Xia P, Liu Z, Xiong D. Hierarchical ZnO Decorated with CeO2 Nanoparticles as the Direct Z-Scheme Heterojunction for Enhanced Photocatalytic Activity. ACS Appl Mater Inter. 2018;10(46):39679–87.10.1021/acsami.8b13782Search in Google Scholar PubMed
[89] Ângelo J, Magalhães P, Andrade L, Mendes A. Characterization of TiO2-based semiconductors for photocatalysis by electrochemical impedance spectroscopy. Appl Surf Sci. 2016;387:183–9.10.1016/j.apsusc.2016.06.101Search in Google Scholar
[90] Jabbar Z, Graimed B, Okab A, Issa M, Ammar S, Khadim H, et al. A review study summarizes the main characterization techniques of nano-composite photocatalysts and their applications in photodegradation of organic pollutants. Environ Nanotechnolo, Monit Manage. 2023;19:100765–84.10.1016/j.enmm.2022.100765Search in Google Scholar
[91] Wang S, Zhang J, Gharbi O, Vivier V, Gao M, Orazem ME. Electrochemical impedance spectroscopy. Nat Rev Methods Primers. 2021;1(1):41–97.10.1038/s43586-021-00039-wSearch in Google Scholar
[92] Rooij M. Electrochemical Methods: Fundamentals and Applications. Anti-Corrosion Method M. 2003;50(5):A25.10.1108/acmm.2003.12850eae.001Search in Google Scholar
[93] Magar HS, Hassan RY, Mulchandani A. Electrochemical Impedance Spectroscopy (EIS): Principles, construction, and biosensing applications. Sensors. 2021;21(19):6578–98.10.3390/s21196578Search in Google Scholar PubMed PubMed Central
[94] Park SM, Yoo JS. Electrochemical impedance spectroscopy for better electrochemical measurements. Anal Chem. 2003;75(21):455A–61A.10.1021/ac0313973Search in Google Scholar
[95] Hauff EV. Impedance spectroscopy for emerging photovoltaics. J Phys Chem C. 2019;123(18):11329–46.10.1021/acs.jpcc.9b00892Search in Google Scholar
[96] Wu Q, Li Z, Zhang X, Xu C, Ni M, Cen K, et al. Oxygen-vacancy-anchoring NixOy loading towards efficient hydrogen evolution via photo-thermal coupling reaction. J Energy Chem. 2021;61:77–87.10.1016/j.jechem.2021.03.007Search in Google Scholar
[97] Yu H, Han Q. Effect of reaction mediums on photocatalytic performance of BiOX (X = Cl, Br, I). Opt Mater. 2021;119:111399–410.10.1016/j.optmat.2021.111399Search in Google Scholar
[98] Zhao H, Fu H, Yang X, Xiong S, Han D, An X. MoS2/CdS rod-like nanocomposites as high-performance visible light photocatalyst for water splitting photocatalytic hydrogen production. Int J Hydrogen Energ. 2022;47(13):8247–60.10.1016/j.ijhydene.2021.12.171Search in Google Scholar
[99] Wang J, Zeng H. Recent advances in electrochemical techniques for characterizing surface properties of minerals. Adv Colloid. Interface. 2021;288:102346–66.10.1016/j.cis.2020.102346Search in Google Scholar PubMed
[100] Surendra BS. Green engineered synthesis of Ag-doped CuFe2O4: Characterization, Cyclic Voltammetry and Photocatalytic studies. J Sci Adv Mater Devices. 2018;3(1):44–50.10.1016/j.jsamd.2018.01.005Search in Google Scholar
[101] Ming H, Zhang H, Ma Z, Huang H, Lian S, Wei Y, et al. Scanning transmission X-ray microscopy, X-ray photoelectron spectroscopy, and cyclic voltammetry study on the enhanced visible photocatalytic mechanism of carbon–TiO2 nanohybrids. Appl Surf Sci. 2012;258(8):3846–53.10.1016/j.apsusc.2011.12.043Search in Google Scholar
[102] Pletcher D, Greff R, Peat R, Peter LM, Robinson J. Instrumental Methods in Electrochemistry. United Kingdom: Woodhead Publishing; 2010. p. 178–228.10.1533/9781782420545.178Search in Google Scholar
[103] Zeng Y, Lu D, Kondamareddy KK, Wang H, Wu Q, Fan H, et al. Enhanced visible light photocatalysis and mechanism insight for novel Z-scheme MoS2/Ag2S/AgVOx ternary heterostructure with fast interfacial charges transfer. J Alloy Ccompd. 2022;908:164642–55.10.1016/j.jallcom.2022.164642Search in Google Scholar
[104] Zaman MB, Mir RA, Poolla R. Growth and properties of solvothermally derived highly crystalline Cu2ZnSnS4 nanoparticles for photocatalytic and electrocatalytic applications. Int J Hydrogrn Energ. 2019;44(41):23023–33.10.1016/j.ijhydene.2019.07.026Search in Google Scholar
[105] Bhuvanendran N, Ravichandran S, Xu Q, Maiyalagan T, Su H. A quick guide to the assessment of key electrochemical performance indicators for the oxygen reduction reaction: A comprehensive review. Int J Hydrogrn Energ. 2022;47(11):7113–38.10.1016/j.ijhydene.2021.12.072Search in Google Scholar
[106] Prasad MA, Sangaranarayanan MV. Analysis of the diffusion layer thickness, equivalent circuit and conductance behaviour for reversible electron transfer processes in linear sweep voltammetry. Electrochimica Acta. 2004;49(3):445–53.10.1016/j.electacta.2003.05.003Search in Google Scholar
[107] Yi J, Xu R, Wu Q, Zhang T, Zang K, Luo J, et al. Atomically Dispersed Iron-Nitrogen Active Sites within Porphyrinic Triazine-based Frameworks for Oxygen Reduction Reaction in Both Alkaline and Acidic Media. ACS Energy Lett. 2018;3(4):883–9.10.1021/acsenergylett.8b00245Search in Google Scholar
[108] Shan A, Huang S, Zhao H, Jiang W, Lau WM. Atomic-scaled surface engineering Ni-Pt nanoalloys towards enhanced catalytic efficiency for methanol oxidation reaction. Nano Res. 2020;13(11):1–10.10.1007/s12274-020-2978-3Search in Google Scholar
[109] Yin S, Xu Y, Liu S, Yu H, Wang Z, Li X, et al. Binary nonmetal S and P-co-doping into mesoporous PtPd nanocages boosts oxygen reduction electrocatalysis. Nanoscale. 2020;12(27):14863–9.10.1039/D0NR02686GSearch in Google Scholar
[110] Li Z, Xu S, Shi Y, Zou X, Lin S. Metal–Semiconductor Oxide (WO3@W) induces an efficient electro–photo synergistic catalysis for MOR and ORR. Chem Eng J. 2021;414:128814–24.10.1016/j.cej.2021.128814Search in Google Scholar
[111] Kanwal A, Sajjad S, Leghari S, Yousaf Z. Cascade electron transfer in ternary CuO/α-Fe2O3/γ-Al2O3 nanocomposite as an effective visible photocatalyst. J Phys Chem Solids. 2021;151(9):109899–912.10.1016/j.jpcs.2020.109899Search in Google Scholar
[112] Iqbal N. Tailoring g-C3N4 with lanthanum and cobalt oxides for enhanced photoelectrochemical and photocatalytic activity. Catalysts. 2022;12(1):15–33.10.3390/catal12010015Search in Google Scholar
[113] Ahmed AI, Kospa DA, Gamal S, Samra SE, Salah AA, El-Hakam SA, et al. Fast and simple fabrication of reduced graphene oxide-zinc tungstate nanocomposite with enhanced photoresponse properties as a highly efficient indirect sunlight driven photocatalyst and antibacterial agent. J Photochem Photobiol A. 2022;429:113907–18.10.1016/j.jphotochem.2022.113907Search in Google Scholar
[114] Wang XT, Lin XF, Yu DS. Metal-containing covalent organic framework:a new type of photo/electrocatalyst. Rare Met. 2022;41:1160–75.10.1007/s12598-021-01873-3Search in Google Scholar
[115] Hiesgen R, Meissner D. Nanoscale photocurrent variations at metal-modified semiconductor surfaces. J Phys Chem B. 1998;102(34):6549–57.10.1021/jp9816420Search in Google Scholar
[116] Ma X, Mai M, Lin H, Zeng L, Zhang J, Zhou H, et al. A novel electrochemical method for simultaneous measurement of real-time potentials and photocurrent of various photoelectrochemical systems. J Power Sources. 2019;415:99–104.10.1016/j.jpowsour.2019.01.066Search in Google Scholar
[117] Song SB, Yoon S, Kim SY, Yang S, Seo SY, Cha S, et al. Deep-ultraviolet electroluminescence and photocurrent generation in graphene/hBN/graphene heterostructures. Nat Commun. 2021;12:7134–42.10.1038/s41467-021-27524-wSearch in Google Scholar PubMed PubMed Central
[118] Zheng L, Han S, Hui L, Yu P, Fang X. Hierarchical MoS2 Nanosheet@TiO2 Nanotube Array Composites with Enhanced Photocatalytic and Photocurrent Performances. Small. 2016;12(11):1527–36.10.1002/smll.201503441Search in Google Scholar PubMed
[119] Tian R, King PJ, Coelho J, Park SH, Horvath D, Nicolosi V, et al. Using chronoamperometry to rapidly measure and quantitatively analyse rate-performance in battery electrodes. J Power Sources. 2020;468:228220–30.10.1016/j.jpowsour.2020.228220Search in Google Scholar
[120] Jungner EW. Electrode for reversible galvanic batteries. Application granted granted Critical. 1908;14:884903.Search in Google Scholar
[121] Shi H, Li Y, Wang K, Li S, Wang X, Wang P, et al. Mass-transfer control for selective deposition of well-dispersed AuPd cocatalysts to boost photocatalytic H2O2 production of BiVO4. Chem Eng J. 2022;443:136429–37.10.1016/j.cej.2022.136429Search in Google Scholar
[122] Xiang L, Gao F, Yong Y, Wang T. A facile electrochemical approach To Form TiO2/Ag heterostructure films with enhanced photocatalytic activity. Ind Eng Chem Res. 2015;55(1):107–15.10.1021/acs.iecr.5b02867Search in Google Scholar
[123] Oheda H. Analysis of the modulated photocurrent in amorphous semiconductors. Solid State Commun. 1980;33(2):203–6.10.1016/0038-1098(80)90354-3Search in Google Scholar
[124] Xu H, Rebollar D, He H, Chong L, Liu Y, Liu C, et al. Highly selective electrocatalytic CO2 reduction to ethanol by metallic clusters dynamically formed from atomically dispersed copper. Nat Energy. 2020;5(8):623–32.10.1038/s41560-020-0666-xSearch in Google Scholar
[125] Markovskaya DV, Zhurenok AV, Cherepanova SV, Kozlova EA. Solid solutions of CdS and ZnS: Comparing photocatalytic activity and photocurrent generation. Appl Surface Sci Adv. 2021;4:100076–83.10.1016/j.apsadv.2021.100076Search in Google Scholar
[126] Cheng Y, Zhang J, Chen C, Xiong X, Zeng J, Xi J, et al. A novel 2D/2D MoSe2/SnSe heterojunction photocatalyst with large carrier transmission channel shows excellent photoelectrochemical performance. Appl Surf Sci. 2021;563:150311–9.10.1016/j.apsusc.2021.150311Search in Google Scholar
[127] Men X, Chen H, Chang K, Fang X, Wu C, Qin W, et al. Three-dimensional free-standing ZnO/graphene composite foam for photocurrent generation and photocatalytic activity. Appl Catal B-Envir. 2016;187:367–74.10.1016/j.apcatb.2016.01.052Search in Google Scholar
[128] Wang L, Dong Y, Yan T, Hu Z, Ali F, Meira D, et al. Black indium oxide a photothermal CO2 hydrogenation catalyst. Nat Commun. 2020;11:2432–9.10.1038/s41467-020-16336-zSearch in Google Scholar PubMed PubMed Central
[129] Tiwari S, Kumar S, Ganguli AK. Role of MoS2/rGO co-catalyst to enhance the activity and stability of Cu2O as photocatalyst towards photoelectrochemical water splitting. J Photochem Photobiolol A. 2022;424:113622–30.10.1016/j.jphotochem.2021.113622Search in Google Scholar
© 2025 the author(s), published by De Gruyter
This work is licensed under the Creative Commons Attribution 4.0 International License.
Articles in the same Issue
- Research Articles
- Impressive stability-indicating RP-HPLC method for concurrent quantification of salbutamol, guaifenesin, and sodium benzoate in cough syrup: Application of six sigma and green metrics
- Bioanalytically validated potentiometric method for determination of bisphenol A: Application to baby bibs, pacifiers, and Teethers’ saliva samples
- Environmental impact of RP-HPLC strategy for detection of selected antibiotics residues in wastewater: Evaluating of quality tools
- Trace-level impurity quantification in lead-cooled fast reactors using ICP-MS: Methodology and challenges
- Picogram-level detection of three ACE inhibitors via LC–MS/MS: Comparing BMP and UOSA54 derivatization methods
- Eco-friendly RP-HPLC method for concurrent estimation of a promising combination of methocarbamol and etoricoxib in rat plasma
- Development of a point-of-care testing sensor using polypyrrole/TiO2 molecular imprinting technology for cinchocaine determination
- Green and sustainable RP-UPLC and UV strategies for determination of metformin and dapagliflozin: Evaluation of environmental impact and whiteness
- Review Articles
- Determination of montelukast and non-sedating antihistamine combination in pharmaceutical dosage forms: A review
- Extraction approaches for the isolation of some POPs from lipid-based environmental and food matrices: A review
- A review of semiconductor photocatalyst characterization techniques
- Analytical determination techniques for lithium – A review
- Fourier transform infrared spectroscopy study of polymer/filler/ionic liquid composites