Environmental impact of RP-HPLC strategy for detection of selected antibiotics residues in wastewater: Evaluating of quality tools
-
Bandar R. Alsehli


Abstract
It is risky for the environment and public health to have antibiotic residues in wastewater from agricultural sources, such as poultry slaughterhouses and rabbit farms. The goal of the present investigation is to use ten sustainability metrics to create an accurate and environmentally friendly high-performance liquid chromatography approach for the detection of oxytetracycline, tetracycline, and cephradine residues in wastewater from poultry slaughterhouses, rabbit farms, and pharmaceutical factories. A mobile phase consisting of phosphate buffer solution pH 4.2 (45%) and 55% methanol was used with a C18 column (4.6 mm i.d., 250 mm, 5 µm, Agilent Co.) to accomplish the separation, with a 1.0 mL·min−1 flow rate and UV detection at 257 nm. The calibration curves exhibited linearity and covered concentration ranges of 2–50, 0.3–10, and 1–45 µg·mL−1. The correlation coefficient was 0.9999, while accuracy results varied between 85% and 115%. The current work’s accuracy was assessed using the Six Sigma approach, which revealed a process capability index exceeding 1.3%. The latest investigation proposes the Blue Applicability Grade Index, a new technique that improves environmental metrics in real-world analytical chemistry. The procedures underwent effective validation per International Council for Harmonization standards.
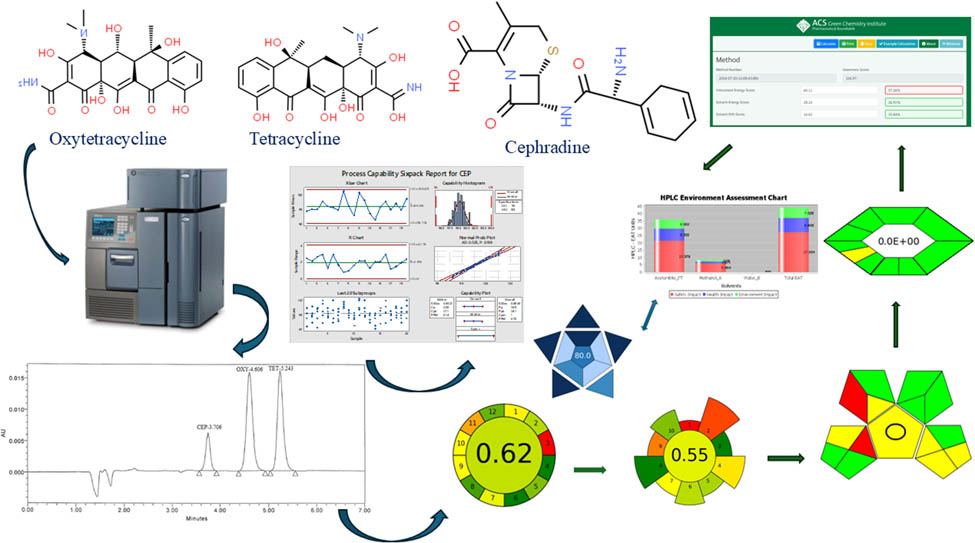
Graphical abstract
1 Introduction
Public health risks are associated with antibiotic residues in wastewater, as well as environmental effects. Dispersal of these residues can produce antibiotic-resistant bacteria in water systems, causing antibiotic-resistant bacteria proliferation in humans [1,2]. Investigation has indicated that seasonal variations exist in the amount of antibiotic residues found in environmental samples. For example, elevated concentrations of specific antibiotics, like enrofloxacin, have been observed in meat samples throughout the spring. Sewage from agricultural sources may contain residues of cephradine (CEP), oxytetracycline (OXY), and tetracycline (TET) in varying quantities due to seasonal changes [3]. For public health and environmental reasons, detecting OXY, TET, and CEP residues in poultry slaughterhouse wastewater is crucial. Analyzing residues using advanced detection methods is possible through chromatography, capillary electrophoresis, immunological techniques, and biosensors. In veterinary and human medicine, CEP’s broad spectrum activity against bacteria makes it one of the most widely prescribed first-generation cephalosporin antibiotics. As a result of its frequent use, it is present in wastewater systems. Due to its use to treat bacterial infections, it is often detected in hospital effluents and municipal wastewater. TET and OXY are two antibiotics in the TET class extensively used in human and animal medicine. Since they are widely used in agriculture and aquaculture, they are common environmental contaminants [4]. Agricultural runoff and wastewater from livestock farming contain these compounds and are used to promote growth and treat animals. Antibiotics like these are listed on the Watch List of the European Union’s Water Framework Directive because they may pose a safety risk. To effectively assess treatment effectiveness and mitigate environmental impact, it is essential to detect and quantify them in wastewater [5,6,7,8]. To mitigate risks related to antibiotic resistance, it is necessary to monitor antibiotic contamination continuously and implement effective waste management practices. Livestock use antibiotics to prevent sickness and encourage growth. Nevertheless, excessive use leaves residues in animal feces, whose wastewater can then be released into the environment. Public health may be at risk due to this contamination’s potential to foster antibiotic-resistant bacteria [9].
During the last two decades, sustainable chemistry has gained significant attention. Chemical reactions can be made more environmentally friendly and safer by using renewable resources. As chemistry moves towards green and sustainable practices, developing sustainable chemical processes and managing them effectively is imperative [10]. An innovative approach to chemical research and engineering emphasizes green and white chemistry principles. The method’s integrated approach ensures unmatched protection against dangerous substances when it comes to chemical processes and products [11]. Using green and white chemistry, scientists and engineers can design environmentally friendly, long-lasting, and sustainable products and processes [12]. It is essential to evaluate HPLC procedures ecologically in order to determine whether or not they are eco-friendly [13]. Several tools were used to assist this investigation, including Blue Applicability Grade Index (BAGI) and RGB. Several other environmental sustainability analyses have also been created, including the complementary green analytical procedure index (ComplexGAPI), analytical GREEnness (AGREE), analytical method greenness score (AMGS), green analytical procedure index (GAPI), high-performance liquid chromatography environmental assessment tool (HPLC-EAT), analytical greenness metric for sample preparation (AGREEprep), analytical method volume intensity (AMVI), and the analytical Eco-Scale (ESA) [14].
In the pharmaceutical industry, Lean Six Sigma has become one of the most commonly discussed topics, so manufacturers will implement it to reduce operational costs, reduce waste, predict errors during every stage of the process, eliminate defects, and ensure that production processes will still be capable during the process [15,16].
OXY and TET are commonly used antibiotics in the production of chickens and rabbits (Figure 1a and b). Compared to TET, CEP, a cephalosporin antibiotic, is less frequently examined in environmental samples (Figure 1c). Nonetheless, only a few techniques were available for identifying veterinary antimicrobial medicines in wastewater using LC-MS/MS. One such method involved the analysis of 92 compounds belonging to eight different classes [17]. A single appropriate HPLC-MS/MS technique for identifying sulfachloropyridazine, enrofloxacin, and OXY residues in lettuce plants [18]. An HPLC-DAD procedure has been described for the quantification of OXY, TET, chlorotetracycline, doxycycline, enrofloxacin, ciprofloxacin, sarafloxacin, and flumequine residues in animal drinking water [19]. Furthermore, a study reported the identification of OXY and chloramphenicol in untreated wastewater effluents using RP-HPLC technology [20]. Hassouna and Mohamed developed a highly effective HPLC technique to detect cephalosporin residues on stainless-steel plates and human plasma that had been intentionally contaminated [21].

Chemical structure of (a) OXY, (b) TET, and (c) CEP.
No documented techniques for detecting OXY, TET, and CEP residues in wastewater from chicken slaughterhouses, rabbit farms, and pharmaceutical factories are available. A primary objective of this study is to resolve this inconsistency by developing a cutting-edge, effective, and environmentally friendly HPLC method that utilizes principles of white and green chemistry to rapidly and accurately identify traces of OXY, TET, and CEP in wastewater originating from poultry slaughterhouses, rabbit farms, and pharmaceutical factories. We have employed eight dependable evaluation tools to assess the ecological sustainability of our processes: GAPI, ESA, AMGS, AGREE, HPLC-EAT, AGREEprep, ComplexGAPI, and AMVI. In addition to widely recognized environmentally friendly initiatives, the White analytical chemistry metric BAGI serves as a valuable complement. The results confirm our method’s ecological sustainability. The method’s accuracy was assessed utilizing an exclusive Six Sigma approach. This demonstrated that the proposed HPLC method provides a fast, sensitive, and dependable approach.
2 Materials and methods
2.1 Chemicals and reagents
HP Pharmaceuticals (located in Beni Suef, Egypt) supplied OXY, TET, and CEP. Scharlau, a company based in Barcelona, Spain, supplied HPLC-grade methanol and acetonitrile, as well as analytical-grade potassium dihydrogen phosphate, magnesium sulfate, and sodium chloride.
2.2 Apparatuses
The Waters Alliance e2695 Separations Module is a liquid chromatographic system with an inline vacuum degasser and quaternary mixing pump. The detector is a photodiode array (model 2996) that can detect wavelengths ranging from 190 to 800 nm. It has sensitivity settings that may measure absorbance units from 0.0001 to 2.0000. The PDA detector was set to monitor the analytes at their respective maximum absorption wavelengths. Additionally, it has Empower 3 software.
2.3 Sample preparation
Environmental Protection Agency (EPA) guidelines [22] were followed in collecting wastewater samples from Cairo Poultry slaughterhouse, which were filtered and stored at 4°C after filtration in amber glass bottles with Teflon caps. Additional wastewater samples were obtained from a privately owned rabbit farm located in Giza, Egypt. The source of the third wastewater sample was High-Performance Pharma, which is based in Beni Suef, Egypt. The process of extracting the wastewater samples involved adding 10 mL of acetonitrile in a 1:1 ratio with the samples, vortex-mixing for 30 min, adding 1,000 mg of magnesium sulfate and 250 mg of sodium chloride, vortex-mixing for 1 min, then centrifuging for 5 min at 5,000 rpm. After transferring 1 mL of the supernatant to a 10-mL centrifuge tube with 50 milligrams of crystalline silica gel and 150 mg of magnesium sulfate, vortex-mix for a minute and centrifuge at 6,000 rpm for an additional minute. Before being injected into the HPLC system, The supernatant is decanted, the residue is dissolved in 1 mL of mobile phase, then filtered through a 0.45 µm nylon membrane filter.
2.4 HPLC condition
The reversed-phase high-performance liquid chromatography (RP-HPLC) procedures under research utilized the isocratic mode to establish the optimal system. The RP-HPLC techniques utilized an Agilent Zorbax C18 column with dimensions of 250 × 0.46 cm and a particle size of 5 μm. The sample temperature was maintained at 4°C, while the column oven temperature was set to 25°C. A mobile phase consisting of phosphate buffer solution pH 4.2 and methanol (45:55, v/v) was used in an RP-HPLC procedure. The approach featured a runtime of 2 min, an injection volume of 10 μL, a flow rate of 1.0 mL·min−1, and UV detection at 257 nm.
2.5 Construction of calibration curves
The investigators performed serial dilutions by transferring aliquots from a stock solution of known concentration into a 10 mL volumetric flask. The HPLC approach yielded concentration ranges of 2–50, 0.3–10, and 1–45 µg·mL−1 for OXY, TET, and CEP, respectively. The process entails several injections to set up the system, assess its suitability, verify calibration, evaluate potential carryover, and perform the necessary tests. This includes one injection for system setup, five injections to assess suitability, a recovery injection to verify calibration, two injections for two-point calibration, two injections for each test, and two injections of the standard check to close the system. The relationship between the concentration and the integrated peak areas was established using regression equations.
2.6 Utilization of the Lean Six Sigma technique
The Cpk is a measure of the precision and accuracy of analytical procedures used in analytical chemistry. CpK was calculated for evaluating the precision and capability of the analytical method. In statistics, CpK measures how well a process meets specified tolerance limits. Both the variability of the method and its alignment with the target value can be assessed by this method. This formula is used to calculate CpK:
where USL is the upper specification limit, LSL is the lower specification limit, μ is the mean of the process, and σ is the standard deviation of the process
CpK values above 1.33 generally indicate better precision and capability, with values over 1.33 generally considered acceptable. By using CpK, we demonstrated the method’s reliability and suitability for routine analyses, demonstrating that it consistently produced results within the predefined acceptance limits. By exhibiting a method’s dependability and uniformity within predetermined bounds, it assesses the method’s efficiency. When the Cpk value is high, the process works around its specified center limit even when severe oscillations are present. On the other hand, a low CpK shows that the process needs to be enhanced. Cpk values of 1.33 (equivalent to 4 sigma) are recommended to satisfy most customers’ expectations. In this study, we examine whether a particular methodology is statistically significant in achieving predetermined norms or specifications. Our analysis of the accuracy results for the investigated drugs, expressed as recovery percentages, is compared to those provided. Statistical analyses and Cpk values were computed using Minitab® 18 software (Minitab, LLC, USA) [23,24,25,26].
2.7 Sustainability technique evaluation
2.7.1 ESA
To get the eco-scale score, all of the penalty points were taken from the analytical test and subtract 100 from the total. If one follows the worldwide system for naming and classifying chemicals, penalty points can be given depending on the chemical utilized in the analytical process. The quantity of pictograms and signal words may vary across solvents or compounds. The signal word multiplied by the number of solvent or reagent pictograms determines the penalty points. It is then possible to place this final computed score on a scale. There is a distinct meaning for each score value. If the analytical procedure gets a score of 75 or more, it means that the test was very environmentally friendly. If the analytical technique scores 50–75, the assay is considered to be sufficiently green. A score below 50 suggests there is not enough greenness [27].
2.7.2 GAPI
GAPI can be utilized to evaluate the environmental sustainability of several aspects of a certain analytical technique. The five pentagrams of the GAPI pictogram can provide both qualitative and quantitative data regarding the level of greenness in the associated assay. GAPI is a simple and direct Green analytical chemistry (GAC) meter. The GAPI pictogram employs a color gradient with three distinct levels to visually represent the degree of greenness associated with successive stages of the comprehensive analytical process. According to the color scheme, green, yellow, and red indicate a low, medium, or high environmental or health impact of the analytical method. Each pentagram within the GAPI symbol corresponds to distinct components of the associated analytical experiment [28,29]. If the necessary conditions are satisfied, the pertinent section should be emphasized in green. Suppose the presence of a yellow or red signal is not observed. In that case, it indicates that the linked analytical test has a moderate to severe impact on environmental or human health in the relevant segment of the pentagram [30].
2.7.3 AGREE
AGREE is a user-friendly and comprehensive program that assesses the environmental consequences of analytical tests and provides concise and easily comprehensible information. The AGREE metric is calculated by applying the 12 GAC principles and converting them into a scale ranging from 0 to 1. Furthermore, the ultimate score of the GAC metric is determined by assessing these 12 GAC criteria. The central region of the pictogram is comprised of 12 segments that represent the 12 principles of the GAC [31]. The segment widths of the AGREE pictogram indicate the relative importance assigned to each topic. Additionally, the segments of the AGREE symbol can transition from a dark green color to red. By applying the 12 GAC principles, the AGREE pictogram provides a clear assessment of the environmental sustainability of the analytical test [32].
2.7.4 AGREEprep
Constructed to close the gap, AGREEprep is a comprehensive metric for GAC based on the 10 principles of Green sample preparation (GSP). It carefully assesses, in compliance with GSP requirements, how environmentally friendly sample preparation techniques are. A sample preparation location, a solvent and material sustainability and safety assessment, reducing waste, integrating and automating processes, reducing sample volume, increasing sample processing capacity, reducing energy consumption, and choosing environmentally friendly post-preparation options are just a few of the criteria considered. Based on the ten GSP criteria listed above, a scoring range of 0–1 is applied. Additionally, a thorough evaluation of the degree to which each of the ten GSP principles is followed influences the GAC score [33].
2.7.5 BAGI
A newly developed GAC metric known as BAGI assesses the viability and environmental friendliness of analytical techniques. Analytical chemistry principles form the basis of BAGI’s greenness assessment analytical technique. BAGI utilizes a symbol, a color gradient, and a numerical score to depict the level of environmental friendliness of the examined assays. We score the GAC metric on a scale from 25 to 100. A greater score on the BAGI meter signifies superior assay greenness. To assess the feasibility and eco-friendliness of different tests, the BAGI metric incorporates ten elements [34].
2.7.6 ComplexGAPI
The ComplexGAPI approach employs a semi-quantitative procedure. The subsequent instances show how to use ComplexGAPI to assess the greenness level in various tests. In addition to refining GAPI, Wojnowski and Płotka-Wasylka created and enhanced ComplexGAPI. To improve the original output chart, an additional hexagonal pictogram showing the degree of greenness of the several analytical processes before sample preparation and final detection was added. The pictogram’s hexagon shape is filled with important details [35].
2.7.7 AMGS
One way to quantify GAC is with an AMGS metric, suggest Hicks et al. The AMGS scores determine the green status of analytical assays. A lower number indicates better greenness in the studied assay. Waste production, energy consumption of instruments, safety, health, and the environmental impact of analytical reagents are some of the elements that go into this metric’s greenness score [36].
2.7.8 AMVI
The majority of observers agree that AMVI is the most accurate and thorough method available for assessing chromatographic processes. It measures the amount of waste produced during the process by using solvents and waste products. The evaluation of a procedure’s solvent consumption takes into account both sample preparation and HPLC solvents. Add the amounts utilized for sample preparation and HPLC processes to get the total amount of solvent used. We use the standard preparation volume to calculate the solvent needed for the preparation, taking into account the quantity of each preparation and the total volume in the system suite. AMVI uses HPLC analysis to provide accurate results. To determine the overall solvent consumption in a given peak region, multiply the solvent consumption in each location. A reduction in the AMVI value increases the chances of achieving sustainability. The calculation of volume intensity involves multiplying the concentration of an analyte by its consumption. We used a small amount of the solvent to prepare the samples for HPLC [37].
2.7.9 HPLC-EAT
Provided is a quick and easy way to assess how HPLC processes affect the environment. To compare how environmentally friendly various chromatographic processes are, this EAT takes into account the effects that each solvent has on safety, health, and the environment. The result is a total score. HPLC-EAT has effectively used several HPLC methods from published work, including preparative and analytical chromatography. Following functional verification, the tool was integrated with another eco-solvent product, a free application for life cycle assessments of waste disposal alternatives such as burning and distillation. Often used to develop methods for assessing sustainability, HPLC-EAT can also meet the traditional requirements of accuracy, robustness, and repeatability [38].
3 Results
The study selected HPLC as the method for tracking three antibiotics (OXY, TET, and CEP) in pharmaceutical wastewater, chicken slaughter, and rabbit farms.
3.1 Methods development and optimization
A novel RP-HPLC method was developed to assess the targeted analytes in wastewater from poultry slaughter, rabbit farms, and pharmaceutical factories by utilizing distinct mobile phase compositions. Preliminary experiments were carried out to ascertain the optimal parameters for establishing an efficient methodology for pharmaceutical analysis. Modifications were implemented in the detector wavelength, column temperature, and mobile phase composition to optimize separation and precision. Multiple studies were conducted to change the composition of the mobile phase experimentally. The experiment commenced with a volumetric ratio of water to methanol of 50:50. The concentration of the organic modifier (methanol) was systematically changed between 45 and 65% using neutral and acidic water. The mobile phase was observed to have a significant impact on the separation process. Higher methanol levels led to longer retention durations, while increasing the amount of water eventually caused the three components to combine. The longer duration of drug retention while using larger concentrations of organic modifiers may be attributed to the methanolysis of medicines at elevated methanol levels.
Additionally, because of the ionization of chemicals, basic pH was not effective at resolving components. A high degree of dependability exists between analytes and their ionization states in the presence of a low pH mobile phase. The ionization of many analytes is increased in alkaline (basic) conditions, particularly for those with acidic functional groups. As a result of this ionization, they are less likely to interact with the hydrophobic stationary phase (e.g., C18), leading to poor retention and resolution. In contrast, analytes that have basic functional groups remain protonated under acidic conditions, enhancing their retention on stationary phases. Based on these results, basic pH was ineffective for resolving components because ionization disrupted the interaction of the analytes with the stationary phase and contributed to co-elution.
Analytes are more likely to be retained and separated when they are protonated, which can be achieved by using phosphate buffer solution (modified with formic acid) in a mobile phase. By increasing the concentration of formic acid, stronger interactions with the stationary phase and enhanced protonation increased the retention of analytes. While maintaining a pH within a stable range to ensure stable ionization states, separation efficiency remained unaffected.
A 55% methanol and 45% phosphate buffer solution pH 4.2 produced a good separation in a reasonable amount of time. The retention increased as formic acid’s potency increased, although separation was unaffected. The mobile phase combining 55% methanol with 45% phosphate buffer solution pH 4.2 (modified with formic acid) allowed a good separation to be achieved in a reasonable timeframe. Analytes interacted more efficiently with the stationary phase when formic acid was added, as it promoted protonation of the analytes. The experiment also made use of packaging materials and columns of varying lengths. The columns ranged in length from 50 to 250 mm and contained C8, phenyl, and cyano. It was found that the C18 stationary phase had the best hydrophobic interaction with the analytes, which resulted in better retention and resolution as compared to the other columns investigated. Despite being similar, the C8 column demonstrated weaker retention, while the phenyl and cyano columns showed different selectivity patterns that were less effective. The Agilent Zorbax C18 column (25 × 0.46 cm, 5 μm) was the best choice. The column was heated to a temperature of 20–40°C. An important factor in drug separation is elevated temperatures. Our method optimization included testing buffer solutions at different pH values (e.g., pH 4, 6, and 8) to assess their impact on extraction efficiency. Based on the results, pH 4.2 provided the highest recovery rates and reproducibility. Maintaining the samples at 4°C during analysis ensured the stability of the analytes. Obtaining reproducible retention times and peak shapes requires a consistent column temperature. As a result of our optimization studies, 25°C provided the highest separation efficiency for the target analytes. Chromatographic performance can be improved by higher temperatures for some compounds, but sensitive analytes may be degraded by high temperatures. By keeping the column at 25°C, the antibiotics remained stable during analysis.
Additionally impacted are the crucial processes of drug separation and degradation. Consequently, the suggested procedures determined that the ideal separation temperatures for the sample and column oven were 4°C and 25°C, respectively. We investigated wavelengths in the 200–400 nm range using spectrophotometry. The highest sensitivity and exceptional intensity at 257 nm, along with the biggest absorbances at 254 and 280 nm, led to the selection of OXY, TET, and CEP. For the RP-HPLC process, acidic water and methanol were mixed in a 45:55 (v/v) ratio. A pH of 4.2 was set for the mixture. Seven minutes were spent performing the operation with an injection volume of 10 μL, a flow rate of 1.0 mL·min−1, and UV detection at 257 nm. Figure 2 demonstrates the enhanced efficiency and speed in resolving these problems by adopting the chromatographic condition with the shortest duration of less than six minutes.


HPLC chromatograms of antibiotic residues of (a) ternary mixture, (b) OXY and TET in poultry slaughter wastewater, (c) rabbit farms wastewater, and (d) pharmaceutical factory wastewater.
There are essential factors for choosing acetonitrile, magnesium stearate, and sodium chloride in the drug extraction technique; its excellent solvent properties make acetonitrile useful for drug extraction, especially because it dissolves a wide variety of compounds, including both polar and nonpolar compounds. Furthermore, it can be analyzed using many analytical techniques, including HPLC and MS [39]. An extraction solvent such as magnesium stearate protects the extraction apparatus from sticking to the surface by acting as a lubricant. By doing so, the extraction process becomes more efficient, resulting in higher yields for target compounds [40]. A process known as “salting out” utilizes sodium chloride to enhance extraction efficiency. By increasing ionic strength in the aqueous phase, this technique reduces the drug’s solubility in water and promotes its transfer into organic matter. Several extraction cycles were performed to ensure complete drug extraction, and the drug concentration in the extract was measured by HPLC to ensure high extraction efficiency [41]. Several extractions were conducted without noticeable increases in concentration. Additionally, a known standard was used to check the recovery rate of our extraction method.
3.2 Evaluation of the quality tools
The accuracy findings are expressed as the percentage recovery of the suggested technique using the Cpk method. As shown in Tables 1–3, X-bar and R charts, measured by quality tools, demonstrate that all data points fall within the control limits, as indicated by the Cpk report. According to the latest plot of the last 20 subgroups, the data are distributed randomly and uniformly around the processing center. Histograms, average probabilities, and capability plots indicate that the procedure is roughly centered around the goal. The Cpk values for OXY, TET, and CEP in the proposed approach exceed 1.33. Nevertheless, the suggested approach demonstrates higher accuracy, as indicated by the Cpk values of 1.36 and 1.64 for OXY and TET (Figure 3a and b), in contrast to the Cpk values of 1.76 for CEP (Figure 3c), respectively. In summary, these results indicate that the suggested approach can greatly improve the exactness and correctness of future studies.
Descriptive statistics of accuracy outcomes of the demonstrated HPLC process for OXY
| Variable | N | N* | Mean | SE mean | StDev | Variance | CoefVar | Sum | Sum of squares |
|---|---|---|---|---|---|---|---|---|---|
| OXY | 100 | 0 | 99.580 | 0.112 | 1.118 | 1.249 | 1.12 | 9,958.000 | 991,741.280 |
| Variable | Minimum | Q1 | Median | Q3 | Maximum | Range | IQR | Mode | N for mode | Skewness |
|---|---|---|---|---|---|---|---|---|---|---|
| OXY | 96.800 | 98.800 | 99.600 | 100.500 | 101.800 | 5.000 | 1.700 | 100 | 12 | −0.19 |
| Variable | Kurtosis |
|---|---|
| OXY | −0.62 |
Descriptive statistics of accuracy outcomes of the demonstrated HPLC process for TET
| Variable | N | N* | Mean | SE mean | StDev | Variance | CoefVar | Sum | Sum of squares |
|---|---|---|---|---|---|---|---|---|---|
| TET | 100 | 0 | 99.291% | 0.0915 | 0.915 | 0.837 | 0.92 | 9,929.100 | 985,953.130 |
| Variable | Minimum | Q1 | Median | Q3 | Maximum | Range | IQR | Mode | N for mode | Skewness |
|---|---|---|---|---|---|---|---|---|---|---|
| TET | 97.100% | 98.625% | 99.250% | 100.000% | 101.300% | 4.200 | 1.375 | 99% | 15 | −0.02 |
| Variable | Kurtosis |
|---|---|
| TET | −0.50 |
Descriptive statistics of accuracy outcomes of the demonstrated HPLC process for CEP
| Variable | N | N* | Mean | SE mean | StDev | Variance | CoefVar | Sum | Sum of squares |
|---|---|---|---|---|---|---|---|---|---|
| CEP | 100 | 0 | 99.269% | 0.0885 | 0.885 | 0.782 | 0.89 | 9,926.900 | 985,510.890 |
| Variable | Minimum | Q1 | Median | Q3 | Maximum | Range | IQR | Mode | N for mode | Skewness |
|---|---|---|---|---|---|---|---|---|---|---|
| CEP | 97.200 | 98.700% | 99.300% | 99.975% | 101.200% | 4.000 | 1.275 | 99% | 14 | 0.03 |
| Variable | Kurtosis |
|---|---|
| CEP | −0.14 |
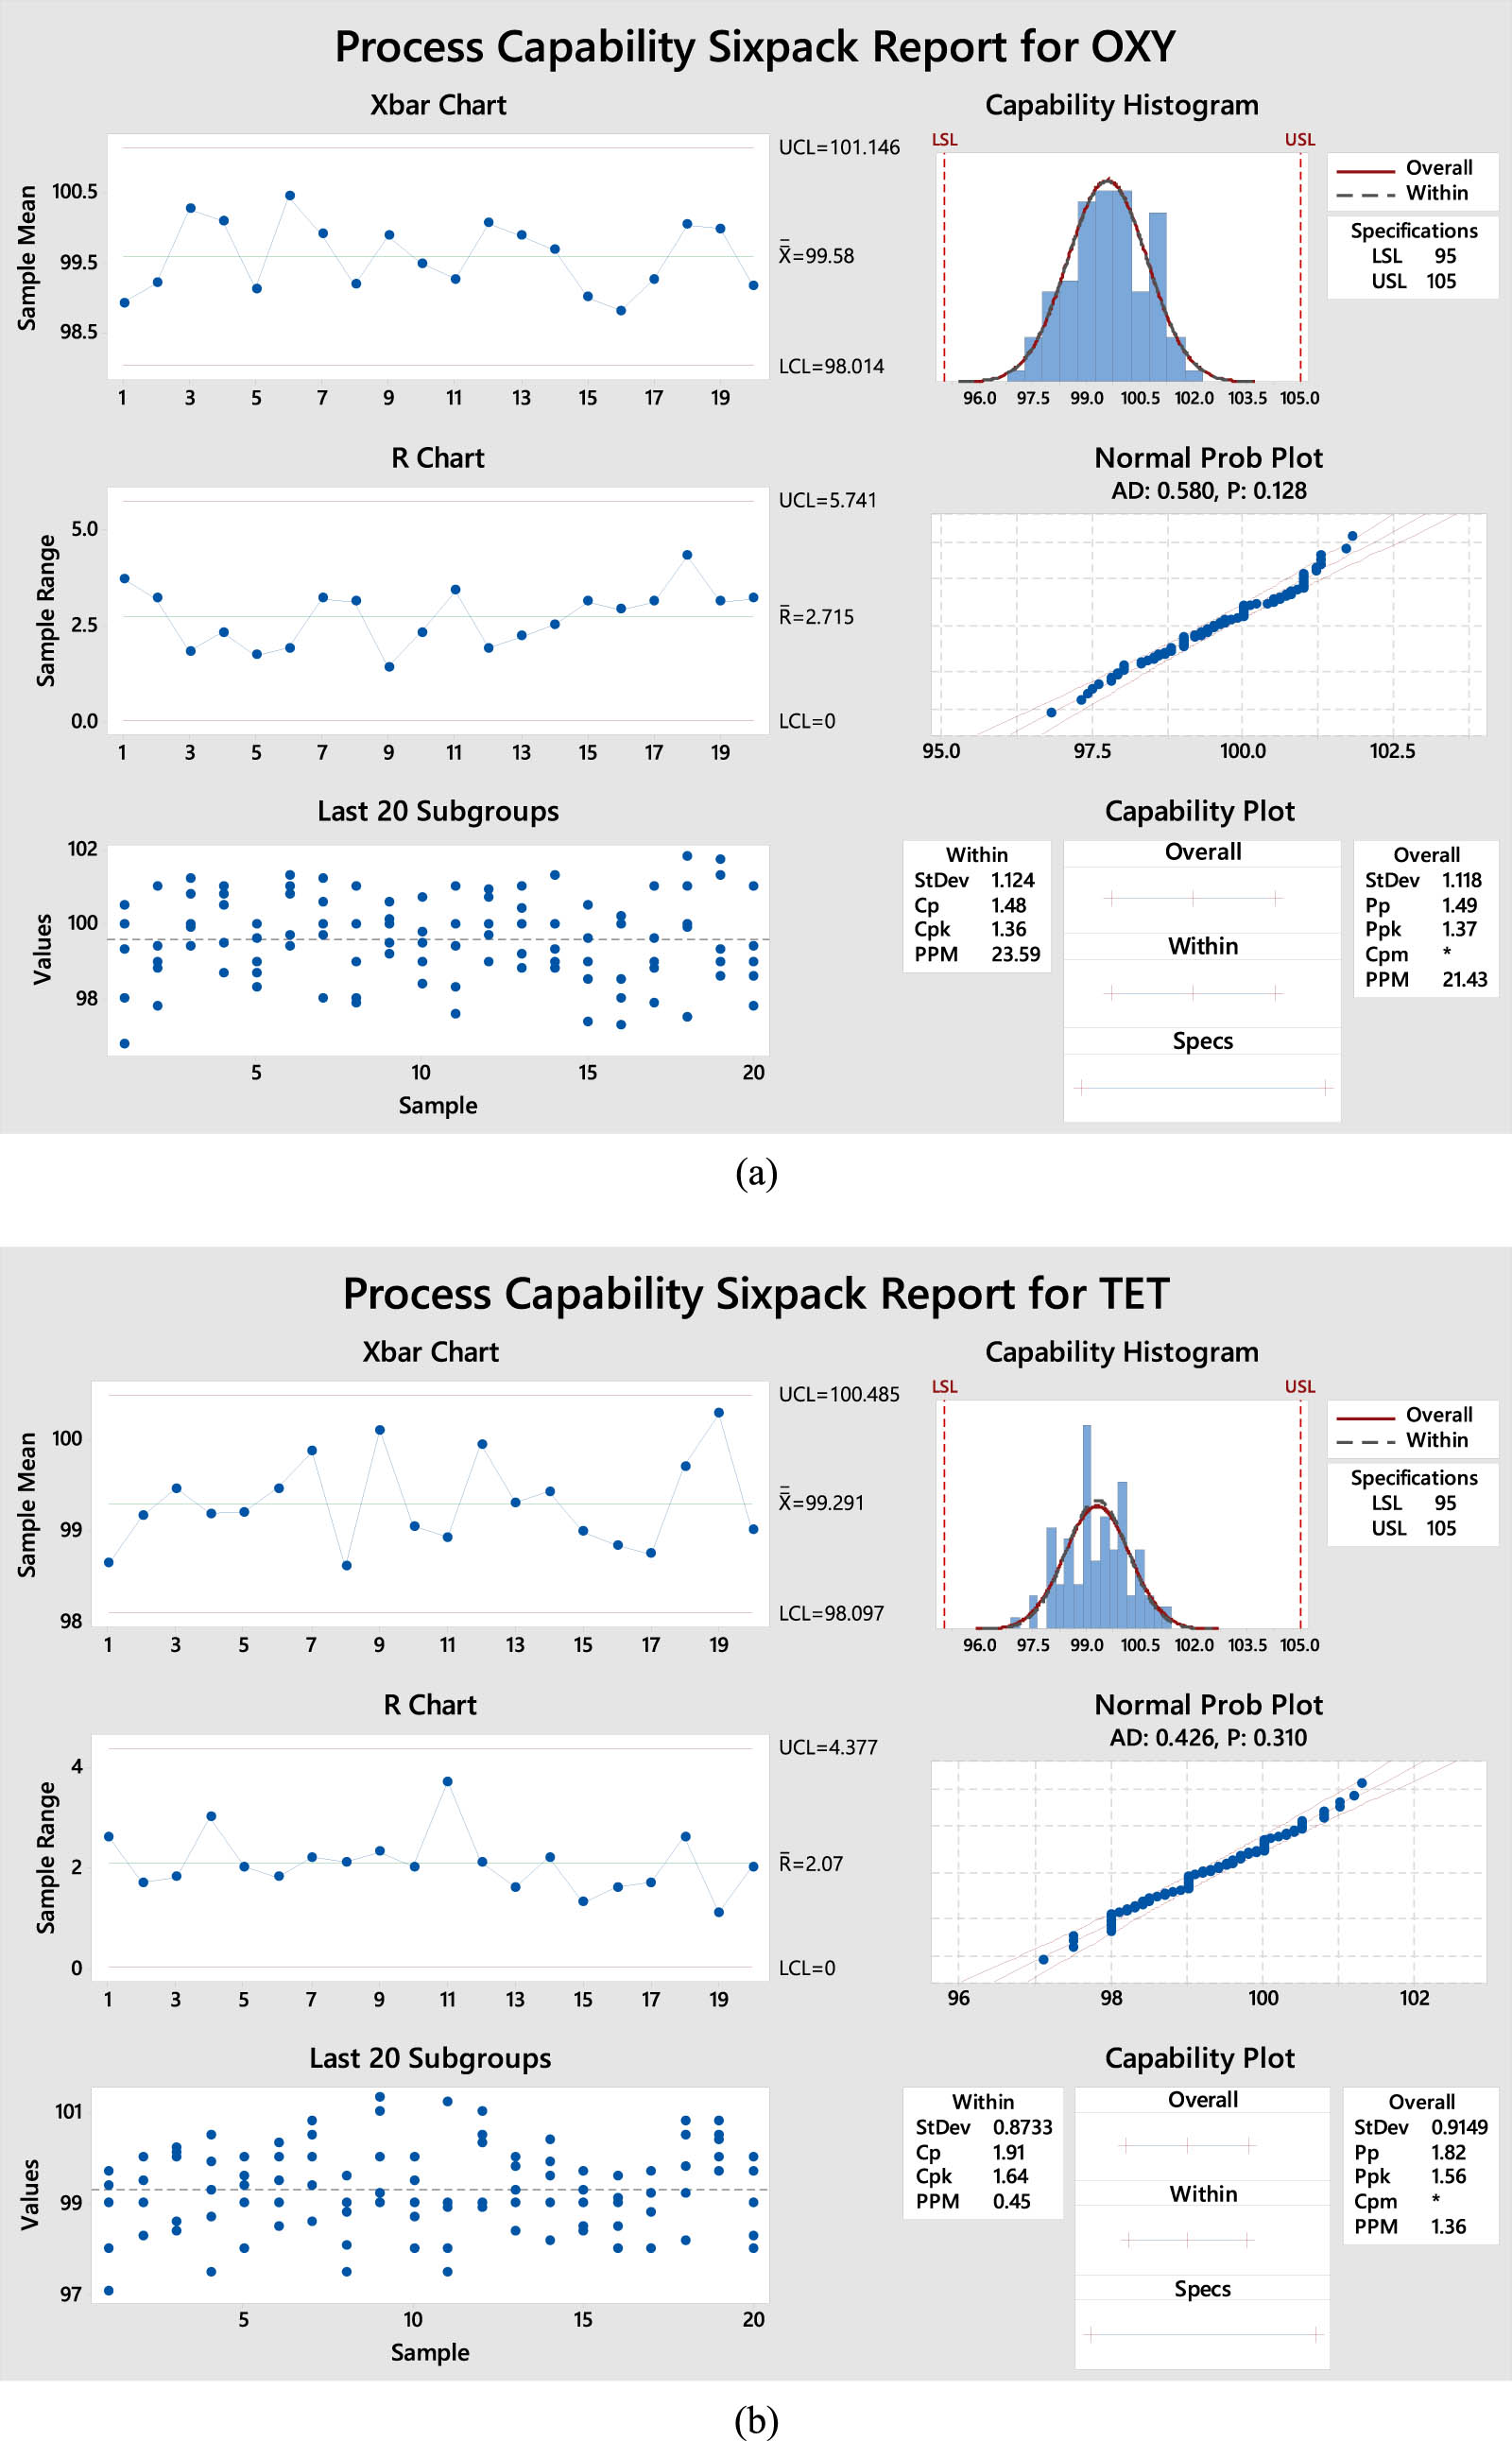
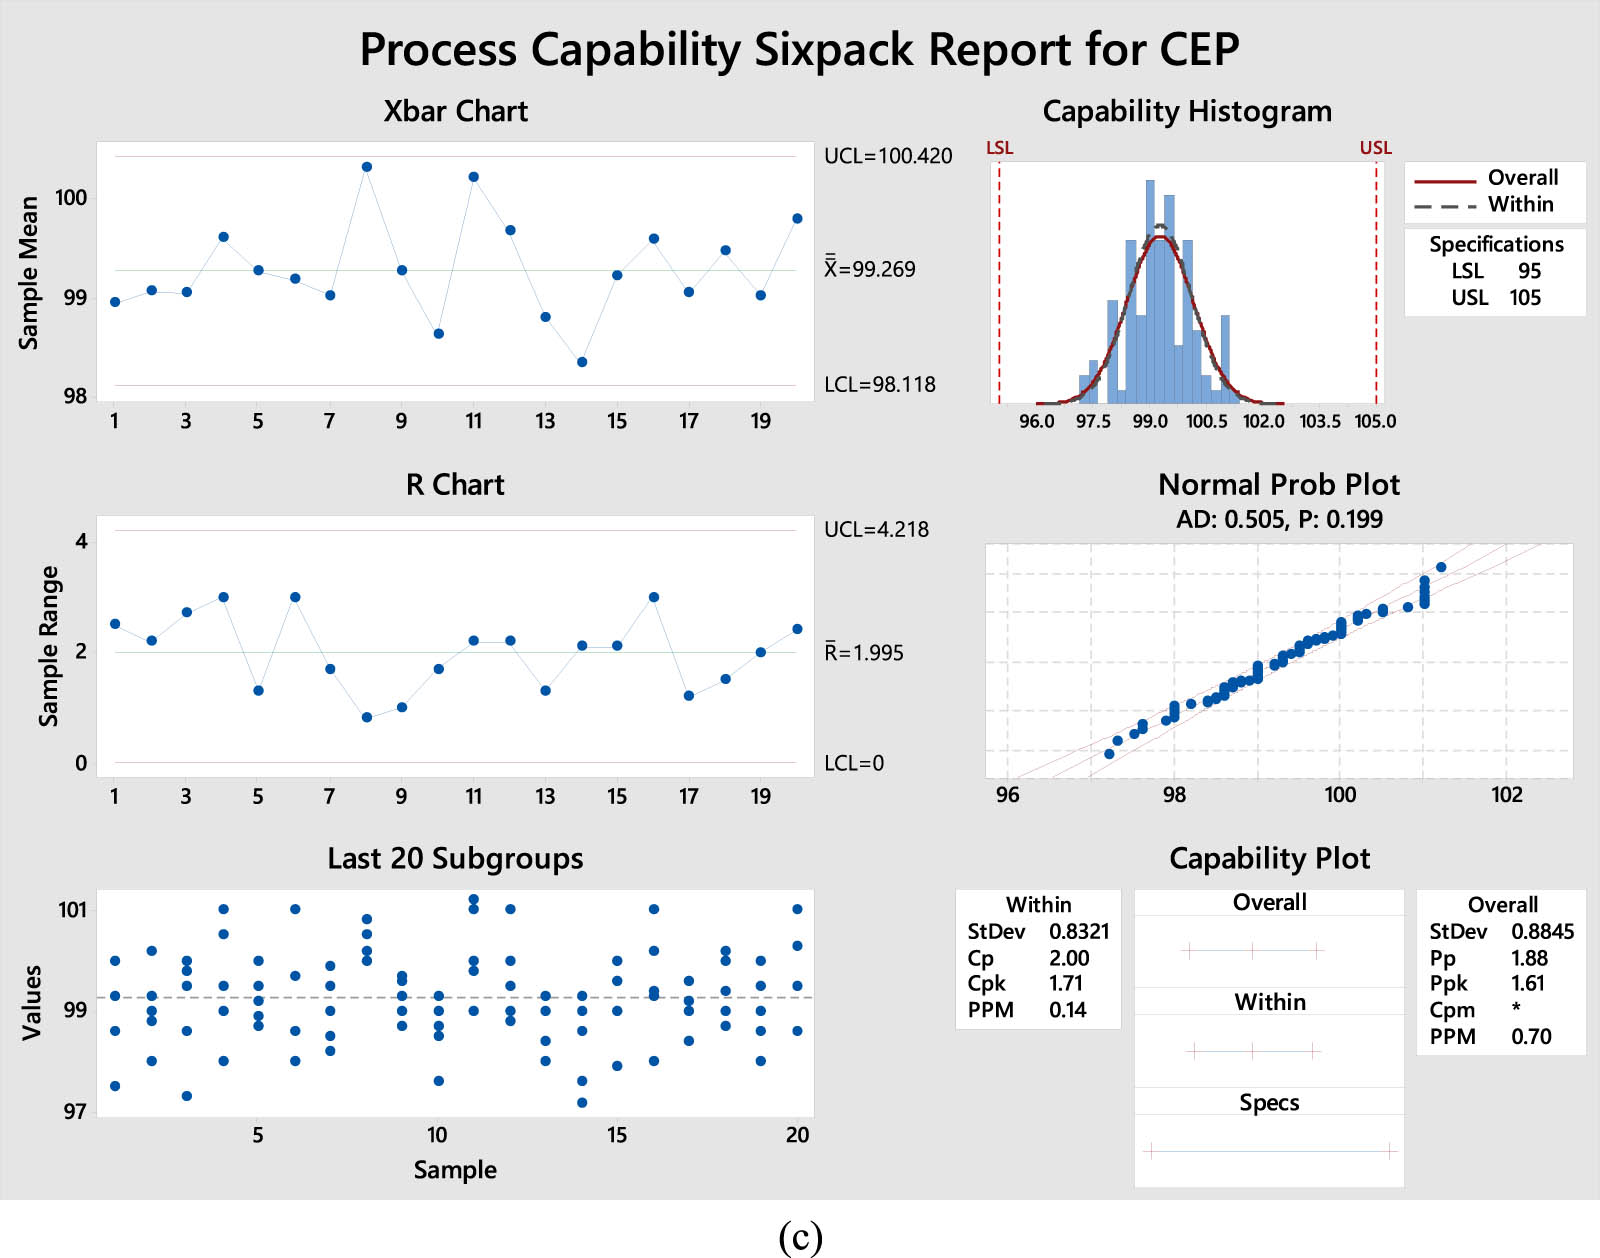
Process capability six-pack report of accuracy results for (a) OXY, (b) TET, and (c) CEP.
3.3 Evaluation of the whiteness, blueness, and greenness of the recommended methods
3.3.1 AGREE tool
The 12 components of the Green Appraisal Guidelines form the basis of AGREE, a modern method for evaluating green profiles (Figure 4a). Figure S1a shows the results of applying this method to generate a pictogram representing a good environmental method. In the center, the HPLC method displays an AGREE score of 0.62 and several intensifying green color combinations.

An assessment was conducted to evaluate the sustainability of an HPLC technique using the following graphs: (a) AGREE, (b) AGREEprep, (c) GAPI, (d) ComplexGAPI, (e) BAGI, (f) AMGS, and (g) HPLC-EAT.
3.3.2 AGREEprep tool
AGREEprep is a novel indicator of environmental impact. Efficient and eco-friendly sample preparation procedures simplify the evaluation procedure. To arrive at a score between zero and one, the AGREEprep method employs ten separate procedures. A score of one indicates an ideal performance. Figure 4b shows a pictogram for every sector. The existing methodologies’ ecological sustainability score is 0.55 for the HPLC approach, as shown in Figure S1b.
3.3.3 GAPI tool
A reliable method such as GAPI is required for analyzing the degree of greenness in analytical operations. Figure 4c details this method in fifteen sections, each explaining a different aspect of the approach. Because it takes into account all important parts of the analytical process, GAPI is a helpful tool for comparing different analytical procedures. Figure S2a shows the results, which prove that the procedure is effective while being environmentally benign.
3.3.4 ComplexGAPI tool
The ComplexGAPI measure is one way to evaluate analytical methods that make use of GAC characteristics. To account for pre-analysis activities, the GAPI diagram and the standard GAPI measure are both hexagonally enlarged (Figure 4d). These treatments cover a broad variety of individuals, as shown in Figure S2b.
3.3.5 BAGI tool
The ten standards, as well as the usefulness and efficacy of a technique, can be better understood with the help of BAGI’s illustrations and scores. When using HPLC, dark blue, light blue, and dark blue represent the ultimate HPLC scores. A solution’s color indicates how well it meets the requirements. A satisfactory analytical technique is defined as one with a score of 80, as shown in Figure S2c. In Figure 4e, we can see the BAGI index pictograms.
3.3.6 AMVI
AMVI can accurately determine solvent consumption using liquid chromatography. Supplementing the methods above with liquid chromatography techniques is possible. State-of-the-art laboratory equipment allows for the execution of analytical procedures. According to the HPLC result, AMVI has an environmentally friendly score of 51.7, as shown in Table 4.
The AMVI examination of the suggested strategy
| Criteria | Suggested HPLC strategy |
|---|---|
| Solvent consumption HPLC (mL)= | 105 |
| Flow rate | 1.0 |
| Run time | 7 |
| Number of injections for one complete analysis | 15 |
| Number of analytes | 3 |
| Solvent consumption sample prep (mL)= | 50 |
| Volume (mL) for standard preparation | 10 |
| Standard preparations numbers | 1 |
| Volume (mL) for test preparation | 10 |
| Test preparations numbers | 3 |
| Volume (mL) for system suitability | 10 |
| System suitability numbers | 1 |
| Total method solvent consumption= | 155 |
| Analytical method volume intensity | 51.7 |
| % Consumption HPLC | 67.74% |
| % Consumption preparations | 32.26% |
The bold values appear to highlight key summary metrics or final results that are particularly important for interpreting the data.
3.3.7 ESA
The ecological pattern is the benchmark of excellence for evaluating sustainable development programs. The ESA metric uses penalty points to appraise the synchronous technique. The method’s strong eco-scores (87 in HPLC) demonstrate its environmental sustainability. The reader can find all the details concerning the calculated penalty points in Table 5.
Using an approved method for calculating the analytical eco-scale score incurs penalty points
| Analytical eco-scale | Penalty points | |
|---|---|---|
| HPLC method | ||
| Reagents | Methanol | 6 |
| Ultra purified water | 0 | |
| Potassium dihydrogen phosphate | 0 | |
| Acetonitrile | 4 | |
| Magnesium sulfate | 0 | |
| Sodium chloride | 0 | |
| Silica gel | 0 | |
| Instruments | Energy for HPLC ≤ 1.5 kW h/sample | 1 |
| Occupational hazard | 0 | |
| Ultrasonic | 1 | |
| Waste | 1 | |
| Total penalty points | 13 | |
| Eco-scale total score | 87 |
The bold values appear to highlight key summary metrics or final results that are particularly important for interpreting the data.
3.3.8 AMGS
With AMGS, it is simple to compare and evaluate solutions based on their potential environmental impact. Figure 4f shows the steps involved in component analysis, instrumental energy use, solvent waste formation, and waste disposal. Figure S3a demonstrates that AMGS inspections employ a perspective-based approach.
3.3.9 HPLC-EAT
With HPLC-EAT, a reliable and efficient evaluation tool for liquid chromatography processes, we may look at the characteristics in Figure S3b. To ensure that chromatographic solvents are safe and pure, this method provides a useful means of assessing their effects. Using Figure 4g, we demonstrate that it is feasible to assess how each process solvent impacts public health, the environment, and safety.
3.4 Method validation
We have validated our methods through a comprehensive review that followed International Council for Harmonization requirements. The results show that they are incredibly effective and reliable [42].
3.4.1 Linearity and range
Since a wide range of drug concentrations is under investigation, the analysts spent much time thinking about the best way to prepare the linearity solution. Still, the results from the HPLC processes were excellent. The concentration ranges for each pharmaceutical drug of OXY, TET, and CEP were 2–50, 0.3–10, and 1–45 µg·mL−1 in the HPLC approach. Using linear regression analysis on the standard calibration curves, we discovered that the approach was remarkably linear across all drug concentration ranges, with regression coefficients greater than 0.999. See the reported findings in Table 6.
The estimating methodologies employ regression modeling and validation analysis for the medications under examination
| HPLC | Parameters | ||
|---|---|---|---|
| OXY | TET | CEP | |
| Linear | |||
| Range (µg·mL−1) | 2–50 µg·mL−1 | 0.3–10 µg·mL−1 | 1–45 µg·mL−1 |
| Wavelength (nm) | 257 nm | 257 nm | 257 nm |
| Slope | 6.34 | 59.52 | 5.14 |
| Intercept | −0.5066 | −0.3180 | 0.5160 |
| Correlation coefficient | 0.99998 | 0.99993 | 0.9999 |
| System precision % RSD (tR) | 0.1% | 0.03% | 0.08% |
| % RSD (Peak area) | 0.5% | 0.3% | 0.7% |
| LODa (µg·mL−1) | 0.25 µg·mL−1 | 0.05 µg·mL−1 | 0.29 µg·mL−1 |
| LOQa (µg·mL−1) | 0.74 µg·mL−1 | 0.17 µg·mL−1 | 0.89 µg·mL−1 |
aLimit of detection (3.3 × σ/Slope) and alimit of quantitation (10 × σ/Slope).
3.4.2 Limit of detection (LOD) and Limit of quantification (LOQ)
By using the functions 3.3σ/S and (10σ/S), the LOQ and LOD of the verified Excel were estimated utilizing the functions 3.3σ/S and (10σ/S). Determining LOD and LOQ requires precise computations, as they involve the slope of the calibration curve (S) and the intercept standard deviation (σ). Calibrating curves were constructed at lower concentrations to ensure that LODs and LOQs were accurate, and that linearity of the response was observed over the entire measured range. The suggested methods work best with lower LOQ and LOD values, as seen in Table 6.
3.4.3 Accuracy and recovery
Table 7 demonstrates that the percentage of medicine recovery for each level was well within the authorized range of 98–102%, confirming the assessment’s accuracy level and procedures.
The recovery and accuracy of the approach for CEP, TET, and OXY estimation are valuable and beneficial
| Parameters | HPLC | ||
|---|---|---|---|
| Relative concentrations % | OXY | TET | CEP |
| Recovery (%) | Recovery (%) | Recovery (%) | |
| 50 | 98.25 | 99.26 | 98.08 |
| 99.11 | 99.45 | 99.42 | |
| 98.78 | 98.48 | 98.75 | |
| 99.36 | 98.79 | 99.42 | |
| 99.56 | 98.39 | 98.33 | |
| 98.45 | 98.95 | 99.88 | |
| Mean ± RSD | 98.91 ± 0.52 | 98.89 ± 0.42 | 98.98 ± 0.71 |
| 100 | 98.44 | 98.26 | 98.14 |
| 99.15 | 99.46 | 99.58 | |
| 98.76 | 99.16 | 98.09 | |
| 98.23 | 98.38 | 99.98 | |
| 98.67 | 98.79 | 98.37 | |
| 98.08 | 98.96 | 98.46 | |
| Mean ± RSD | 98.56 ± 0.39 | 98.84 ± 0.46 | 98.77 ± 0.81 |
| 150 | 98.58 | 98.00 | 99.35 |
| 98.19 | 99.09 | 98.82 | |
| 99.06 | 98.76 | 99.29 | |
| 98.47 | 99.89 | 99.43 | |
| 98.88 | 99.98 | 99.57 | |
| 99.25 | 98.46 | 98.52 | |
| Mean ± RSD | 98.74 ± 0.40 | 99.03 ± 0.80 | 99.16 ± 0.41 |
3.4.4 Ruggedness and robustness
Investigations demonstrate that the suggested method remains stable when subjected to small changes in flow rate, pH, wavelength, column, and analysts. Table S1 provides additional evidence of the method’s dependability and robustness.
3.4.5 Standard solution stability
As the study’s findings showed, the conventional wisdom was spot on. After 72 h of storage at room temperature or in the fridge, it worked perfectly. The newly constructed solution shares remarkable similarities with an older one. Furthermore, there was excellent complementarity because the range of the retained and prepared standards was 100% ± 2.0%, and the relative standard deviation was less than 2.0. These outcomes prove the stability and reliability of the conventional solution. It appears to be a great candidate for any analytical task, according to Table S1.
3.4.6 System suitability
After extensive testing and analysis of the procedure, we determined that the system was suitable. Table S2 shows that all parameters were within the specified range. The reliability and precision of our technology are something we are exceptionally reliable and precise.
3.4.7 Selectivity
To test how selective the procedure was, we looked at how coating agents, degradation products, and preservatives could affect the analyte. The data displayed in Figure S4 reveal that the three active components do not differ significantly when diluted with diluents, placebos, or other medicines. It is possible to get a high level of selectivity using these strategies.
4 Discussion
A variety of factors can influence whether specific antibiotics are detected in wastewater samples, including source of contamination, since antibiotics enter wastewater from a variety of sources, including hospitals, pharmaceutical industries, and residential areas. Certain antibiotics could be detected in these sources according to their usage patterns. Hospital effluents, for instance, may contain higher concentrations of antibiotics commonly used in hospitals [43]. As antibiotics are unstable and degrade at different rates in the environment, they have varying degrees of degradation and persistence. Depending on the pH, temperature, and microbial activity of the environment, some antibiotics can degrade more rapidly, causing their absence from samples [44]. There is a wide range of effectiveness in the removal of antibiotics from wastewater due to the different wastewater treatment processes. Treatment of wastewater with conventional methods may lead to antibiotic resistance [45]. Water treatment is affected by the chemical properties of antibiotics, such as their solubility and adsorption potential. In contrast, antibiotics with a high adsorption potential can bind to sludge during treatment and remain in the aqueous phase.
Based on our study, the detected antibiotic may have been more prevalent because of its increased use in the source area or its greater resistance to degradation and treatment. However, it is also possible that the absence of antibiotics may have resulted in a faster degrading process or a more efficient removal during treatment.
It has been well explored in the past few decades that antibiotic residues can be detected in environmental samples using various methods, such as LC-MS/MS [17,18] and HPLC-DAD [20,21]. As analytical chemistry methods are evaluated, green metrics such as GAPI and AGREE are increasingly incorporated. There has been no previous study combining ecological impact assessments with RP-HPLC methods to analyze wastewater from poultry slaughters, rabbit farms, and pharmaceutical factories for the detection of OXY, TET, and CEP. However, whereas other methods have detected similar antibiotics in environmental samples, the incorporation of several green metrics and the focus on wastewater from three distinct sources are novel aspects of the manuscript, which adds value to the field by introducing methodological and sustainability innovations.
There are several benefits to the HPLC method, including its cost-effectiveness, accessibility, and high separation efficiency [46]. The LC-MS/MS has the advantage of being easier to operate and maintain as well. As a result, RP-HPLC is less suitable for detecting low antibiotic concentrations than LC-MS/MS due to its lack of sensitivity and specificity. In addition to offering high sensitivity and specificity, LC-MS/MS is capable of simultaneously identifying and quantifying multiple compounds [17,18]. Analytes in low concentrations as well as complex matrices are particularly well suited for this method. The LC-MS/MS method, on the other hand, requires more equipment, requires more expertise, and is more expensive. Using BAGI is an excellent way to select analytical methods that balance performance and environmental responsibility. It is especially valuable for laboratories looking to adhere to white chemistry practices. However, BAGI may have limited application due to data availability on biological activity and environmental impact for certain reagents/processes. As a result of antibiotic residues detected in wastewater from poultry slaughterhouses, rabbit farms, and pharmaceutical factories, improved wastewater treatment technologies are necessary to mitigate contamination of the environment. We developed an RP-HPLC method that provides an environmentally friendly method for detecting antibiotic residues in wastewater. Such a method is more robust than more sophisticated methods, including LC-MS/MS. As opposed to two stages of mass spectrometry in LC-MS/MS, our approach achieves comparable accuracy and sensitivity, so it is accessible without specialized equipment for a wider range of applications. Our findings may assist in developing stricter regulations related to antibiotic discharge limits and encourage the adoption of monitoring programs for antibiotic residues in wastewater. As a result of the presence of antibiotics in agricultural wastewater, livestock farming must be managed better to reduce antibiotic use and keep antibiotic resistance at bay.
The literature review indicates that out of eight environmental metrics, none of the HPLC methods are appropriate for detecting OXY, TET, and CEP residues in wastewater from rabbit farms, pharmaceutical enterprises, and poultry slaughterhouses. To evaluate the ecological sustainability of the proposed approach, the study employed a variety of green criteria such as AGREE, HPLC-EAT, ESA, ComplexGAPI, AMVI, AMGS, and AGREEprep, in addition to the BAGI metric of white chemistry. Our state-of-the-art quality tools and Lean Six-Sigma procedures are the most effective and efficient ways to adhere to sustainable and environmentally friendly chemistry principles. This infographic Figure 5 and Table 8 illustrates traces of OXY, TET, and CEP in wastewater from a pharmaceutical company, a rabbit farm, and a chicken abattoir. The data shown in Table 5 provide details on the number of samples analyzed (n = 20) and the time period during which sampling was performed (February to May 2024). The bar graph displays the residual amounts of three antibiotics in wastewater from three distinct sources. Compared to the rabbit farm, the wastewater from the poultry slaughter industry had greater TET and OXY residue levels; these residues are not present in the pharmaceutical factory. On the other hand, pharmaceutical plants identified small concentrations of CEP, which was absent from rabbit farms and poultry slaughterhouses.

An infographic illustrating the identification of OXY, TET, and CEP traces in wastewater originating from a poultry slaughterhouse, rabbit farms, and pharmaceutical plant.
Detection of the investigated drugs of OXY, TET, and CEP in poultry slaughter, rabbit farms, and pharmaceutical factory wastewater
| Item | Poultry slaughter wastewater | Rabbit farms wastewater | Pharmaceutical factory wastewater |
|---|---|---|---|
| CEP | N.D | N.D | 0.28 µg·mL−1 |
| OXY | 0.15 µg·mL−1 | 0.03 µg·mL−1 | N.D |
| TET | 2.5 µg·mL−1 | 0.67 µg·mL−1 | N.D |
*N.D (not detected).
5 Conclusion
This study established a connection between two significant and potential fields by creating a chromatographic technique for measuring targeted analytes in actual samples of wastewater. Assessing the presence of antibiotic residues (OXY, TET, and CEP) in wastewater from chicken slaughter, rabbit farms, and medicines using eight ecologically friendly metrics and the specific BAGI associated with sustainable chemistry is not feasible with HPLC techniques. Due to this rationale, analysts have effectively devised and validated an innovative approach. The researchers employed several software and technologies, such as AGREE, AGREEprep, GAPI, ComplexGAPI, ESA, AMVI, AMGS, and HPLC-EAT, to evaluate the environmental sustainability of the proposed strategy based on eight green criteria. The integration of the lean Six Sigma strategy confirmed the suggested method’s quality further, as evidenced by the attainment of Cpk values greater than 1.3. Poultry slaughterhouses, rabbit farms, and pharmaceutical manufacturers can all use the created technology to analyze wastewater for antimicrobial medicines. It is useful for gathering data on the prevalence and environmental behavior of antimicrobial medications.
6 Future plan and study limitations
The method used in this study provides a robust method for detecting antibiotic residues in wastewater. Despite this, several limitations must be acknowledged. There are numerous factors that may affect the accuracy and precision of the results due to the complexity of the wastewater matrix, despite the cleanup steps taken. Furthermore, the method focuses only on a limited number of antibiotics, potentially ignoring other compounds or metabolites. A greener alternative is also needed because organic solvents like methanol are used in the mobile phase, which raises environmental and safety concerns. It is also possible that the method’s performance will vary based on the type of wastewater used, which limits its generalizability. To address these limitations, future work will focus on broadening the scope of analytes to include a broader range of antibiotics and emerging contaminants. Besides exploring greener solvents, we will also explore alternative techniques that reduce the method’s environmental impact. We will investigate automation and high-throughput analysis to facilitate large-scale monitoring and improve reproducibility. In addition, we plan to conduct long-term monitoring studies of antibiotic residues in wastewater to evaluate trends and risks.
Acknowledgments
The current work was supported by Princess Nourah bint Abdulrahman University Researchers Supporting Project number (PNURSP2025R419), Princess Nourah bint Abdulrahman University, Riyadh, Saudi Arabia.
-
Funding information: Authors state no funding involved.
-
Author contributions: Bandar R. Alsehli: writing – review & editing, data curation, software, investigation, conceptualization; Ammena Y. Binsaleh: visualization, investigation (equal), conceptualization (equal), resources; Sayed M. Saleh and Abdullah H. Alluhay: review & editing, conceptualization (equal), investigation (equal); Mahmoud A. Mohamed: project administration, formal analysis, methodology, writing – original draft, software (equal), conceptualization (equal).
-
Conflict of interest: The authors declare that Hikma Pharmaceuticals PLC had no influence on the design, execution, interpretation, or reporting of the results presented in this study.
-
Data availability statement: All data generated or analyzed during this study are included in this published article and its supplementary material file.
References
[1] Manyi-Loh C, Mamphweli S, Meyer E, Okoh A. Antibiotic use in agriculture and its consequential resistance in environmental sources: potential public health implications. Molecules. 2018;23(4):795. 10.3390/molecules23040795.Search in Google Scholar PubMed PubMed Central
[2] Pokrant E, Yévenes K, Trincado L, Terraza G, Galarce N, Maddaleno A, et al. Evaluation of antibiotic dissemination into the environment and untreated animals, by analysis of oxytetracycline in poultry droppings and litter. Animals. 2021;11(3):853. 10.3390/ani11030853.Search in Google Scholar PubMed PubMed Central
[3] Pogurschi EN, Grigore DM, Ianitchi D, Bahaciu G, Popa DC, Dragomir N, et al. Screening and detection of antibiotic residues on broiler meat based on trade system variations, seasonal differences, and the impact on final consumer safety in Romania. Front Sustainable Food Syst. 2023;7:1198411. 10.3389/fsufs.2023.1198411.Search in Google Scholar
[4] Pratiwi R, Azizah PN, Hasanah AN, Asman SB. Analytical strategies for monitoring tetracycline residues in various Samples: A focus on environmental and health implications. Microchem J. 2024;206:111408. 10.1016/j.microc.2024.111408.Search in Google Scholar
[5] Dasenaki ME, Thomaidis NS. Multi-residue determination of 115 veterinary drugs and pharmaceutical residues in milk powder, butter, fish tissue and eggs using liquid chromatography–tandem mass spectrometry. Analyt Chim Acta. 2015;880:103. 10.1016/j.aca.2015.04.013.Search in Google Scholar PubMed
[6] Vragović N, Bažulić D, Njari B. Risk assessment of streptomycin and tetracycline residues in meat and milk on Croatian market. Food Chem Toxicol. 2011;49(2):352. 10.1016/j.fct.2010.11.006.Search in Google Scholar PubMed
[7] Kyriakides D, Panderi I, Hadjigeorgiou M, Christou K, Maou M, Kavantzas N, et al. Veterinary antimicrobial residues in pork meat in Cyprus: An exposure assessment. J Food Compos Anal. 2020;90:103512. 10.1016/j.jfca.2020.103512.Search in Google Scholar
[8] Wang H, Ren L, Yu X, Hu J, Chen Y, He G, et al. Antibiotic residues in meat, milk and aquatic products in Shanghai and human exposure assessment. Food Control. 2017;80:217. 10.1016/j.foodcont.2017.04.034.Search in Google Scholar
[9] Pokrant E, Vargas MB, Navarrete MJ, Yévenes K, Trincado L, Cortés P, et al. Assessing the effect of oxytetracycline on the selection of resistant escherichia coli in treated and untreated broiler chickens. Antibiotics. 2023;12(12):1652. 10.3390/antibiotics12121652.Search in Google Scholar PubMed PubMed Central
[10] Shehata N, Rawan AF, Ahmed HA, Alhaddad OA, Amin MS, Nafee SS, et al. Adsorption separation of oxytetracycline hydrochloride using natural and nanostructured clay mineral of silica in synthetic solution: Integration to white and green chemistry metrics. Sustainable Chem Pharm. 2024;39:101574. 10.1016/j.scp.2024.101574.Search in Google Scholar
[11] Nassef HM, Ahmed HA, Bashal AH, El-Atawy MA, Alanazi TYA, Mahgoub SM, et al. A novel Six Sigma approach and eco-friendly RP-HPLC technique for determination of pimavanserin and its degraded products: Application of Box–Behnken design. Rev Anal Chem. 2024;43(1):20230073. 10.1515/revac-2023-0073.Search in Google Scholar
[12] Mahgoub SM, Mahmoud MR, Binsaleh AY, Almalki MA, Mohamed MA, Nassar HF. Analytical assessment of a novel RP-HPLC method for the concurrent quantification of selected pharmaceutical drugs levodopa and carbidopa using eight greenness metrics comparing to the lean six sigma approach. Sustainable Chem Pharm. 2023;36:101291. 10.1016/j.scp.2023.101291.Search in Google Scholar
[13] Assirey EA, Ahmed HA, AL‐Faze R, Amin MS, Mahgoub SM, Abo El‐Ela FI, et al. Novel RP‐HPLC method for estimation of a newly developed combination of tizanidine and etoricoxib in rat plasma: Eight criteria for greens evaluation. Arch Pharm. 2024;357:e2400025. 10.1002/ardp.202400025.Search in Google Scholar PubMed
[14] Nassef HM, Ahmed HA, El-Atawy MA, Alanazi TYA, Mohamed MA. Greens assessment of RP-UPLC method for estimating triamcinolone acetonide and its degraded products compared to box-behnken and six sigma designs. Green Chem Lett Rev. 2024;17(1):2301315. 10.1080/17518253.2023.2301315.Search in Google Scholar
[15] Alanazi TYA, Adel Pashameah R, Binsaleh AY, Mohamed MA, Ahmed HA, Nassar HF. Condition optimization of eco-friendly RP-HPLC and MCR methods via Box–Behnken design and six sigma approach for detecting antibiotic residues. Sci Rep. 2023;13:15729. 10.1038/s41598-023-40010-1.Search in Google Scholar PubMed PubMed Central
[16] Qureshi T, Memon N, Memon SQ, Abro K, Shah SW. LC/UV determination of cefradine, cefuroxime, and cefotaxime in dairy milk, human serum and wastewater samples. SpringerPlus. 2013;2:1–8. 10.1186/2193-1801-2-575.Search in Google Scholar PubMed PubMed Central
[17] Gao J, Cui Y, Tao Y, Huang L, Peng D, Xie S, et al. Multiclass method for the quantification of 92 veterinary antimicrobial drugs in livestock excreta, wastewater, and surface water by liquid chromatography with tandem mass spectrometry. J Sep Sci. 2016;39(21):4086–95. 10.1002/jssc.201600531.Search in Google Scholar PubMed
[18] Yévenes K, Ibáñez MJ, Pokrant E, Flores A, Maturana M, Maddaleno A, et al. A suitable HPLC-MS/MS methodology for the detection of oxytetracycline, enrofloxacin, and sulfachloropyridazine residues in lettuce plants. Foods. 2024;13(1):153. 10.3390/foods13010153.Search in Google Scholar PubMed PubMed Central
[19] Patyra E, Kowalczyk E, Kwiatek K. Screening method for the determination of selected tetracyclines in water by liquid chromatography with diode array detector. J Vet Res. 2014;58(1):65–70. 10.2478/bvip-2014-0010.Search in Google Scholar
[20] Hossain MN, Hossain ZZ, Roy AK, Akhter H, Begum A. Detection of oxytetracycline and chloramphenicol in untreated wastewater effluents by reverse phase-high performance liquid chromatography (RP-HPLC) technique. Afr J Pharm Pharmacol. 2022;16(1):11–8. 10.5897/AJPP2021.5284.Search in Google Scholar
[21] Hassouna MEM, Mohamed MA. Efficient HPLC method for determination of cephalosporin residues on spiked stainless-steel plates and human plasma: application of a worst-case product for Cosa® CIP. Int J Environ Anal Chem. 2020;100(1):82–98. 10.1080/03067319.2019.1631301.Search in Google Scholar
[22] EPA Method 1694, Pharmaceuticals and personal care products in water, soil, sediment, and biosolids by HPLC/MS/MS. 2007, EPA-821-R-08-002.Search in Google Scholar
[23] Ahmed HA, El-Atawy MA, Nassef HM, Amin MS, Jaremko M, Emwas AH, et al. Eco-friendly chromatographic techniques for appraisal of amlodipine, hydrochlorothiazide, telmisartan, and their related substances in dosage form: application to six sigma and content uniformity approaches. Sustainable Chem Pharm. 2024;38:101469. 10.1016/j.scp.2024.101469.Search in Google Scholar
[24] Alanazi TYA, Almalki MA, Mohamed MA, Nassar HF. Five greenness assessments of novel RP-UPLC and MCR methods for concurrent determination of selected pharmaceutical drugs in comparison with the lean Six Sigma approach. Microchem J. 2023;194:109359. 10.1016/j.microc.2023.109359.Search in Google Scholar
[25] Al-Kadhi NS, Mohamed MA, Ahmed HA, Nassar HF. Facile synthesis and eco-friendly analytical methods for concurrent estimation of selected pharmaceutical drugs in their solutions: application to quality by design, lean six sigma, and stability studies. BMC Chem. 2023;17:136. 10.1186/s13065-023-01028-8.Search in Google Scholar PubMed PubMed Central
[26] Hassouna MEM, Mohamed MA. Modeling and optimization of a novel RP-UPLC and MCR spectrophotometric methods for simultaneous determination of five cephalosporins in spiked human plasma: Application to lean six sigma thinking hats and antimicrobial activity. Microchem J. 2019;150:104161. 10.1016/j.microc.2019.104161.Search in Google Scholar
[27] Gałuszka A, Migaszewski ZM, Konieczka P, Namieśnik J. Analytical eco-scale for assessing the greenness of analytical procedures. TrAC Trends Anal Chem. 2012;37:61–72. 10.1016/j.trac.2012.03.013.Search in Google Scholar
[28] Gamal M, Naguib IA, Panda DS, Abdallah FF. Comparative study of four greenness assessment tools for selection of greenest analytical method for assay of hyoscine N-butyl bromide. Anal Methods. 2021;13(3):369–80. 10.1039/D0AY02169E.Search in Google Scholar
[29] Sajid M, Płotka-Wasylka J. Green analytical chemistry metrics: A review. Talanta. 2022;238:123046. 10.1016/j.talanta.2021.123046.Search in Google Scholar PubMed
[30] Płotka-Wasylka J. A new tool for the evaluation of the analytical procedure: Green analytical procedure index. Talanta. 2018;181:204–9. 10.1016/j.talanta.2018.01.013.Search in Google Scholar PubMed
[31] Gałuszka A, Migaszewski Z, Namieśnik J. The 12 principles of green analytical chemistry and the significance mnemonic of green analytical practices. TrAC Trends Anal Chem. 2013;50:78–84. 10.1016/j.trac.2013.04.010.Search in Google Scholar
[32] Pena-Pereira F, Wojnowski W, Tobiszewski M. AGREE—Analytical GREEnness metric approach and software. Anal Chem. 2020;92(14):10076–82. 10.1021/acs.analchem.0c01887.Search in Google Scholar PubMed PubMed Central
[33] Pena-Pereira F, Tobiszewski M, Wojnowski W, Psillakis E. A Tutorial on AGREEprep an analytical greenness metric for Sample Preparation. Adv Sample Prep. 2022;3:100025. 10.1016/j.sampre.2022.100025.Search in Google Scholar
[34] Manousi N, Wojnowski W, Płotka-Wasylka J, Samanidou V. Blue applicability grade index (BAGI) and software: a new tool for the evaluation of method practicality. Green Chem. 2023;25(19):7598–604. 10.1039/D3GC02347H.Search in Google Scholar
[35] Płotka-Wasylka J, Wojnowski W. Complementary green analytical procedure index (ComplexGAPI) and software. Green Chem. 2021;23(21):8657–65. 10.1039/D1GC02318G.Search in Google Scholar
[36] Hicks MB, Farrell W, Aurigemma C, Lehmann L, Weisel L, Nadeau K, et al. Making the move towards modernized greener separations: introduction of the analytical method greenness score (AMGS) calculator. Green Chem. 2019;21(7):1816–26. 10.1039/C8GC03875A.Search in Google Scholar
[37] Hartman R, Helmy R, Al-Sayah M, Welch CJ. Analytical Method Volume Intensity (AMVI): A green chemistry metric for HPLC methodology in the pharmaceutical industry. Green Chem. 2011;13(4):934–9. 10.1039/C0GC00524J.Search in Google Scholar
[38] Gaber Y, Törnvall U, Kumar MA, Amin MA, Hatti-Kaul R. HPLC-EAT (Environmental Assessment Tool): a tool for profiling safety, health and environmental impacts of liquid chromatography methods. Green Chem. 2011;13(8):2021–5. 10.1039/C0GC00667J.Search in Google Scholar
[39] Yefimov SV, Gil P. One step extraction method, sample preparation procedure for HPLC/MS analysis of altrenogest sesame oil solutions [Extraction of altrenogest from sesame oil with acetonitrile, HPLC/MS]. South Asian Res J Pharm Sci. 2022;4(1):17–21.10.36346/sarjps.2022.v04i01.003Search in Google Scholar
[40] Veronica N, Heng PW, Liew CV. Magnesium stearate fatty acid composition, lubrication performance and tablet properties. AAPS PharmSciTech. 2024;25(8):262.10.1208/s12249-024-02980-xSearch in Google Scholar PubMed
[41] Chen L, Zhang Y, Zhang YX, Wang WL, Sun DM, Li PY, et al. Pretreatment and analysis techniques development of TKIs in biological samples for pharmacokinetic studies and therapeutic drug monitoring. J Pharm Anal. 2024;14(4):100899. 10.1016/j.jpha.2023.11.006.Search in Google Scholar PubMed PubMed Central
[42] ICH Harmonized Tripartite Guideline. current step. 2005;4: 1–17.Search in Google Scholar
[43] Samrot AV, Wilson S, Sanjay Preeth RS, Prakash P, Sathiyasree M, Saigeetha S, et al. Sources of antibiotic contamination in wastewater and approaches to their removal—An overview. Sustainability. 2023;15(16):12639. 10.3390/su151612639.Search in Google Scholar
[44] Zhu L, Lin X, Di Z, Cheng F, Xu J. Occurrence, risks, and removal methods of antibiotics in urban wastewater treatment systems: a review. Water. 2024;16(23):3428. 10.3390/w16233428.Search in Google Scholar
[45] Emadikhiav A, Mafigholami R, Davood A, Mahvi A, Salimi L. A review on hazards and treatment methods of released antibiotics in hospitals wastewater during the COVID-19 pandemic. Environ Monit Assess. 2024;196(9):820. 10.1007/s10661-024-12938-y.Search in Google Scholar PubMed
[46] Al-Wasidi AS, Ahmed HA, Alshammari MFA, Nafee SS, Mohamed MA. Cutting-edge HPLC and MCR techniques for synchronically quantifying anticholinergic drugs in the presence of C12 and C14 homologs: Robust application to green and white chemistry. Arch Pharm. 2024;357:e2400256. 10.1002/ardp.202400256.Search in Google Scholar PubMed
© 2025 the author(s), published by De Gruyter
This work is licensed under the Creative Commons Attribution 4.0 International License.
Articles in the same Issue
- Research Articles
- Impressive stability-indicating RP-HPLC method for concurrent quantification of salbutamol, guaifenesin, and sodium benzoate in cough syrup: Application of six sigma and green metrics
- Bioanalytically validated potentiometric method for determination of bisphenol A: Application to baby bibs, pacifiers, and Teethers’ saliva samples
- Environmental impact of RP-HPLC strategy for detection of selected antibiotics residues in wastewater: Evaluating of quality tools
- Trace-level impurity quantification in lead-cooled fast reactors using ICP-MS: Methodology and challenges
- Picogram-level detection of three ACE inhibitors via LC–MS/MS: Comparing BMP and UOSA54 derivatization methods
- Eco-friendly RP-HPLC method for concurrent estimation of a promising combination of methocarbamol and etoricoxib in rat plasma
- Development of a point-of-care testing sensor using polypyrrole/TiO2 molecular imprinting technology for cinchocaine determination
- Green and sustainable RP-UPLC and UV strategies for determination of metformin and dapagliflozin: Evaluation of environmental impact and whiteness
- Review Articles
- Determination of montelukast and non-sedating antihistamine combination in pharmaceutical dosage forms: A review
- Extraction approaches for the isolation of some POPs from lipid-based environmental and food matrices: A review
- A review of semiconductor photocatalyst characterization techniques
- Analytical determination techniques for lithium – A review
- Fourier transform infrared spectroscopy study of polymer/filler/ionic liquid composites