Eco-friendly RP-HPLC method for concurrent estimation of a promising combination of methocarbamol and etoricoxib in rat plasma
-
Tahani Y. A. Alanazi


Abstract
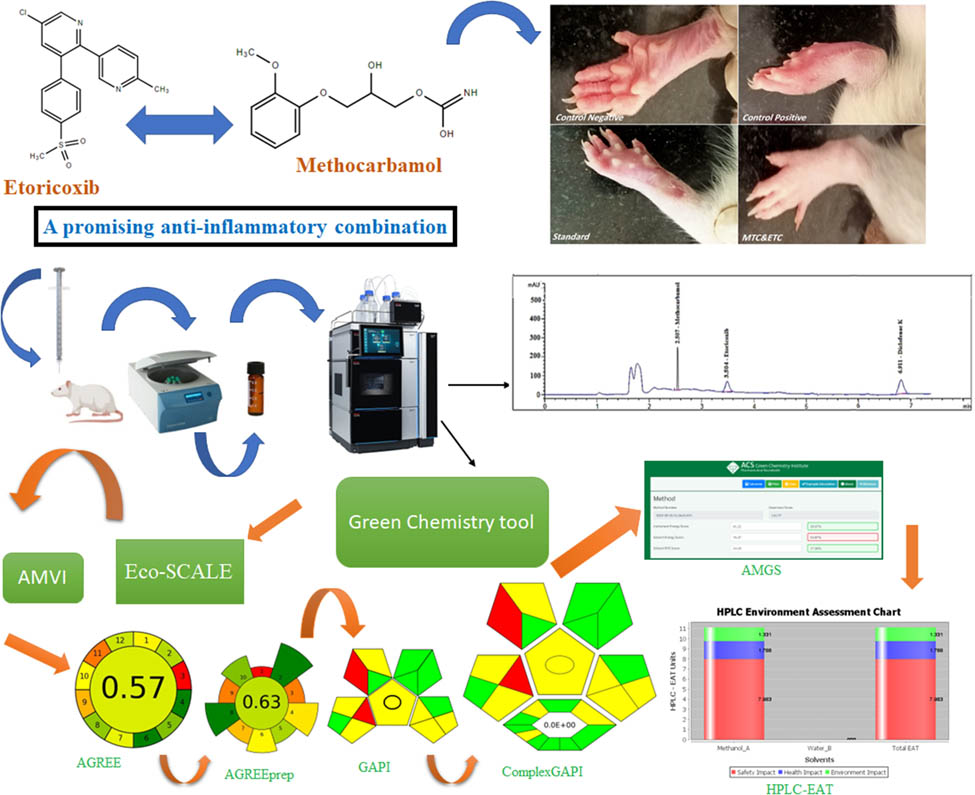
An innovative green reverse phase high-performance liquid chromatography method was developed and validated for the concurrent quantification of methocarbamol (MTC) and etoricoxib (ETC) in rat plasma using diclofenac potassium as an internal standard. This method introduces significant advancements over existing chromatographic techniques, including a rapid analysis time (8-min run time) and cost efficiency due to low solvent consumption (total solvent use of 444 mL), achieved through optimized chromatographic conditions. The method employs a Hypersil BDS C8 column (4.6 mm × 250 mm, 5 µm) with an isocratic mobile phase (buffer pH 2.5:methanol, 34:66 v/v) at 1.5 mL·min−1 and 274 nm detection. Linearity (1–50 µg·mL−1, R 2 > 0.999) was demonstrated with sensitive detection limits (LOD = 0.20 µg·mL−1 [MTC], 0.25 µg·mL−1 [ETC] and LOQ = 0.60 µg·mL−1 [MTC], 0.75 µg·mL−1 [ETC]). Environmental sustainability was rigorously confirmed using eight green metrics (AGREE, ComplexGAPI, AMVI), yielding an analytical eco-scale score of 84, surpassing conventional methods in eco-friendliness. In vivo studies on complete Freund’s adjuvant-induced rheumatoid arthritis rats revealed the MTC–ETC combination’s potent anti-inflammatory and anti-arthritic effects, including reduced serum c-reactive protein levels (p < 0.05) and preserved hepatorenal function. Validated per United States Food and Drug Administration guidelines, this method offers a fast, economical, and eco-conscious solution for pharmacokinetic studies and therapeutic monitoring, positioning the MTC–ETC combination as a promising, safe therapy for rheumatoid arthritis.
Graphical abstract
1 Introduction
The implementation of green chemistry principles has remarkably altered the field of chemistry, leading to a paradigm shift toward a more ecologically conscious and sustainable approach to chemical processes. Adhering to the 12 Regulations of Green Chemistry is crucial for analysts as they strive to accomplish sustainability and reduce environmental waste [1]. To assess the environmental sustainability of analytical techniques, green chemists must integrate method validation criteria. Using these criteria not only enhances the public perception of analytical chemistry but also provides empirical evidence to support the long-term viability of these methodologies. Therefore, implementing green chemistry initiatives is essential and is pivotal in shaping a sustainable future [2]. Sustainability is a significant component of the advancements in chromatographic methods. We should carefully evaluate their potential environmental impact to ensure high-performance liquid chromatography (HPLC) techniques are genuinely beneficial and environmentally friendly. With various tools readily available, such as the widely recognized AGREE tool, we can aid in this review. Several other tools promoting sustainable analytical methods have been developed, such as GAPI, AGREEprep, ComplexGAPI, HPLC-EAT, AMGS, and analytical eco-scale. Our environmental responsibilities could be met by using these resources to increase research [3].
Pain represents a prominent symptom in most rheumatic illnesses. Rheumatologists and primary care physicians commonly prescribe nonsteroidal anti-inflammatory medicines (nonsteroidal anti-inflammatory drugs [NSAIDs]) for most individuals diagnosed with rheumatic illnesses. Etoricoxib (ETC) (Figure S1a) is in the category of NSAIDs. This compound functions as an oral selective inhibitor of cyclooxygenase-2 (COX-2), it belongs to BCS Class II, characterized by low aqueous solubility (0.02 mg·mL−1) and high permeability [4]. The enzyme cyclooxygenase is accountable for the synthesis of prostaglandins. Previous research in pharmacology has shown that ETC, like other coxibs, can stop COX-2 activity depending on the dose, but not COX-1 activity. According to the results of clinical trials, ETC has received approval for treating osteoarthritis, rheumatoid arthritis (RA), and pain associated with gout attacks. Extra research was done to see how well and safely a 1-year course of ETC at 30, 60, and 90 mg·day−1 worked compared to diclofenac at a fixed dose of 150 mg·day−1. The efficacy of ETC was found to be like that of diclofenac. In contrast, the occurrence of unfavorable gastrointestinal effects was discovered to be descending in individuals treated with ETC compared to those treated with diclofenac. Specifically, the incidence rates for ETC at 30, 60, and 90 mg dosages were 13.1%, 14.7%, and 13.5%, respectively, whereas the incidence rate for diclofenac was 22.5%. Furthermore, it is worth noting that among patients who took diclofenac, there was a higher percentage who terminated their therapy because of experiencing side effects (11.8%) compared to the ETC group (90 mg·day−1, 6.8%) [5]. According to a study published in the Open Rheumatology Journal (2012), ETC treats osteoarthritis and suppresses discomfort alleviation more effectively than other NSAIDs. Previous research has demonstrated that ETC is superior to paracetamol, diclofenac, naproxen, ibuprofen, celecoxib, and lumiracoxib in relieving pain and improving joint function [6]. Individuals diagnosed with RA may experience pain or the exacerbation of pre-existing discomfort, even in ongoing treatment. According to suggestions, it is advised that these individuals be initially treated with paracetamol. When paracetamol proves ineffective, it is advisable to transition patients to a suitable alternative NSAID that is both safe and efficacious. Adding ETC to the main course of disease-modifying therapy may be helpful for some people because it effectively reduces pain and improves the patient’s overall daily functioning. It is worth noting that the safety of ETC is better than that of diclofenac for people with RA, as shown in a randomized clinical practice [7,8,9].
Methocarbamol (MTC) (Figure S1b) is a highly effective medication for acute musculoskeletal pain; it is classified as BCS Class III due to its high aqueous solubility (50 mg·mL−1) and low permeability [10]. As a member of the category of skeletal muscle relaxants, it has been approved for treating muscle spasms since 1957. It is considered one of the most clinically effective muscle relaxants available. MTC is a potent anti-spasmodic drug known for effectively treating even the most severe skeletal muscle spasms that cannot be controlled. Like other medications, such as dantrolene and baclofen, it lessens upper motor neuron-related spasticity. MTC is thought to work by blocking the midbrain reticular activating system. This is a well-known way that anticholinergic drugs work. This makes muscle tone and polysynaptic reflexes much weaker. This is also known as indirect modulation of the synaptic connection between interneurons in the spinal cord. It is important to note that MTC does not directly impact the motor nerve fiber, motor nerve end plate, or skeletal muscle contractility. MTC is a highly effective medication that can be administered orally and has a rapid onset of effect within 30 min. Two hours after administration, the plasma concentration reaches its peak. The liver plays a crucial role in metabolizing this compound, and the resulting half-life ranges between 1 and 2 h. Renal excretion is the primary route of elimination for MTC, where it is primarily excreted as an inactive metabolite. Multiple investigations have documented the notable contribution of the co-administration of MTC and diclofenac potassium or sodium, elucidating their effectiveness in inducing muscular relaxation, alleviating pain and inflammation, including symptoms such as redness and swelling, and promoting enhanced muscle mobility. Nevertheless, several adverse effects associated with the concomitant use of diclofenac and MTC have been documented, including nephrotoxicity, hepatotoxicity, and the development of edema. According to recent research, we have selected an alternative analgesic that exhibits more efficacy and significance than DIC K. It has been found that the incidence of upper gastrointestinal clinical events, such as perforation, bleeding, obstruction, and ulceration, was comparatively reduced in patients treated with ETC as opposed to those treated with diclofenac.
ETC has demonstrated clinical efficacy in treating RA, with an effectiveness comparable to that of diclofenac. The speed at which ETC provides clinical benefit on the first day is faster compared to diclofenac. Both medicines exhibited a relatively favorable tolerability profile [11]. In a study conducted over 14 weeks, the administration of ETC at 5–90 mg once daily showed favorable tolerability in treating RA. Multiple studies have proven the effectiveness of ETC compared to DIC potassium and sodium. Krueger et al. compared the gastrointestinal tolerability of ETC with DIC sodium in patients with RA [12]. Furthermore, Alekseeva conducted a study examining ETC’s safety and efficacy compared to DIC for the treatment of RA and RA [13]. Given the existence of a commercially available formulation containing both MTC and DIC, which has demonstrated efficacy in treating RA and acute musculoskeletal pain, it is reasonable to anticipate that the novel combination of ETC and MTC will exhibit comparable or superior efficacy compared to other combinations in the management and treatment of these conditions. HPLC has many applications across numerous disciplines, making it a highly adaptable and reliable analytical technology. In addition to its accuracy, responsiveness, and exceptional precision, this technology has gained considerable reputation across many substrates. Especially suitable for analytical purposes, it requires little solvent, is fast, and has high precision. The pharmaceutical industry relies on the HPLC strategy to evaluate the active pharmaceutical ingredients (API), contaminants, and laboratories [14].
The literature review indicates that there is currently no documented technique for concurrently analyzing these pharmaceutical compounds in a combination dose form utilizing reverse phase high-performance liquid chromatography (RP-HPLC) with a UV/visible detector. This study presented a new method for identifying ETC and MTC in their API forms and commercial formulations.
Various scientific publications have indicated that the USP and BP pharmacopeias have different classifications for ETC and MTC medicines [15,16]. Various analytical methods have also been developed to evaluate pharmaceutical chemicals alone, in combination with other medications, or in biological fluids. These strategies incorporate HPLC [17–21], and UPLC [22].
After conducting a thorough literature review, it was concluded that there is currently no existing method for simultaneously determining ETC and MTC in plasma samples from rats. This determination was made while considering using DIC as an internal standard (IS) and employing the green chromatography concept, which prioritizes chemists’ protection and environmental preservation. This proposal encompasses the development of an environmentally sustainable, innovative, and highly efficient HPLC technique. The primary objective of this method is to enable rapid and precise quantification of ETC and MTC in rat plasma samples. The potential synergistic impact of the combination of ETC and MTC could enhance the efficacy of RA treatment. The present study examines the potential anti-arthritic effects of combinations of ETC and MTC in rats with arthritis produced by complete Freund’s adjuvant (CFA). The evaluation focuses on the anti-inflammatory and macroscopic anti-arthritic activity of these combinations. Additionally, the study considers the impact of these combinations on hepatic and renal functions, as well as the complete blood count (CBC), to ensure safety. The method that was developed was also subjected to evaluation in terms of its environmental sustainability utilizing various appraisal tools, like AGREE, ComplexGAPI, AGREEprep, GAPI, AMVI, AMGS, Eco-SCALE, and HPLC-EAT. In addition to being faster and more reliable, this method is more practical.
2 Materials and methods
2.1 Chemicals and reagents
This study utilized chemicals such as methanol, sodium dihydrogen phosphate, sodium hydroxide, and orthophosphoric acid procured from reputable suppliers like Merck, Scharlau, and Fischer. MTC of purity 100.07% was purchased by Gennex Laboratories Limited, Telangana, India, while Aurore Life Sciences, a Surat-based company, acquired ETC of purity 99.33%. CFA was acquired from Sigma Chemical Co. in Missouri, USA, while methotrexate (MTX) was sourced from Shanghai Xinyi Pharmaceutical Co., Ltd. in Shanghai, China.
2.2 Chromatographic conditions
The Agilent 1200 Series HPLC system, manufactured by Agilent Technologies (Santa Clara, CA, USA), was employed to develop a novel method for elution in an isocratic mode. A 4.6 mm × 250 mm Hypersil BDS C8 column with a 5 µm particle size was used in the experimental setup. The analysis was maintained at a wavelength of 274 nm and a flow rate of 1.5 mL·min−1. Methanol and buffer pH 2.5 were combined in the mobile phase at a volumetric ratio of 34:66 v/v. To prepare the buffer solution, 1 mL of phosphoric acid was dissolved in 1,000 mL of water (Solution 1), and 1.6 g of sodium dihydrogen phosphate monohydrate was dissolved in 1,000 mL of water (Solution 2). Equal volumes of Solution 1 and Solution 2 were mixed thoroughly. The resulting buffer solution contained 0.05 M sodium dihydrogen phosphate, and the pH was adjusted to 2.5 using phosphoric acid or sodium hydroxide as required.
2.3 Diluent
The diluent employed in the study comprised distilled water and methanol combined in a 50:50 volumetric proportion.
2.4 Stock solutions
The MTC, ETC, and IS solutions were meticulously prepared with the utmost care and precision at 1 mg·mL−1 concentration. Accurately measuring 100 mg of each component and dissolving them in 50 mL of a suitable diluent, we filled the flasks to the mark with the same diluent to produce three working solutions. One working solution has 10 μg·mL−1 of MTC, one with 10 μg·mL−1 of ETC, and one with 100 μg·mL−1 of the IS solution. The solutions are stored at −20°C in the following step, ensuring their stability and reliability for future use.
2.5 Establishing of calibration curves
ETC and MTC were diluted to respective working solutions (10 µg·mL−1) using a pair of 10 mL volumetric flasks to generate varying concentrations within the 1–50 µg·mL−1 range. Methanol was added to the remaining volume of each flask after 1 mL of blank plasma was added. After vertexing for 1 min and centrifugation for 10 min at 4,000 rpm, the filtrate was transferred into separate pairs of volumetric flasks. The contents were then evaporated until all the liquid had evaporated, resulting in dry residue. In each flask, 0.1 mL of the working solution was added after the residue was dissolved in 2 mL of methanol. Following that, a mobile phase combination was added to increase flask capacity. We accurately applied 20 μL of each solution in triplicate using the autosampler. Under specified chromatographic conditions, the operation was conducted. A 10 µg·mL−1 concentration was added to the calibration standards for both ETC and MTC. Plotting the area under the peaks versus the concentration in µg·mL−1 for the calibration curves. After such calibration curves were obtained, regression equations were calculated.
The quality control samples (QCSs) also had 4, 8, and 12 µg·mL−1 concentrations. After that, HPLC was executed on each sample based on a volume of 20 μL. Calibration standards and samples were maintained at −20°C immediately after preparation.
2.6 Experimental animals
Twenty male Wistar rats weighing 160–200 g in adulthood were carefully selected for the study. The animals were observed for 2 weeks to ensure no simultaneous infections before initiating the experiment. The rats were housed in polypropylene enclosures, calibrated to maintain a humidity level of approximately 55.5%, a room temperature of 22°C, and a light–dark cycle of 12 h. They had unlimited access to rodent food and water. The postgraduate studies for advanced sciences faculty at Beni-Suef University in Egypt conducted the study following all applicable laws and regulations governing animal welfare and ethics for regional experimental animals. All the animal handling, feeding, watering, dosing, and weighting were approved according to the ethical committee for Animal Care & Use Committee of Beni-Suef University (Institutional Animal Care and USE Committee; IACUC) with approval number BSU.022.461 and also according to the ARRIVE guidelines for animal research studies.
-
Ethical approval: The research related to animal use has been complied with all the relevant national regulations and institutional policies for the care and use of animals, and has been approved by the ethical committee for Animal Care & Use Committee of Beni-Suef University (Institutional Animal Care and USE Committee; IACUC) with approval number BSU.022.461.
2.7 Induction of rheumatoid arthritis
In the experiment, arthritis was induced by administering 0.1 mL of CFA solution into the right hind paw footpad on two separate days.
2.8 Animal grouping
After inducing RA in adult male rats using Freund’s adjuvant (CFA), they were divided into four groups of ten each. After inducing RA with CFA, twenty adult male rats were divided into four groups of ten rodents each. Group 1 (normal control rats) received the same quantity of vehicle (saline) intra-pedal and orally. Group 2 (arthritis control group) was injected with equal quantities of saline and given orally as a positive control group. The MTX group as standard treatment were received intragastric administration of MTX (2.5 mg/tablet once per day; 20150403; Shanghai Xinyi Pharmaceutical Co., Ltd.), and treatment rats via oral administrations of MTC/ETC combinations, at doses of 135 mg·kg−1 b.wt and 1.8 mg·kg−1 b.wt., respectively. Before CFA injection, at zero time after injection, 1, 2, 3, and 4 h after rheumatoid arthritis induction, measurements were obtained. Using an electronic micrometer, the volume of the rear limb was measured. The measurements were taken before administering the CFA injection, immediately after injection (zero time), and at 1, 2, 3, and 4 h following arthritis induction. The posterior limb volume was measured using an electronic micrometer.
2.9 Assessment of paw edema
As part of the paw edema and swelling rate evaluation, paw volume is measured in each group to monitor arthritis progression. All animals used in this study were ethically treated throughout the experimental time and before scarification via ketamine (90 mg·kg−1) and xylazine (5 mg·kg−1) combination by ratio of 1:1 and 0.1 mL/100 g rat, intraperitoneal. Four measurements were taken before and after injection of CFA, as well as 1, 2, 3, and 4 h after injection. A micrometer was used to measure the rear limb’s volume.
2.10 Biochemical investigations
This study used specific ELISA kits to measure c-reactive protein (CRP) levels in serum, liver, and kidney function in compliance with the manufacturer’s guidelines.
2.11 In vivo sample preparation
Gastric gavage was used to deliver ETC and MTC combinations simultaneously. A blood sample was taken from the median orbital plexus of the rat’s eye to determine the blood and plasma levels. After oral administration, 30 min, 1, 2, 4, 6, 8, 12, and 24 h were chosen as the time intervals. Six rats from the ten total numbers per group were used for sample analysis after excluding the very thick and dead rats. We obtained the rodents from the Beni-Suef University Faculty of Veterinary Medicine. Each animal was weighed, given anesthesia, imbibed, and petted under standard conditions. The approval number was obtained from Beni-Suef University's animal care and ethical committee, carrying the number 022-461. Laboratory animals were handled and used according to their guidelines, as well as the ARRIVE guidelines for animal research studies. These guidelines are incorporated into the IACUC guidelines. The frozen plasma samples underwent thawing at room temperature before the study. The next step was to transfer 100 μL of each sample into a centrifuge tube and mix it with 1 mL of methanol to precipitate the plasma proteins. After vortex mixing the samples for 1 min, they were centrifuged at 4,000 revolutions per minute for 20 min to separate the precipitated plasma proteins. The clear liquid part of each sample was then transferred entirely to a separate sterile tube and left to dry until completely evaporated. Then, the samples were reconstituted using 0.5 mL of methanol. A 10 μL sample of DIC was mixed with the diluent to make a final volume of 1 mL. This was used to make the working solution. This was the last step. Twenty microliters of each sample were added three times to the HPLC machine, following the steps for the HPLC procedure.
2.12 Statistical analysis
The data were analyzed using Statistics for the Social Sciences, version 22 (SPSS, Chicago, IL, USA). A one-way analysis of variance with Tukey’s post hoc multiple comparison test was used to compare the means of the different groups. Additionally, the mean standard error of the mean was calculated to reflect the statistical measure of variability in a sample mean. The outcome obtained from the study showed statistical significance with a p-value of less than 0.05.
3 Tools for assessing methods’ greenness
3.1 AMVI metric
The AMVI technique is extensively acknowledged as the most reliable and robust tool for assessing chromatographic procedures with a high degree of professionalism. It guarantees accurate quantification of the solvents and waste generated during the analysis cycle. It takes a specific HPLC analysis to get precise results when making an active microbial volatile organic compound index (AMVI). To determine the total amount of solvents used, it is significant to record all solvents and compounds used during the collection of samples and chromatographic procedures. The given equation offers a simple method for calculating how much solvent the analytical approach will use and guarantees accuracy with no room for error. Solvent consumption during HPLC and sample preparation is added to determine a method’s total solvent consumption. The overall amount of solvent consumed by a technique is equal to the sum of the solvent consumption during HPLC and the solvent consumption during sample preparation. A complete HPLC analysis requires “number of injections” divided by the number of analytes and a flow rate to estimate the solvent consumption (mL) [23]:
Total solvent consumption = (amount of solvent for standard preparation) + (volume of sample preparation × number of sample preparations) + (volume of system suit preparations).
Multiply the total solvent usage by the number of peak regions of interest to get the AMVI value. A lower AMVI number means that sustainability is more likely to be attained. Analytical methods can be evaluated professionally using this equation. To calculate the volume intensity, divide the total method solvent consumption by the number of analytes:
Technique consumption of solvents = % HPLC consumption of solvent and total method use of solvents.
The solvent consumption sample preparation process is the entire amount of solvent consumed divided by the number of solvent consumption sample preparations.
3.2 Analytical eco-scale assessments
Using the ESA metric is essential when appraising sustainability. As a result, a penalty score is assigned based on parameters such as reagent usage, the potential for risks, the amount of energy consumed, and the amount of waste generated [24]. These scores are summed to determine a comprehensive sustainability level. Penalty points will reduce the score if a perfect 100 is assumed [25]. A system can be classified as “superior green” if its score exceeds 75 points, as “Ideal green” if it scores 50–75 points, or as “subpar green” if it scores lower than 50 points.
3.3 AGREE tool
The complete assessment method employed in AGREE incorporates both general and ecological sustainability factors. Green analytical chemistries (GAC's) 12 core principles determine the numerical score of each principle, ranging from 0 to 1. Each principle contributes to ecological sustainability and, therefore, receives a score of 1. The accomplishment grades for each standard are shown as red, yellow, and green hues on the graph, with each region’s size comparable to the evaluated parameter [26]. AGREE is most used to assess an organization’s environmental sustainability. This methodology is based on the 12 GAC principles.
3.3.1 AGREEprep tool
As part of the analytical process, sample preparation is essential since it relies on the level of strength achieved. In analytical procedures, the AGREEprep measure is designed to assess the environmental impact of sample preparation methods. An environmentally responsible sample preparation technique is paired with a series of assessment processes. Apart from AGREEprep, all our previous procedures aligned with GAC’s 12-point guide. The AGREEprep metric does, however, adhere to the ten principles of the GSP. The ecological impact of these techniques can be evaluated by evaluating various sample preparation techniques using the AGREEprep metric. A combination of environmental responsibility and the assessment process results in a more effective sample preparation process, and the AGREEprep strategy streamlines the procedure for preparation of the sample. Ten steps are used to evaluate each individual’s competence. A performance level of 1 is ideal, with a score ranging from 0 to 1. The pictogram displays the distinct graphic symbol associated with each of the ten regions. Multiple factors have the potential to exert an influence on the score achieved on AGREEprep. Several elements influence the transmission of samples to the laboratory, including hazardous materials, waste production, sample usage per hour, and energy consumed. Preparing for the test requires consideration of all these factors [27].
3.3.2 GAPI tool
Environmental sustainability evaluation tools are helpful when evaluating suggested techniques. Sample preparation, analysis, and categorization contribute to the ecological impact assessment. The levels can be further classified as moderate, low, and high. The tool assesses our analytical methods’ environmental impacts, giving us the information to make well-informed decisions. An ecological sustainability assessment can be completed using this method [28]. Every stage of the procedure is necessary for sample preparation and the final estimation. The pictogram illustrates the 15 descriptive components of the process as well as its five distinct attributes. Considering all relevant factors, the GAPI system provides significant effectiveness when analyzing various analytical methods.
3.3.3 ComplexGAPI tool
One new statistic is the ComplexGAPI measurement and inventive technique that adds an extra hexagonal layer to the traditional GAPI metric to simplify pre-analysis procedures. This category considers several factors, such as the outcome of the process, the specific conditions under which it was performed, the substances used, the solvents employed, the environmental compatibility, the instruments used, and any additional steps required for processing and purifying the materials. To estimate the durability of different parts, color-coding methods like the GAPI are employed. This design illustrates three levels of environmental concern: red, yellow, and green. Red indicates significant concerns, yellow indicates moderate concerns, and green indicates minor issues [29].
3.3.4 AMGS tool
In the context of AMGS, evaluating and contrasting various methods based on their respective environmental implications is possible. Using the quantitative approach involves examining factors such as additives, the consumption of instrumental energy, and the generation and management of solvent waste. In a broad sense, evaluating a method’s sustainability by AMGS is conducted from a perspective standpoint [30].
3.3.5 HPLC-EAT
The software tool HPLC-EAT enables the assessment of liquid chromatographic techniques, hence providing a means to evaluate such methods. It is possible to carry out a thorough investigation to evaluate the health, safety, and impact on the environment of each solvent used in the procedure [31].
4 Results
4.1 Methods development and optimization
After performing various trials, we found that manipulating the mobile phase composition was crucial. We first tried methanol and water in a 50:50 v/v ratio. We then tried a combination of buffer phosphate (pH 4.0) and methanol in the same ratio. Finally, we found the best conditions by using a mobile phase consisting of a buffer solution with a pH of 2.5 and methanol in a volumetric ratio of 34:66. We also used different columns with varying packing materials and lengths, including C18, phenyl, and cyano columns ranging from 100 to 250 mm in length. After trying all of them, we found that the 5 µm Hypersil C8 column with 250 mm × 4.6 mm dimensions was the best choice. This column showed improved resolution and rapid separation, as shown in Figure 1. We also tested various wavelengths in the 200–400 nm range and found that a wavelength of 274 nm gave a chromatogram with distinct peaks and high resolution. Therefore, the optimal chromatographic conditions for obtaining well-defined, distinct peaks with high resolution were a Hypersil BDS C8 column with 4.6 mm × 250 mm dimensions and a particle size of 5 µm, a flow rate of 1.5 mL·min−1, a detection wavelength of 274 nm, and a mobile phase consisting of a mixture of buffer pH 2.5 and methanol in a volumetric ratio of 34:66. The column temperature was maintained at 25°C.

HPLC chromatograms for three different samples: (a) blank plasma, (b) blank plasma spiked with MTC, ETC, and DIC (IS) medicines, and (c) sample obtained after oral administration to rats for 1 h.
4.2 In vivo study
Considering the reported pharmacokinetic properties, the recommended administration schedule is 6-h intervals. In hemodialysis patients, the duration of elimination does not exhibit any significant variation compared to the control group. Nevertheless, it was observed that the renal clearance in hemodialysis patients was diminished [32]. In individuals diagnosed with cirrhosis, there is a decrease in clearance, but there is currently no specific recommendation for a dose change. According to a study conducted by researchers, individuals diagnosed with cirrhosis could tolerate a dosage of 500 mg delivered twice daily [33]. This study assesses CRP as a measure of systemic inflammation in RA [34]. Rodents with arthritis had noticeably increased serum levels of CRP, which is matched with the results of Arjumand et al. [35]. On the other hand, MTC and ETC supplementation dramatically reduced CRP serum levels in arthritic animals, suggesting that MTC and ETC are anti-inflammatory.
4.3 Effect of MTC and ETC on gross lesions of the paw and ankle joint (induced RA)
On the surface, rats with arthritis induced by CFA exhibited swelling, edema, and erythema on their right rear feet and ankles. As a result of the MTC and ETC treatment, these visible lesions significantly decreased in the arthritic group (Figure 2).

Different groups of rats show visceral edema and inflammation in their right rear feet and ankles; normal control rats, arthritic rats, and standard-treated rats treated with MTC and ETC suggest their anti-inflammatory and antiarthritic macroscopic properties.
4.4 Effect of MTC and ETC on right hind paws volume
CFA-induced arthritis caused rats to have edematous paws as compared with controls (p < 0.05). Rats with arthritis had smaller feet that were treated with MTC and ETC (Figure 3). In addition to measuring the circumference of the right hind foot and ankles, digital calipers were used to visualize edema and inflammation in the right rear feet of rodents from various groups. An experimental group of normal rats and arthritic rats received MTC and ETC, as well as an experimental group of normal rats and arthritic rats.

CFA-induced arthritis rats’ right-hand paw size in response to MTC–ETC combination. The symbols at p < 0.05 indicate significance.
4.5 Effect of MTC and ETC on serum CRP levels
As shown in Figure 4, MTC and ETC affect serum levels of CRP. Rodents given CFA showed significant increases in CRP serum levels (p < 0.05). As compared to the arthritis group, MTC and ETC significantly decreased CRP serum levels in arthritic rodents (p < 0.05).

Efficacy of MTC and ETC in reducing serum CRP levels. Statistically significant differences (p > 0.05) between parameters are indicated using different superscript alphabets (a) and (b).
4.6 Safety study about MTC and ETC combinations on complete blood picture (CBC), liver (glutamate pyruvate transaminase [GPT] and glutamate oxaloacetate transaminase [GOT]), and kidney functions (creatinine and urea)
In the current study, no statistically significant alterations (p > 0.05) were seen in the levels of hemoglobin and total erythrocyte count among the different groups of rats. Similarly, there were no significant changes in packed cell volume and TEC, as depicted in Figure 5. Concerning the differential cell count, as depicted in Figure 5, there were no notable disparities found across the treatment groups. The total leucocytic count did not significantly change (p > 0.05) in control-positive arthritic rats; however, the platelet count did decrease modestly, as shown in Figure 5.

Blood pictures were taken in (a) normal, (b) arthritic, (c) standard, and (d) treated rats.
MTC and ETC reduce the elevated levels of hepatic enzymes in untreated, positive rodents with elevated ALT, AST, and GPT/GOT or GPT/GOT activity, which indicates a hepatotoxic effect in RA patients (Figure 6). Accordingly, MTC and ETC reduce the elevated renal enzymes depicted in Figure 6 as well as the blood urea levels, suggesting a nephrotoxic effect of CFA or renal injury in RA patients.

Different groups had differing liver enzyme (GPT and GOT) and kidney enzyme (creatinine and urea) activity. Superscript alphabets (a)–(c) indicate statistically significant parameter differences.
As a result, our findings showed how effective MTC and ETC are at lowering inflammatory responses within tissues and suppressing inflammatory responses and arthritis-related paw edema. Because of their inhibitory effects in reducing tissue inflammation and restricting the edematous features of arthritis, our results thus indicated the anti-inflammatory activity of MTC and ETC therapies as therapeutic targets for RA.
The results of our study jointly provide evidence and elucidate the effectiveness of MTC and ETC as medicines for the treatment of RA, exhibiting anti-arthritic and anti-inflammatory properties without causing toxicity. Our results are supported by the observed normal liver and kidney functions in the subjects of our investigation. The study found a significant decrease in peptic ulcers among individuals who received treatment with ETC compared to those treated with ibuprofen [36]. The comparative analysis of ETC with other NSAIDs has demonstrated its efficacy as a therapeutic alternative for those suffering from osteoarthritis and RA. However, it is essential to note that ETC is associated with a relatively elevated likelihood of gastrointestinal problems. According to a comparative analysis between ETC and other NSAIDs, ETC demonstrates greater efficacy as a treatment option for patients suffering from osteoarthritis, RA, ankylosing spondylitis, or gout who exhibit limited cardiovascular risk factors and a relatively elevated susceptibility to gastrointestinal complications. MTC toxicity in isolation, without numerous drug exposures, is rare and improbable to result in fatality [37].
4.7 Method validation
The proposed methodology was rigorously evaluated as an integral part of the validation procedure for the pharmaceutical compounds under investigation, adhering strictly to the procedures issued by the United States Food and Drug Administration (FDA) for validating bioanalytical methods in an industrial setting for parameters specific to biological matrices (e.g., matrix effect, recovery, stability in plasma) [38] and ICH Q2(R1) guidelines for analytical validation criteria, including specificity, linearity, accuracy, precision, limit of detection (LOD), and limit of quantification (LOQ) [38,39]. This dual approach ensures compliance with international standards for both bioanalytical and pharmaceutical quality control (QC) applications [39].
4.8 Linearity and range
Calibration curves were constructed utilizing a linear regression approach to graphically represent the peak-area ratio of each drug relative to the IS as a function of their respective concentrations. The HPLC approach involved the examination of concentrations within the range of 1–50 µg·mL−1. Using the HPLC method, it was possible to find influential correlation coefficients, with values of 0.9999 for MTC and 0.9998 for ETC. Regression equation parameters are given in Table 1.
Regression parameters for the suggested MTC and ETC determination methods in rat plasma
| Parameter | Drugs | |
|---|---|---|
| MTC | ETC | |
| Wavelength | 274 nm | 274 nm |
| Range (µg·mL−1) | 1–50 | 1–50 |
| Coefficients of determination (R 2) | 0.9999 | 0.9998 |
| Slope | 37.09 | 13.79 |
| Intercept | 11.08 | 0.44 |
| LOD | 0.2 µg·mL−1 | 0.25 µg·mL−1 |
| LOQ | 0.6 µg·mL−1 | 0.75 µg·mL−1 |
4.9 Limits of quantification
4.9.1 Lower limit of quantification (LLOQ)
The initial point of focus in constructing the calibration curve is to ensure that the drug reaction is a minimum of five times greater than the response observed in the blank plasma. Furthermore, ensuring that the computed concentration does not exceed a precision of 20% is essential, as shown by the coefficient of variation (CV) or relative standard deviation (RSD). Drugs using the developed methods were quantified down to 1 µg·mL−1 using the lower limits of quantification calculated as displayed in Table 1.
4.9.2 Upper limit of quantification (ULOQ)
There must be a precision of at least 15% for the peak with the highest concentration on each calibration graph, as indicated by the CV or RSD. Furthermore, the accuracy of the measurement must remain within a range of 100 ± 15% of the correct concentration. The ULOQ for measuring ETC and MTC using the HPLC method was determined to be 50 µg·mL−1, as shown in Table 1.
4.10 QCSs
Three QCSs were used to validate the procedure (spiked plasma samples). The QCSs are categorized into three groups: low QC (LQC) samples, middle QC (MQC) samples, and high-quality (HQC) samples. The LQC samples have a concentration three times higher than the LLOQ. The MQC samples have concentrations that fall within the middle range of the calibration graph. The HQC samples have concentrations that are below the upper limits of quantitation. Both drugs were examined using HPLC methods with 4, 8, and 12 µg·mL−1 QC concentrations.
4.11 Accuracy and precision
The method’s accuracy was assessed by employing QCSs and following the linearity technique. After performing the regression analysis, the concentrations were computed. The acceptable accuracy limit for QC should not surpass 15%, whereas the LLOQ should not exceed 20% accuracy. The accuracy and precision of a previous QCS were evaluated by performing three separate analyses on the same day. Additionally, the precision and accuracy between runs were evaluated by conducting a consecutive 3-day examination of the same samples. It was considered less accurate if the RSD (or CV) value was higher than 15%. In comparison, a bias value within 15% for the measured concentrations was considered good enough. The intraday HPLC method was found to have a remarkably low relative standard deviation (% RSD), as shown in Table 2. The values obtained for recovery fell within the acceptable range of 100 ± 15%, indicating that the established procedures are reliable and accurate, as demonstrated by the finding in Table 2. These findings confirm the precision and reproducibility of the simultaneous determination of the researched substances using the established procedures.
MTC and ETC quantification in rat plasma with intra-day and inter-day precision
| Analyte | Conc added (µg·mL−1) | Intra-day | Inter-day | ||
|---|---|---|---|---|---|
| Mean recovery% ± RSD | Bias (%) | Mean recovery% ± RSD | Bias (%) | ||
| MTC | 4 | 91.41 ± 2.29 | −8.59 | 93.20 ± 0.88 | −6.80 |
| 8 | 90.03 ± 2.44 | −9.97 | 96.63 ± 1.11 | −3.37 | |
| 12 | 91.50 ± 1.78 | −8.50 | 97.80 ± 0.92 | −2.20 | |
| Mean ± % RSD | 90.98 ± 0.91 | 95.88 ± 2.49 | |||
| ETC | 4 | 105.38 ± 1.55 | 5.38 | 104.65 ± 1.53 | 4.65 |
| 8 | 104.17 ± 1.87 | 4.17 | 105.62 ± 1.96 | 5.62 | |
| 12 | 105.25 ± 1.14 | 5.25 | 106.03 ± 1.22 | 6.03 | |
| Mean ± % RSD | 104.93 ± 0.63 | 105.43 ± 0.67 | |||
4.12 Selectivity
Selectivity in the plasma matrix pertains to the efficacy with which the used procedures may effectively differentiate and isolate the investigated medicines from one another. The QCSs underwent spiking with the study medications and the IS to assess the presence of endogenous interferences. Subsequently, a comparison was made between the chromatograms obtained from the plasma samples and those derived from blank plasma. Based on the chromatograms of blank plasma samples and plasma samples containing the investigated medications, as depicted in Figure 1a–c, it can be concluded that there was no significant interference from endogenous plasma constituents.
4.13 Matrix effect and extraction recovery
This experiment aimed to assess the potential impact of the plasma matrix on the recovery of the compounds under investigation. This was achieved by comparing the peak areas acquired from plasma samples spiked with pure pharmaceuticals to those obtained from pure standard solutions of the same concentration. Testing was conducted on the QCSs. Because the extraction recovery calculation was used, the MTC and ETC values were between 103.76% and 105.31% for MTC and between 103.56% and 105.09% for ETC. Following the finding displayed in Table S1, the presence of the plasma matrix had almost no effect on the drug being extracted from the plasma matrix.
4.14 Stability
Various conditions were employed to assess the stability of the investigated drugs in the endogenous plasma matrix. These conditions encompassed storing the samples at room temperature (25°C) for 6 h to evaluate bench-top stability, maintaining the samples at −20°C for 6 weeks to examine long-term stability, subjecting them to three freeze–thaw cycles at temperatures ranging from 20°C to room temperature to assess freeze and thaw stability, and finally leaving them at 25°C for 2 days at an autosampler to evaluate post-preparative stability. Additionally, the samples were subjected to three freeze-thaw cycles. The samples were evaluated in triplicate per the instructions for each respective procedure. The stability of the analyte was appraised by analyzing the plasma concentrations and calculating the average recovery rate, which was found to be 100 ± 15%. The results shown in Table 3 show that the stability of QCs was carefully studied in several different conditions. The test conditions did not have a noticeable effect on the plasma samples. Therefore, it can be confidently concluded that the QCs remained stable across different settings.
Results from the suggested techniques for evaluating the stability of MTC and ETC in rat plasma under various conditions
| Analyte | Conc added (µg·mL−1) | % remaining | |||
|---|---|---|---|---|---|
| 6 h at ambient temperature | Autosampler for 48 h | Three freeze–thaw cycle | −20°C for 6 weeks | ||
| MTC | 4 | 87.15 | 92.34 | 103.42 | 105.43 |
| 8 | 88.31 | 89.53 | 102.79 | 103.48 | |
| 12 | 91.47 | 93.63 | 105.68 | 104.77 | |
| ETC | 4 | 88.89 | 90.14 | 104.27 | 101.56 |
| 8 | 90.45 | 93.16 | 105.79 | 103.46 | |
| 12 | 91.83 | 94.78 | 105.56 | 105.75 | |
4.15 System suitability
The system’s appropriateness was thoroughly evaluated based on several parameters, including retention time, peak area, asymmetry factor, theoretical plates, and tailing factor for both ETC and MTC. To ensure that the system is appropriate, it is strongly recommended to maintain the RSD below 1% and ensure that the asymmetry factor exceeds a value of 2 and the number of theoretical plates is above 2,000. The optimal values are displayed in Table S2.
4.16 Assay of medicinal form
An HPLC method was used to analyze the assay sample. Six samples were evaluated in depth. The results show no problem with the medication’s assay form. A summary of the outcomes is provided in Table S3.
5 Discussion
5.1 Greenness assessment of the suggested approach
5.1.1 AMVI tool
It has been proven through experience that the AMVI method works well for correctly figuring out how to use solvents in liquid chromatography settings. The methods outlined above can handle a range of analytical techniques, such as liquid chromatography protocols. Various analytical procedures can be utilized in conjunction with a complex laboratory apparatus. Since the AMVI value of 113 is lower than that of the original method, Table 4 shows evidence that it is good for the environment.
AMVI computation for assessing the recommended approach
| Codes | Suggested approach |
|---|---|
| Amount of solvent consumed by HPLC (mL) | 324 |
| Flow rate | 1.5 |
| Run time | 8 |
| A complete analysis requires a certain number of injections | 9 |
| Analytes counted | 3 |
| Amount of solvent consumed in sample preparation (mL) | 120 |
| Volume of standard preparation (mL) | 50 |
| Number of preparations for standards | 1 |
| Volume of sample preparation (mL) | 10 |
| Sample preparation number | 2 |
| Volume of system suit (mL) | 50 |
| The number of preparations for the system suits | 1 |
| Consumption of all method solvents | 444 |
| Analytical method volume intensity | 148 |
| HPLC consumption (%) | 73 |
| Preparations consumption (%) | 27 |
Bold values highlight key figures related to solvent consumption in HPLC and sample preparation, helping assess the method s environmental impact.
5.1.2 ESA tool
The greenness profile is an extensively recognized and standardized tool for evaluating environmental sustainability. In this context, the ESA tool assessed the current approach, and the applicable penalty points were calculated with utmost precision. The method under consideration boasts a remarkable ecological sustainability score of 84, which confidently signifies its high level of environmental friendly. The penalty points are tabulated in Table 5, providing a clear and concise overview of the assessment results.
Assessing the recommended approach’s analytical eco-scale score yields penalty points
| Analytical eco-scale | Penalty points | |
|---|---|---|
| Reagents | Methanol | 6 |
| Orthophosphoric acid | 2 | |
| Sodium hydroxide | 2 | |
| Sodium dihydrogen phosphate | 0 | |
| Purified water | 0 | |
| Instruments | HPLC energy ≤1.5 kWh/sample | 1 |
| Occupational hazard | 0 | |
| Ultrasonic | 1 | |
| Centrifuge | 1 | |
| Waste | 3 | |
| Points for penalties | 16 | |
| Total score for eco-scale | 84 |
Bold entries emphasize penalty points and total Eco-Scale score, which reflect the greenness of the analytical method.
5.1.3 AGREE tool
Green profiles are evaluated using AGREE, a technique based on 12 principles of GAC, as shown in Figure S2a. Various green color combinations are shown in Figure 7a, indicating various levels of eco-friendliness, along with AGREE pictograms and a score of 0.57 in the middle.


The pictograms utilized for assessing the environmental sustainability of the suggested HPLC method encompass the following: (a) AGREE, (b) AGREEprep, (c) GAPI, (d) ComplexGAPI, (e) AMGS, and (f) HPLC EAT.
5.1.4 AGREEprep tool
The assessment of the ecological impact of sample preparation processes can be conducted by the utilization of the AGREEprep metric. Using environmentally friendly sample preparation techniques streamlines the assessment procedure by conforming it to 10 fundamental criteria. The AGREEprep framework uses a scale from 0 to 1 to assess performance based on ten discrete steps. Scores of 1 represent the optimal level of achievement at the highest degree. Figure S2b visually represents the ten sectors as a pictogram. Figure 7b depicts the environmental sustainability of the existing approach, as evidenced by their respective finding of 0.63.
5.1.5 GAPI tool
Analyzing the greenness of analytical procedures requires a reliable strategy such as GAPI. Figure S3a shows five essential parts of the method and thoroughly explains all 15 parts that comprise the process, from getting the sample ready to the determination step. Using GAPI to evaluate various analytical procedures is an efficacious approach encompassing all pertinent factors and concerns. According to Figure 7c, the result obtained using this methodology is ecologically effective.
5.1.6 ComplexGAPI tool
GAC attributes are integrated into the ComplexGAPI metric to evaluate analytical procedures. An additional hexagon is introduced into the GAPI pictogram for the pre-analysis procedure, thus supplementing the traditional GAPI metric (Figure S3b). A wide variety of aspects are covered in these processes, as illustrated in Figure 7d.
5.1.7 AMGS tool
Using a numerical scoring system based on solvent energy and safety components shown in Figure 7e, we can divide the tool into clear categories that make it easier to compare all the different procedures. Segments of three different colors representing the instrument’s energy, the solvent’s energy, and the solvent’s safety are also present with the instrument’s score. The ACS-GCI-PR website provides access to AMGs at https://www.acsgcipr.org/amgs. Figure S4a explains how to establish the AMGS tool.
5.1.8 HPLC-EAT
Figure 7f depicts user-friendliness and ease of use as excellent program features. Figure S4b demonstrates the inherent constraint of this method since it prioritizes examining solvents’ ecological impacts while disregarding other critical considerations, such as sample preparation, equipment, and energy usage.
6 Conclusion
A novel green RP-HPLC approach was successfully established to quantify ETC and a co-administered MTC in rat plasma. The method exhibited high sensitivity, accuracy, and selectivity. Additionally, the IS used in this study was DIC. The degree of greenness of the invented methods was assessed using eight different sustainability evaluation techniques, including analytical eco-scaling, ComplexGAPI, AGREE, HPLC-EAT, AGREEprep, GAPI, AMGS, and AMVI. Our study on rat models tested the effectiveness of ETC and MTC combinations for treating RA inflammation. Results showed significant improvement in anti-arthritic, anti-inflammatory, and macroscopic effects in arthritic rodents. Furthermore, ETC and MTC reduced serum CRP levels in arthritic animals while maintaining normal CBC, liver, GPT, GOT, and renal functions. These promising findings suggest that ETC and MTC could be safe and practical treatments for RA. The suggested technique was validated following the recommendations set by the FDA, and the obtained findings were found to be satisfactory, aligning with the acceptable standards.
Acknowledgments
The current work was supported by Princess Nourah bint Abdulrahman University Researchers Supporting (project number (PNURSP2025R419), Princess Nourah bint Abdulrahman University, Riyadh, Saudi Arabia.
-
Funding information: The current work was supported by Princess Nourah bint Abdulrahman University Researchers Supporting (project number (PNURSP2025R419), Princess Nourah bint Abdulrahman University, Riyadh, Saudi Arabia.
-
Author contributions: Tahani Y. A. Alanazi: conceptualization, formal analysis, writing – review & editing. Samar M. Mahgoub: investigation, methodology, writing – original draft. Fatma I. Abo El-Ela: methodology, supervision, writing – original draft. Ammena Y. Binsaleh: resources, validation, writing – review & editing. Mohamed A. M. Ali: visualization, data curation, software. Mahmoud A. Mohamed: project administration, formal analysis, writing – original draft.
-
Conflict of interest: Authors state no conflict of interest.
-
Data availability statement: The datasets generated during and/or analyzed during the current study are available from the corresponding author on reasonable request.
References
[1] Alanazi TYA, Almalki MA, Mohamed MA, Nassar HF. Five greenness assessments of novel RP-UPLC and MCR methods for concurrent determination of selected pharmaceutical drugs in comparison with the lean Six Sigma approach. Microchem J. 2023;194:109359. 10.1016/j.microc.2023.109359.Search in Google Scholar
[2] Mahgoub SM, Mahmoud MR, Binsaleh AY, Almalki MA, Mohamed MA, Nassar HF. Analytical assessment of a novel RP-HPLC method for the concurrent quantification of selected pharmaceutical drugs levodopa and carbidopa using eight greenness metrics comparing to the lean six sigma approach. Sustain Chem Pharm. 2023;36:101291. 10.1016/j.scp.2023.101291.Search in Google Scholar
[3] Ahmed HA, El-Atawy MA, Nassef HM, Amin MS, Jaremko M, Emwas AH, et al. Eco-friendly chromatographic techniques for appraisal of Amlodipine, Hydrochlorothiazide, Telmisartan, and their related substances in dosage form: Application to six sigma and content uniformity approaches. Sustain Chem Pharm. 2024;38:101469. 10.1016/j.scp.2024.101469.Search in Google Scholar
[4] Shah J, Kotadiya R. A critical review on analytical methods for recently approved FDC drugs: Pregabalin and etoricoxib. Crit Rev Anal Chem. 2022;52:1048–68.10.1080/10408347.2020.1855411Search in Google Scholar PubMed
[5] da Silva Júnior CA, Girotto Júnior G, Morais C, de Jesus DP. Green chemistry for all: three principles of Inclusive Green and Sustainable Chemistry Education. Pure Appl Chem. 2024;96:1299–311.10.1515/pac-2024-0245Search in Google Scholar
[6] Varagani S, RS MS, Anuvidya R, Kondru S, Pandey Y, Yadav R, et al. A comparative study on assessment of safety and efficacy of Diclofenac, Naproxen and Etoricoxib in reducing pain in osteoarthritis patients-An observational study. Int J Curr Res Med Sci. 2024;10:31–8.Search in Google Scholar
[7] Govindaswamy S, Ponnusamy K, Indhumathi S, Anil V, Venugopal J, Sundaram DP. A systematic review and meta-analysis of selective cyclooxygenase-2 inhibitors and non-selective non-steroidal anti-inflammatory drugs for acute gout. J Pharmacol Pharmacother. 2024;15:122–32.10.1177/0976500X241240629Search in Google Scholar
[8] Zhu J, Xia Z, Min J, Hu W, Li H, Mei C. A clinical study on the risk and safety profiles of NSAIDs used for osteoporotic fractures in Chinese patients with rheumatoid arthritis. Trop J Pharm Res. 2024;23:437–45.10.4314/tjpr.v23i2.26Search in Google Scholar
[9] Karvir S, Jadhwar SS, Mehta KD. A cross-sectional survey of Indian orthopaedicians to understand the place in therapy for the latest soft gel formulation of etoricoxib. Int J Res Orthop. 2022;8:481.10.18203/issn.2455-4510.IntJResOrthop20221626Search in Google Scholar
[10] Kumari J, Gadewar M, Kumar A. An updated account of the BCS: biopharmaceutical classification system. Neuroquantology. 2022;20:3165–77.Search in Google Scholar
[11] Luksameesate P, Tanavalee A, Taychakhoonavudh S. An economic evaluation of knee osteoarthritis treatments in Thailand. Front Pharmacol. 2022;13:926431.10.3389/fphar.2022.926431Search in Google Scholar PubMed PubMed Central
[12] Krueger K, Lino L, Dore R, Radominski S, Zhang Y, Kaur A, et al. Gastrointestinal tolerability of etoricoxib in rheumatoid arthritis patients: results of the etoricoxib vs diclofenac sodium gastrointestinal tolerability and effectiveness trial (EDGE-II). Ann Rheum Dis. 2008;67(3):315–22. 10.1136/ard.2007.082388.Search in Google Scholar PubMed
[13] Alekseeva LI. Comparative evaluation of the safety and efficacy of etoricoxib and diclofenac on the upper gastrointestinal tract in patients with osteoarthrosis and rheumatoid arthritis (the multinational etoricoxib and diclofenac arthritis long-term (MEDAL) study program). Ter Arkh. 2010;82(8):57–62.Search in Google Scholar
[14] Mohamed MA. Stability-indicating new RP-UPLC method for simultaneous determination of a quaternary mixture of paracetamol, pseudoephedrine, chlorpheniramine, and sodium benzoate in (Cold–Flu) syrup dosage form. J AOAC Int. 2022;105:703–16. 10.1093/jaoacint/qsac002.Search in Google Scholar PubMed
[15] British Pharmacopoeia Commission. British Pharmacopoeia 2024. Vol. 2, London: Medicines and Healthcare Products Regulatory Agency (MHRA); 2024. p. 1248.Search in Google Scholar
[16] United States Pharmacopeial Convention. United States Pharmacopeia and National Formulary (USP 47–NF 42). Vol. 43, Rockville, MD: United States Pharmacopeial Convention Inc.; 2024. p. 3761.Search in Google Scholar
[17] Kalokhe S, Nalwade S, Patil P, Raskar P. Development and validation of a stability-indicating high-performance liquid chromatographic method for the quantification of methocarbamol and its impurities in pharmaceutical dosage forms. J Chromatogr Sci. 2021;59:555–65.10.1093/chromsci/bmaa125Search in Google Scholar PubMed
[18] Assirey EA, Ahmed HA, Al-Faze R, Amin MS, Mahgoub SM, El-Ela FI, et al. Novel RP-HPLC method for estimation of a newly developed combination of tizanidine and etoricoxib in rat plasma: Eight criteria for greens evaluation. Arch Pharm. 2024;357(8):2400025. 10.1002/ardp.202400025.Search in Google Scholar PubMed
[19] Elkady E, Fouad M, Mozayad A. Application of Box–Behnken design and response surface methodology for selecting the optimum RP-HPLC conditions for the simultaneous determination of paracetamol and diclofenac sodium along with three skeletal muscle relaxants in three different pharmaceutical dosage forms. J Chromatogr Sci. 2024;62:328–38. 10.1093/chromsci/bmad051.Search in Google Scholar PubMed
[20] El-Yazbi FA, Amin OA, El-Kimary EI, Khamis EF, Younis SE. Simultaneous determination of methocarbamol and aspirin in presence of their pharmacopeial-related substances in combined tablets using novel HPLC-DAD method. Drug Dev Ind Pharm. 2019;45:265–72. 10.1080/03639045.2018.1535603.Search in Google Scholar PubMed
[21] Mohamed SA, Belal FF. A micellar HPLC method for simultaneous determination of methocarbamol in three different tablets using single run; application to human plasma and evaluation of the method greenness. Microchem J. 2019;148:262–9. 10.1016/j.microc.2019.04.079.Search in Google Scholar
[22] Güzel R, Ertekin ZC, Ziyadanoğulları B, Dinç E, Ziyadanoğulları R. Comparative study of the quantitative resolution of paracetamol and methocarbamol mixture by spectrophotometry with wavelet transform and UPLC techniques. Pharm Chem J. 2022;55:1126–32. 10.1007/s11094-021-02547-1.Search in Google Scholar
[23] Hartman R, Helmy R, Al-Sayah M, Welch CJ. Analytical method volume intensity (AMVI): A green chemistry metric for HPLC methodology in the pharmaceutical industry. Green Chem. 2011;13(4):934–9. 10.1039/C0GC00524J.Search in Google Scholar
[24] Alanazi TYA, Adel Pashameah R, Binsaleh AY, Mohamed MA, Ahmed HA, Nassar HF. Condition optimization of eco-friendly RP-HPLC and MCR methods via Box–Behnken design and six sigma approach for detecting antibiotic residues. Sci Rep. 2023;13:15729. 10.1038/s41598-023-40010-1.Search in Google Scholar PubMed PubMed Central
[25] Gałuszka A, Migaszewski ZM, Konieczka P, Namieśnik J. Analytical Eco-Scale for assessing the greenness of analytical procedures. TrAC Trends Anal Chem. 2012;37:61–72. 10.1016/j.trac.2012.03.013.Search in Google Scholar
[26] Kowtharapu LP, Katari NK, Sandoval CA, Rekulapally VK, Jonnalagadda SB. Green chromatographic method for determination of active pharmaceutical ingredient, preservative, and antioxidant in an injectable formulation: Robustness by design expert. ACS Omega. 2022;7(38):34098–108. 10.1021/acsomega.2c03387.Search in Google Scholar PubMed PubMed Central
[27] Wojnowski W, Tobiszewski M, Pena-Pereira F, Psillakis E. AGREEprep–analytical greenness metric for sample preparation. TrAC Trends Anal Chem. 2022;149:116553. 10.1016/j.trac.2022.116553.Search in Google Scholar
[28] Płotka‐Wasylka J. A new tool for the evaluation of the analytical procedure: Green Analytical Procedure Index. Talanta. 2018;181:204–9. 10.1016/j.talanta.2018.01.013.Search in Google Scholar PubMed
[29] Płotka‐Wasylka J, Wojnowski W. Complementary green analytical procedure index (ComplexGAPI) and software. Green Chem. 2021;23(21):8657–65. 10.1039/D1GC02318G.Search in Google Scholar
[30] Gundecha S, Patel M, Mayur YC. An application of quality by design and analytical greenness assessment approach for the development of erlotinib stability indicating method. Chromatographia. 2022;85(7):575–88. 10.1007/s10337-022-04167-7.Search in Google Scholar
[31] Gaber Y, Törnvall U, Kumar MA, Amin MA, Hatti-Kaul R. HPLC-EAT (Environmental Assessment Tool): a tool for profiling safety, health and environmental impacts of liquid chromatography methods. Green Chem. 2011;13(8):2021–5. 10.1039/C0GC00667J.Search in Google Scholar
[32] Sica DA, Comstock TJ, Davis J, Manning L, Powell R, Melikian A, et al. Pharmacokinetics and protein binding of methocarbamol in renal insufficiency and normals. Eur J Clin Pharmacol. 1990;39:193–4.10.1007/BF00280060Search in Google Scholar PubMed
[33] Abd-Elsalam S, Arafa M, Elkadeem M, Elfert A, Soliman S, Elkhalawany W, et al. Randomized-controlled trial of methocarbamol as a novel treatment for muscle cramps in cirrhotic patients. Eur J Gastroenterol Hepatol. 2019;31:499–502. 10.1097/MEG.0000000000001310.Search in Google Scholar PubMed
[34] Yang L, Liu R, Fan A, Zhao J, Zhang Y, He J. Chemical composition of Pterospermum heterophyllum root and its anti-arthritis effect on adjuvant-induced arthritis in rats via modulation of inflammatory responses. Front Pharmacol. 2020;11:584849. 10.3389/fphar.2020.584849.Search in Google Scholar PubMed PubMed Central
[35] Arjumand S, Shahzad M, Shabbir A, Yousaf MZ. Thymoquinone attenuates rheumatoid arthritis by downregulating TLR2, TLR4, TNF-α, IL-1, and NFκB expression levels. Biomed Pharmacother. 2019;111:958–63. 10.1016/j.biopha.2019.01.006.Search in Google Scholar PubMed
[36] Hunt RH, Harper S, Watson DJ, Yu C, Quan H, Lee M, et al. The gastrointestinal safety of the COX-2 selective inhibitor etoricoxib assessed by both endoscopy and analysis of upper gastrointestinal events. Am J Gastroenterol. 2003;98:1725–33. 10.1111/j.1572-0241.2003.07598.x.Search in Google Scholar PubMed
[37] Wang R, Dasgupta A, Ward MM. Comparative efficacy of non-steroidal anti-inflammatory drugs in ankylosing spondylitis: a Bayesian network meta-analysis of clinical trials. Ann Rheum Dis. 2016;75:1152–60. 10.1136/annrheumdis-2015-207677.Search in Google Scholar PubMed PubMed Central
[38] FDA, Guidance for Industry Bioanalytical Method Validation Guidance for Industry Bioanalytical Method Validation, 2013, https://www.fda.gov/downloads/drugs/guidances/ucm386366.pdf.Search in Google Scholar
[39] I.H.T. Guideline, Validation of analytical procedures Q2 (R2), ICH Geneva, Switz, 2022.Search in Google Scholar
© 2025 the author(s), published by De Gruyter
This work is licensed under the Creative Commons Attribution 4.0 International License.
Articles in the same Issue
- Research Articles
- Impressive stability-indicating RP-HPLC method for concurrent quantification of salbutamol, guaifenesin, and sodium benzoate in cough syrup: Application of six sigma and green metrics
- Bioanalytically validated potentiometric method for determination of bisphenol A: Application to baby bibs, pacifiers, and Teethers’ saliva samples
- Environmental impact of RP-HPLC strategy for detection of selected antibiotics residues in wastewater: Evaluating of quality tools
- Trace-level impurity quantification in lead-cooled fast reactors using ICP-MS: Methodology and challenges
- Picogram-level detection of three ACE inhibitors via LC–MS/MS: Comparing BMP and UOSA54 derivatization methods
- Eco-friendly RP-HPLC method for concurrent estimation of a promising combination of methocarbamol and etoricoxib in rat plasma
- Development of a point-of-care testing sensor using polypyrrole/TiO2 molecular imprinting technology for cinchocaine determination
- Green and sustainable RP-UPLC and UV strategies for determination of metformin and dapagliflozin: Evaluation of environmental impact and whiteness
- Review Articles
- Determination of montelukast and non-sedating antihistamine combination in pharmaceutical dosage forms: A review
- Extraction approaches for the isolation of some POPs from lipid-based environmental and food matrices: A review
- A review of semiconductor photocatalyst characterization techniques
- Analytical determination techniques for lithium – A review
- Fourier transform infrared spectroscopy study of polymer/filler/ionic liquid composites