Analytical determination techniques for lithium – A review
-
Asif Hanif Chaudhry
 ,
Syed Asim Abbas Zaidi
,
Syed Asim Abbas Zaidi

Abstract
In human history, metals have had a significant yet ironic function. Their growing industrial usage has made a significant contribution to technological advancement; on the other hand, their requirement for humans, particularly in situations where certain metal ions are lacking, has just now come to light. In this review, we have examined various analytical methods employed in the detection of lithium, spanning from conventional approaches to contemporary technologies. Traditional methods encompass gravimetric analysis, titrimetry, flame testing, chromatography, and colorimetry. On the other hand, modern techniques involve the utilization of sophisticated instruments such as X-ray diffraction, X-ray fluorescence, atomic absorption spectroscopy, inductively coupled plasma optical emission spectroscopy, inductively coupled plasma mass spectrometry, thermal ionization mass spectrometry, laser-induced breakdown spectroscopy, ultraviolet/visible spectroscopy, X-ray photoelectron spectroscopy, and sensor technology.
Graphical abstract
1 Introduction
In human history, metals have had a significant yet ironic function. Their growing industrial usage has made a significant contribution to technological advancement; on the other hand, their requirement for humans, particularly in situations where certain metal ions are lacking, has just now come to light. They can be found in all soils, rivers, and seas since they are a natural component of the Earth’s crust. A natural trace element, lithium (Li) may be found in water and in a variety of fruits, vegetables, and other plants. Due to its vast range of impacts on animal and human systems, it is very important in biology and medicine. It is also significant from a technological and financial standpoint in a variety of human activities, including metallurgy, glass, energy, medicine, lubricants, nuclear, and polymers [1]. Li is an element with atomic number three and second in the alkali metal group. Its melting and boiling points are 180.5°C and 1,342°C, respectively. Its atomic mass is 6.94 g·mol−1 and its atomic radius is 1.33 Å. As Li metal reacts, it floats in water due to its low density of 0.534 g·cm−3 [2]. Today, batteries are made using about half of the Li generated. As a result, the supply of metal has been unable to keep up with the growing demand. On the other hand, Li is also used in the air treatment, lubricants, plastics, and ceramics industries [3].
1.1 Sources of Li
The major sources of Li are brine lakes (also known as Salars) and pegmatites. The Salars with the highest concentration are the Salars of Chile, Bolivia, and Argentina. Salars with lower concentrations include the Salars of US and the Tibetan Plateau. Gruber et al. [4] noted that the majority (83%) of the world’s Li resources are located in six salt deposits, pegmatite deposits, and sedimentary deposits. Research also shows that global Li reserves and resources are unevenly distributed, with about three-quarters typically found in the ten largest deposits. According to the United State Geological Survey (USGS), 85% of the global reserves are located in Chile, China, and Australia (Figure 1), and contribute about 70% of the global production, which reached 28,100 tonnes in 2011 [5]. Pegmatites are rocks formed by the solidification of magma underground. Li is currently being extracted from pegmatites in Australia. In addition, Li can be naturally extracted from clay and seawater, i.e., limestone gypsum roasting, selective chlorination, and leaching process. About 20% of Li can be separated from seawater using techniques such as ion exchange resins, solvent extraction, co-precipitation, membrane processes, and absorption [6].
![Figure 1
Li reserves by country. Data source: USGS [5].](/document/doi/10.1515/revac-2023-0082/asset/graphic/j_revac-2023-0082_fig_001.jpg)
Li reserves by country. Data source: USGS [5].
Granitic pegmatites represent an important source of trace minerals such as Li, tin, tantalum, niobium, beryllium, cesium, rubidium, scandium, thorium, uranium, and rare earths [7,8]. The distribution of pegmatites in the world is shown in Figure 2. Despite their wide distribution and relative abundance, rare mineral pegmatites make up only 0.1% of the total and Li-rich pegmatites represent a smaller portion [10].
![Figure 2
Location of major Li pegmatite (square) and brine (cross) deposits [9].](/document/doi/10.1515/revac-2023-0082/asset/graphic/j_revac-2023-0082_fig_002.jpg)
Location of major Li pegmatite (square) and brine (cross) deposits [9].
Waste that contains Li may be recycled, which is one way to make effective use of Li resources (Table 1).
Material and energy inputs for the production of 1 ton of Li carbonate from spodumene [11]
| Materials | Amount | Units |
|---|---|---|
| Spodumene (Li2·Al2O3·4SiO2) | 1.34 | Ton |
| Sulfuric acid (H2SO4) | 0.48 | Ton |
| Soda ash (Na2CO3) | 0.52 | Ton |
| Water (H2O) | 24.00 | Ton |
| Utilities | ||
| Natural gas | 1.66 | GJ |
| Electricity* | 1.01 | GJ |
*Electricity is given based on the mix in the European Union.
In the past, Li recovery from secondary resources was uncommon, but because of the rising need for Li owing to Li batteries, it is becoming more common. There are various companies which recycle Li from laser-induced breakdown spectroscopy (LIBS). The list of Li recycling companies is shown in Table 2. The use of secondary resources or their reprocessing will therefore become more crucial over time. In the current period, it is necessary to support this tendency. We may look to Rockwood Li Inc. in the US as an example of one such development [12].
Li batteries recycling companies [6]
| Company | Type of batteries | Recycling process | End product |
|---|---|---|---|
| Toxco inc. (Trail, British Columbia, Canada) | Primary | Cryogenic | Lithium carbonate (Li2CO3), cobalt, and aluminum |
| Secondary | Cryogenic | ||
| Batree (Wimmis, Switzerland) | Primary | Pyrometallurgical | Ferro-manganese (iron, manganese), zinc, and mercury |
| Secondary | Pyrometallurgical | ||
| Hydrometallurgical | |||
| Recupyl SAS (Singapore; Domene, France; Spain; and United Kingdom) | Primary | Hydrometallurgical | Metal oxides and lithium salt |
| Secondary | Hydrometallurgical | ||
| Umicore (Brussels, Belgium) | Secondary | Pyrometallurgical | Cobalt and nickel oxides |
| SNAM (Saint Quentin Fallavier, France) | Secondary | Pyrometallurgical | Cobalt and nickel oxides |
1.2 Applications of Li
Li may be used for a variety of purposes; its most valued application is in energy-density rechargeable Li-ion batteries (LIBs). The content of Li in primary and secondary batteries is reported in Table 3. Li may become increasingly more crucial in huge batteries to power all-electric and hybrid cars because of fears about the carbon dioxide footprint and the growing cost (limited availability) of hydrocarbon fuels [14]. Li is mostly used in synthetic rubber, Li2CO3 for ceramic, aluminum cell bath additives and glass applications, LiBr for absorption-type air conditioners, and similarly in preparing grease and medicines (Figure 3).
Li content in primary and secondary batteries [13]
| Chemistry | Types | Li content per cell (g) |
|---|---|---|
| Primary batteries | ||
| Lithium manganese dioxide (Li-MnO2) | Button/Coin | 0.05–0.10 |
| Cylindrical | 0.60–4.00 | |
| Lithium iron disulfide (Li-FeS2) | Cylindrical | 1.35 |
| Lithium thionyl chloride (Li-SOCl2) | Cylindrical | 0.60–2.5 |
| Lithium sulfur dioxide (Li-SO2) | Cylindrical | 2.10 |
| Secondary batteries | ||
| Lithium cobalt dioxide ion (Li-CoO2) | Cylindrical | 0.35–0.65 |
| Prismatic | 2.46 | |
| Lithium-ion industrial battery pack (Li ion) | Prismatic | 16.00–26.00 |
| Lithium cobalt dioxide polymer (Li-poly) | Prismatic | 0.30–3.10 |
![Figure 3
Use of Li (%) in each Li using industries: (a) In 2005. (b) Li uses in 2010, (c) Li use in 2015, and (d) Li projected use in 2020. Sources: [14–20].](/document/doi/10.1515/revac-2023-0082/asset/graphic/j_revac-2023-0082_fig_003.jpg)
Li metal is an intermediary in an intermediate industry for butyllithium. Several more low-volume Li compounds find application in specialized fields [21]. Li salts are effectively used in clinical disorders [22]. Li containing greases are effectively used in vehicle lubrication [23].
2 Extraction of Li metal
2.1 Li extraction from clay-type Li deposits
The current methods for Li production from solid Li deposits primarily include the processes of acid (Figure 4), alkaline, salt roasting, and high-temperature chlorination [9,16,19,24]. Despite a high recovery rate, the acid process suffers many disadvantages, such as complicated technological processes, high costs, high content of impurities, difficulty in removing impurities, easy entrainment of Li by mixed salts, and the emission of waste gas and numerous waste residues that cause environmental pollution [25,26]. In contrast, the alkaline process is environment-friendly and features high selectivity and simple technological processes. However, this process has the disadvantages of a low recovery rate and high cost [27].
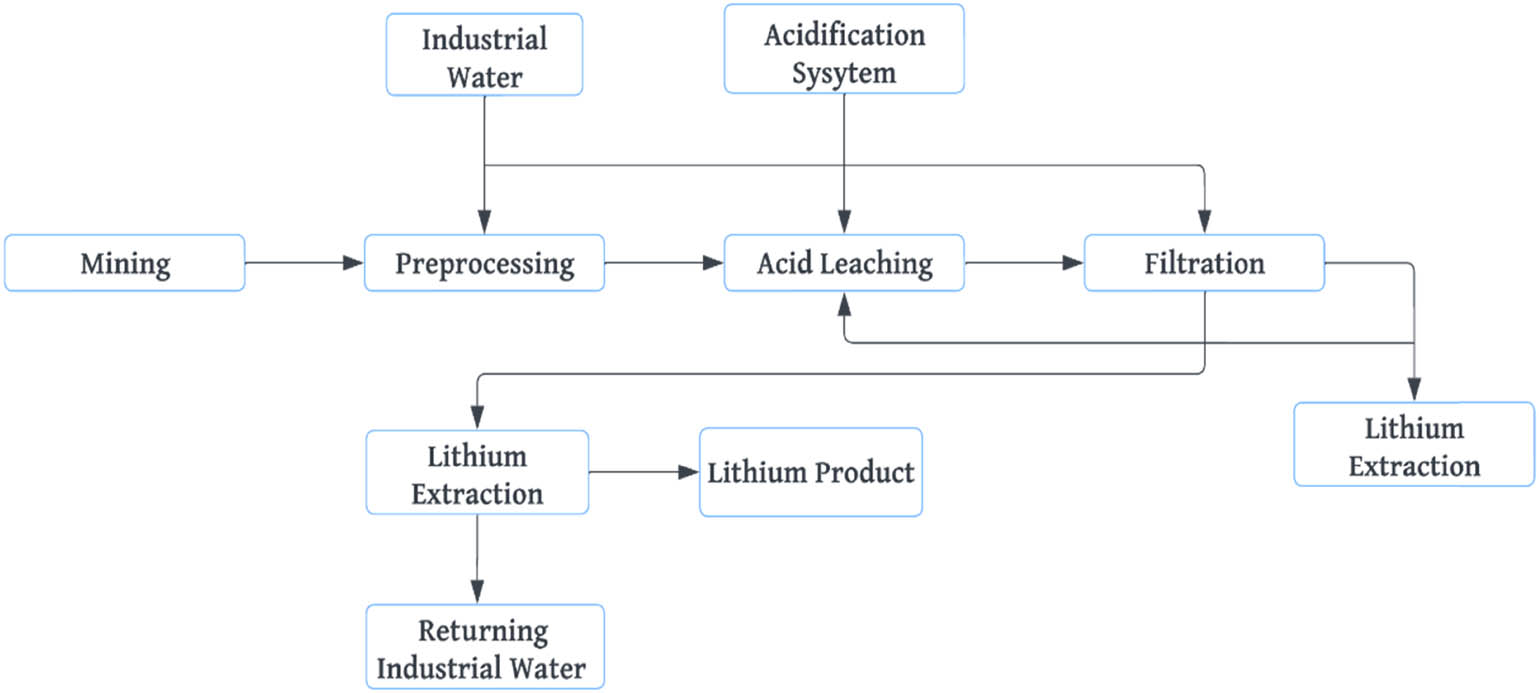
Flowchart showing Li extraction using the acid process.
The high-temperature chlorination process with Cl2 as the chlorinating agent exhibits a high recovery rate and fewer wastes in extracting alkaline metals (e.g., Li) from ores. However, this process requires high anti-corrosion performance of the whole set of process equipment and complicated technological processes [28,29]. To reduce the use of acids and alkalis, the costs and equipment maintenance workload, some researchers have proposed salt roasting processes, which can be predominantly divided into roasting with sulfate and chloride salts. The principle of sulfate roasting process is shown in Eq. 1. In this process, sulfate salts are first converted into soluble Li salts through high-temperature crystal transformation. Then, the soluble Li salts are precipitated and separated to yield Li products. However, since potassium salts are also strategic resources, the further recovery of Li from potassium salts yielded from the process will further increase the costs. Therefore, it is necessary to further improve the process [30]. The roasting with chloride salts serves as a research hotspot currently, with the fundamental principle shown in Eq. 2. This process enjoys a conversion rate of high Li salts. However, the waste residue treatment in this process is challenging [31].
The occurrence state of Li in clay-type Li deposits determines the selection of metallurgical techniques. The leaching process is mostly employed to extract Li from adsorbent clay minerals, while the combination of the roasting and acid processes is primarily used to extract Li from lattice displacement Li containing minerals [32]. The selection of metallurgical techniques is detailed in Figure 5.

Processes for extracting Li from clay-type Li deposits.
3 Techniques for Li determination
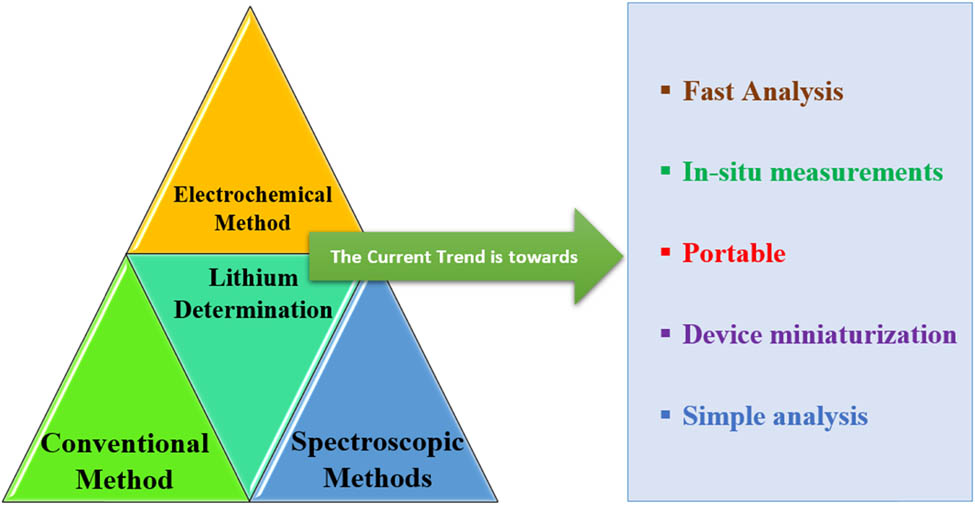
In this review, we have cited various analytical methods employed in the detection of Li, spanning from conventional approaches to contemporary technologies. Traditional methods encompass gravimetric analysis, titrimetry, flame testing, and colorimetry. On the other hand, modern techniques involve the utilization of sophisticated instruments such as X-ray diffraction (XRD), X-ray fluorescence (XRF), atomic absorption spectroscopy (AAS), inductively coupled plasma optical emission spectroscopy (ICP-OES), inductively coupled plasma mass spectrometry (ICP-MS), ultraviolet–visible (UV–Vis) spectroscopy, X-ray photoelectron spectroscopy (XPS), LIBS, and sensor technology.
To ensure originality, it is crucial to recognize the significance of these diverse methodologies, each offering unique advantages in terms of precision, sensitivity, and efficiency. Exploring these avenues not only broadens our understanding of Li detection but also opens new possibilities for advancements in diverse fields.
3.1 Classical methods
The classical method in chemical analysis has distinct characteristics. First, it relies on simple, non-electric equipment, devoid of complex machinery. Second, the scientific principles guiding the analysis are rooted in stoichiometric chemical calculations. This means that the instruments used are basic and manual and the analytical process involves calculations based on the proportions of reacting substances in chemical reactions.
3.1.1 Gravimetry
Jeffery et al. (1989) have measured Li using the cold precipitation method, they mix the sample with extra sodium aluminate in a basic environment (pH 12.6–13.0), forming 2Li2O·5Al2O3. While this method is precise in giving accurate data, it takes a long time, making it less popular. Even though the cold precipitation method is good at calculating the atomic mass of different elements and is not affected by solvent temperature, its downside is that it takes a while to get exact results. However, it has advantages like determining elements without complex calculations such as calibration curves and having low instrumental error. Errors can be easily spotted by checking the filtrate for complete precipitation and examining the precipitate for impurities. Despite these benefits, these methods are time consuming because of which many researchers chose other methods for Li determination [33].
Using a reagent of pH 9.5 that is made by combining orthophosphoric acid with beta diethyl aminoethyl alcohol, Vishveshwaraiah and Patel (1959) devised a technique for the gravimetric measurement of Li as trilithium phosphate by precipitating it from a homogenous solution of 60% ethanol. This technique allows for the estimation of Li in solutions comprising 5 to more than 100 mg, even when Na and/or K are present to a degree equivalent to five times the weight of Li. Anions such as phosphate, nitrate, sulfate, and chloride do not interfere with the method’s satisfactory operation [34].
The Li potassium ferricyanide hexamethylenetetramine complex is precipitated from an acetone–water solution by Forster (1954), who developed a technique for quantitatively extracting microgram amounts of Li from an excess of sodium and potassium ions. The yellow complex can be filtered out and weighed, or it can be redissolved in water and the Li content measured using an absorptiometric method [35].
Karaseva et al. (2022) used automated vacuum gravimetry to examine the impact of temperature (40°C, 50°C, 60°C, and 70°C) on the composition of solvate complexes of Li perchlorate with sulfolane during isothermal solvent evaporation. The temperature at which the Li perchlorate solvate complexes with sulfolane form determines their composition. The solvate complex’s sulfolane molecular count decreases with increasing temperature. At 40°C, Li perchlorate and sulfolane produce a tetrasolvate; at 50°C, 60°C, and 70°C, disolvates develop. Additionally, thermogravimetry is used to verify the composition of Li perchlorate solvate complexes with sulfolane. It is assumed that the differences between the compositions of the solvate complexes in the Li perchlorate–sulfolane system at different temperatures are due to differences in their structure [36].
Prior attempts at isolating and quantifying Li as phosphate have not been effective, according to Caley and Simmons (1953). Choline phosphate is used as a reagent in a process that precipitates Li as phosphate in 50% 2-propanol. Even when K, Na, or both ions are present in significantly different ratios, Li may be properly identified using this approach [37].
3.1.2 Titrimetric method
Loghavi et al. (2023) introduced the volumetric titration method as an economical, straightforward alternative for identifying components in LIBs. Given the growing demand for these batteries, enhancing their performance is crucial to prevent deterioration. To achieve this, optimizing cathode material selection and composition, managing Li residue on the cathode surface, controlling separator ion exchange capacity, regulating ion concentration during material formation, and monitoring functional groups and metal ions in carbon material are essential. Considering average valence is equally important. Analytical methods, such as ICP, XPS or chromatography, commonly used for substance analysis, particularly Li, are often expensive. The study determined that acid or base, complexometric and redox titrations can be cost-effective for material identification and quantification. However, it is crucial to note that not all LIBs’ components can be analyzed using this method [38].
3.1.3 Colorimetric
Komatsu et al. (2020) devised a pretreatment-free method for determining Li in whole blood, eliminating the need for additional steps. Medications containing Li play a crucial role in managing bipolar disorder. However, due to Li’s toxicity, regular monitoring of blood Li concentrations is necessary. The method involves two interconnected paper-based components; one for blood cell separation and another for colorimetric detection. When whole blood is applied to the separation unit, the plasma automatically moves to the detection unit, generating a diagnostic color. This innovative technique ensures excellent recovery and reproducibility, serving as a practical alternative for periodic monitoring of Li concentrations during bipolar disorder treatment [39].
Maire et al. (2008) suggested that when Li ions are electrochemically inserted into graphites and other intercalation materials used in LIBs, the materials undergo color changes. The present work proposed in situ colorimetry as a simple technological technique to quantify the local state of charge of electrodes used in LIBs. A glass-windowed laboratory chamber was constructed for the purpose of characterizing intercalation materials in situ. Li distribution in battery electrodes was mapped using calibration curves of red, green, and blue color values vs state of charge. It was discovered that the distribution of Li in the anodes of old LIBs was remarkably uneven [40].
According to Maire et al. (2010), a novel technique was created to determine the apparent diffusion coefficients of Li ions in graphite electrodes. With excellent spatial and temporal precision, the distribution of Li ions in model battery electrodes was measured using in situ colorimetry, a method that links an electrode’s color to its state of charge. Data on diffusion kinetics are derived from the rate at which a purposefully created heterogeneous Li distribution equilibrates. For the diffusion of Li in a porous graphite electrode, an apparent activation energy of about 17 kJ·mol−1 was found [41].
In place of the traditional optical approach known as “Spectrophotometry,” Hirayama et al. (2000) introduced a new optical analytical method called “Digital Color Analysis (DCA)” that is based on a digital color analyzer. A portable device that measures “colors,” the digital color analyzer converts color data into numerical values, color library data, and other formats that may be used as analytical data. By considering colors as digital information, DCA provides us with an analytical technique that is more insightful than spectrophotometry. With the use of a computer, DCA may also simulate the ideal color variations for visual sensor tuning. Colorimetric analysis, which was previously limited to semiquantitative analysis, may function as a precise determination technique by employing colors as digital information. To determine Li+ in saliva, researchers created a paper optode and a plasticized PVC film optode based on DCA. The optode membrane provides colorless gray in the Li+ therapeutic range (10–3 M) in saliva after optimizing color variation and detection range for the Li+ readings. As such, these optodes make it simple to assess whether or not the ideal therapeutic Li+ concentration is maintained. In particular, the sensor paper optode is readily handled and may be used at home in a short amount of time (around 80 s) for measurements. The digital color analyzer with QxQy coordinates may be used to create a linear relation calibration curve that spans the range of 10–5 to 10–1 M Li+, with a concentration difference of approximately 0.1 mM Li+ that the analyzer can detect. In the near future, a straightforward and precise analysis will be required for a health check-up at home that will not need a trip to the hospital. For this analytical goal, the optode based on DCA offers a lot of potential [42].
According to Quartarolli et al. (2021), AAS and XRF techniques are often used for the analytical measurement of Li ions. Additionally, chemical analysis using polyfluoroporphyrin chromogenic techniques is used, particularly for biological materials. All of the current techniques, however, are costly and unsuitable for field testing or everyday work. This alternative approach is based on the creation of a LiKFe(IO6) compound, which is then transformed into a tris(1,10-phenanthroline) iron(ii) complex and observed using colorimetric (which uses a smartphone app) or spectrophotometric techniques. Both of these techniques outperformed the XRF approach under comparable circumstances. It also describes a one-pot analysis of Li ions utilizing an Eppendorf microtube that has already been modified for reaction, filtration, and detection. This method is simple and very convenient for didactic and field assays [43].
3.1.4 Flame photometry
Levy and Katz (1970) proposed a comparison of the accuracy, sensitivity, and effects of different protein and cation concentrations for determining Li using flame photometry and AAS. Under the conditions they utilized, flame fluorometry is more sensitive, slightly less exact, but easier to use. The results produced were quite similar to those obtained by AAS. Although not substantial for therapeutic applications, changing the amounts of protein, Na, and K has minor but noticeable impacts. Unlike AAS, which suggests protein standards, no protein impact was observed with flam photometry. When sera from 65 patients undergoing Li treatment were examined using both tools, no discernible differences were discovered [44].
Brumbaugh and Fanus (1954) proposed that the search for a faster approach began with the slow, expensive conventional gravimetric methods for Li tests in minerals. Li in spodumene may now be accurately determined with the Beckman model-DU spectrophotometer and the Perkin-Elmer flame photometer attached to its flame. Minimal concentrations of Fe, Ca, and Mg do not cause problems. One can accept up to 6% Na2O and 12% K2O in the ore sample. Al and solution acidity-related interferences are offset by suitable additions to standard solutions. It was shown how to burn sample solutions in a way that removes mistakes brought on by unforeseen changes in instrument response. Li assays in petalite, lepidolite, and Li aluminum silicates can also be conducted using the same methodology [45].
Fishman (1962) introduced the flame photometric technique, which provides a sensitive, quick, and accurate way to measure Li in natural water. It uses an oxygen-acetylene atomizer burner with photomultiplier attachment. Direct intensity measurements are used to determine Li concentrations that are unknown, at a wavelength of 670.8 m/x. The method’s sensitivity, using commercially available equipment, is 0.02 mg·L−1 for Li concentrations less than 1.0 and 0.1 mg·L−1 for ranges between 1.0 and 5.0 mg·L−1. When present at the usual amounts found in natural water, other ions do not impede the determination process. After the sample has been appropriately diluted, the Li content of highly mineralized water that has more than 5.0 mg·L−1 of Li may be ascertained [46].
According to Kassner et al. (1960), the development of a reasonably quick and accurate technique to identify Li in rocks containing Li ranging from 0.10 to over 8% lithium has become necessary due to growing production of the metal. A method is presented for breaking down the sample using a solution of hydrofluoric, perchloric, and nitric acids. It is not required to remove interfering ions – primarily ferric, chromic, and aluminum – before analysis. By adding a citric acid-ammonium citrate buffer to the solution, which brings the pH between 1 and 4, the effects of these ions on the intensity of the Li spectrum are essentially neutralized. Under these circumstances, the sole element that frequently occurs in pegmatitic materials and causes an error is beryllium. One analyst can start 12 samples and complete the analysis of another set of 12 samples in each 8 h working day. Precision and accuracy are very good [47].
3.1.5 Chromatography
To determine total alkalinity (TA) and monovalent cations simultaneously, Hu et al. (2001) devised an ion chromatographic (IC) approach based on the use of titrant (strong acid) as the stationary phase. Li dodecylsulfate was first loaded onto a reversed-phase material to provide the titrant employed in this investigation. The column was then conditioned with a slightly acidified aqueous LiCl solution (a combination of 50.0 mM LiCl and 0.1 mM H2SO4). A molar ratio of [Li+]/[H+] = 250 ∼ 1 was applied to the eluent, which resulted in a negligible reaction between the basic species (Bn−) and H+ on the stationary phase when a small amount of a basic sample was injected onto a column prepared in this manner. Following the acid–base reaction, H+ from the eluent was used to replenish the stationary phase H+ that was used. The induced peak originating from the basic species was discovered by employing conductivity to monitor the eluent’s conductance. The OH−,
Li has been selectively recovered from seawater by Nishihama et al. (2011) via two sequential ion exchange procedures. Approximately 33% of the Li was recovered during the first concentration phase of Li from seawater employing a granulated λ-MnO2 adsorbent and benchmark-scale chromatographic operation. A unique separation technology that was created by combining ion exchange techniques with solvent impregnated resin and cation exchange resin was then used to purify Li from concentrated liquid from the benchmark facility. Li is purified by using a strongly acidic cation exchange resin to remove divalent metal ions from the liquor, a β-diketone/TOPO impregnated resin to remove Na+ and K+, and a (NH4)2CO3 saturated solution to recover Li+ as precipitates of Li2CO3. With the current recovery procedure, 56% of the recovered Li2CO3 had purity levels over 99.9% [49].
Li recovery from salt-lake brine from Qinghai province, China, with a high Mn/Li concentration ratio, has been studied by Xiang et al. (2016). FeCl3 was used as a co-extractant and tributyl phosphate in methyl isobutyl ketone as the extractant for Li+ extraction. A suggested extraction method relies on the cation exchange of Li+ and Mg2+ with H+ and Na+. In salt-lake brine, boron is present as
3.2 Modern methods
The modern method of chemical analysis stands out due to two key characteristics; first, it involves the use of sophisticated instruments, typically powered by electricity. These instruments are more complex than traditional, non-electric counterparts. Second, the scientific principles employed in the analysis process are frequently linked to fields such as atomic physics, resistivity, conductivity, and wave phenomena. In essence, this approach leverages advanced technologies and principles from various branches of science to enhance the precision and capabilities of chemical analysis.
3.2.1 Spectrofluorimetry
Afrin et al. (2019) proposed a rapid and highly sensitive spectrofluorimetric method for detecting trace levels of Li using 5,7-dibromo-8-hydroxyquinoline (DBHQ). The reaction takes place in a slightly acidic aqueous solution (0.0003–0.0015 M H2SO4) with Li in 30% ethanolic media, resulting in a stable and intensely fluorescent chelate. The fluorescence remains stable for 1 min to 24 h, with emission peaks at 278 and 342 nm. The method has a linear calibration range of 0.001–400 μg·L−1 of Li (R 2 = 0.99987), a low detection limit of 0.1 ng·L−1, and a quantification limit of 1 ng·L−1, with a %RSD of 0–3%. The chelate’s stoichiometric composition is 1:1 (Li:DBHQ) and interference from over 60 cations, anions, and complexing agents is negligible. The method was successfully applied to various samples, including certified reference materials (CRM), commercial pharmaceutical formulations, biological fluids, soil and food samples. Results aligned well with ICP-OES, demonstrating high precision and accuracy and the method’s reliability was confirmed through alignment with the U.S. Pharmacopoeia Official method for pharmaceutical samples [1].
Jaafari et al. (2004) highlighted the synthesis and characterization of novel ligands, specifically, derivatives of 2-(2′-oligothiophene)-8-hydroxyquinoline. The research investigates the synthesis process and thermal, optical, and electrochemical properties of complexes formed with Li, aluminum, and zinc by ICP-OES. The absorption and fluorescence emission spectra, as well as the fluorescence yields of these complexes, are primarily influenced by the inherent characteristics of the ligands. This distinctive feature positions them as promising materials for use in organic light-emitting devices [51].
3.2.2 ICP-MS
Lin and his coworkers (2016) introduced an innovative approach for precise determination of Li isotopic ratios using multi-collector inductively coupled plasma mass spectrometry (MC-ICP-MS), addressing challenges related to high background and pronounced memory effect of Li. A novel method efficiently reduced Li background by 15–70 times using a 5% NaCl rinse solution. The study resolved previously reported “mismatching effects” attributed to variations in acid and Li concentrations by effectively reducing the Li background. This indicates that both matrix affects originate from high Li instrumental background and memory effect. With the background reduction technique, a method for accurate Li isotopic ratio determination was established without strict matrix-matching requirements. Validation using eight reference materials yielded satisfactory results, even when Li concentrations in samples differed from standards. The external precision of the method is better than ±0.25‰ (2 SD) for Li, making it suitable for identifying subtle Li isotope fractionation in geological processes. Importantly, the proposed method eliminates the need for matching Li and acid concentrations between samples and standards, significantly reducing sample preparation time and increasing sample throughput [52].
Nishio and Nakai (2002) utilized second-generation MC-ICP-MS for precise Li isotopic measurements, achieving high precision (±0.82‰, 2σ) with a minimal Li amount (approximately 45 ng). They developed a single-step column separation protocol for rapid Li purification from rock solutions, demonstrating reduced blank levels (<10 pg) and efficient purification. Matrix effects and isotopic fractionation were thoroughly examined using an artificially mixed solution mimicking basalt composition, revealing negligible fractionation within the protocol. Li isotopic ratios for seawater and standard rocks (JA-1, JB-2, JB-3) align with previous data by Moriguti and Nakamura, who used a different method. The combination of this separation protocol with sensitive MC-ICP-MS allows efficient Li isotopic analyses on silicate rocks with low Li content, enhancing sample throughput and enabling broader geological sample analysis [53].
Voica and his coworkers (2021) suggested that an alkali metal called Li naturally occurs in diverse food sources, such as vegetables, grains, and drinking water. Recognized as an essential trace element with a recommended daily intake of 1 mg, Li is utilized in therapeutic doses for treating depressive intervals. Although natural Li intake from food and water is generally lower than therapeutic levels, routine consumption may still yield anti-suicidal effects. The study examined 200+ Romanian market food samples, including 130 basic items (oils, meat, milk, cheese) and 70 vegetables. ICP-MS determined Li concentrations, with vegetables showing the highest content, followed by milk, cheese, meat, and oils. ANOVA was used to distinguish between dairy and vegetable products, aiding in identifying effective markers. The results enhance understanding of Li’s natural presence in foods and its potential impact on human health. Regular food consumption may naturally raise Li levels without causing adverse effects, offering valuable insights into Li’s role in daily nutrition [54].
Choi et al. (2010) reported that Li isotope analysis via MC-ICP-MS is a potent tracer method widely employed in various fields. However, it introduces a natural Li isotope background influenced by the instrument matrix. Their study reveals that MC-ICP-MS conditions exhibit a low baseline background and high sensitivity at Ar plasma conditions. They utilized experimental conditions superior to general plasma settings and those in previous studies for accurate Li isotope ratio measurement. Samples underwent acid leaching and were processed with a modified cation exchange resin (Bio-Rad AG 50 W-X8 200–400 mesh) suitable for seawater samples. Isotope variations were corrected using the bracket method, incorporating the sample’s Li isotope ratio and mean ratios of the L-SVEC standard (NIST L-SVEC Li2CO3) measured before and after the sample run. Isotope variation was presented as the deviation (per mil) from the recommended value [55].
Moriguti and his colleagues (2004) investigated a precise and straightforward method for determining Li concentrations in small silicate samples, which were developed using isotope dilution-inductively coupled plasma-mass spectrometry (ID-ICP-MS). Samples, along with a Li spike, underwent digestion with HF-HClO4, drying, dilution with HNO3, and measurement by ICP-MS. No matrix effects were observed for 7Li/6Li in rock solutions with a dilution factor of 97 at an ICP power of 1.7 kW. This method enables the determination of 0.5 μg g−1 Li in a 1 mg silicate sample with a blank correction of <1%. Li contents in various silicate reference materials and chondrites were determined, with a typical RSD of <1.7%. Comparison with isotope dilution-thermal ionization mass spectrometry (ID-TIMS) showed relative differences typically <2%, confirming the high accuracy of the ID-ICP-MS method developed in this study [56].
Millot et al. (2004) presented a novel method for Li isotope measurement using multi-collector ICP-MS (Neptune), enabling rapid and highly precise determination of Li isotope ratios at low Li levels (15–20 ng). The Li reference sample solution IRMM-016 demonstrated external reproducibility of 0.24% (2s, n = 52) over a 10-month period. Chemical separation of Li from matrix was conducted on the seawater sample IRMM BCR-403, yielding a mean δ7Li value of +31.0 ± 0.1% (2s/√n, n = 31). This value aligns well with previously published results for other seawater samples. Considering the ready availability of BCR-403 seawater, they suggest its use as a reference sample for Li isotope measurements [57].
Misra and Froelich (2009) have introduced an enhanced Li isotope ratio (7Li/6Li) determination method with minimal Li consumption (<0.2 ng/quintuplicate analyses), high column yields (>99.98%), precise isotope ratios (<±0.8‰, 2σ), and low blanks (1.0 ± 0.5 pg). The method involves a refined single-step IC process utilizing a small volume resin (2 mL/3.4 meq AG 50W-X8) and low elution volume (6 mL, 0.5 N HCl), yielding low procedural blanks (<500 fg·mL−1). Tailored for natural carbonates (foraminifera) with 1–2 parts per million (ppm) Li, this separation technique can be scaled for other samples (e.g., seawater, pore-waters, mineral grains). Isotope ratio measurements employ a single collector Quadrupole ICP-MS (Agilent 7500cs) using cool plasma (600 W), soft extraction, peak jumping, and pulse detection mode with sample-standard bracketing. Precisions are better than ±0.8‰ (2σ) for L-SVEC Li standards and better than ±1.5‰ (2σ) for natural samples. The method demonstrates high matrix tolerance for sodium (∼0.6 mol·mol−1, Li/Na) and calcium (<20 µmol·mol−1, Li/Ca) in Quadrupole ICP-MS. Seawater δ7Li value (30.75 ± 0.41‰, 2σ, n = 10) aligns with other reported values (∼31.0 ± 0.5‰). Specific and bulk sample δ7Li analyses of core-top foraminifera fractions yield values similar to modern seawater [58].
Raish and his coworkers (2016) assessed the antioxidant activity and analyzed the trace elements in Ood-saleeb, which is a recognized herbal medicine. Preliminary phytochemical screening revealed the presence of flavonoids and phenolics in the Ood-saleeb extract. The extract exhibited significant antioxidant activity in various assays compared to the standard antioxidant, with dose-dependent effects. Remarkable scavenging of reactive oxygen species was also observed. IC50 values for all factors were determined using ascorbic acid as a standard. Trace element analysis by ICP-MS identified concentrations of up to 18 elements in the Ood-saleeb extract. Silicon was detected at a high concentration (85.3 μg·g−1), while Li was present at a lower concentration (3 ng·g−1). The trace elements exhibited varying percentage levels indicating their potential role in disease treatment [59].
3.2.3 ICP-OES
Rudd et al. (2019) synthesized a luminescent metal–organic framework (LMOF), LMOF-321, by modifying an existing Zr-based structure. LMOF-321, a robust, dual-ligand Zr-MOFs, features a three-dimensional porous network built on Zr6-nodes, demonstrating chemical and thermal stability. It remains durable in various water samples (deionized, acidic/basic, seawater). LMOF-321’s porosity, luminescence, and specific functionality make it a fluorescent chemical sensor and adsorbent for aqueous analytes. Interactions with Li+ and other common water metals were examined, showing responsiveness to Li+ at a parts per billion level (3.3 ppb) and high selectivity over other light metals, with detection ratios of 6.2, 14.3, and 44.9 for Li+/Na+, Li+/Ca2+, and Li+/Mg2+, respectively. Performance was maintained in ion-doped deionized and seawater samples, indicating potential for field applications. LMOF-321’s Li+ KSV value (6,549 M–1) sets a standard for LMOF sensors. ICP-OES confirms selective Li+ adsorption, consistent with fluorescence measurements. LMOF-321 exhibits a maximum uptake capacity of 12.18 mg·g−1, comparable to Li extraction materials, aligning well with the Langmuir adsorption model. XPS and Fourier transform infrared (FTIR) studies shed light on the Li+-LMOF-321 interaction, emphasizing the bis(sulfonyl)imide functionality in the pillaring co-ligand. This dual functionality positions LMOF-321 as an efficient tool for Li harvesting procedures [60].
Kröger et al. (2021) studied the chemical and structural features of LIB electrodes and their materials were thoroughly examined using a novel technique, single-particle ICP-OES. This innovative method allowed for the investigation of chemo-mechanical interactions at the particle level, particularly in Li transition-metal oxide cathode materials like Li(Ni1/3Co1/3Mn1/3)O2. To address polydisperse particle size distribution, a custom gravitational-counter-flow classifier limited particle sizes to 10 μm, ensuring complete vaporization and excitation. Size-separated particles were monitored online using flow cell particle analysis and an argon flow transported particles directly to the plasma, preventing Li+–H+ exchange reactions in aqueous media. By optimizing gas flow and plasma parameters, a particle size detection limit of ∼0.5 μm was achieved, with detection limits of ∼30 and ∼180 fg for Li and Mn, respectively. This study also introduced a matrix-matched external calibration approach utilizing electrochemically delithiated Li transition-metal oxides [61].
Koo and his coworkers (2021) proposed that recycling LIBs is vital for resource conservation and waste reduction. A novel method involves using functionalized polymeric resins, such as Merrifield resin with oligoethylene glycol derivatives, to capture and chromatographically separate Li and cobalt ions from organic solutions. Testing demonstrated 30–45% Li-ion depletion after incubation in optimal conditions. The resin-packed column achieved baseline separation of Li (∼200 ppm) and cobalt (∼200 ppm) ions, indicating a potential simplified approach for LIB recycling compared to current solvent extraction methods. Li iodide was dissolved in acetonitrile (ACN) to a concentration of around 53 ppm Li⁺, confirmed by ICP-OES. Li iodide, chosen for its good solubility in organic solvents, was used in the experiment. To assess Li-ion depletion, each resin (12 mg) in Support Set 1 underwent incubation with 1 mL of 53 ppm Li⁺ in ACN on a rotating mixer for 16 h. The Li solution was then filtered, evaporated in vacuo, and redispersed in 2% nitric acid for ICP-OES analysis to measure the remaining Li-ion concentration. Unfunctionalized merrifield resin (MRF) served as a negative control experiment. All experiments were conducted three times and average values are reported. After incubation with the bulk solutions of Li cations at ∼50 ppm in ACN, the final Li⁺ concentration remained nearly the same as the starting solution, indicating negligible interaction between MRF and Li ions. Ethylene glycol-functionalized resin beads (MRF-2EG to MRF-9EG) removed 30–42% of Li ions during the experiment. More than 95% of the resin-bound Li was recovered after washing with 2% nitric acid [62].
Darezereshki et al. (2021) explored how technology could breathe new life into old LIBs. These used batteries held a treasure trove of nickel-cobalt ions, perfect for crafting tiny metal sulfide particles. Yet, the unwanted presence of ions like manganese and Li could complicate the creation of pure metal sulfide structures. Recognizing this challenge, study from the past introduced an innovative and cost-effective method. Think of it as a vintage recipe; starting with acidic leaching, followed by precipitation and a gentle thermal treatment (heating to around 250°C for 1 h). This unique process aimed to manufacture pure NiS nanopowders from LIBs and they enlisted potassium amyl xanthate as the key player in this historical recipe. To unveil the size and structure of the resulting nanoparticles, they relied on tools from the past, including XRD, scanning electron microscopy, transmission electron microscopy (TEM), photon correlation spectroscopy (PCS), and ICP-OES. Additionally, techniques like energy dispersive X-ray spectroscopy (EDS) and FTIR from the past helped them explore elemental distributions and functional groups. Their meticulous analysis of these distinctive, sphere-like NiS particles revealed a mean size of 61 ± 2 nm (TEM) and 64 nm (PCS), showcasing high purity as confirmed through XRD and EDS analyses. Excitingly, when they compared their XRD data from the past with standard patterns, it was an impeccable match – affirming the hexagonal structure of the NiS phase. In simple terms, this bygone approach stands as a nifty and effective method for transforming old LIBs into an exceedingly valuable product. As they conclude this historical journey, they recommend future studies to delve into the foundational aspects of these processes – akin to adding more chapters to the narrative of making technology more advanced and sustainable [63].
Vuollo and his coworkers (2009) introduced a way to measure boron and Li levels using two techniques, ICP-OES and ICP-MS, which are methods for analyzing elements. They used a material called doped BST (BaSrTiO3) as an example in their research. They looked at both pure and doped BST samples before and after a process called sintering. Before sintering, the ICP-OES analysis showed that the amounts of Ba, Sr, Ti, and Li in the samples matched the quantities they added and this was accurate. However, for boron, they found a bit less than what was added. After sintering in disk and powder forms, they checked how much Li and B were lost during the process. Both ICP-OES and ICP-MS methods gave similar results, showing good agreement between them. Interestingly, XRF could not detect the small amounts of B and Li. In simple terms, the study provides a new way to accurately measure elements, even small amounts of boron and Li, in materials like electroceramics after they have been processed. This is useful, especially when dealing with light elements at low levels added to the powders [64].
Bencs et al. (2012) studied the methods such as solid sampling graphite furnace atomic absorption spectrometry (GFAAS), solution-based (SB) GFAAS, flame atomic absorption spectrometry ICP-OES, and ICP-MS. They were developed or fine-tuned for the precise determination of trace elements, namely, Cr, Fe, and Mn, which act as dopants in Li niobate optical crystals. In the analysis using SS-GFAAS, calibration was achieved by employing the three-point-estimation standard addition method. On the other hand, SB methods were mainly calibrated against standards that matched the matrix or were acidic. To study potential interferences, both spectral and non-spectral, in SB-GFAAS, the samples were digested. For the SS-GFAAS method, less sensitive spectral lines of the analytes were used, along with a higher internal furnace gas (Ar) flow rate to reduce sensitivity for crystal samples with higher (doped) analyte content. To understand the chemical forms of the matrix formed at different stages of the graphite furnace heating cycle, whether from a solid sample or a solution after digestion, X-ray near-edge absorption structure (XANES) analysis was conducted. These findings indicated that the solid matrix vaporized or deposited in the graphite furnace is predominantly in metallic form, while the dry residue from the solution form tends to vaporize or deposit as the niobium oxide [65].
Grote-Koska and his coworkers (2018) suggested that testing the electrolyte levels in human body fluids is a common task in medical labs. Ensuring the accuracy of these tests in patient samples is crucial and using advanced reference methods is vital. This study explores a sophisticated system to measure K+, Li+, sodium (Na+), calcium (Ca2+), and magnesium (Mg2+) simultaneously in blood serum and plasma. For each ion, the study determined the measurement ranges: 0.75 mmol·L−1–75.0 mmol·L−1 for K+, 0.05 mmol·L−1–5.00 mmol·L−1 for Li+, 5 mmol·L−1–200 mmol·L−1 for Na+, 0.4 mmol·L−1–8.0 mmol·L−1 for Ca2+, and 0.1 mmol·L−1–4.0 mmol·L−1 for Mg2+. The precision of the measurements was found to be good, with coefficients of variation (CVs) of ≤1.1% for within the same test and ≤1.8% for different tests for all ions. Accuracy was confirmed by comparing results with certified Standard Reference Materials, showing small deviations. Comparisons with the German Metrology Institute revealed minor differences. No influences from other substances or leftover effects were observed. The uncertainties in the measurements were estimated to be ≥1.5% for each ion. Critically, this reference method is officially recognized by the German accreditation body, ensuring that it meets the high standards set by ISO 17025 and ISO 15195. This recognition includes certifying the tools, materials, and samples used in proficiency testing schemes. In simple terms, this study establishes a reliable way to measure electrolytes accurately in blood samples, meeting the strict standards of quality assurance [66].
Sharma et al. (2020) reported a technique called LIBS to quickly analyze major and trace elements in five medicinal plant samples. LIBS revealed the presence of elements like carbon, iron, magnesium, silicon, calcium, oxygen, hydrogen, nitrogen, and sodium. However, the concentration of these elements varied in each of the five plant samples. First, the plant parts, such as roots and leaves, were examined for their major and trace elements using LIBS. Then, the concentrations of these elements were calculated using a method called the intensity ratio, based on the LIBS data. The results were compared with measurements obtained from another technique called ICP-OES. To further understand the differences between the plant samples, a statistical method called partial least squares-discriminant analysis was applied to the LIBS spectra. This analysis created models that can be useful in predicting the nature and composition of unknown plant samples in the future. This study highlights that LIBS, especially when combined with statistical methods, is a valuable tool for studying the unique characteristics of different medicinal plant samples [67].
Salit et al. (2000) applied a more advanced method using ICP-OES to analyze the levels of Li and aluminum (Al) in LiAlO2 samples. This improved ICP-OES technique has an uncertainty level of about 0.2%, making it comparable to the best analytical methods available. The success of this method is attributed to several effective strategies, which are thoroughly explained in this study. In testing eight samples, the average measured mass fractions for Li and Al were determined to be 0.10151 ± 0.00016 (±0.16%) and 0.41068 ± 0.00056 (±0.14%), respectively. Additionally, the mean Li/Al amount-of-substance ratio was found to be 0.9793 ± 0.0017 (±0.17%). The main source of uncertainty in these measurements arises from sample handling and heterogeneity, which is approximately twice as significant as the instrumental uncertainties of ICP-OES. Specifically, the instrumental uncertainties for Al and Li were 0.04% and 0.07%, respectively. This upgraded ICP-OES method proves highly effective in accurately determining Li and Al levels in LiAlO2 samples, offering results comparable to the best available analytical techniques [68].
Kröger et al. (2022) took a close look at how the charge level within battery electrodes is distributed at a tiny scale. These electrodes contain layered transition metal oxides, specifically featuring Li(Ni0.5Mn0.3Co0.2)O2, also known as NMC532. To examine this distribution, a method called classification-single-particle inductively coupled plasma optical emission spectroscopy (CL-SP-ICP-OES) is used. This technique allowed them to quickly check the amount of Li in each particle of the cathode active material (CAM). By doing this, they can get a reliable understanding of how the charge is spread among different particles in the electrode. The results of the study show that as the battery loses Li (delithiation) at slow rates, there is a consistent unevenness in charge distribution at a small scale within the electrode. This is confirmed by another technique called time-of-flight secondary ion mass spectrometry (ToF-SIMS), which measures the masses of ions in the material over time. The study goes on to thoroughly discuss the local chemical and structural effects of NMC532 on the use of different active materials in the electrode. Additionally, the study finds that the uneven charge distribution in the electrode depends significantly on the current density, which is the amount of electric current per unit area. When investigating the connection between this uneven distribution and reduced capacity utilization, a simple measurement approach reveals that a significant part of the battery’s reduced performance comes from Li that remains inactive within the CAM. In summary, these results emphasize the importance of looking into this consistent uneven charge distribution as a potential reason for reduced performance in batteries that use layered Li transition metal oxides [69].
Dong et al. (2021) developed a precise, swift, affordable, and portable method for monitoring serum Li, which is crucial for individuals undergoing Li medication for mental health treatment. Traditional techniques are often large, expensive, and incapable of providing immediate on-site measurements. In this context, a compact, dependable, cost-effective, and portable optical emission method was developed for the rapid and sensitive determination of serum Li. This method combines miniaturized ultrasonic nebulization (MUN) with a low-power atmospheric-pressure air-sustained discharge (APAD) excitation source, requiring approximately 22 W. Notably, this approach eliminates the need for compressed gas or a pump, enabling serum Li detection within 40 s with minimal sample consumption (less than 20 μL of serum). Furthermore, MUN-APAD-OES does not require additional treatment for serum Li analysis, except for dilution with water. A key advantage of this method is its resilience to high concentrations of coexisting elements such as Na, K, Ca, and Mg, addressing a common matrix effect issue encountered in traditional ICP-OES. Various operational parameters influencing the performance of MUN-APAD-OES were assessed. Under optimized conditions, the detection limit for Li (at 670.8 nm) was determined to be 0.6 μg·L–1 (6 μg·L–1 in serum). The accuracy of this method was validated through the analysis of two CRM (Seronorm serum L−1 and L−2 RUO), six real human serum samples, and eight real animal serum samples. All results affirm that the cost-effective and low-power MUN-APAD-OES presents a promising and reliable method for on-site serum Li measurement, with potential extension to other elements [70].
3.2.4 Thermal ionization mass spectrometry (TIMS)
Moriguti and Nakamura (1998) proposed a new and efficient way to separate Li in both rocks, and liquid samples has been developed, along with a precise method for analyzing Li isotopes using TIMS. The process involves four distinct stages of ion-exchange chromatography, which is a method that separates different ions based on their charge. This separation is achieved using a special type of organic resin. To completely separate Li from sodium during the third stage of chromatography, a solution of ethanol and hydrochloric acid (HCl) is used. Importantly, the overall amount of chemicals used in the entire process has been reduced to 42 mL for rock samples and 33.3 mL for seawater. The results are impressive, with a recovery rate of 99.2–99.3% and a minimal background signal (procedural blank) of 11 pg. The analysis is performed using a technique called TIMS and Li3PO4 is used as the material that produces ions for the mass spectrometer. The precision and consistency of the measured 7Li/6Li ratios are quite good, with variations of ±0.04–0.07‰ (2σmean) and 0.37‰ (RSD) for rock samples and ±0.05–0.08‰ (2σmean) and 0.35‰ (RSD) for seawater. Furthermore, this method has the added advantage of allowing the collection of other elements like Rb, Sr, Sm, Nd, La, and Ce after Li separation in the first stage of chromatography. Specific procedures are then applied to separate these elements. This means that the technique is not only useful for Li analysis but also enables the analysis of multiple isotopes in samples that have low Li content or are available only in small quantities, such as meteorites and materials from the Earth’s mantle. This extends the application of the method to fields like Li isotope geochemistry and cosmochemistry [71].
Moriguti and Nakamura (1998) studied the Li isotopes in volcanic rocks from the Izu arc in Japan to learn more about what happens in subduction zones, where tectonic plates collide. The measurements of Li isotope ratios (δ7Li) and the ratio of Li to yttrium (Li/Y) in the volcanic rocks revealed clear changes across the arc. As they looked deeper into the Wadati–Benioff zone (around 150–210 km deep), they noticed a consistent decrease in δ7Li (from +7.6 to +1.1‰) and Li/Y ratios (from 0.36 to 0.25). This drop suggests that the amount of a subduction-related fluid entering the source region decreases as you go deeper. Analyzing the δ7Li–Y/Li systematics showed that the volcanic rocks were a mix of two distinct sources: a fluid from the subducting slab and the mantle wedge. The isotopic systematics of Li, boron (B), and lead (Pb) helped identify the contributions of altered oceanic crust (AOC), oceanic sediment, and the mantle wedge to the volcanic rocks. They found that AOC is the main subduction component, with a minimal contribution from oceanic sediment (AOC/oceanic sediment = 97/3). Considering the different properties of Li and B in minerals, it seems that Li is less likely to move from the subducting slab to the mantle wedge compared to B. This suggests that Li isotopes, which evolve near the Earth’s surface, can be more effectively carried into the deep mantle through subduction zones than boron isotopes. This makes Li isotopes a powerful tool for understanding how the Earth’s crust and mantle recycle materials [72].
You and Chan (1996) explored an enhanced method for analyzing Li isotopes, using Li3PO4 as the ion source, particularly for geological samples. The ratio of 7Li to 6Li is determined through a technique called double rhenium filament TIMS. This method minimizes isotopic fractionation, especially at high temperatures. What is special about this approach is that it produces a stable and strong Li+ ion beam, allowing them to measure very small amounts of Li, as little as nanograms. This innovation significantly reduces the required sample size, up to 1,000 times less than what is needed for the traditional Li2BO2+ method, all while maintaining a high level of precision, better than 1‰ (1σ). When they tested this method by analyzing the NBS L-SVEC Li2CO3 standard multiple times, they found a mean value of 12.1047 ± 0.0043 (n = 21), which is quite close to the reported absolute value of 12.02 ± 0.03. they also compared Li3PO4 technique with the established Li2BO2+ method using various geological samples and found excellent agreement between the two. For further validation, they conducted replicate analyses of seawater and a fresh submarine basalt. The precision of their results matched up well with previous measurements. Taking advantage of the high efficiency of the phosphate ion source, they went on to make groundbreaking measurements of Li concentration and isotopic composition in calcareous foraminiferal tests and other marine carbonates. Initial findings indicate significant Li exchange between carbonate sediments and their interstitial waters. This technique’s sensitivity opens up new possibilities and they are beginning to explore the potential links between Li paleoceanography and paleoclimate over the last 1,000 ky using planktonic foraminiferal tests. In essence, this highly sensitive method holds promise for examining low Li reservoirs, providing valuable insights into the fundamental aspects of Li geochemistry [73].
3.2.5 AAS
Manfro et al. (2020) have suggested that therapeutic drug monitoring (TDM) has become the standard practice for monitoring the therapeutic levels of the mood stabilizer Li. Dried Blood Spots (DBS) and Dried Plasma Spots (DPS) are emerging as promising sampling methods for TDM. They offer a straightforward and cost-effective approach, especially beneficial in Developing Countries, due to their simplicity and logistical advantages. These methods offer practical and cost-effective solutions, especially in settings with limited resources, such as developing countries. What makes DBS and DPS particularly interesting for Li+ TDM is their ability to estimate Li+ levels in erythrocytes. The goal of this study was to create and validate a method for measuring Li+ in DBS and DPS using GFAAS and to check its suitability for use in clinical settings. The process included extracting Li+ from an 8 mm DBS disc punch using 4.5% nitric acid and from a 6 mm DPS disc punch using a diluent solution (1% HNO3 + 0.1% Triton), followed by injection into GFAAS. The method was then applied to Li+ TDM in 43 patients with mood disorders. The results of the study showed that the assay had a linear response in the range of 0.10 to 3.0 mEq·L−1 (r > 0.99). It demonstrated precision with a coefficient of variation (CV) of 3.6–7.2% for DBS and 4.6–9.3% for DPS samples and accuracy with values of 97–109% and 98–106% for DBS and DPS samples, respectively. Importantly, Li+ remained stable in dried samples for up to 20 days at temperatures of up to 42°C. The accuracy and recovery of the DBS assay were not affected by blood hematocrit. Patients in the study exhibited Li+ serum concentrations ranging from 0.18 to 1.1 mEq·L−1 in DBS and 0.15 to 0.99 mEq·L−1 in DPS samples. DPS samples showed Li+ concentrations comparable to those in fresh serum samples. Additionally, DBS samples allowed for the estimation of the Li+ erythrocyte to plasma concentration ratio (LiR). The findings of this study support the practical use of DBS and DPS samples for Li+ TDM in clinical settings [74].
Magnin and his coworkers (1996) developed a method using GFAAS to accurately measure very small concentrations of naturally occurring Li in human plasma and urine. This method utilizes special graphite tubes coated with a heat-resistant material, along with a modification involving ammonium nitrate to minimize interference from the sample matrix. Although this treatment is effective in reducing interference, especially in urine samples, it does not completely eliminate it. Therefore, an additional step involving solid-phase extraction on specific cartridges is necessary to standardize the results, especially due to the variable nature of urine matrices. For establishing calibration curves, the method uses samples with a similar matrix through a technique called the addition-calibration method. The resulting calibration curves are linear up to a concentration of 0.72 μmol·L−1, with high correlation coefficients (r 2) ranging from 0.99 to 1.0. This method allows accurate measurements of trace amounts of Li in biological samples, reaching concentrations as low as 0.03 μmol·L−1, with low variability both within the same day and between different days (intra- and inter-day variability less than 10%). This method’s application extends to measuring trace Li levels in urine and plasma samples from healthy individuals. It enables the calculation of fractional excretion (FeLi), with a median range of 17.3%. FeLi reflects the kidney’s ability to reabsorb sodium and water at a specific part of the nephron. This highly sensitive method proves valuable for investigating and diagnosing various kidney conditions, aiding clinical research. Moreover, it can be applied to studies examining the trace Li levels in populations, especially in connection with mental health conditions [75].
3.2.6 XRF
Xu et al. (2023) introduced a new way to check the quality of thin Li metal anodes using a method called XRF. This method helps determine the thickness of the Li coating and calculate something called the Li mass absorption coefficient. The interesting part is that the values they calculated (263.9 and 259.7 cm²·g−1 at 930 eV) match up well with values already reported in the 2019 EMSLIBS conference (NIST 260.0 cm²·g−1 and CRXO 279.2 cm²·g−1). This suggests that this method has the potential to be a reliable quality inspection tool. Their proposed XRF method can also be useful for finding internal and surface defects in Li coatings and spotting any unwanted chemical impurities. What is cool about this method is that it is non-destructive and does not require physical contact. It can cover large areas, give information about the composition and can even be used in real-time during production. This study highlights that using the XRF analysis system could be a great way to check the quality of commercialized thin Li metal anodes and the production of the next generation of electric vehicle (EV) batteries on a large scale [76].
Ribeiro and his colleagues (2021) studied two analytical techniques, XRF and LIBS, to examine samples from hydrothermal veins in the Argemela Tin Mine in Central Portugal. The focus was on quartz, montebrasite, and turquoise. Montebrasite is considered a potential main ore mineral containing Li. When montebrasite undergoes alteration, Li can disperse into other minerals. To understand this process, they took a hand sample and analyzed it with XRF and LIBS, looking at elements like Cu, P, Al, Si, and Li. Even though XRF cannot directly measure Li, its results were effective in distinguishing turquoise from montebrasite. LIBS analysis, on the other hand, provided additional insights, confirming that turquoise does not have a significant amount of Li in its structure. Despite the larger spot size of XRF compared to LIBS (5 mm vs 300 µm), XRF performed well in accurately identifying turquoise and montebrasite. They also took a thin section of the samples for further analysis. Using LIBS, they petrographically characterized and mapped the thin section. The mapping results demonstrated the successful identification of minerals and their alterations in a thin section. Overall, the combination of XRF analysis and LIBS mapping in petrographic sections proved effective in identifying elements and minerals. This information is valuable, especially in exploration and mining phases, offering useful insights to complement more traditional techniques [77].
3.2.7 XRD
Geise et al. (2021) suggested that Li metal negative electrodes present an avenue for achieving high specific energy density in electrochemical energy storage, especially suitable for applications like EVs. However, a notable challenge in utilizing Li negative electrodes is Coulombic inefficiency, wherein capacity is lost to irreversible processes. Several degradation pathways, such as electrolyte reduction, Li corrosion, and the formation of dead Li, contribute to these losses. Unfortunately, few characterization methods can effectively distinguish between these different modes of degradation. In this study, a novel approach is developed to quantify the amount of Li metal in the electrode using operando synchrotron XRD. This method allows for the differentiation between actively cycling Li and Li lost to the degradation mechanisms mentioned earlier. Furthermore, operando synchrotron XRD offers a distinctive perspective on Li metal corrosion. By measuring the corrosion current of electrodeposited Li metal, this approach reveals that Li corrodes not only when electrically connected to the copper current collector but also in the form of dead Li metal. The observation of corrosion in both electrically connected and disconnected Li provides new insights into the corrosion mechanisms in Li metal batteries. This methodology addresses the existing gap in quantification methods for capacity losses and contributes to a more comprehensive understanding of Li corrosion. Such insights are crucial for designing long-lasting Li metal negative electrodes [78].
van de Krol and his coworkers (1999) investigated the electrochemical process of inserting Li into thin films made of two types of titanium dioxide (TiO2): porous nanostructured TiO2 and dense electron-beam evaporated TiO2 (anatase). The study utilizes in situ XRD to monitor the changes during the process. What is observed is a complete and reversible transformation from tetragonal anatase TiO2 to orthorhombic anatase Li0.5TiO2. The study estimates that, before this transformation occurs, anatase TiO2 can hold a maximum of about 0.05 Li atoms for every titanium atom. For the nanostructured samples, the XRD spectra before and after Li insertion were carefully examined. The analysis involved adjusting certain lattice parameters of the two phases. In the Li0.5TiO2 phase, the study found values of 3.85, 4.06, and 8.95 Å for the a, b, and c axes, respectively. These values closely match data reported for chemically lithiated anatase TiO2 powder. The study briefly discusses the implications of this phase transition on the analysis of optical and electrochemical measurements in TiO2 films. This research not only sheds light on the electrochemical behavior of Li insertion in nanostructured TiO2 films but also contributes to their understanding of how these materials undergo phase transformations [79].
Pöllmann and König (2021) suggested that Li is becoming increasingly important for batteries, ceramics, and various chemicals, leading to a growing demand in the coming years. It is found in nature in different forms, mainly in minerals and large salt lakes in dry areas. Analyzing Li is challenging and typically involves time-consuming methods due to the limitations of traditional XRF techniques. This study focuses on using XRD techniques to quantitatively analyze Li minerals and then recalibrate Li content using statistical methods. Many Li-containing ores and concentrates are relatively simple in terms of their mineral composition, often involving two main minerals. By using these compositions in combinations of Li minerals, such as spodumene, amblygonite, lepidolite, zinnwaldite, petalite, and triphylite, researchers can determine the mineral content. The recalibration of Li content through quantitative mineralogical analysis allows for a quick and reliable determination of Li in ores and concentrates. The techniques involved include quantitative mineralogy using the Rietveld method to determine mineral compositions. Statistical calculations using methods like partial least square regression and cluster analysis are also employed to enhance the accuracy of the results. This approach enables a fast and reliable quantification process. The study utilizes samples and concentrates from various Li deposits worldwide to ensure a comprehensive analysis. The proposed XRD method demonstrates impressive detection limits, reaching less than 1% for minerals and, consequently, down to 0.1% Li oxide. To illustrate the practical application of the research, case studies from a hard rock Li deposit highlight the importance of monitoring mineralogy throughout mining and different processing steps. Additionally, the study explores more complex considerations for analyzing Li samples from salt-lake brines, providing further insights for discussion. The overall aim is to contribute valuable and practical information to the field of Li analysis [3].
3.2.8 UV-vis spectroscopy
He et al. (2020) suggested that Li–sulfur (Li–S) batteries are struggling with performance and durability issues and making them better requires understanding how they work at a fundamental level, especially identifying the different stages of reactions inside a working Li–S battery. This study introduced a new way to observe what is happening inside these batteries as they operate. They designed a special cell that combines UV–Vis spectroscopy with electrochemistry. This cell uses a common type of electrode made of sulfur and carbon. With this setup, they were able to clearly identify the different chemicals involved in the battery’s operation, especially the liquid substances that appear during the battery’s discharging process. One significant discovery they made was a new type of sulfur compound called
Zou and Lu (2016) have studied that understanding of how different solvents affect the redox reactions in Li–S batteries is crucial for designing electrolytes that optimize battery performance. In this study, they utilize operando UV–Vis spectroscopy to investigate the redox reactions in Li–S batteries when using different types of solvents. They found that in solvents with a high donor number, such as dimethyl sulfoxide (DMSO), the redox reactions involve multiple electrochemical and chemical processes, including the formation of various polysulfide intermediates like
Patel and Dominko (2014) applied UV–Vis spectroscopy to examine how Li–S batteries behave, both qualitatively and quantitatively. To do this, they used catholytes made from specific combinations of Li and sulfur that they prepared in the lab. By doing this, they can create calibration curves for two different kinds of electrolytes used in these batteries. By analyzing the UV-vis spectra, first-order derivatives show five distinct peak positions in both types of electrolytes. During tests, while the batteries are running (operando measurements), they noticed gradual changes in the UV-vis spectra between wavelengths of 650–400 nm. The derived peak positions detected with catholytes are consistent with those obtained from operando measurements. Through recalculating normalized UV-vis spectra reflections acquired during operando mode, we can monitor the development of polysulfides and track their concentrations. This helps us to see how the movement of polysulfides differs between the two electrolytes and how these differences might be linked to changes in the battery’s capacity over time [82].
Gulino et al. (2014) found out that quartz substrates were first treated with a chemical called 4-ClCH2C6H4SiCl3. Then, they were mixed with another substance called 5-(4′-pyridylazo)-25,26,27-tris(ethoxycarbonylmethoxy)-28-hydroxycalix[4]-arene. This mixing resulted in a special material where a layer of a substance that can sense color, called a chromogenic sensing agent, was attached firmly to the quartz surface. XPS was used to study the structure of this special layer on the quartz. They also used another method called UV–Vis spectroscopy to understand how well this layer could detect Li ions. Interestingly, the layer was found to be very good at recognizing and capturing Li ions, even when they were present in very small amounts, like a few parts per million. This was true even when there were other ions, like sodium ions, present in similar amounts. This study showed that it is possible to make a special layer on a solid surface that can detect Li ions very effectively, even when there are other ions around. This could be useful in making devices that need to detect Li ions accurately [83].
Gracia and his coworkers (1997) developed a highly accurate method for detecting Li. It works by mixing Li ions with a substance called 1,4-dihydroxyanthraquinone, also known as Quinizarin. This reaction happens in a solution containing mostly DMSO, along with some sodium hydroxide and sodium carbonate. As a result of this reaction, the solution turns into a bluish-violet color with a specific wavelength of light at 601 nm. This color remains stable for a period ranging from 30 min to 2.5 h. A method called response surface methodology was used to make sure the concentrations of sodium hydroxide and Quinizarin are right. This method involves conducting experiments in a particular order, known as sequential experimental Doehlert designs. The good news is that this method follows Beer’s law, which means it gives reliable results. It can detect Li concentrations ranging from 14 to 250 ppb in both water and serum samples. When measuring 100 ppb of Li, the deviations in the results, known as RSD, are just 4.0% in water and 3.9% in serum. This method has been successfully used to measure the levels of Li in medications and human blood without needing to remove proteins [84].
3.2.9 XPS
Xiong et al. (2014) developed a new and accurate technique to measure the Li content in LiFePO4 using XPS. LiFePO4 samples underwent XDS and XPS analysis. XPS results showed Fe in +2 oxidation state and Li in +1 oxidation state. A strong linear relationship was observed between the theoretical and measured values of Li+ and Fe2+, with a correlation coefficient of about 0.9994 and an RSD of about 0.475. These results demonstrate the precise quantitative analysis of Li+ and Fe2+ content ratios in LiFePO4 samples using XPS peak separation. This method also shows promising results for large-scale applications in determining Li+ content in LIBs during charge and discharge cycles, providing a new approach to study the electrochemical properties of LiFePO4 [85].
Ismail et al. (2000) used XPS to examine the surface layer and elemental composition of Li metal electrodes before and after exposure to polymer electrolytes containing LiN(SO2CF3)2 (LiTFSI) or LiBF4. The base film of pure metallic Li Li2CO3 consists of LiOH in the outer layer and Li2O in the inner layer. Upon contact with the electrolyte, LiF is formed as a result of the reaction between the original film and impurities in the electrolyte. Polymer electrolyte with LiTFSI resulted in an extremely thin film with limited porosity in the inner layers. This was demonstrated by the limited amplitude dependence observed in complex impedance spectra. In contrast, addition of LiBF4 to the polymer resulted in a thicker layer with higher porosity, as indicated by a larger effect of oscillatory surface amplitude [86].
Otto and his coworkers (2021) suggested that to increase the energy density of Li batteries, the use of Li metal as the anode is being considered; however, challenges are presented. Li is highly reactive and is usually covered by a conductive layer, which can significantly affect the electrochemical properties and performance of the cell. However, many studies ignore this pass layer and use Li metal without proper consideration or surface characterization. To address this gap, they performed 3D characterization of Li samples using XPS, ToF-SIMS, and energy-dispersive complementary surface migration, and a systematic study of chemical composition. Analysis revealed the presence of a nanometer-thick inorganic passivation layer in all Li samples, consisting of an outer Li hydroxide layer, a carbonate layer, and an inner Li oxide-rich region. The thickness and composition of this permeable layer varies depending on the treatment before use as well as storage and transportation conditions. Additionally, they provide guidelines for experimental design and data interpretation to ensure reliable and comparable results. They have found that electron beam exposure of electrically contacted samples results in Li plating, reaction of newly formed Li metal even under ultrahigh vacuum conditions and decomposition of Li compounds caused by argon sputtering are recognized as a significant challenge for accurately characterizing Li surfaces [87].
Dupin et al. (2001) fabricated thin films of Li cobalt oxide by using radio-frequency magnetron sputtering and analyzed using XPS. This fabrication is potentially useful as positive electrode materials in small batteries. XPS results revealed two formal oxidation states (+III and +IV) for cobalt ions and two environments (octahedral and tetrahedral) for Li ions. An excess of oxygen was observed in thin films compared to crystalline LiCoO2, due to unusual coordination with metals and more covalent Co–O bonds. This excess oxygen is thought to be localized at the boundaries of randomly oriented nanodomains, as observed by transmission electron microscopy. The evolution of these thin films during different stages of their cycle in experimental microbatteries was also studied by analyzing the fundamental peaks and valence bands. Deintercalation of Li resulted in an increase in the proportion of Co4+ ions, as well as a change in the behavior of the anions [88].
Xu et al. (2014) studied the preliminary characterization of the interface layer that forms between a LIB electrode and a solid polymer electrolyte (SPE). SPEs are known for their electrochemical stability and high safety, making them an attractive alternative to conventional liquid or gel electrolytes in high energy density battery systems. This research focuses on studying the solid–electrolyte interface (SEI) formation in graphite|Li cells using XPS. The SPEs under investigation are based on a high molecular weight poly(ethylene oxide) salt (PEO) and a Li bis(trifluoromethanesulfonyl)imide salt (LiTFSI). XPS analysis shows the presence of significant amounts of LiOH with indications of moisture contamination in special purpose facilities. The water content in both pure PEO and polymer electrolytes is measured in the hundreds of parts per million range. These electrolytes are prepared using different batches of PEO and drying temperatures in conventional SPE preparation methods. In addition, severe salt depletion was observed at the graphite–SPE interface after the first discharge. However, the salt appears to be more stable at the Li–SPE interface or when a LiTFSI-based liquid electrolyte equivalent is used [89].
Leroy et al. (2007) examined the formation of a passivation film in various salts (LiBF4, LiPF6, LiTFSI, LiBETI) dissolved in carbonate solvents as electrolytes at the cathode surface of full LiCoO2/graphite Li-ion cells, known as the SEI. XPS was used to analyze SEI formation at different possible stages during the first cycle, revealing the possible species-dependent nature of surface film formation and the unique properties of each salt. At 3.8 eV, most gaseous species were identified for all salts. However, beyond this possibility, the behavior of LiPF6 was distinctive, showing significant accumulation of LiF. In contrast, SEI formation of other salts appears to be affected by solvent decomposition of the electrolyte [90].
3.2.10 Other methods
γ-Li aluminum oxide serves as a prime example of an ultraslow Li-ion conductor, a characteristic that holds immense significance for its envisioned and practical applications. This study presents the findings of single-crystal neutron diffraction investigations conducted at both normal and elevated temperatures. Meticulous analysis confirms the widely accepted room-temperature structure initially determined through powder neutron diffraction in 1965. Upon reaching 1,043 K, a splitting of the Li position is observed, indicating the initiation of intrinsic diffusion. Utilizing the maximum-entropy method to analyze the negative scattering-length density, they identify a pronounced preference for a highly curved diffusion path that navigates octahedral voids between neighboring Li sites. These findings enhance their comprehension of ultraslow Li diffusion in meticulously arranged ionic solids on a microscopic level and, ultimately, contribute to the establishment of structure–property correlations [91] (Table 4).
Simplified comparison between different analytical methods for the estimation of Li [92]
| Analytical technique | Method used | Benefits | Limitations |
|---|---|---|---|
| Conventional methods | |||
| Gravimetry | Precipitation | Precise method, no temperature effect. | Impurities in precipitation, slow. |
| Titrimetry | Complexometric titrations | Fast, accurate, less waste. | Calibration error, human error. |
| Colorimetry | Absorption of light | Low cost, easy. | Low range, costly when making colored samples, manual, use color sample. |
| Modern methods | |||
| Spectrofluorimetry | Emission of light | Highly sensitive and specific, large linearity. | pH sensitive, auto-fluorescence, toxic to biological media |
| ICP-MS | Ionization of sample and separation by charge-to-mass ratio | Measure multi-elements at same time, better than ICP-OES, low detection limits. | Spectral interference, very costly, cannot be used in situ or in real-time analysis. |
| ICP-OES | Ionic emission | Higher detection limits than AAS, fast, linear, high resolution, wide concentration range. | Spectral interference, matrix effect, ionization, expensive than AAS. |
| TIMS | Thermal ionization and separation by charge-to-mass ratio | Precise, use low energy, near 100% emission of ions, easy automated lower mass fractionation. | Require pure solution, limited to element having less than three isotopes, mass fractionation continuously change. |
| AAS | Absorption of light | High sensitivity, low sample consumption. | Low atomization efficiency and sensitivity, evaporation of water into sample. |
| XRF | Inner electron transition | Fast, non-destructive, low running cost. | Interference, matrix effect, uncertainty, noise. |
| XRD | X-ray scattering | Direct sampling, non-destructive. | Low image quality, invisible to amorphous solids |
| UV–Vis spectroscopy | Absorption of light | Fast, easy, no need of any electrode. | synthesis of ligand is difficult and time consuming, low selectivity to alkaline solution. |
4 Future trends in Li research and the evolution of analytical techniques
Studies on Li identification and analysis were retrieved from the Scopus database, which is well known for its comprehensive bibliographic information on publications in various fields [93,94]. The dataset includes “Articles” and “Conference Proceedings,” containing 4,873 publications. To track research trends in Li identification and analysis over the past 5 years, data from recent publications were analyzed. It is important to note that due to the dynamic nature of the Scopus database, results may vary if accessed on different dates, as the database is constantly updated with new publications [95].
In Figure 6, the United States is shown as the leading country in extensive Li research, while Germany is second in terms of interest in Li research and development. In addition, the Center National de la Recherche Scientifique (France) stands out as the top research institution in Li research with 140 scientific publications, as shown in Figure 7. Since then, the Chinese Academy of Sciences has published 92 articles.
![Figure 6
The world’s top ten countries with a strong interest in Li analysis research [92].](/document/doi/10.1515/revac-2023-0082/asset/graphic/j_revac-2023-0082_fig_006.jpg)
The world’s top ten countries with a strong interest in Li analysis research [92].
![Figure 7
The top ten institutes in the world with a strong interest in Li analysis research [92].](/document/doi/10.1515/revac-2023-0082/asset/graphic/j_revac-2023-0082_fig_007.jpg)
The top ten institutes in the world with a strong interest in Li analysis research [92].
An analysis of research publications in Li -based disciplines from 1978 to 2023 shows that chemistry is the most prevalent discipline, followed by materials science, physics, astronomy, biochemistry, engineering, medicine, and energy. Figure 8 indicates that chemistry has the most publications, with 2,381 articles (24.72%), followed by materials science with 1,094 articles (11.36%) [92].
![Figure 8
Research characteristics profile for Li analysis by subject area [92].](/document/doi/10.1515/revac-2023-0082/asset/graphic/j_revac-2023-0082_fig_008.jpg)
Research characteristics profile for Li analysis by subject area [92].
Current literature is mostly focused on the development of Li batteries. In addition, research has been conducted to develop methods for testing Li in clinical samples including serum, saliva, urine, brain, and blood [96–98]. However, methods for Li testing in environmental detection and monitoring remain limited, using primarily stationary equipment in laboratory settings. Table 5 indicates that voltammetric and colorimetric/optical techniques are commonly used to analyze Li in clinical samples. Furthermore, the use of conducting polymers and ions as modifiers remains attractive, despite the challenges in synthesis and purification processes to achieve compound characterization.
Simplified comparison of stationary and portable instruments’ performance [92]
| Analysis technique | Sample matrix | Range | LOD; precision |
|---|---|---|---|
| Potentiometry | LiCl solution | 0.69 × 10⁻⁴ to 0.69 g·L−1 | 9.02 × 10⁻⁵ ± 2.78 × 10⁻⁵ g·L−1 |
| Modifier: Platinum, gold and Li Ionophore VI | |||
| Potentiometry | LiCl solution and brine | 6.94 × 10⁻⁶ to 6.94 g·L−1 | 6.90 × 10⁻⁶ g·L−1 |
| Modifier: Ni-HAB MOF, Ionophore VI | |||
| Voltammetry | LiClO4 solution and saliva | Up to 3.57 × 10⁻² g·L−1 | >3.47 × 10⁻² g·L−1; RSD <7% |
| Modifier: LiMn2O4 | |||
| Potentiometry | Serum | 3.47 × 10⁻⁴ to 0.69 g·L−1 | 3.47 × 10⁻⁴ g·L−1 |
| Modifier: Li Ionophore VI, trioctylphosphine oxide and polyvinyl chloride membrane | |||
| Potentiometry | Blood | 2.50 × 10⁻⁴ to 0.69 g·L−1 | 6.18 × 10⁻⁴ g·L−1 |
| Modifier: Li Ionophore VI, polymeric membrane | |||
| Potentiometry | Serum | 4.86 to 1.04 × 10⁻² g·L−1 | 9.02 × 10⁻³ g·L−1 |
| Modifier: N,N-dicyclohexyl-N′,N′-diidobutyl cyclohexane-1,2-dicarboxamide | |||
| Potentiometry | Water | 6.94 × 10⁻⁵ to 6.94 × 10⁻² g·L−1 | 7.63 ± 2.43 × 10⁻⁵ g·L−1 |
| Modifier: PVC, Ionophore VI, Potassium tetrakis(4-chlorophenyl) borate and 2-Nitrophenyl octyl ether | |||
| Potentiometry | Serum | 6.94 × 10⁻⁵ to 6.94 × 10⁻⁴ g·L−1 | 2.86 × 10⁻⁵ g·L−1 |
| Modifier: poly(o-methoxyaniline) | |||
| Voltammetry | Serum | 0.69 × 10⁻³ to 0.44 g·L−1 | 0.69 × 10⁻³ g·L−1 |
| Modifier: 6,6′-dibenzyl-14-crown-4 ether | |||
| Potentiometry | LiCl solution | 0.69 × 10⁻⁴ to 0.44 g·L−1 | N/A |
| Modifier: Single-walled carbon nanotube, lithium tetrakis(pentafluorophenyl)borate and PVC | |||
| Potentiometry | LiCl solution | 0.69 × 10⁻⁴ to 0.69 g·L−1 | 9.02 × 10⁻⁵ ± 2.78 × 10⁻⁵ g·L−1 |
| Modifier: Platinum, gold dan Li Ionophore VI | |||
| Potentiometry | LiCl solution and brine | 6.94 × 10⁻⁶ to 6.94 g·L−1 | 6.90 × 10⁻⁶ g·L−1 |
| Modifier: Ni-HAB MOF, Ionophore VI | |||
| Spectrochemical and electrical impedance | Blood | 0.96 × 10⁻³ g·L−1
|
<0.69 × 10⁻³ g·L−1 |
| Colorimetry | Blood and urine | 0.5 to 2.0 × 10⁻² g·L−1 | 0.5 × 10⁻³ g·L−1 |
| Li Assay kit LS | |||
| Colorimetry | Saliva | 1.73 × 10⁻³ to 4.16 × 10⁻² g·L−1 | N/A |
| Modifier: Quinizarin | |||
| Colorimetry | Serum | 1.04 × 10⁻³ to 3.40 × 10⁻² g·L−1 | <0.55 × 10⁻³ g·L−1 |
| Colorimetric Assay | |||
| Colorimetry | Serum | 3.47 × 10⁻³ to 2.08 × 10⁻² g·L−1 | 0.69 × 10⁻³ g·L−1 |
| Spectrophotometric Li assay | |||
| Optical Li sensor | LiClO4 solution | ∼6.94 × 10⁻² to 0.69 g·L−1 | N/A |
| Modifier: Ionophore and AuNPs | |||
| Spectrophotometry | — | N/A | <0.020 × 10⁻⁶ g·L−1; Short term (in-run): 1-3% RSD; Long term (4 h): RSD < 5% |
| ICP-HM (Horiba) | |||
| Spectrophotometry | — | N/A | <1 × 10⁻⁶ g·L−1; Short term (in-run): 0.3–1% RSD; Long term (4 h): RSD < 3% |
| ICP-OES (Horiba) | |||
| Spectrophotometry | — | N/A | <0.5 × 10⁻⁶ g·L−1; 1–5% |
| GF-AAS (Horiba) | |||
| Spectrophotometry | — | N/A | <5 × 10⁻⁶ g·L−1; 0.1–1% RSD |
| Flame AAS (Horiba) |
5 Conclusion
The use of Li is increasing rapidly in laptops, portable devices, large-scale energy storage systems, and medicine. To better understand the availability of Li in nature, there is a need for technology that can rapidly and accurately detect its presence. This technology would provide geochemical data to more effectively calculate economic reserves. Additionally, fast and accurate Li detection is crucial for determining the appropriate dose of Li salt for treating bipolar disorder, as excessive Li concentration in the blood can be harmful. Monitoring water pollution from Li battery waste is also essential. Current methods often rely on laboratory equipment that is time-consuming, requires complex sample handling, and involves high costs for chemicals. According to the data given above, it can be concluded that all the methods used for Li estimation have both weak points and strong points. Weak points include most of the techniques being expensive, slow, toxic, etc. But among these methods, UV–Vis spectroscopy is a technique that is fast, effective, cheap, portable, and easily handled. According to the abovementioned data, there is limited research on sensor technology that can determine Li levels in situ, in real-time and with high accuracy.
Acknowledgments
The authors express their appreciation to the Deanship of Scientific Research at King Khalid University, Saudi Arabia, for this work through a research group program under grant number RGP-2/381/45.
-
Funding information: The work has been supported by the Deanship of Scientific Research at King Khalid University, Saudi Arabia research group program under grant number RGP-2/381/45.
-
Author contributions: Asif Hanif Chaudhry: Basic idea and theme proposed by him; Syed Asim Abbas Zaidi: Data collection, and preparation of manuscript; Shaukat Ali: Supervising the whole team; Nosheen Sial: Data formatting; Muhammad Imran: Add critical analysis; Muhammad Aslam: Prepare conclusion; Nimra Iqbal: Making future trends; Faiza Qurban & Maria Ajmal: Athenticise the whole data; Sajjad Karamat Wahla: Prepare an exploration part of paper.
-
Conflict of interest: Authors state no conflict of interest.
-
Data availability statement: Data sharing is not applicable to this article as no datasets were generated or analyzed during the current study.
References
[1] Afrin A, Akhter T, Ahmed MJ. A highly sensitive and selective spectrofluorimetric method for the determination of lithium at pico-trace levels in some real, pharmaceutical formulations, biological fluids, soil and food samples using 5, 7-dibromo-8-hydroxyquinoline. Eur J Pharm Med Res. 2019;6(6):784–99.Search in Google Scholar
[2] Kavanagh L, Keohane J, Garcia Cabellos G, Lloyd A, Cleary J. Global lithium sources – Industrial use and future in the electric vehicle industry: A review. Resources. 2018;7(3):57–86. 10.3390/resources7030057.Search in Google Scholar
[3] Pöllmann H, König U. Monitoring of lithium contents in lithium ores and concentrate-assessment using x-ray diffraction (XRD). Minerals. 2021;11(10):1058–93. 10.3390/min11101058.Search in Google Scholar
[4] Gruber PW, Medina PA, Keoleian GA, Kesler SE, Everson MP, Wallington TJ. Global lithium availability: A constraint for electric vehicles? J Ind Ecol. 2011;15(5):760–75. 10.1111/j.1530-9290.2011.00359.x.Search in Google Scholar
[5] USGS. Lithium annual publication: Mineral commodity summaries: Lithium: 2011. 2011. http://minerals.Usgs.Gov/minerals/pubs/commodity.Search in Google Scholar
[6] Talens Peiró L, Villalba Méndez G, Ayres RU. Lithium: Sources, production, uses, and recovery outlook. JOM. 2013;65(8):986–96. 10.1007/s11837-013-0666-4.Search in Google Scholar
[7] London D, editor. The transition from granite to pegmatite. Geol. Soc. Am. Abstr. Programs. USA; 2008.Search in Google Scholar
[8] London D. Pegmatites. Can Miner Spec Publ. 2008;10:347.Search in Google Scholar
[9] Kesler SE, Gruber PW, Medina PA, Keoleian GA, Everson MP, Wallington TJ. Global lithium resources: Relative importance of pegmatite, brine and other deposits. Ore Geol Rev. 2012;48:55–69. 10.1016/j.oregeorev.2012.05.006.Search in Google Scholar
[10] Laznicka P. Giant metallic deposits. Berlin: Springer; 2006. p. 732.Search in Google Scholar
[11] Sutter J. Life cycle inventories of highly pure chemicals Ecoinvent report no 19. Duebendorf and St. Gallen: Swiss Centre for Life Cycle Inventory E; 2007.Search in Google Scholar
[12] Kudryavtsev P. Lithium in nature, application, methods of extraction. Sci Isr Tech Advant. 2016;18(3):63–83.Search in Google Scholar
[13] Wilburn DR. Material use in the United States – selected case studies for cadmium, cobalt, lithium and nickel in rechargeable batteries. United State Geological Survey; 2009. p. 1–18.10.3133/sir20085141Search in Google Scholar
[14] Goonan TG. Lithium use in batteries. Bull US Geol Surv. 2012;1371:14. US Geological Survey; 2012. Report No.: 2330-5703.10.3133/cir1371Search in Google Scholar
[15] Ebensperger A, Maxwell P, Moscoso C. The lithium industry: Its recent evolution and future prospects. Resour Policy. 2005;30(3):218–31. 10.1016/j.resourpol.2005.09.001.Search in Google Scholar
[16] Meshram P, Pandey B, Mankhand T. Extraction of lithium from primary and secondary sources by pre-treatment, leaching and separation: A comprehensive review. Hydrometallurgy. 2014;150:192–208. 10.1016/j.hydromet.2014.10.012.Search in Google Scholar
[17] Ober JA. Mineral commodity summaries 2018. Reston v, USA: US Geological Survey; 2018.10.3133/70194932Search in Google Scholar
[18] Sverdrup HU. Modelling global extraction, supply, price and depletion of the extractable geological resources with the lithium model. Resour Conserv Recycl. 2016;114:112–29. 10.1016/j.resconrec.2016.07.002.Search in Google Scholar
[19] Swain B. Recovery and recycling of lithium: A review. Sep Purif Technol. 2017;172:388–403. 10.1016/j.seppur.2016.08.031.Search in Google Scholar
[20] Tahil W. The trouble with lithium implications of future phev production for lithium demand: Meridian international research, martainville; 2007. p. 202006. Http://www.Meridian-int-res.Com/projects/lithium_problem_2.Pdf.Search in Google Scholar
[21] Comer E. The lithium industry today. Lithium needs and resources. Pergamon: Elsevier; 1978. p. 237–40.10.1016/B978-0-08-022733-7.50005-8Search in Google Scholar
[22] Hartigan G. The use of lithium salts in affective disorders. BJPsych. 1963;109(463):810–4. 10.1192/bjp.109.463.810.Search in Google Scholar
[23] Andrew JM. The future of lubricating greases in the electric vehicle era. Tribol Lubr Technol. 2019;75(5):38–44.Search in Google Scholar
[24] Choubey PK, Kim M-S, Srivastava RR, Lee J-C, Lee J-Y. Advance review on the exploitation of the prominent energy-storage element: Lithium. Part i: From mineral and brine resources. Min Eng. 2016;89:119–37. 10.1016/j.mineng.2016.01.010.Search in Google Scholar
[25] Koltsov V, Novikov PY, Sarychev G, Tananaev I. Experimental investigations during the technology development of sulfuric acid processing of spodumene concentrate. Tsvetnye Met. 2016;4:18–22.10.17580/tsm.2016.04.03Search in Google Scholar
[26] Xiao M, Wang SH, Zhang QF, JW Z. Leaching mechanism of the spodumene sulphuric acid process. Rare Met. 1997;1(16):37–45.Search in Google Scholar
[27] Deng FY, Yin TX, Gan WX, He XY. Comprehensive utilization of potassium, rubidium, and cesium in mother liquor after extracting lithium from lepidoliter. Min Metall Eng. 1999;19(1):50–2.Search in Google Scholar
[28] Barbosa LI, Valente G, Orosco RP, Gonzalez JA. Lithium extraction from β-spodumene through chlorination with chlorine gas. Min Eng. 2014;56:29–34. 10.1016/j.mineng.2013.10.026.Search in Google Scholar
[29] Barbosa LI, Valente N, Gonzalez JA. Kinetic study on the chlorination of β-spodumene for lithium extraction with Cl2 gas. Thermochim acta. 2013;557:61–7. 10.1016/j.tca.2013.01.033.Search in Google Scholar
[30] Arne SK, Johan WS Method of recovering lithium salts from lithium-containing minerals: Us24041638a. Google Patents; 1941-01-28.Search in Google Scholar
[31] Zheng M-P, Xing E-Y, Zhang X-F, Li M-M, Che D, Bu L-Z, et al. Classification and mineralization of global lithium deposits and lithium extraction technologies for exogenetic lithium deposits. China Geol. 2023;6(4):547–66. 10.31035/cg2023061.Search in Google Scholar
[32] Ren FT, Zhang J. Chemical separation and enrichment of lithium in aluminous rock in central Guizhou. Inorg Chem Ind. 2013;45(3):19–21.Search in Google Scholar
[33] Jeffery G, Bassett J, Mendham J, Denney R. Longman scientific & technical vogel’ s: Textbook of quantitative chemical analysis. 5th edn. Longman Group UK Limited; 1989.Search in Google Scholar
[34] Vishveshwaraiah K, Patel C. Gravimetric estimation of lithium as trilithium phosphate. J Indian Inst Sci. 1959;41(1):16.Search in Google Scholar
[35] Forster C. The determination of small amounts of lithium. Analyst. 1954;79(943):629–35.10.1039/an9547900629Search in Google Scholar
[36] Karaseva E, Savvina A, Kuzmina E, Mochalov S, Kolosnitsyn V. Studying the composition of solvate complexes of lithium perchlorate with sulfolane via vacuum gravimetry. Russ J Phys Chem A. 2022;96(1):93–8.10.1134/S0036024422010150Search in Google Scholar
[37] Caley ER, Simmons GA, Jr. Gravimetric determination of lithium by precipitation as trilithium phosphate. Anal Chem. 1953;25(9):1386–9.10.1021/ac60081a024Search in Google Scholar
[38] Loghavi MM, Babaiee M, Eqra R. A review of volumetric titration as an efficient method for the quantification of ions and compounds in lithium-ion battery components. Chem Pap. 2023;77(12):7395–408. 10.1007/s11696-023-03075-w.Search in Google Scholar
[39] Komatsu T, Maeki M, Ishida A, Tani H, Tokeshi M. Paper-based device for the facile colorimetric determination of lithium ions in human whole blood. ACS Sens. 2020;5(5):1287–94.10.1021/acssensors.9b02218Search in Google Scholar
[40] Maire P, Evans A, Kaiser H, Scheifele W, Novák P. Colorimetric determination of lithium content in electrodes of lithium-ion batteries. J Electrochem Soc. 2008;155(11):A862.10.1149/1.2979696Search in Google Scholar
[41] Maire P, Kaiser H, Scheifele W, Novák P. Colorimetric determination of lithium-ion mobility in graphite composite electrodes. J Electroanal Chem. 2010;644(2):127–31.10.1016/j.jelechem.2009.09.011Search in Google Scholar
[42] Hirayama E, Sugiyama T, Hisamoto H, Suzuki K. Visual and colorimetric lithium ion sensing based on digital color analysis. Anal Chem. 2000;72(3):465–74.10.1021/ac990588wSearch in Google Scholar
[43] Quartarolli LF, Silveira AT, Toma HE. Overcoming lithium analysis difficulties with a simple colorimetric/spectrophotometric method. Anal Methods. 2021;13(32):3627–31.10.1039/D1AY00937KSearch in Google Scholar
[44] Levy AL, Katz EM. Comparison of serum lithium determinations by flame photometry and atomic absorption spectrophotometry. Clin Chem. 1970;16(10):840–2.10.1093/clinchem/16.10.840Search in Google Scholar
[45] Brumbaugh RJ, Fanus WE. Determination of lithium in spodumene by flame photometry. Anal Chem. 1954;26(3):463–5.10.1021/ac60087a009Search in Google Scholar
[46] Fishman MJ. Flame photometric determination of lithium in water. J Am Water Work Ass. 1962;54(2):228–34.10.1002/j.1551-8833.1962.tb00836.xSearch in Google Scholar
[47] Kassner J, Benson V, Creitz E. Flame spectrophotometric determination of lithium in lithium minerals. Anal Chem. 1960;32(9):1151–3.10.1021/ac60165a030Search in Google Scholar
[48] Hu W, Haddad PR, Hasebe K, Tanaka K. A novel ion chromatographic method based on cation-exchange and acid–base interactions for the simultaneous determination of total alkalinity and monovalent cations in samples of µl volume. Analyst. 2001;126(5):555–8.10.1039/b101820pSearch in Google Scholar
[49] Nishihama S, Onishi K, Yoshizuka K. Selective recovery process of lithium from seawater using integrated ion exchange methods. Solvent Extr Ion Exch. 2011;29(3):421–31.10.1080/07366299.2011.573435Search in Google Scholar
[50] Xiang W, Liang S, Zhou Z, Qin W, Fei W. Extraction of lithium from salt lake brine containing borate anion and high concentration of magnesium. Hydrometallurgy. 2016;166:9–15.10.1016/j.hydromet.2016.08.005Search in Google Scholar
[51] Jaafari A, Ouzeau V, Ely M, Rodriguez F, Yassar A, Aaron J, et al. Fine-tuning the optical properties of aluminium and lithium quinolates through oligothiophene substituents in 2-position. Synth Met. 2004;147(1–3):175–82. 10.1016/j.synthmet.2004.07.011.Search in Google Scholar
[52] Lin J, Liu Y, Hu Z, Yang L, Chen K, Chen H, et al. Accurate determination of lithium isotope ratios by MC-ICP-MS without strict matrix-matching by using a novel washing method. J Anal Spectrom. 2016;31(2):390–7. 10.1039/C5JA00231A.Search in Google Scholar
[53] Nishio Y, Nakai SI. Accurate and precise lithium isotopic determinations of igneous rock samples using multi-collector inductively coupled plasma mass spectrometry. Anal Chim Acta. 2002;456(2):271–81. 10.1016/S0003-2670(02)00042-9.Search in Google Scholar
[54] Voica C, Roba C, Iordache A. Lithium levels in food from the Romanian market by inductively coupled plasma–mass spectrometry (ICP-MS): A pilot study. Anal Lett. 2021;54(1–2):242–54. 10.1080/00032719.2020.1748642.Search in Google Scholar
[55] Choi MS, Shin HS, Kil YW. Precise determination of lithium isotopes in seawater using MC-ICP-MS. Microchem J. 2010;95(2):274–8. 10.1016/j.microc.2009.12.013.Search in Google Scholar
[56] Moriguti T, Makishima A, Nakamura E. Determination of lithium contents in silicates by isotope dilution ICP‐MS and its evaluation by isotope dilution thermal ionisation mass spectrometry. Geostand Geoanal Res. 2004;28(3):371–82. 10.1111/j.1751-908X.2004.tb00756.x.Search in Google Scholar
[57] Millot R, Guerrot C, Vigier N. Accurate and high‐precision measurement of lithium isotopes in two reference materials by MCICP-MS. Geostand Geoanal Res. 2004;28(1):153–9. 10.1111/j.1751-908X.2004.tb01052.x.Search in Google Scholar
[58] Misra S, Froelich PN. Measurement of lithium isotope ratios by quadrupole-ICP-MS: Application to seawater and natural carbonates. J Anal Spectrom. 2009;24(11):1524–33. 10.1039/b907122a.Search in Google Scholar
[59] Raish M, Ahmad A, Alkharfy KM, Al-Jenoobi FI, Al-Mohizea AM, Mohsin K, et al. Antioxidant potential and in situ analysis of major and trace element determination of Ood-saleeb, a known unani herbal medicine by ICP-MSms. Biol Trace Elem Res. 2016;172:521–7. 10.1007/s12011-015-0607-x.Search in Google Scholar
[60] Rudd ND, Liu Y, Tan K, Chen F, Chabal YJ, Li J. Luminescent metal–organic framework for lithium harvesting applications. ACS Sustain Chem Eng. 2019;7(7):6561–8. 10.1021/acssuschemeng.8b05018.Search in Google Scholar
[61] Kröger T-N, Wiemers-Meyer S, Harte P, Winter M, Nowak S. Direct multielement analysis of polydisperse microparticles by classification-single-particle ICP-OES in the field of lithium-ion battery electrode materials. Anal Chem. 2021;93(20):7532–9. 10.1021/acs.analchem.1c01283.Search in Google Scholar
[62] Koo B, Sofen LE, Gisch DJ, Kern B, Rickard MA, Francis MB. Lithium‐chelating resins functionalized with oligoethylene glycols toward lithium‐ion battery recycling. Adv Sustain Syst. 2021;5(2):2000230–7. 10.1002/adsu.202000230.Search in Google Scholar
[63] Darezereshki E, Vakylabad AB, Hassanzadeh A, Niedoba T, Surowiak A, Koohestani B. Hydrometallurgical synthesis of nickel nano-sulfides from spent lithium-ion batteries. Minerals. 2021;11(4):419–31. 10.3390/min11040419.Search in Google Scholar
[64] Vuollo P, Honkamo J, Niemelä M, Perämäki P, Jantunen H. Determination of boron and lithium in ferroelectric samples by ICP-OES and ICP-MS. Microchim Acta. 2009;164:217–24. 10.1007/s00604-008-0061-y.Search in Google Scholar
[65] Bencs L, György K, Kardos M, Osán J, Alföldy B, Varga I, et al. Determination of trace elements in lithium niobate crystals by solid sampling and solution-based spectrometry methods. Anal Chim Acta. 2012;726:1–8. 10.1016/j.aca.2012.03.013.Search in Google Scholar
[66] Grote-Koska D, Klauke R, Brand K, Schumann G. Reference measurement procedure for the determination of electrolytes in human blood via ICP-OES measurement. Metrologia. 2018;55(2):245–53. 10.1088/1681-7575/aaaa3f.Search in Google Scholar
[67] Sharma N, Singh VK, Lee Y, Kumar S, Rai PK, Pathak AK, et al. Analysis of mineral elements in medicinal plant samples using LIBS and ICP-OES. Spectrosc. 2020;41(6):234–41. 10.46770/AS.2020.06.003.Search in Google Scholar
[68] Salit ML, Vocke RD, Kelly WR. An ICP-OES method with 0.2 expanded uncertainties for the characterization of LiAlO2. Anal Chem. 2000;72(15):3504–11. 10.1021/ac0000877.Search in Google Scholar
[69] Kröger T-N, Harte P, Klein S, Beuse T, Börner M, Winter M, et al. Direct investigation of the interparticle-based state-of-charge distribution of polycrystalline NMC532 in lithium ion batteries by classification-single-particle-ICP-OES. J Power Sources. 2022;527:231204. 10.1016/j.jpowsour.2022.231204.Search in Google Scholar
[70] Dong J-H, Yang C, Ding H-Q, Xing P-J, Zhou F-Y, Tian H, et al. Development of a portable method for serum lithium measurement based on low-cost miniaturized ultrasonic nebulization coupled with atmospheric-pressure air-sustained discharge. Anal Chem. 2021;93(39):13351–9. 10.1021/acs.analchem.1c03133.Search in Google Scholar
[71] Moriguti T, Nakamura E. High-yield lithium separation and the precise isotopic analysis for natural rock and aqueous samples. Chem Geol. 1998;145(1–2):91–104. 10.1016/S0009-2541(97)00163-0.Search in Google Scholar
[72] Moriguti T, Nakamura E. Across-arc variation of Li isotopes in lavas and implications for crust/mantle recycling at subduction zones. Earth Planet Sci Lett. 1998;163(1–4):167–74. 10.1016/S0012-821X(98)00184-8.Search in Google Scholar
[73] You C-F, Chan L-H. Precise determination of lithium isotopic composition in low concentration natural samples. Geochim Cosmochim Acta. 1996;60(5):909–15. 10.1016/0016-7037(96)00003-8.Search in Google Scholar
[74] Manfro ID, Tegner M, Krutzmann ME, do Carmo Artmann A, Brandeburski MR, Peteffi GP, et al. Determination of lithium in dried blood spots and dried plasma spots by graphite furnace atomic absorption spectrometry: Method development, validation and clinical application. Talanta. 2020;216:120907–14. 10.1016/j.talanta.2020.120907.Search in Google Scholar
[75] Magnin J-L, Decosterd L, Centeno C, Burnier M, Diezi J, Biollaz J. Determination of trace lithium in biological fluids using graphite furnace atomic absorption spectrophotometry: Variability of urine matrices circumvented by cation exchange solid phase extraction. Pharm Acta Helv. 1996;71(4):237–46. 10.1016/S0031-6865(96)00020-9.Search in Google Scholar
[76] Xu S, Haddad D, Balogh MP. X-ray fluorescence for lithium metal anode quality inspection. Manuf Lett. 2023;35:1–5. 10.1016/j.mfglet.2022.10.002.Search in Google Scholar
[77] Ribeiro R, Capela D, Ferreira M, Martins R, Jorge P, Guimarães D, et al. X-ray fluorescence and laser-induced breakdown spectroscopy analysis of li-rich minerals in veins from argemela tin mine, central portugal. Minerals. 2021;11(11):1169. 10.3390/min11111169.Search in Google Scholar
[78] Geise NR, Kasse RM, Nelson Weker J, Steinrück H-G, Toney MF. Quantification of efficiency in lithium metal negative electrodes via operando x-ray diffraction. Chem Mater. 2021;33(18):7537–45. 10.1021/acs.chemmater.1c02585.Search in Google Scholar
[79] van de Krol R, Goossens A, Meulenkamp EA. In situ x‐ray diffraction of lithium intercalation in nanostructured and thin film anatase TiO2. J Electrochem Soc. 1999;146(9):3150–4. 10.1149/1.1392447.Search in Google Scholar
[80] He Q, Freiberg AT, Patel MU, Qian S, Gasteiger HA. Operando identification of liquid intermediates in lithium–sulfur batteries via transmission UV–vis spectroscopy. J Electrochem Soc. 2020;167(8):080508. 10.1149/1945-7111/ab8645.Search in Google Scholar
[81] Zou Q, Lu Y-C. Solvent-dictated lithium sulfur redox reactions: An operando UV-vis spectroscopic study. J Phys Chem Lett. 2016;7(8):1518–25. 10.1021/acs.jpclett.6b00228.Search in Google Scholar
[82] Patel MU, Dominko R. Application of in operando UV/vis spectroscopy in lithium–sulfur batteries. ChemSusChem. 2014;7(8):2167–75. 10.1002/cssc.201402215.Search in Google Scholar
[83] Gulino A, Lupo F, Cristaldi DA, Pappalardo S, Capici C, Gattuso G, et al. A viable route for lithium ion detection. Eur J Inorg Chem. 2014;2014(3):442–9. 10.1002/ejic.201301213.Search in Google Scholar
[84] Gracia LG, Rodríguez LC, Ceba MR. Spectrophotometric determination of lithium with quinizarin in drugs and serum. Talanta. 1997;44(1):75–83. 10.1016/S0039-9140(96)02018-8.Search in Google Scholar
[85] Xiong W, Hu Q, Liu S. A novel and accurate analytical method based on x-ray photoelectron spectroscopy for the quantitative detection of the lithium content in lifepo 4. Anal Methods. 2014;6(15):5708–11. 10.1039/c4ay00980k.Search in Google Scholar
[86] Ismail I, Noda A, Nishimoto A, Watanabe M. XPS study of lithium surface after contact with lithium-salt doped polymer electrolytes. Electrochim Acta. 2001;46(10–11):1595–603. 10.1016/S0013-4686(00)00758-1.Search in Google Scholar
[87] Otto S-K, Moryson Y, Krauskopf T, Peppler K, Sann J, Janek J, et al. In-depth characterization of lithium-metal surfaces with XPS and TOF-SIMS: Toward better understanding of the passivation layer. Chem Mater. 2021;33(3):859–67. 10.1021/acs.chemmater.0c03518.Search in Google Scholar
[88] Dupin J-C, Gonbeau D, Benqlilou-Moudden H, Vinatier P, Levasseur A. XPS analysis of new lithium cobalt oxide thin-films before and after lithium deintercalation. Thin Solid Films. 2001;384(1):23–32. 10.1016/S0040-6090(00)01802-2.Search in Google Scholar
[89] Xu C, Sun B, Gustafsson T, Edström K, Brandell D, Hahlin M. Interface layer formation in solid polymer electrolyte lithium batteries: An XPS study. J Mater Chem A. 2014;2(20):7256–64. 10.1039/C4TA00214H.Search in Google Scholar
[90] Leroy S, Martinez H, Dedryvère R, Lemordant D, Gonbeau D. Influence of the lithium salt nature over the surface film formation on a graphite electrode in Li-ion batteries: An XPS study. Appl Surf Sci. 2007;253(11):4895–905. 10.1016/j.apsusc.2006.10.071.Search in Google Scholar
[91] Wiedemann D, Indris S, Meven M, Pedersen B, Boysen H, Uecker R, et al. Single-crystal neutron diffraction on γ-LiAlO2: Structure determination and estimation of lithium diffusion pathway. Z Kristallogr-Cryst Mater. 2016;231(3):189–93. 10.1515/cclm-2022-0997.Search in Google Scholar
[92] Rohiman A, Setiyanto H, Saraswaty V, Amran M. Review of analytical techniques for the determination of lithium: From conventional to modern technique. Mor J Chem. 2023;11(4):979–1012. 10.48317/IMIST.PRSM/morjchem-v11i04.40229.Search in Google Scholar
[93] Li J, Goerlandt F, Li KW. Slip and fall incidents at work: A visual analytics analysis of the research domain. Int J Environ Res Public Health. 2019;16(24):4972–90. 10.3390%2Fijerph16244972.Search in Google Scholar
[94] Yang L, Chen Z, Liu T, Gong Z, Yu Y, Wang J. Global trends of solid waste research from 1997 to 2011 by using bibliometric analysis. Scientometrics. 2013;96(1):133–46. 10.1007/s11192-012-0911-6.Search in Google Scholar
[95] Liu X, Zhan FB, Hong S, Niu B, Liu Y. A bibliometric study of earthquake research: 1900–2010. Scientometrics. 2012;92(3):747–65. 10.1007/s11192-011-0599-z.Search in Google Scholar
[96] Gaitsch H, Franklin RJ, Reich DS. Cell-free DNA-based liquid biopsies in neurology. Brain. 2023;146(5):1758–74. 10.1093/brain/awac438.Search in Google Scholar
[97] Ingle RG, Zeng S, Jiang H, Fang W-J. Current developments of bioanalytical sample preparation techniques in pharmaceuticals. J Pharm Anal. 2022;12(4):517–29. 10.1016/j.jpha.2022.03.001.Search in Google Scholar
[98] Sheikh M, Qassem M, Triantis IF, Kyriacou PA. Advances in therapeutic monitoring of lithium in the management of bipolar disorder. Sensors. 2022;22(3):736–63. 10.3390/s22030736.Search in Google Scholar
© 2025 the author(s), published by De Gruyter
This work is licensed under the Creative Commons Attribution 4.0 International License.
Articles in the same Issue
- Research Articles
- Impressive stability-indicating RP-HPLC method for concurrent quantification of salbutamol, guaifenesin, and sodium benzoate in cough syrup: Application of six sigma and green metrics
- Bioanalytically validated potentiometric method for determination of bisphenol A: Application to baby bibs, pacifiers, and Teethers’ saliva samples
- Environmental impact of RP-HPLC strategy for detection of selected antibiotics residues in wastewater: Evaluating of quality tools
- Trace-level impurity quantification in lead-cooled fast reactors using ICP-MS: Methodology and challenges
- Picogram-level detection of three ACE inhibitors via LC–MS/MS: Comparing BMP and UOSA54 derivatization methods
- Eco-friendly RP-HPLC method for concurrent estimation of a promising combination of methocarbamol and etoricoxib in rat plasma
- Development of a point-of-care testing sensor using polypyrrole/TiO2 molecular imprinting technology for cinchocaine determination
- Green and sustainable RP-UPLC and UV strategies for determination of metformin and dapagliflozin: Evaluation of environmental impact and whiteness
- Review Articles
- Determination of montelukast and non-sedating antihistamine combination in pharmaceutical dosage forms: A review
- Extraction approaches for the isolation of some POPs from lipid-based environmental and food matrices: A review
- A review of semiconductor photocatalyst characterization techniques
- Analytical determination techniques for lithium – A review
- Fourier transform infrared spectroscopy study of polymer/filler/ionic liquid composites