Panel Technical Efficiency of Korean Companies in the Energy Sector based on Digital Capabilities
-
Jong Woo Choi


Abstract
Digitalization is a crucial driver of enhanced energy system efficiency, facilitating the energy transition and offering a gateway for technology companies to enter the sector. This study, employing stochastic frontier analysis as the chosen methodology, investigates the efficiency challenges faced by companies venturing into the energy industry with a digital technology focus. Our empirical analysis reveals a positive correlation between higher total assets and increased research and development expenditures, signifying the vital importance of talent acquisition and securing R&D funding. Additionally, it is noteworthy that smaller companies experienced a more pronounced negative impact of COVID-19 on their efficiency. These findings contribute to refining digitalization strategies in the energy industry, emphasizing the role of efficiency from a corporate perspective.
1 Introduction
In the Fourth Industrial Revolution era, various industries, including telecommunications, software, terminals, security, construction, and automobiles, are leveraging their digital capabilities to enter the energy industry (Park & Heo, 2020; Park & Kim, 2021). Herein, digital capabilities refer to the skills and technologies that enable companies to create, process, and analyze digital data, particularly in the context of enhancing operational efficiency and innovation. This includes expertise in areas such as artificial intelligence (AI), big data analytics, and the Internet of Things (IoT). Companies with digital capabilities are those organizations that possess or have developed these competencies, enabling them to leverage digital technologies for business processes, product development, and customer engagement. Furthermore, energy businesses based on digital technologies are defined as enterprises in the energy sector that integrate digital capabilities into their core operations, such as using AI for predictive maintenance in energy facilities, employing big data analytics for optimizing energy distribution, or utilizing IoT for real-time monitoring and control of energy systems.
This trend has led to the development of new products and services that utilize digital technologies for monitoring, diagnosing, controlling, and predicting energy production, delivery, and consumption processes. Companies with expertise in digital technology are venturing into the energy industry while existing energy companies are also focusing on strengthening their digital capabilities (Çelık et al., 2022a; Mihai et al., 2022; Park, 2022).
In particular, the electric power industry has experienced a rapid diversification of participating companies and industries due to the convergence of information and communications technology (ICT) and the entry of companies from other sectors. According to Park (2019), in Korea, the number of companies participating in the electric power industry that received media exposure increased from 4 in 1990 to 253 in 2018. Similarly, globally, the relationship between digital technology companies and established power industry companies has become increasingly close in recent years (Park, 2019). The oil and gas sector also employs digital technologies to enhance business productivity and safety (Al-Rbeawi, 2023; Areva, 2018; OGJ, 2018; Park, 2019; Sheveleva et al., 2021).
In the energy industry, there is a noticeable increase in the number of companies entering the sector based on their digital technology capabilities with these digitalization trends (Park & Heo, 2020; Park, 2019, 2022). However, there needs to be more systematic research exploring alternatives to enable companies participating in the energy industry to build ecosystems and drive innovation in the energy sector based on digital technologies. Policy press releases and media articles often highlight the need to respond to the development of Fourth Industrial Revolution technologies and promote the intelligence of the energy industry. However, there needs to be more detailed information regarding the development of new energy businesses based on digital technology (IEA, 2022).
Existing studies related to new energy businesses based on digital technology generally focus on analyzing changes in the energy industry landscape caused by the Fourth Industrial Revolution and examining the strategies adopted by energy business operators to adapt to these changes (Heymann et al., 2023; Trzaska et al., 2021). Some studies classify the types of new energy businesses and explore their characteristics (Burger & Luke, 2017; Loock, 2020; Park & Lee, 2021). Others examine the industries to which newly entering companies in the energy sector belong in terms of the energy industry value chain and investigate the evolving relationships between the energy industry and other sectors (Park & Heo, 2020; Park, 2019).
Indeed, existing studies have made valuable contributions by exploring strategies for existing energy businesses, analyzing new business types, and investigating changes in industry relationships related to new energy businesses. However, there is still a gap in understanding alternatives aimed at enhancing the efficiency of companies participating in the energy industry based on digital technologies and driving innovation in the energy sector. This aspect has received relatively less attention in previous research. Efficiency analysis studies of companies positioning renewable energy as a driving force in the process of energy transitions have been consistently published (Lu et al., 2022; Wang et al., 2016; Zeng et al., 2018). However, amid the ongoing substantial digitalization as a crucial aspect of energy transitions, it is challenging to find cases of efficiency analysis studies focusing on digital technology-based companies operating in the energy industry sector. While general efficiency analyses of digital technology-based companies are being conducted from various perspectives (Chung et al., 2022; Park et al., 2022b; Qiao, 2023), it is challenging to find specific efficiency research cases targeting companies with digital technology capabilities that have entered the energy sector.
By analyzing the efficiency of companies entering the energy industry based on digital technological capabilities, it is crucial to diagnose the challenges these companies face and make efforts to minimize inefficiencies. In particular, understanding the difficulties of companies entering the energy industry from an efficiency perspective is essential for optimizing resource allocation to pursue continuous innovation in the energy industry (Li & Xie, 2022; Wang & Wu, 2022). Such research can contribute to exploring alternatives that promote the energy industry’s digitalization and related industries’ growth.
This study aims to bridge the research gap by analyzing the efficiency of digital capabilities-based companies entering the energy industry, with a particular focus on the Korean context. It seeks to identify and address the challenges these companies face, providing actionable alternatives to support their growth and, by extension, accelerate the digitalization of the energy sector. By leveraging the unique case of Korea, where national strategies and policy initiatives are actively forming clusters to enhance digitalization in the energy sector and stimulate new industries, this research intends to contribute a valuable knowledge base for promoting digital transformation and innovation within the energy industry. This approach not only aims to explore alternatives that can promote the digitalization of the energy industry and the growth of related industries but also to analyze the panel technical efficiency (TE) of companies pursuing energy businesses based on digital technological capabilities in a landscape where such research is notably lacking.
2 Literature Review
2.1 Digitalization of the Energy Industry and New Entrants
Digital technology, which is based on data, analysis, and connectivity (Midttun & Piccini, 2017), contributes to the advancement of digitalization across all industrial sectors through the reduction of data storage costs, the development of AI and machine learning, and the improvement of fast and economical data transmission and connectivity.
The energy sector is no exception to this trend. Digitalization provides opportunities to increase the efficiency of energy systems by reducing losses related to energy production and consumption, promoting the use of distributed resources, and decreasing investment costs for energy infrastructure (Anastasovski, 2023; Park, 2022). Energy consumers can enhance the efficiency of their energy usage patterns through data collection and analysis using digital technology, while real-time information analysis and predictive maintenance can help reduce unnecessary losses in the energy production and delivery sectors (Midttun & Piccini, 2017; Xue et al., 2022). Additionally, digital technology promotes the expansion of various distributed resources such as demand management, energy storage, and renewable energy resources (Du et al., 2023; Körner et al., 2022). It enables power system planning that considers the integration of demand management resources and energy storage systems and facilitates the stable operation of renewable energy resources with high intermittency of output within energy systems (Asensio et al., 2016; Tahir et al., 2019). Moreover, digitalization is considered an essential tool for improving the efficiency and sustainability of energy infrastructures. Various studies have shown that optimizing energy infrastructure through digitalization can reduce investment costs, enhance the efficiency of energy systems, and achieve cost savings and carbon emission reductions (Beck et al., 2022; Jimenez, 2018; Mazina et al., 2022; Sadiq et al., 2021).
The digitalization of the energy sector is expanding the opportunities for companies with digital technology capabilities to enter the energy industry. Established telecommunications, home appliances, software, and e-commerce companies that did not previously engage in energy businesses are actively expanding into the energy sector based on their technological capabilities (Park & Heo, 2020). Furthermore, the entry of new startups into the energy sector is also continuing. Notably, these startups are expanding the as-a-service model based on digital technology, and the value chains of the energy industry are evolving into various services and platforms as the scope of servitization increases (Park, 2022).
However, companies pursuing energy businesses based on digital technology face several challenges. While the number of companies entering the energy business is increasing due to digitalization, the energy transition trend, and public policies to foster new energy industries, the inherently conservative nature of the energy industry makes it difficult for new entrants to collaborate with or expand their businesses with incumbent companies (Gitelman et al., 2019; Park & Heo, 2020). Energy companies are adopting strategies to expand their digital technology capabilities, which may result in competition with new entrants in the energy industry (Park, 2022). In addition, startups entering the energy industry with small initial entry costs centered on digital technology often need more capital and workforce (Rikkonen et al., 2019; Vinodrai, 2016). Small-scale companies with limited capital and workforce may need help in maintaining stable business operations amidst uncertain economic environments.
Countries worldwide are accelerating energy transitions while simultaneously pursuing the growth of new energy industries. Governments support innovation and startups in the energy sector to achieve energy and climate targets, regional economic prosperity, and capture market opportunities for sustainable energy transitions. Notably, during the COVID-19 pandemic, clean energy entrepreneurship has emerged as an opportunity for economic recovery (IEA, 2022). On the other hand, the outbreak of the COVID-19 pandemic led to a reduction in electricity demand (Werth et al., 2021), and the energy sector’s pursuit of new projects was also impacted by the cancellation of previously planned investments (Çelik et al., 2022b; Li et al., 2022). In particular, smaller and decentralized energy projects were found to be more adversely affected by COVID-19 (IEA, 2020). Furthermore, awareness of the various pathways for new technologies to enter the market in the energy sector remains low, and investors and incubators lack knowledge about energy technologies, policies, and regulatory details. Therefore, more in-depth exploration of alternatives to facilitate the growth of new entrants in the energy industry is needed (IEA, 2022; Pilloni et al., 2022).
2.2 Efficiency Analysis in the Energy Sector
Efficiency analysis is actively conducted in the energy and environment fields (Zhou et al., 2008). In the energy field, research often focuses on analyzing energy efficiency at the national or regional level (Chien & Hu, 2007; Honma & Hu, 2008; Hu et al., 2006) or examining corporate efficiency within specific energy sectors (Barros & Peypoch, 2007, 2008; Barros, 2008; Bazargan et al., 2023a; Nakano & Managi, 2008), as well as analyzing the efficiency of energy resources and technologies themselves (San Cristóbal, 2011).
Honma and Hu (2008) conducted a study analyzing three input factors (labor employment, private and public capital stock) and one output factor gross domestic product (GDP) for 47 prefectures in Japan from 1993 to 2003. Similarly, Hu et al. (2006) examined energy efficiency in China. Chien and Hu (2007) analyzed the TE of renewable energy across 45 countries, classifying them into OECD member countries and non-member countries. Their study considered labor, capital stock, and energy consumption as input factors for efficiency analysis, and GDP as the sole output factor.
Barros and Peypoch (2007, 2008) compared the efficiency of hydroelectric and thermoelectric power generation companies in Portugal, while Nakano and Managi (2008) analyzed the efficiency of nine thermal power generation companies in Japan. In contrast, San Cristóbal (2011) examined the efficiency of 13 renewable energy technologies, including wind, hydro, solar, and biomass, using traditional Data Envelopment Analysis (DEA) and Multiple Criteria Data Envelope Analysis.
Sueyoshi and Goto (2011) analyzed the efficiency of Japanese thermal power generation companies, considering factors such as number of employees and power generation facilities as inputs and greenhouse gas emissions and power generation as outputs. Halkos and Tzeremes (2012) compared and analyzed the efficiency of Chinese coal mining companies with their American counterparts, utilizing total assets and number of employees as input factors and operating profit and earnings per share as output factors. In studies focusing on specific countries or regions, GDP is commonly used as an output factor in regional efficiency analysis.
Efficiency analysis in the field of new and renewable energy has targeted various entities such as countries, products, and specific energy sources. Chien and Hu (2007) examined the impact of the share of renewable energy generation on TE across 45 countries. They used labor, capital stock, and energy consumption as input factors and GDP as the output factor. The results showed that higher shares of renewable energy were associated with higher TE.
Ergu et al. (2013) analyzed the performance of solar cell products using a combination of efficiency analysis and the Analytical Hierarchy Process. They considered production cost, production time, input personnel, and repair cost as input factors, and product production rate, sales, and operating profit as output factors. Their analysis aimed to evaluate the excellence of 39 solar cell products.
Bazargan et al. (2023b) scrutinized the efficiency of supply chain management within a petrochemical company employing Network DEA. Notably, Network DEA offers the distinct advantage of deriving varying efficiencies in response to changes in the internal structure of a business entity (Rasi Nojehdehi et al., 2023). To gather internal information, encompassing transmission areas, oil refining processes, etc., of petrochemical companies, the researchers conducted an extensive literature review and engaged in expert interviews. Subsequently, they analyzed the supply chain efficiency of 20 petrochemical companies spanning the years 2016‒2019, aiming to formulate strategies that could enhance the efficiency of oil supply. Furthermore, when internal company data are available, several studies have endeavored to assess management efficiency using DEA methodologies, such as Fuzzy DEA and DEA Slacks-Based-Measure (Muniz et al., 2022; Ucal Sari & Ak, 2022; Zhang et al., 2023).
San Cristóbal (2011) compared the efficiency of 13 renewable energy technologies included in the Spanish government’s renewable energy plan. These technologies included wind, hydro, solar, biomass, and biofuels. The analysis was conducted by classifying the target technologies based on the size of the renewable energy facility. For example, wind power was categorized into three groups: 5 MW or less, 5 and 10 MW, and 10 and 50 MW.
Efficiency analysis has also been applied to evaluate the relative efficiency of new and renewable energy R&D projects using performance data accumulated over 5 years (Woo, 2019). The study found that most R&D projects exhibited relatively low efficiency, particularly in the case of hydrogen fuel cell projects where efficiency was remarkably low. The scale factor was identified as a significant contributor to such low efficiency. Choi et al. (2014) analyzed the appropriateness of investment scale and the causes of inefficiency in energy technology development projects using the DEA analysis method. They discovered that energy resource circulation projects exhibited excellent relative efficiency compared to investment, while most projects demonstrated diseconomies of scale except for energy resource projects.
Although the studies above on efficiency analysis provided valuable insights into investment and performance within the energy sector, limitations in terms of data availability and input/output factors have restricted the depth of analysis. There is currently a limitation in finding efficiency analyses targeting energy companies based on digital technologies, which are continuously expanding. Digitalization across various industries is gaining momentum, and governments worldwide are accelerating energy transition and enhancing growth potential through digitalization. In this context, conducting efficiency analyses of companies based on digital technologies can offer essential foundational information to foster innovation in the energy industry through digitalization.
Furthermore, due to the absence of research analyzing the efficiency of energy companies based on digital technology capabilities, there is also a need for studies examining the efficiency of new entrants and startups entering the energy sector. Research on the efficiency of these new entrants and startups is critical as a knowledge foundation for the industry’s growth, and it has been consistently conducted in other sectors such as ICT (Chung et al., 2021; Chung et al., 2022), commerce (Liu et al., 2022; Zheng & Khan, 2021), food (Matricano et al., 2022), and insurance (De Ferrieres, 2020).
Research across various sectors including ICT, commerce, food, and insurance highlights the critical role of factors like funding sources, cluster types, and R&D investments, as well as digital transformation challenges, in determining the efficiency and growth of startups and new entrants.
Chung et al. (2022) find that ICT startups are most efficient when financed by chief executive officers and their families, with the study categorizing startups based on ownership and assessing their efficiency. In contrast, Chung et al. (2021) determine that government-led clusters are the most efficient for ICT startups, emphasizing the role of geographic location and cluster type in startup growth and efficiency. The former study highlights the importance of funding sources, while the latter focuses on the startups’ location and cluster environment.
Liu et al. (2022) and Zheng and Khan (2021) both focus on the efficiency analysis of startups in the commerce sector. Liu et al. (2022) explore how customer engagement enhances the operational efficiency of social commerce startups, specifically analyzing the impact of top management team gender diversity on the adoption of environmental standards. On the other hand, Zheng and Khan (2021) assess the operational efficiency and total factor productivity (TFP) of listed e-commerce firms in China using DEA and the Malmquist TFP index, highlighting technological progress and economies of scale as key factors for TFP improvement.
Matricano et al. (2022) examine the impact of innovation-related factors, such as R&D investments, on the performance of food industry start-ups in Italy, using stochastic frontier analysis (SFA) on 108 firms. Their findings highlight that only R&D investments significantly enhance start-up performance, indicating a shift in the traditionally supplier-dominated food industry towards innovation-driven growth.
De Ferrieres (2020) focuses on the digital transformation challenges within the insurance industry in Singapore, contrasting the dynamics between traditional incumbents and digital-first insurtechs. The study outlines the complex nature of the insurance sector that demands more than just digital expertise, emphasizing the barriers to entry such as regulation and the need for insurance-specific knowledge. It points out that while new digital entrants lack the necessary insurance experience, incumbents are slow to digitalize, primarily using innovation for defensive purposes. The conclusion suggests that incumbents need to become more agile and tech-savvy to accelerate their digital transformation.
However, due to the conservative and capital-intensive nature of the energy industry, coupled with limited entry by new entrants and startups, there exists a lack of active research focusing on their efficiency within the energy industry. Therefore, this study analyzing the efficiency of companies entering the energy industry based on digital technology aims to enhance its value.
3 Methodology
3.1 Data
The study utilized financial statements from companies involved in digital-related new energy businesses that participated in Korea’s Energy Valley project. Energy Valley is a project initiated in 2014 through collaboration between local governments and nearby regions, focusing on attracting companies, research institutes, and entities primarily in the energy-new industry sector to Gwangju-Jeonnam Joint Innovation City in South Korea. The goal of the project is to establish an industrial ecosystem.
As of 2022, 202 companies participated in this project and adopted the Fourth Industrial Revolution technologies such as AI, IoT, and big data as their vital technical strengths. For this study, financial statement information of these 202 companies was extracted from the NICE Credit Rating Information-operated Kis Line.
The focus of the study narrowed down to 112 companies out of the initial 202, for which comprehensive financial information spanning from 2018 to 2020 was available. In essence, this study delved into the collective landscape of these digital technology-based energy companies leveraging Fourth Industrial Revolution technologies in South Korea, with a specific emphasis on those with comprehensive data covering the specified timeframe.
The basic statistics for each variable by year are presented in Table 1. Upon examining the characteristics of each variable, average sales experienced an annual increase of approximately 0.32%. In 2020, average labor cost rose by 37.08% compared to the previous year, indicating a significant increase in the burden of labor costs. Promotional expenses also exhibited an average annual increase of 20.95%. Total assets of digital technology-based companies in the new energy business demonstrated an average annual growth rate of 25.62%, which can be interpreted as representing growth in the size of companies over time. Return on assets (ROA) experienced a decline in 2019, followed by subsequent recovery; however, the R&D ratio relative to total assets remained nearly constant over the course of three years.
Descriptive Statistics of Variables (unit: US dollar)
| Variables | Year | Mean | Standard deviation | Max | Min |
|---|---|---|---|---|---|
| Sales | 2020 | 8,611,391 | 13,393,119 | 256,580,312 | 69,017 |
| 2019 | 8,578,452 | 16,275,194 | 121,814,799 | 86,298 | |
| 2018 | 8,555,870 | 16,480,074 | 127,017,841 | 22,780 | |
| Labor cost | 2020 | 3,231,126 | 15,111,446 | 152,580,671 | 16,967 |
| 2019 | 2,357,388 | 11,384,836 | 121,875,392 | 19,200 | |
| 2018 | 2,325,989 | 10,248,342 | 100,348,770 | 11,321 | |
| Operating cost (OC) | 2020 | 1,844,561 | 6062146.8 | 50,563,000 | 12,528 |
| 2019 | 1,448,589 | 5435746.6 | 51,404,000 | 11,328 | |
| 2018 | 1,294,357 | 4746472.6 | 50,360,000 | 6,241 | |
| Promotional cost | 2020 | 434,079.3 | 2213273.6 | 17,825,000 | 1,022 |
| 2019 | 317,237.6 | 1754719.5 | 18,000,000 | 1,061 | |
| 2018 | 296,688.2 | 1,740,180 | 19,961,000 | 228 | |
| R&D | 2020 | 2,667,287 | 8254341.3 | 56,823,000 | 3,830 |
| 2019 | 2,153,782 | 7968575.1 | 65,782,000 | 1,900 | |
| 2018 | 2,289,974 | 9257719.9 | 74,511,000 | 1,900 | |
| R&D/Total asset | 2020 | 0.03 | 0.03 | 0.05 | 0.02 |
| 2019 | 0.03 | 0.06 | 0.09 | 0.02 | |
| 2018 | 0.04 | 0.05 | 0.07 | 0.02 | |
| ROA | 2020 | 3.81 | 15.1217 | 19.47 | −47.99 |
| 2019 | 0.85 | 22.7854 | 26.75 | −52.87 | |
| 2018 | 1.43 | 28.1921 | 29.58 | −48.51 | |
| Total asset | 2020 | 75,443,439 | 375,003,063 | 2,711,680,027 | 75,642 |
| 2019 | 58,063,041 | 326,013,746 | 2,885,629,975 | 10,529 | |
| 2018 | 47,803,178 | 271,500,822 | 2,296,267,977 | 18,927 |
R&D: Research and development, ROA: Return on assets.
3.2 TE Analysis
Frontier analysis, widely utilized as a method of measuring efficiency, offers a solution to the limitations of ratio analysis, the traditional method of analyzing cost-effectiveness through simple ratio comparisons (Kumbhakar & Lovell, 2003; Rasi Nojehdehi et al., 2023; Ucal Sari & Ak, 2022; Yoo, 2004). This style of analysis employs input and output factors to establish cost and production functions, enabling measurement of the relative efficiency of a decision-making unit (DMU). By benchmarking against the DMU with the best performance, frontier analysis is better suited for gauging efficiency than regression analysis, which relies on average values.
TE refers to the maximum output achieved by inputting production factors at a given technological level (Farrell, 1957). In other words, if the same amount of input fails to produce the maximum output, technical inefficiency exists. Efficiency measurement involves defining a frontier curve representing the line where the maximum output is achieved with given input factors and then assessing the deviation from this curve.
Frontier analysis encompasses two main methods: DEA and SFA. DEA is a non-parametric method, while SFA is a parametric method. When analyzing efficiency, DEA employs a deterministic model and does not differentiate between inefficiency and random fluctuation within the error term. As a result, efficiency may be overestimated. On the other hand, SFA assumes a distribution for the error term, allowing it to distinguish between inefficiency and random fluctuation (Koh, 2017; Reinhard et al., 2000).
SFA utilizes a cost function to separate random fluctuations and inefficiencies within the error term. The error term consists of a stochastic error term (V), representing random fluctuation, and an inefficiency term (U) (Kumbhakar & Lovell, 2003; Seo & Hwang, 2012). The inefficiency term typically assumes a positive (+) value and is often modeled using a semi-normal distribution, a truncated normal distribution, or a gamma distribution (Kuosmanen et al., 2013; Reinhard et al., 2000). This study employs SFA, which is considered a more accurate method than other efficiency measurement techniques.
In panel data, technical inefficiencies can vary over time. The technical inefficiency during period T can be expressed in SFA analysis using the following equation (Battese & Coelli, 1992, 1995).
where
The maximum likelihood estimation (MLE) method is employed to derive parameter estimates for both the stochastic frontier model and the technical inefficiency effects. TE, which represents TE, can be estimated using the following formula (Battese & Coelli, 1995).
As analyzed in the appendix, it was revealed that the time variable influences TE. Considering that efficiency may vary based on the distribution of
SFA production function estimation model
| Distribution of technical inefficiencies | |||
|---|---|---|---|
| Classification | Truncated normal distribution
|
Half normal distribution
|
|
| Time variability | Yes
|
Model 1 | Model 2 |
| No
|
Model 3 | Model 4 | |
The model presented in this article was employed to initially ascertain whether
3.3 Research Design
Specific input and output factors need to be determined to measure efficiency in the context of new energy businesses based on digital technology. In this study, the input factors considered were labor, capital, R&D, sales promotion, and general management expenses. The output factor was defined as the company’s sales. Additionally, the analysis distinguished between new companies entering the new energy business based on digital technology and existing companies.
The hypotheses underpinning this study’s analysis of energy company efficiency are as follows:
H1: Efficiency is anticipated to decrease with the entry of new companies leveraging digital technology.
H2: The efficiency is expected to increase proportionally with the expansion of total assets.
H3: Efficiency is predicted to decrease with a smaller scale of R&D.
To substantiate these hypotheses, efficiency will be initially computed using SFA, and regression equations will be employed to pinpoint the influential factors impacting efficiency.
Several variables were identified to assess their impact on the efficiency of new energy business companies based on digital technology. These variables included asset size, R&D expenses, new entrants, and ROA. The company’s total asset size was used to examine the influence of company size on efficiency. The study also analyzed how efficiency varies based on the size of R&D expenses and the ROA. Furthermore, a comparison was made between the efficiency of newly entered companies in the new energy sector based on digital technology and relatively established companies.
In the context of SFA, the study designates the dependent variable as sales, while identifying costs as independent variables. Specifically, this investigation draws inspiration from previous studies (Barros, 2008; Hu & Wang, 2006; Hu et al., 2006; Wanke et al., 2020), which have similarly employed labor cost, capital, and R&D costs as independent variables. Furthermore, to enhance the analysis of a company’s efficiency, emphasis is placed on configuring major cost variables as independent factors. To achieve this, the financial statements of the companies under consideration were obtained, and additional variables such as promotion expenses (PR) and administrative costs were incorporated as independent variables (Amornkitvikai & Harvie, 2011; Kallel et al., 2019 [Table 3]).
Variables references
| Variables | References |
|---|---|
| Sales | Amornkitvikai and Harvie (2011), Estache et al. (2004), Ge and Huang (2014), Habib and Ljungqvist (2005), Luo and Donthu (2005) |
| Labor cost (L) | Arocena and Waddams Price (2002), Farsi and Filippini (2004), Knittel (2002), Pollitt (1996), Raczka (2001), Sealey and Lindley (1977) |
| Capital (K) | Amornkitvikai and Harvie (2011), Barros (2008), Farsi and Filippini (2004), Ge and Huang (2014), Habib and Ljungqvist (2005), Hu et al. (2006), Knittel (2002), Pollitt (1996), Sealey and Lindley (1977), Wanke et al. (2020) |
| R&D cost | Fu and Yang (2009), Ge and Huang (2014), Habib and Ljungqvist (2005), Hancock (1991), Mastromarco and Ghosh (2009), Wang (2007), Wang and Wong (2012) |
| PR | Ge and Huang (2014), Habib and Ljungqvist (2005), Hancock (1991), Luo and Donthu (2005) |
| OC | Barros (2008), Hiebert (2002), Jamasb et al. (2004), Weill (2003) |
The regression equation, established with the aforementioned variables, is as follows.
where
4 Results
4.1 Efficiency Analysis Using Financial Statement Information
The efficiency analysis was conducted by collecting financial statement information separately for digital technology-based companies participating in the new energy field. The results of the SFA analysis are presented in Table 4. In all models, labor cost (L), capital (K), and R&D costs had a statistically significant positive impact on sales. Sales PR and general OC did not consistently affect sales, and their statistical significance was lower than that of other expenses. Particularly, R&D costs have a significant effect on the sales of new energy firms based on digital technology.
SFA results
| Variables | Model 1 | Model 2 | Model 3 | Model 4 |
|---|---|---|---|---|
| lnL | 0.281** | 0.271* | 0.252** | 0.283** |
| (3.055) | (3.662) | (2.911) | (3.922) | |
| lnK | 0.512*** | 0.482** | 0.557** | 0.455*** |
| (3.242) | (2.289) | (3.644) | (2.186) | |
| lnR&D | 0.614*** | 0.700*** | 0.688*** | 0.651*** |
| (2.888) | (3.512) | (3.611) | (3.422) | |
| lnPR | −0.129 | −0.271 | 0.062* | −0.062 |
| (−0.768) | (−0.108) | (0.036) | (0.128) | |
| lnOC | 0.090* | −0.065 | 0.058* | 0.078* |
| (0.178) | (−0.217) | (0.148) | (1.147) | |
|
|
0.108** | 1.727* | 0.099*** | 1.888** |
| (2.422) | (1.588) | (4.122) | (1.688) | |
|
|
0.912*** | 0.997*** | 0.919*** | 0.997*** |
| (28.224) | (338.56) | (71.44) | (372.28) | |
|
|
0.467 | n/a | 0.519* | n/a |
| (0.987) | (1.513) | |||
|
|
0.019* | 0.011* | n/a | n/a |
| (1.851) | (1.311) | |||
| Log Likelihood | 48.145 | 49.885 | 47.148 | 48.448 |
|
|
20.74*** | 152.88*** | 132.01*** | 142.68*** |
*p < 0.10, **p < 0.05, ***p < 0.01.
Parentheses: Z-score.
lnL: the natural logarithm-transformed value of labor cost, lnK: the natural logarithm-transformed value of capital, lnR&D: the natural logarithm-transformed value of R&D, lnPR: the natural logarithm-transformed value of sales promotion expenses, lnOC: the natural logarithm-transformed value of OC.
Moreover, a chi-square test was conducted to examine the hypothesis of the existence of technical inefficiency, and the results were statistically significant in Table 4, indicating the presence of technical inefficiency across all models. Furthermore, the estimated inefficiency term (lambda) was close to 1 and statistically significant in all models, indicating that the majority of errors in the efficiency analysis model could be attributed to technical inefficiency rather than stochastic errors. Moreover, in models 1 and 2, the estimated lambda value was positive and statistically significant at the 10% significance level, indicating increased TE over time.
To assess the adequacy of the assumed error term
Likelihood ratio test results
| Classifications | Model 1 | Model 2 | Model 3 | |||
|---|---|---|---|---|---|---|
|
|
p-value |
|
p-value |
|
p-value | |
| Model 2 | 12.18 | 0.000 | n/a | n/a | n/a | n/a |
| Model 3 | 2.28 | 0.049 | 10.27 | 0.000 | n/a | n/a |
| Model 4 | 12.00 | 0.000 | 0.218 | 0.542 | 11.88 | 0.002 |
Based on equation (6), the efficiency of each of the four models was estimated. Table 6 presents the efficiency of companies according to Models 1 and 2, considering time volatility. It can be observed that TE increased in 2019 compared to the previous year but then slightly decreased in 2020 compared to 2019. This can be attributed to a decrease in company sales due to the impact of the COVID-19 pandemic.
Mean efficiency of companies entering new energy businesses based on digital technology
| Year | 2018 | 2019 | 2020 | |
|---|---|---|---|---|
| Model 1 | 0.612 | 0.724 | 0.711 | |
| (0.2281) | (0.2152) | (0.2270) | ||
| Model 2 | 0.481 | 0.536 | 0.524 | |
| (0.3118) | (0.4122) | (0.3721) | ||
| Total assets | 0–25% | 0.382 | 0.411 | 0.388 |
| (0.1999) | (0.2155) | (0.2110) | ||
| 25–50% | 0.428 | 0.515 | 0.418 | |
| (0.3211) | (0.3002) | (0.3199) | ||
| 50–75% | 0.510 | 0.572 | 0.566 | |
| (0.3111) | (0.2987) | (0.3187) | ||
| 75%∼ | 0.537 | 0.580 | 0.571 | |
| (0.3448) | (0.3120) | (0.3008) | ||
| R&D | 0–25% | 0.399 | 0.410 | 0.397 |
| (0.2187) | (0.2002) | (0.2155) | ||
| 25–50% | 0.431 | 0.509 | 0.470 | |
| (0.1889) | (0.1188) | (0.1188) | ||
| 50–75% | 0.508 | 0.601 | 0.588 | |
| (0.3910) | (0.4228) | (0.3877) | ||
| 75%∼ | 0.542 | 0.600 | 0.603 | |
| (0.4244) | (0.4512) | (0.4188) | ||
| Business period | 0–3 years | 0.441 | 0.518 | 0.522 |
| (0.1885) | (0.1711) | (0.1999) | ||
| 3–7 years | 0.471 | 0.520 | 0.523 | |
| (0.4227) | (0.4322) | (0.4118) | ||
| 7 years∼ | 0.493 | 0.548 | 0.530 | |
| (0.3188) | (0.3455) | (0.3225) | ||
Parentheses are standard deviation.
Additionally, the efficiency of 112 companies in the new energy business based on digital technology was analyzed, taking into account their asset size, R&D costs, and status as new entrants. Initially, the efficiencies of 112 companies were analyzed by dividing total assets and R&D expenditure into quartiles. The analysis revealed a general trend whereby higher total assets and higher R&D expenditures corresponded to higher efficiency (Figure 1). These results align with hypotheses 2 and 3. Moreover, companies with smaller assets and lower R&D expenditures experienced significant decreases in corporate efficiency in 2020 compared to the previous year as shown in Figure 1. Conversely, companies with higher assets and R&D expenditures demonstrated increased efficiency in 2020 over the previous year. These findings indicate that the impact of COVID-19 is more prevailed for smaller companies. Furthermore, it was observed that higher R&D expenditures lead to more significant efficiency gains over time. This underscores the importance of R&D investment in enhancing corporate efficiency.
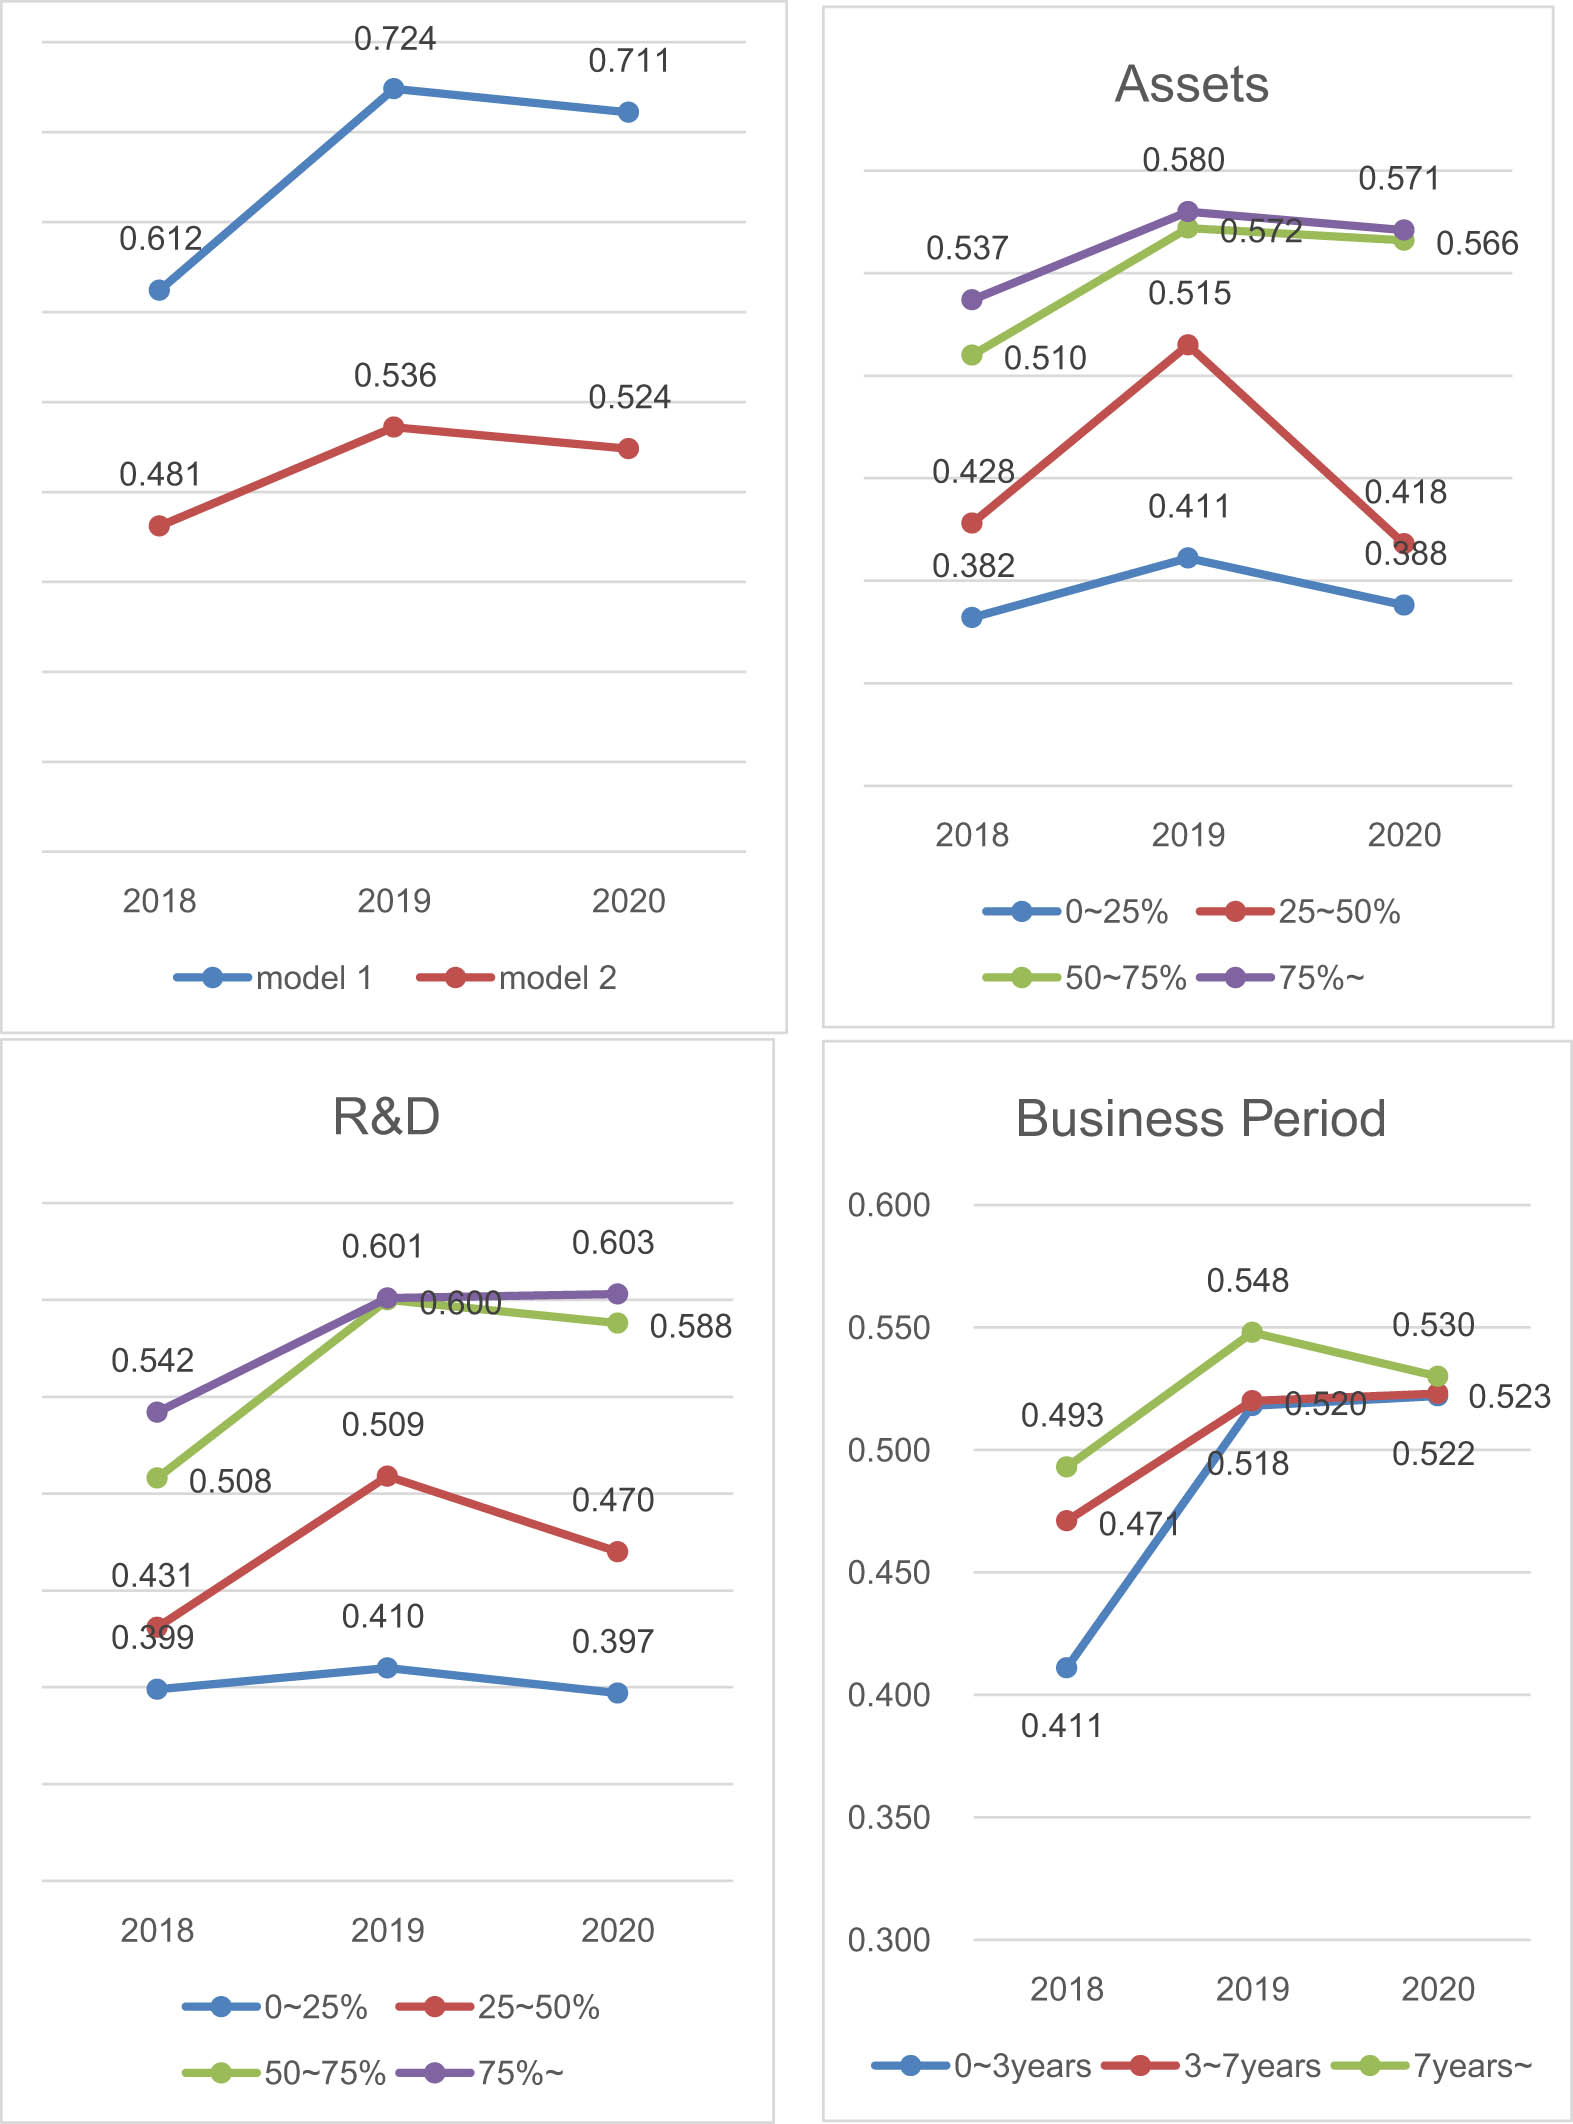
Mean efficiency of companies entering new energy businesses based on digital technology.
Finally, the efficiency of companies was analyzed by looking at the year they entered the new energy business based on digital technology. This analysis was conducted on companies active in the field for less than three years, between three and seven years, and more than seven years. The findings indicated that companies with more than seven years of experience in the market exhibited relatively high efficiency. This result substantiates Hypothesis 1. As a noteworthy point, it was observed that the efficiency of 2020 was analyzed to have increased compared to the previous year, particularly among companies with less than 7 years. This implies that despite the challenges posed by the COVID-19 pandemic, younger companies managed to enhance their efficiency while older companies experienced a decline. New companies responded well to the pandemic while existing companies struggled to adapt.
Based on the results above, the following regression equation was constructed to determine the factors influencing efficiency.
To analyze the factors influencing efficiency, this study employed Tobit regression since efficiency values are limited to a range between 0 and 1. The analysis utilized panel data for companies that entered the new energy sector based on digital technology, and this dataset was the same one used for the efficiency analysis. Panel regression analysis allows for division into a fixed and random-effects model. The fixed-effects model assumes that each company in the analysis has unique and fixed characteristics, while the random-effects model assumes that these characteristics are given probabilistically. Both fixed-effects and random-effects models were analyzed in this study.
Efficiency was analyzed assuming both a truncated normal distribution and a semi-normal distribution. The R-squared results indicated that model 3 was more suitable than model 1 when assuming a truncated normal distribution, while the difference between model 2 and model 4 was not substantial when assuming a semi-normal distribution. Since models 3 and 4 did not account for changes over time, the fixed-effects model was not applied in these cases. Therefore, in models 1 and 2, the Tobit, fixed-effects, and random-effects models were all considered, while the fixed-effects model was not used in models 3 and 4.
The results of the regression analysis are presented in Table 7. Depending on the assumption of the error term distribution,
Analysis results of efficiency determinants
| Variables | Model 1 | Model 2 | Model 3 | Model 4 | ||||||
|---|---|---|---|---|---|---|---|---|---|---|
| Tobit | Fixed | Random | Tobit | Fixed | Random | Tobit | Random | Tobit | Random | |
| Total assets | 0.111** | 0.015*** | 0.139*** | 0.088** | 0.009** | 0.102*** | 0.102*** | 0.121*** | 0.086** | 0.099*** |
| (2.285) | (2.248) | (4.115) | (2.201) | (1.991) | (3.001) | (2.005) | (3.817) | (2.122) | (2.992) | |
| R&D | 0.412*** | 0.301*** | 0.422*** | 0.381*** | 0.258*** | 0.389*** | 0.389*** | 0.397*** | 0.299*** | 0.388*** |
| (4.115) | (3.878) | (5.235) | (3.263) | (2.651) | (3.045) | (3.455) | (4.741) | (3.322) | (3.111) | |
| New entrants | −0.122** | −0.082* | −0.134* | −0.033** | −0.009* | −0.015* | −0.118** | −0.138** | −0.032** | −0.019** |
| (1.874) | (1.555) | (2.112) | (1.029) | (1.002) | (1.445) | (1.412) | (2.225) | (1.018) | (1.229) | |
| ROA | 0.012 | 0.009 | 0.013 | 0.002 | 0.001 | 0.002 | 0.009 | 0.011 | 0.002 | 0.002 |
| (0.025) | (0.009) | (0.059) | (0.003) | (0.002) | (0.005) | (0.014) | (0.038) | (0.002) | (0.004) | |
|
|
0.971 | 0.622 | 0.711 | 0.959 | 0.622 | 0.711 | 0.975 | 0.715 | 0.958 | 0.711 |
| F-value | Wald value | 27.225*** | 755.454*** | Wald value | 26.175*** | 13.458*** | Wald value | 688.258*** | Wald value | 359.455*** |
| 3,112*** | 1,982*** | 2,881*** | 1,999*** | |||||||
| Hausman test | n/a |
|
n/a |
|
||||||
*p < 0.10, **p < 0.05, ***p < 0.01. Parentheses: Z-score.
R&D: Research and Development; ROA: Return on Assets.
The regression coefficients changed for models 2 and 4, but the sign and statistical significance of the coefficients remained the same. This implies that total assets and R&D expenses positively influence the efficiency of digital technology-based new energy companies, while new entrants are negatively influencing. Additionally, in model 2, the Hausman test resulted in a value of
In summary, regardless of the
5 Discussion and Conclusions
This study aimed to evaluate the efficiency of domestic companies in the digital technology-based new energy sector. Efficiency was measured using financial statements from 112 energy companies over 3 years, and the factors affecting efficiency were analyzed.
The findings revealed that companies in the new energy business based on digital technology were inefficient when their R&D costs were low. R&D costs were identified as the most significant factor influencing company efficiency. Additionally, an analysis of efficiency determinants indicated that companies with low total assets generally were characterized by lower efficiency. Moreover, newly entered companies were less efficient than those already established their presence in the digital technology-based new energy sector. Enhancing the efficiency of small businesses thus emerged as a crucial challenge for promoting the digitalization of the energy industry.
The core digital technologies companies utilize, such as the IoT, AI, and big data, align with global trends. These technologies are harnessed to deliver value propositions centered on reducing energy costs and enhancing the stability of energy systems. This finding is consistent with the emphasis placed in the new energy sector on IT services, energy management, and efficiency improvement.
A noteworthy observation is that the companies surveyed have set a target of increasing their share of digital technology-based new energy business to 53% of their total sales within the next 5 years, to achieve a sales growth rate of 2.5 times higher than the current level (Park et al., 2022a). This outcome indicates a significant growth potential for businesses based on digital technology, with anticipated increases in sales from related sectors.
However, the business outlook could be more optimistic, as the operating profit margin of digital technology-based new energy businesses dropped from 27.0% in 2019 to −313.0% in 2020. This significant decline in operating margin in 2020 can be largely attributed to the adverse impact of the COVID-19 pandemic on the market. This study’s exploration of the COVID-19 pandemic’s impact offers a novel perspective on the resilience and adaptability required in the digital technology-based new energy sector. This study sheds light on the immediate effects of the pandemic. The COVID-19 pandemic has necessitated smaller companies in the energy digitalization sector to rapidly adapt to changing market conditions and accelerate their digital transformation. Embracing digital platforms for remote operations, customer engagement, and innovative marketing strategies has become crucial for navigating these unprecedented challenges. In this context, the resilience of companies in the face of COVID-19 suggests that policy measures should focus on supporting digital transformation and remote operational capabilities. This could involve subsidizing cloud-based solutions or providing training programs on digital tools for energy sector businesses, enabling them to adapt more effectively to the new market realities and maintain their competitive edge.
While COVID-19 may present a temporary challenge, other fundamental issues face these businesses, such as acquiring and retaining high-quality human resources, securing R&D funding, technology commercialization, and international market development. Successfully addressing these challenges will be crucial for the long-term success of these companies.
The efficiency analysis revealed that higher total assets and higher R&D expenditures were associated with higher efficiency. This finding aligns with the earlier survey results, indicating the importance of securing and retaining high-quality human resources and attracting R&D funds. In other words, companies with smaller asset sizes and limited investment in technology development tend to have lower efficiency, highlighting the pressing need for improvement in these areas.
R&D support for small- and medium-sized enterprises (SMEs) with limited R&D investment capacity has been found to have positive effects on their technical and financial performance, as well as promote technological innovation and growth. Several studies (Chang et al., 2019; Du et al., 2022) have highlighted the positive characteristics of R&D support in enhancing beneficiary companies’ performance and capabilities.
However, there are also limitations and criticisms associated with R&D support programs. These include challenges in identifying financially unstable companies during the selection process, the issue of overlapping benefits for specific companies, and a supplier-centered support approach that focuses on short-term, small-scale projects (Thoma & Zimmermann, 2020).
To enhance the effectiveness of R&D support, researchers propose several recommendations. These include establishing a comprehensive database containing information on participation in R&D projects, performance history, and company status of SMEs and researchers. This database would be utilized during the selection process for support recipients, aiming to prevent duplication of support efforts. Additionally, the establishment of an SME R&D graduation system has been proposed to ensure that supported SMEs can transition to a self-sustaining stage (Thoma & Zimmermann, 2020; Yi et al., 2020).
There are also calls for the government to transition from the application of the current direct financial support method to the adoption of an investment and loan-based means of R&D funding. This change would aim to provide SMEs with not only direct financial support but also investment opportunities and loans. In response to the pandemic, R&D support programs need to be more flexible and responsive, tailored to help SMEs pivot their business models and adapt technologies for pandemic-related applications, ensuring business continuity and resilience in the face of global health crises (Kulachinskaya et al., 2020). Government policies during pandemics should extend beyond traditional support, incorporating emergency funding measures, fast-tracked grant processes, and virtual networking opportunities to facilitate SMEs’ connection with investors and mentors in a socially distanced world.
Furthermore, diversification of support methods through tax incentives, innovation vouchers, and innovation procurement has been suggested (Cin et al., 2017; Yi et al., 2020). In terms of the diversification of support methods, it is also significant to promote opportunities for startups to utilize governmental laboratory equipment and lessen R&D costs. Obtaining laboratory equipment and securing office space represent two significant expenses that startup companies often need help to afford. For hardware product creators, having access to labs is vital from the initial testing phase through to prototyping and, eventually, product creation for showcasing and selling. Additionally, in tightly controlled industries like energy, it is frequently necessary to undergo certified tests to meet industry criteria, whether it is for equipment safety, integrating with the power grid, or adhering to fuel supply standards (IEA, 2022). Collaborations between startups and government partners in the energy sector can boost patenting and financing more than those with private firms or universities (Lab Partnering Service, 2023; Surana et al., 2020). Governments can also facilitate startups’ access to laboratories by primarily supporting incubators and accelerators that cater to clean energy technology innovators (CATAPULT Energy Systems, 2023; IEA, 2022). Also, the pandemic underscores the importance of digital platforms and online resources in startup support. Virtual incubators, webinars, and online mentorship programs have emerged as vital tools for startups, providing essential guidance and resources when traditional in-person interactions are constrained.
Securing access to expert guidance and professional advice is also imperative for startups. External knowledge holds significant value for nascent enterprises, especially when their founders lack substantial prior business acumen. For smaller entities, procuring such insights via consultancy can be economically burdensome or unfeasible without robust expert networks. From a corporate perspective, effectively bridging internal knowledge assets with external ones can render support in accessing external expertise highly beneficial for business growth (Grigoriou & Rothaermel, 2017; IEA, 2022). Management support can encompass activities like helping to establish a leadership team, refining investor presentations, designing a financial structure, recruiting team members, and formulating a business plan. Technical expertise assistance can help startups refine their technology in the product development phase or when deciding on materials and manufacturing techniques (Craig-Cooper & De Backer, 1993; IEA, 2022).
Companies engaged in new energy projects based on digital technology have identified attracting and retaining high-quality human resources and developing competitive technologies as crucial factors for their growth and success. This finding aligns with the results obtained from the financial statement efficiency analysis. Therefore, further research is needed to explore how R&D support can be effectively promoted from a policy perspective. While the specific needs of companies may vary, it is essential to design detailed policies that maximize the impact of R&D support within limited budgets. This includes evaluating technologies specific to new energy projects, selecting outstanding technology companies, and establishing a long-term support system.
This study utilized available panel data to analyze the business characteristics of companies, considering the limited data available on new entrants in the energy industry. The approach of this study in analyzing the TE of new entrants in digital technology-based energy businesses sets a new precedent in sector-specific research. This work addresses current gaps and paves the way for more in-depth, longitudinal studies to better understand the evolving dynamics of this critical sector. However, the analysis needed to adequately consider the temporal dynamics of various variables and the extended duration of the panel is requisite. To address this limitation, future research could explore the idea of undertaking panel analysis using a more extensive and more comprehensive dataset to capture the time-dependent relationships between variables. To further inform policy, future research should aim to understand the long-term effects of the support mechanisms on the sustainability and innovation capacity of new entrants in the energy sector. It will provide valuable insights for policymakers to refine and optimize R&D support strategies.
Acknowledgement
The authors thank the anonymous reviewers for their valuable comments and suggestions.
-
Funding information: This study was supported by the Korea Energy Economics Institute (Grant No. RP-21-10).
-
Author contributions: All authors accepted the responsibility for the content of the manuscript and consented to its submission, reviewed all the results, and approved the final version of the manuscript. CP and JWC conceived the research framework of this study and drafted and revised it.
-
Conflict of interest: Authors state no conflict of interest.
-
Data availability statement: The data that support the findings of this study are available from Korea Energy Economics Institute but restrictions apply to the availability of these data, which were used under license for the current study, and so are not publicly available. Data are however available from the authors upon reasonable request and with permission of Korea Energy Economics Institute.
-
Article note: As part of the open assessment, reviews and the original submission are available as supplementary files on our website.
Appendix
To investigate the temporal effects of
where
Firm age, business period, and time were applied as independent variables. Both equations (SFA equation and the appendix equation) account for both technical change and time-varying inefficiency effects. The results of the inefficiency frontier model for the above equation, analyzed using MLE, are as follows (Table A1):
Inefficiency frontier model results
| Variables | Uit |
|---|---|
| Firm age | 0.082*** |
| (4.812) | |
| Business period | −0.042* |
| (1.954) | |
| Time | −0.282*** |
| (5.228) | |
| Constant | 2.432* |
| (1.820) | |
|
|
0.990*** |
| (372.221) | |
| Log Likelihood | 31.875 |
*p < 0.10, **p < 0.05, ***p < 0.01. Parentheses: Z-score.
The coefficient for the firm Age variable is found to be positive, indicating that inefficiency increases with advancing age. Conversely, for business periods and time, the coefficient values are negative, suggesting that as the longevity of renewable energy firms increases, specifically those embracing new energy technologies early on, inefficiency decreases. Additionally, the proximity of
Finally, the results of the generalized likelihood ratio test are presented in the table above. As shown in the table, the first test rejects the null hypothesis that inefficiency effects are absent in the base model. The second test provides evidence supporting the idea that inefficiency effects are stochastic. Through the third test, it is established that inefficiency effects are not in a linear model. All tests are statistically significant at the 5% level of significance. This substantiates that the model in the article is temporally influenced and stochastic. The article will proceed to further explore panel analysis based on the distribution of
References
Aigner, D., Lovell, C. K., & Schmidt, P. (1977). Formulation and estimation of stochastic frontier production function models. Journal of Econometrics, 6(1), 21–37.10.1016/0304-4076(77)90052-5Search in Google Scholar
Al-Rbeawi, S. (2023). A review of modern approaches of digitalization in oil and gas industry, Upstream Oil and Gas Technology, 11, 100098.10.1016/j.upstre.2023.100098Search in Google Scholar
Amornkitvikai, Y., & Harvie, C. (2011). Finance, ownership, executive remuneration, and technical efficiency: A stochastic frontier analysis (SFA) of Thai listed manufacturing enterprises. Australasian Accounting, Business and Finance Journal, 5(1), 35–55.Search in Google Scholar
Anastasovski, A. (2023). What is needed for transformation of industrial parks into potential positive energy industrial parks? A review. Energy Policy, 173, 113400.10.1016/j.enpol.2022.113400Search in Google Scholar
Areva. (2018). Digitalisation in chemicals & petrochemicals. Paris: Areva.Search in Google Scholar
Arocena, P., & Waddams Price, C. W. (2002). Generating efficiency: Economic and environmental regulation of public and private electricity generators in Spain. International Journal of Industrial Organization, 20(1), 41–69.10.1016/S0167-7187(00)00073-4Search in Google Scholar
Asensio, M., De Quevedo, P. M., Muñoz-Delgado, G., & Contreras, J. (2016). Joint distribution network and renewable energy expansion planning considering demand response and energy storage – Part I: Stochastic programming model. IEEE Transactions on Smart Grid, 9(2), 655–666.10.1109/TSG.2016.2560339Search in Google Scholar
Barros, C. P. (2008). Efficiency analysis of hydroelectric generating plants: A case study for Portugal. Energy Economics, 30(1), 59–75.10.1016/j.eneco.2006.10.008Search in Google Scholar
Barros, C. P., & Peypoch, N. (2007). The determinants of cost efficiency of hydroelectric generating plants: A random frontier approach. Energy Policy, 35(9), 4463–4470.10.1016/j.enpol.2007.03.019Search in Google Scholar
Barros, C. P., & Peypoch, N. (2008). Technical efficiency of thermoelectric power plants. Energy Economics, 30(6), 3118–3127.10.1016/j.eneco.2008.04.007Search in Google Scholar
Battese, G. E., & Coelli, T. J. (1992). Frontier production functions, technical efficiency and panel data: with application to paddy farmers in India. Journal of productivity analysis, 3, 153–169.10.1007/BF00158774Search in Google Scholar
Battese, G., & T. Coelli. (1995). A model for technical inefficiency effects in a stochastic frontier production function for panel data. Empirical Economics, 20, 325–332.10.1007/BF01205442Search in Google Scholar
Bazargan, A., Najafi, S. E., Lotfi, F. H., Fallah, M., & Edalatpanah, S. A. (2023a). Presenting a productivity analysis model for Iran oil industries using Malmquist network analysis. Decision Making: Applications in Management and Engineering, 6(2), 251–292.10.31181/dmame622023705Search in Google Scholar
Bazargan, A. R., Najafi, S. E., Hosseinzadeh Lotfi, F., & Fallah, M. (2023b). Technical analysis of petrochemical industries of Iran using a network data envelopment analysis model. International Journal of Research in Industrial Engineering. 12(4), 337–363.Search in Google Scholar
Beck, A., Knöttner, S., Unterluggauer, J., Halmschlager, D., & Hofmann, R. (2022). An integrated optimization model for industrial energy system retrofit with process scheduling, heat recovery, and energy supply system synthesis. Processes, 10(3), 572.10.3390/pr10030572Search in Google Scholar
Burger, S. P., & Luke, M. (2017). Business models for distributed energy resources: A review and empirical analysis. Energy Policy, 109, 230–248.10.1016/j.enpol.2017.07.007Search in Google Scholar
CATAPULT Energy Systems. (2023, September 3). Accelerating zero carbon innovations by testing with real people in real UK homes. https://es.catapult.org.uk/tools-and-labs/living-lab/.Search in Google Scholar
Çelık, D., Meral, M. E., & Waseem, M. (2022a). A new area towards to digitalization of energy systems: Enables, challenges and solutions. In 2022 14th International Conference on Electronics, Computers and Artificial Intelligence (ECAI) (pp. 1–6). IEEE.10.1109/ECAI54874.2022.9847313Search in Google Scholar
Çelik, D., Meral, M. E., & Waseem, M. (2022b). Investigation and analysis of effective approaches, opportunities, bottlenecks and future potential capabilities for digitalization of energy systems and sustainable development goals. Electric Power Systems Research, 211, 108251.10.1016/j.epsr.2022.108251Search in Google Scholar
Chang, K., Zeng, Y., Wang, W., & Wu, X. (2019). The effects of credit policy and financial constraints on tangible and research & development investment: Firm-level evidence from China's renewable energy industry. Energy policy, 130, 438–447.10.1016/j.enpol.2019.04.005Search in Google Scholar
Chien, T., & Hu, J. L. (2007). Renewable energy and macroeconomic efficiency of OECD and non-OECD economies. Energy Policy, 35(7), 3606–3615.10.1016/j.enpol.2006.12.033Search in Google Scholar
Choi, G. B., Kim, M. J., Cho, I. K., Kim, E. S., & Heo, E. Y. (2014). Analysis of efficiency for domestic energy technology development programs using DEA technique. Innovation Studies, 9(2), 77–98.Search in Google Scholar
Chung, W. Y., Jo, Y., & Lee, D. (2021). Where should ICT startup companies be established? Efficiency comparison between cluster types. Telematics and Informatics, 56, 101482.10.1016/j.tele.2020.101482Search in Google Scholar
Chung, W. Y., Lee, J. G., Seo, J., Kim, J., Jo, Y., & Lee, D. (2022). From whom should ICT startups raise capital? The effect of ownership structure on efficiency in new ICT startups. International Review of Economics & Finance, 82, 82–91.10.1016/j.iref.2022.06.010Search in Google Scholar
Cin, B. C., Kim, Y. J., & Vonortas, N. S. (2017). The impact of public R&D subsidy on small firm productivity: Evidence from Korean SMEs. Small Business Economics, 48, 345–360.10.1007/s11187-016-9786-xSearch in Google Scholar
Coelli, T. J., Rao, D. S. P., O’Donnell, C. J., & Battese, G. E. (2005). An introduction to efficiency and productivity analysis. Springer Science & Business Media.Search in Google Scholar
Craig-Cooper, M., & De Backer, P. (1993). The management audit: How to create an effective management team. Maryland: Pitman Publishing.Search in Google Scholar
De Ferrieres, M. (2020). Understanding the difficulties of the insurance industry in innovating and transforming itself through digitalisation imposed by new entrants.Search in Google Scholar
Du, Y., Kim, P. H., Fourne, S. P., & Wang, X. (2022). In times of plenty: Slack resources, R&D investment, and entrepreneurial firms in challenging institutional environments. Journal of Business Research, 145, 360–376.10.1016/j.jbusres.2022.03.004Search in Google Scholar
Du, J., Shen, Z., Song, M., & Zhang, L. (2023). Nexus between digital transformation and energy technology innovation: An empirical test of A-share listed enterprises. Energy Economics, 120, 106572.10.1016/j.eneco.2023.106572Search in Google Scholar
Ergu, D., Kou, G., Peng, Y., Shi, Y., & Shi, Y. (2013). The analytic hierarchy process: Task scheduling and resource allocation in cloud computing environment. The Journal of Supercomputing, 64, 835–848.10.1007/s11227-011-0625-1Search in Google Scholar
Estache, A., Rossi, M., & Ruzzier, C.A. (2004). The case for international coordination of electricity regulation: Evidence fromthe measurement of efficiency in South America. Journal of Regulatory Economics, 25(3), 271–295.10.1023/B:REGE.0000017750.21982.36Search in Google Scholar
Farrell, M. J. (1957). The measurement of productive efficiency. Journal of the Royal Statistical Society, Series A (General), 120(3), 253–281.10.2307/2343100Search in Google Scholar
Farsi, M., & Filippini, M. (2004). Regulation and measuring cost-efficiency with panel data models: Application to electricity distribution utilities. Review of Industrial Organisation, 25, 1–19.10.1023/B:REIO.0000040474.83556.54Search in Google Scholar
Fu, X., & Yang, Q. G. (2009). Exploring the cross-country gap in patenting: A stochastic frontier approach. Research Policy, 38(7), 1203–1213.10.1016/j.respol.2009.05.005Search in Google Scholar
Ge, C., & Huang, K. W. (2014). Analyzing the economies of scale of software as a service software firms: A stochastic frontier approach. IEEE Transactions on Engineering Management, 61(4), 610–622.10.1109/TEM.2014.2359975Search in Google Scholar
Gitelman, L. D., Kozhevnikov, M. V., Starikov, E. M., & Rada, E. C. (2019). Scaling up the innovation process in the energy sector on the basis of technology entrepreneurship. WIT Transactions on Ecology and the Environment, 222, 1–12.10.2495/EQ180011Search in Google Scholar
Greene, W. H. (2008). The econometric approach to efficiency analysis. The Measurement of Productive Efficiency and Productivity Growth, 1(1), 92–250.10.1093/acprof:oso/9780195183528.003.0002Search in Google Scholar
Grigoriou, K., & Rothaermel, F. T. (2017). Organizing for knowledge generation: Internal knowledge networks and the contingent effect of external knowledge sourcing. Strategic Management Journal, 38(2), 395–414.10.1002/smj.2489Search in Google Scholar
Habib, M. A., & Ljungqvist, A. (2005). Firm value and managerial incentives: A stochastic frontier approach. The Journal of Business, 78(6), 2053–2094.10.1086/497040Search in Google Scholar
Halkos, G. E., & Tzeremes, N. G. (2012). Analyzing the Greek renewable energy sector: A Data Envelopment Analysis approach. Renewable and Sustainable Energy Reviews, 16(5), 2884–2893.10.1016/j.rser.2012.02.003Search in Google Scholar
Hancock, D. (1991). A theory of production for the financial firm (Vol. 4). Springer Science & Business Media.10.1007/978-94-011-3870-3Search in Google Scholar
Hasan, M. Z., Kamil, A. A., Mustafa, A., & Baten, M. A. (2012). A cobb douglas stochastic frontier model on measuring domestic bank efficiency in Malaysia. PLoS ONE, 7(8), e42215.10.1371/journal.pone.0042215Search in Google Scholar
Heymann, F., Milojevic, T., Covatariu, A., & Verma, P. (2023). Digitalization in decarbonizing electricity systems–Phenomena, regional aspects, stakeholders, use cases, challenges and policy options. Energy, 262, 125521.10.1016/j.energy.2022.125521Search in Google Scholar
Hiebert, D. (2002). The determinants of the cost efficiency of electric generating plants: A stochastic frontier approach. Southern Economic Journal, 68(4), 935–946.10.1002/j.2325-8012.2002.tb00467.xSearch in Google Scholar
Honma, S., & Hu, J. L. (2008). Total-factor energy efficiency of regions in Japan. Energy Policy, 36(2), 821–833.10.1016/j.enpol.2007.10.026Search in Google Scholar
Hu, J. L., & Wang, S. C. (2006). Total-factor energy efficiency of regions in China. Energy Policy, 34(17), 3206–3217.10.1016/j.enpol.2005.06.015Search in Google Scholar
Hu, J. L., Wang, S. C., & Yeh, F. Y. (2006). Total-factor water efficiency of regions in China. Resources Policy, 31(4), 217–230.10.1016/j.resourpol.2007.02.001Search in Google Scholar
IEA. (2020). Renewable Energy Market Update: Outlook for 2020 and 2021. Paris: International Energy Agency.Search in Google Scholar
IEA. (2022). How governments support clean energy start-ups. Paris: International Energy Agency.Search in Google Scholar
Jamasb, T., Nillesen, P., & Pollitt, M. (2004). Strategic behaviour under regulatory benchmarking. Energy Economics, 26, 825–843.10.1016/j.eneco.2004.04.029Search in Google Scholar
Jimenez, A. (2018). Chefornak Energy Configuration Options: Energy Infrastructure Optimization to Reduce Fuel Cost and Dependence in Chefornak, Alaska (No. NREL/TP-5000-70579). Golden, CO (United States): National Renewable Energy Lab (NREL).10.2172/1464921Search in Google Scholar
Kallel, H., Ben Hamad, S., & Triki, M. (2019). Modeling the efficiency of Tunisian and Moroccan banks using the SFA approach. International Journal of Productivity and Performance Management, 68(5), 879–902.10.1108/IJPPM-03-2018-0099Search in Google Scholar
Knittel, C. R. (2002). Alternative regulatory methods and firm efficiency: Stochastic frontier evidence the US electricityindustry. The Review of Economics and Statistics, 84(3), 530–540.10.1162/003465302320259529Search in Google Scholar
Koh, G. (2017). Efficiency analysis theory: Data envelopment analysis and stochastic frontier analysis. Munu, Gyeonggi.Search in Google Scholar
Körner, M. F., Sedlmeir, J., Weibelzahl, M., Fridgen, G., Heine, M., & Neumann, C. (2022). Systemic risks in electricity systems: A perspective on the potential of digital technologies. Energy Policy, 164, 112901.10.1016/j.enpol.2022.112901Search in Google Scholar
Kulachinskaya, A., Akhmetova, I. G., Kulkova, V. Y., & Ilyashenko, S. B. (2020). The Challenge of the Energy Sector of Russia during the 2020 COVID-19 Pandemic through the Example of the Republic of Tatarstan: Discussion on the Change of Open Innovation in the Energy Sector. Journal of Open Innovation: Technology, Market, and Complexity, 6(3), 60.10.3390/joitmc6030060Search in Google Scholar
Kumbhakar, S. C. (1990). Production frontiers, panel data, and time-varying technical inefficiency. Journal of econometrics, 46(1–2), 201–211.10.1016/0304-4076(90)90055-XSearch in Google Scholar
Kumbhakar, S. C., & Lovell, C. K. (2003). Stochastic frontier analysis. Cambridge University Press.Search in Google Scholar
Kuosmanen, T., Saastamoinen, A., & Sipiläinen, T. (2013). What is the best practice for benchmark regulation of electricity distribution? Comparison of DEA, SFA and StoNED methods. Energy Policy, 61, 740–750.10.1016/j.enpol.2013.05.091Search in Google Scholar
Lab Partnering Service. (2023, September 2). Access to the Department of Energy’s Experts, Innovations, and Labs. https://labpartnering.org/.Search in Google Scholar
Li, P., & Xie, X. (2022). Measurement of innovation efficiency of new energy automobile companies in the context of digitalization. In Proceedings of the International Conference on Information Economy, Data Modeling and Cloud Computing, ICIDC 2022, 17–19 June 2022, Qingdao, China.10.4108/eai.17-6-2022.2322856Search in Google Scholar
Li, S., Wang, Q., Jiang, X. T., & Li, R. (2022). The negative impact of the COVID-19 on renewable energy growth in developing countries: Underestimated. Journal of Cleaner Production, 367, 132996.10.1016/j.jclepro.2022.132996Search in Google Scholar
Liu, Z., Han, S., Li, C., Gupta, S., & Sivarajah, U. (2022). Leveraging customer engagement to improve the operational efficiency of social commerce start-ups. Journal of Business Research, 140, 572–582.10.1016/j.jbusres.2021.11.024Search in Google Scholar
Loock, M. (2020). Unlocking the value of digitalization for the European energy transition: A typology of innovative business models. Energy Research & Social Science, 69, 101740.10.1016/j.erss.2020.101740Search in Google Scholar
Lu, S., Li, S., & Zhou, W. (2022). Does government subsidy stimulate or shackle new energy industry efficiency? Evidence from China. Environmental Science and Pollution Research, 29(23), 34776–34797.10.1007/s11356-021-18273-wSearch in Google Scholar
Luo, X., & Donthu, N. (2005). Assessing advertising media spending inefficiencies in generating sales. Journal of Business Research, 58(1), 28–36.10.1016/S0148-2963(03)00076-6Search in Google Scholar
Mastromarco, C., & Ghosh, S. (2009). Foreign capital, human capital, and efficiency: A stochastic frontier analysis for developing countries. World Development, 37(2), 489–502.10.1016/j.worlddev.2008.05.009Search in Google Scholar
Matricano, D., Candelo, E., & Sorrentino, M. (2022). Start-ups’ innovation processes and performance in the food industry: A stochastic frontier analysis. British Food Journal, 124(3), 936–950.10.1108/BFJ-10-2020-0944Search in Google Scholar
Mazina, A., Syzdykova, D., Myrzhykbayeva, A., Raikhanova, G., & Nurgaliyeva, A. M. (2022). Impact of green fiscal policy on investment efficiency of renewable energy enterprises in Kazakhstan. International Journal of Energy Economics and Policy, 12(5), 491–497.10.32479/ijeep.13437Search in Google Scholar
Midttun, A., & Piccini, P. B. (2017). Facing the climate and digital challenge: European energy industry from boom to crisis and transformation. Energy Policy, 108, 330–343.10.1016/j.enpol.2017.05.046Search in Google Scholar
Mihai, F., Aleca, O. E., Stanciu, A., Gheorghe, M., & Stan, M. (2022). Digitalization – The engine of sustainability in the energy industry. Energies, 15(6), 2164.10.3390/en15062164Search in Google Scholar
Muniz, R. D. F., Andriola, W. B., Muniz, S. M., & Thomaz, A. C. F. (2022). The use of data envelopment analysis to estimate the educational efficiency of Brazilian schools. Journal of Applied Research on Industrial Engineering, 374–383.Search in Google Scholar
Nakano, M., & Managi, S. (2008). Regulatory reforms and productivity: An empirical analysis of the Japanese electricity industry. Energy Policy, 36(1), 201–209.10.1016/j.enpol.2007.09.003Search in Google Scholar
OGJ. (2018). Digital transformation: Powering the oil and gas industry. Oil & Gas Journal.Search in Google Scholar
Park, C. (2019). Transformation of the energy industry value chain due to the proliferation of intelligent technologies. Ulsan: Korea Energy Economics.Search in Google Scholar
Park, C. (2022). Expansion of servitization in the energy sector and its implications. Wiley Interdisciplinary Reviews: Energy and Environment, 11(4), e434.10.1002/wene.434Search in Google Scholar
Park, C., & Heo, W. (2020). Review of the changing electricity industry value chain in the ICT convergence era. Journal of Cleaner Production, 258, 120743.10.1016/j.jclepro.2020.120743Search in Google Scholar
Park, C., & Kim, M. (2021). Characteristics influencing digital technology choice in digitalization projects of energy industry. Rigas Tehniskas Universitates Zinatniskie Raksti, 25(1), 356–366.10.2478/rtuect-2021-0026Search in Google Scholar
Park, C., & Lee, D. (2021). Analysis on new types of electric power businesses using a morphological box. Energy & Environment, 32(1), 113–133.10.1177/0958305X20919413Search in Google Scholar
Park, C., Kim, M., Nam. Y., Jo, C., Choi, J., & Jeon, S. (2022a). Analysis of characteristics of companies entering the energy industry based on digital technology capabilities. Ulsan: Korea Energy Economics.Search in Google Scholar
Park, I., Lee, J., Nam, J., Jo, Y., & Lee, D. (2022b). Which networking strategy improves ICT startup companies’ technical efficiency?. Managerial and Decision Economics, 43(6), 2434–2443.10.1002/mde.3536Search in Google Scholar
Pilloni, M., Kádár, J., & Abu Hamed, T. (2022). The impact of COVID-19 on energy start-up companies: The use of global financial crisis (GFC) as a lesson for future recovery. Energies, 15(10), 3530.10.3390/en15103530Search in Google Scholar
Pollitt, M. G. (1996). Ownership and efficiency in nuclear power production. Oxford Economic Papers, 48(2), 342–360.10.1093/oxfordjournals.oep.a028572Search in Google Scholar
Qiao, G. (2023). Survival of the fittest: The long-run productivity analysis of the listed information technology companies in the US stock market. Economics, 17(1), 20220035.10.1515/econ-2022-0035Search in Google Scholar
Raczka, J. (2001). Explaining the performance of heat plants in Poland. Energy Economics, 23(4), 355–370.10.1016/S0140-9883(00)00076-1Search in Google Scholar
Rasi Nojehdehi, R., Bagherzadeh Valami, H., & Najafi, S. E. (2023). Classifications of linking activities based on their inefficiencies in Network DEA. International Journal of Research in Industrial Engineering, 12(2), 165–176.Search in Google Scholar
Reifschneider, D., & Stevenson, R. (1991). Systematic departures from the frontier: A framework for the analysis of firm inefficiency. International Economic Review, 32(3), 715–723.10.2307/2527115Search in Google Scholar
Reinhard, S., Lovell, C. K., & Thijssen, G. J. (2000). Environmental efficiency with multiple environmentally detrimental variables; estimated with SFA and DEA. European Journal of Operational Research,121(2), 287–303.10.1016/S0377-2217(99)00218-0Search in Google Scholar
Rikkonen, P., Tapio, P., & Rintamäki, H. (2019). Visions for small-scale renewable energy production on Finnish farms–A Delphi study on the opportunities for new business. Energy Policy, 129, 939–948.10.1016/j.enpol.2019.03.004Search in Google Scholar
Sadiq, M., Ali, S. W., Terriche, Y., Mutarraf, M. U., Hassan, M. A., Hamid, K., & Guerrero, J. M. (2021). Future greener seaports: A review of new infrastructure, challenges, and energy efficiency measures. IEEE Access, 9, 75568–75587.10.1109/ACCESS.2021.3081430Search in Google Scholar
San Cristóbal, J. R. (2011). A multi criteria data envelopment analysis model to evaluate the efficiency of the Renewable Energy technologies. Renewable Energy, 36(10), 2742–2746.10.1016/j.renene.2011.03.008Search in Google Scholar
Sealey, C., & Lindley, J. T. (1977). Inputs, outputs and a theory of production and cost at depositoryfinancial institution. Journal of Finance, 32(4), 1251–1266.10.1111/j.1540-6261.1977.tb03324.xSearch in Google Scholar
Seo, D. G., & Hwang, J. T. (2012). Stochastic frontier analysis for operational efficiency in life insurance. Journal of Insurance and Finance, 23(3), 3–32.Search in Google Scholar
Sheveleva, A., Tyaglov, S., & Khaiter, P. (2021). Digital transformation strategies of oil and gas companies: Preparing for the fourth industrial revolution. Digital strategies in a global market: Navigating the fourth industrial revolution (pp. 157–171). Zurich: Springer International Publishing.10.1007/978-3-030-58267-8_12Search in Google Scholar
Sickles, R. C., & Zelenyuk, V. (2019). Measurement of productivity and efficiency. Cambridge University Press.10.1017/9781139565981Search in Google Scholar
Stevenson, R. E. (1980). Likelihood functions for generalized stochastic frontier estimation. Journal of econometrics, 13(1), 57–66.10.1016/0304-4076(80)90042-1Search in Google Scholar
Sueyoshi, T., & Goto, M. (2011). Methodological comparison between two unified (operational and environmental) efficiency measurements for environmental assessment. European Journal of Operational Research, 210(3), 684–693.10.1016/j.ejor.2010.10.030Search in Google Scholar
Surana, K., Doblinger, C., & Anadon, L. (2020). Collaboration between start-ups and federal agencies: A surprising solution for energy innovation. Washington D.C.: Information Technology and Innovation Foundation.Search in Google Scholar
Tahir, M. F., Haoyong, C., Khan, A., Javed, M. S., Laraik, N. A., & Mehmood, K. (2019). Optimizing size of variable renewable energy sources by incorporating energy storage and demand response. IEEE Access, 7, 103115–103126.10.1109/ACCESS.2019.2929297Search in Google Scholar
Thoma, J., & Zimmermann, V. (2020). Interactive learning—The key to innovation in non-R&D-intensive SMEs? A cluster analysis approach. Journal of Small Business Management, 58(4), 747–776.10.1080/00472778.2019.1671702Search in Google Scholar
Trzaska, R., Sulich, A., Organa, M., Niemczyk, J., & Jasiński, B. (2021). Digitalization business strategies in energy sector: Solving problems with uncertainty under industry 4.0 conditions. Energies, 14(23), 7997.10.3390/en14237997Search in Google Scholar
Ucal Sari, I., & Ak, U. (2022). Machine efficiency measurement in industry 4.0 using fuzzy data envelopment analysis. Journal of Fuzzy Extension and Applications, 3(2), 177–191.Search in Google Scholar
Vinodrai, T. (2016). A city of two tales: Innovation, talent attraction and governance in Canada’s technology triangle. Growing urban economies: Innovation, creativity, and governance in 21st century Canadian city-regions. Toronto: University of Toronto Press.10.3138/9781442629455-012Search in Google Scholar
Wang, E. C. (2007). R&D efficiency and economic performance: A cross-country analysis using the stochastic frontier approach. Journal of Policy Modeling, 29(2), 345–360.10.1016/j.jpolmod.2006.12.005Search in Google Scholar
Wang, H., & Wu, Q. (2022). Co-operative research on financing ecological and efficiency of industrial – Evidence from China’s new energy industry. Mathematical Problems in Engineering, 2022, 1–8.10.1155/2022/3322937Search in Google Scholar
Wang, M., & Wong, M. S. (2012). International R&D transfer and technical efficiency: Evidence from panel study using stochastic frontier analysis. World Development, 40(10), 1982–1998.10.1016/j.worlddev.2012.05.001Search in Google Scholar
Wang, Q., Hang, Y., Sun, L., & Zhao, Z. (2016). Two-stage innovation efficiency of new energy enterprises in China: A non-radial DEA approach. Technological Forecasting and Social Change, 112, 254–261.10.1016/j.techfore.2016.04.019Search in Google Scholar
Wanke, P., Tsionas, M. G., Chen, Z., & Antunes, J. J. M. (2020). Dynamic network DEA and SFA models for accounting and financial indicators with an analysis of super-efficiency in stochastic frontiers: An efficiency comparison in OECD banking. International Review of Economics & Finance, 69, 456–468.10.1016/j.iref.2020.06.002Search in Google Scholar
Weill, L. (2003), Banking efficiency in transition economies: The role of foreign ownership. Economicsof Transition, 11(3), 569–592.10.1111/1468-0351.00155Search in Google Scholar
Werth, A., Gravino, P., & Prevedello, G. (2021). Impact analysis of COVID-19 responses on energy grid dynamics in Europe. Applied energy, 281, 116045.10.1016/j.apenergy.2020.116045Search in Google Scholar
Woo, C. (2019). A study on R&D efficiency of clean technology: Focused on new and renewable energy R&D projects. Journal of Korea Technology Innovation Society, 22(4), 690–708.10.35978/jktis.2019.08.22.4.690Search in Google Scholar
Xue, Y., Tang, C., Wu, H., Liu, J., & Hao, Y. (2022). The emerging driving force of energy consumption in China: Does digital economy development matter?. Energy Policy, 165, 112997.10.1016/j.enpol.2022.112997Search in Google Scholar
Yi, M., Wang, Y., Yan, M., Fu, L., & Zhang, Y. (2020). Government R&D subsidies, environmental regulations, and their effect on green innovation efficiency of manufacturing industry: Evidence from the Yangtze River economic belt of China. International Journal of Environmental Research and Public Health, 17(4), 1330.10.3390/ijerph17041330Search in Google Scholar
Yoo, G. (2004). Measurement and evaluation of efficiency in the public sector. Seoul: Dymbook.Search in Google Scholar
Zeng, S., Jiang, C., Ma, C., & Su, B. (2018). Investment efficiency of the new energy industry in China. Energy Economics, 70, 536–544.10.1016/j.eneco.2017.12.023Search in Google Scholar
Zhang, K., Xie, Y., Noorkhah, S. A., Imeni, M., & Das, S. K. (2023). Neutrosophic management evaluation of insurance companies by a hybrid TODIM-BSC method: A case study in private insurance companies. Management Decision, 61(2), 363–381.10.1108/MD-01-2022-0120Search in Google Scholar
Zheng, S., & Khan, R. (2021). Performance evaluation of e-commerce firms in China: Using three-stage data envelopment analysis and the Malmquist productivity index. Plos One, 16(8), e0255851.10.1371/journal.pone.0255851Search in Google Scholar
Zhou, P., Ang, B. W., & Poh, K. L. (2008). Measuring environmental performance under different environmental DEA technologies. Energy Economics, 30(1), 1–14.10.1016/j.eneco.2006.05.001Search in Google Scholar
© 2024 the author(s), published by De Gruyter
This work is licensed under the Creative Commons Attribution 4.0 International License.
Articles in the same Issue
- Regular Articles
- Political Turnover and Public Health Provision in Brazilian Municipalities
- Examining the Effects of Trade Liberalisation Using a Gravity Model Approach
- Operating Efficiency in the Capital-Intensive Semiconductor Industry: A Nonparametric Frontier Approach
- Does Health Insurance Boost Subjective Well-being? Examining the Link in China through a National Survey
- An Intelligent Approach for Predicting Stock Market Movements in Emerging Markets Using Optimized Technical Indicators and Neural Networks
- Analysis of the Effect of Digital Financial Inclusion in Promoting Inclusive Growth: Mechanism and Statistical Verification
- Effective Tax Rates and Firm Size under Turnover Tax: Evidence from a Natural Experiment on SMEs
- Re-investigating the Impact of Economic Growth, Energy Consumption, Financial Development, Institutional Quality, and Globalization on Environmental Degradation in OECD Countries
- A Compliance Return Method to Evaluate Different Approaches to Implementing Regulations: The Example of Food Hygiene Standards
- Panel Technical Efficiency of Korean Companies in the Energy Sector based on Digital Capabilities
- Time-varying Investment Dynamics in the USA
- Preferences, Institutions, and Policy Makers: The Case of the New Institutionalization of Science, Technology, and Innovation Governance in Colombia
- The Impact of Geographic Factors on Credit Risk: A Study of Chinese Commercial Banks
- The Heterogeneous Effect and Transmission Paths of Air Pollution on Housing Prices: Evidence from 30 Large- and Medium-Sized Cities in China
- Analysis of Demographic Variables Affecting Digital Citizenship in Turkey
- Green Finance, Environmental Regulations, and Green Technologies in China: Implications for Achieving Green Economic Recovery
- Coupled and Coordinated Development of Economic Growth and Green Sustainability in a Manufacturing Enterprise under the Context of Dual Carbon Goals: Carbon Peaking and Carbon Neutrality
- Revealing the New Nexus in Urban Unemployment Dynamics: The Relationship between Institutional Variables and Long-Term Unemployment in Colombia
- The Roles of the Terms of Trade and the Real Exchange Rate in the Current Account Balance
- Cleaner Production: Analysis of the Role and Path of Green Finance in Controlling Agricultural Nonpoint Source Pollution
- The Research on the Impact of Regional Trade Network Relationships on Value Chain Resilience in China’s Service Industry
- Social Support and Suicidal Ideation among Children of Cross-Border Married Couples
- Asymmetrical Monetary Relations and Involuntary Unemployment in a General Equilibrium Model
- Job Crafting among Airport Security: The Role of Organizational Support, Work Engagement and Social Courage
- Does the Adjustment of Industrial Structure Restrain the Income Gap between Urban and Rural Areas
- Optimizing Emergency Logistics Centre Locations: A Multi-Objective Robust Model
- Geopolitical Risks and Stock Market Volatility in the SAARC Region
- Trade Globalization, Overseas Investment, and Tax Revenue Growth in Sub-Saharan Africa
- Can Government Expenditure Improve the Efficiency of Institutional Elderly-Care Service? – Take Wuhan as an Example
- Media Tone and Earnings Management before the Earnings Announcement: Evidence from China
- Review Articles
- Economic Growth in the Age of Ubiquitous Threats: How Global Risks are Reshaping Growth Theory
- Efficiency Measurement in Healthcare: The Foundations, Variables, and Models – A Narrative Literature Review
- Rethinking the Theoretical Foundation of Economics I: The Multilevel Paradigm
- Financial Literacy as Part of Empowerment Education for Later Life: A Spectrum of Perspectives, Challenges and Implications for Individuals, Educators and Policymakers in the Modern Digital Economy
- Special Issue: Economic Implications of Management and Entrepreneurship - Part II
- Ethnic Entrepreneurship: A Qualitative Study on Entrepreneurial Tendency of Meskhetian Turks Living in the USA in the Context of the Interactive Model
- Bridging Brand Parity with Insights Regarding Consumer Behavior
- The Effect of Green Human Resources Management Practices on Corporate Sustainability from the Perspective of Employees
- Special Issue: Shapes of Performance Evaluation in Economics and Management Decision - Part II
- High-Quality Development of Sports Competition Performance Industry in Chengdu-Chongqing Region Based on Performance Evaluation Theory
- Analysis of Multi-Factor Dynamic Coupling and Government Intervention Level for Urbanization in China: Evidence from the Yangtze River Economic Belt
- The Impact of Environmental Regulation on Technological Innovation of Enterprises: Based on Empirical Evidences of the Implementation of Pollution Charges in China
- Environmental Social Responsibility, Local Environmental Protection Strategy, and Corporate Financial Performance – Empirical Evidence from Heavy Pollution Industry
- The Relationship Between Stock Performance and Money Supply Based on VAR Model in the Context of E-commerce
- A Novel Approach for the Assessment of Logistics Performance Index of EU Countries
- The Decision Behaviour Evaluation of Interrelationships among Personality, Transformational Leadership, Leadership Self-Efficacy, and Commitment for E-Commerce Administrative Managers
- Role of Cultural Factors on Entrepreneurship Across the Diverse Economic Stages: Insights from GEM and GLOBE Data
- Performance Evaluation of Economic Relocation Effect for Environmental Non-Governmental Organizations: Evidence from China
- Functional Analysis of English Carriers and Related Resources of Cultural Communication in Internet Media
- The Influences of Multi-Level Environmental Regulations on Firm Performance in China
- Exploring the Ethnic Cultural Integration Path of Immigrant Communities Based on Ethnic Inter-Embedding
- Analysis of a New Model of Economic Growth in Renewable Energy for Green Computing
- An Empirical Examination of Aging’s Ramifications on Large-scale Agriculture: China’s Perspective
- The Impact of Firm Digital Transformation on Environmental, Social, and Governance Performance: Evidence from China
- Accounting Comparability and Labor Productivity: Evidence from China’s A-Share Listed Firms
- An Empirical Study on the Impact of Tariff Reduction on China’s Textile Industry under the Background of RCEP
- Top Executives’ Overseas Background on Corporate Green Innovation Output: The Mediating Role of Risk Preference
- Neutrosophic Inventory Management: A Cost-Effective Approach
- Mechanism Analysis and Response of Digital Financial Inclusion to Labor Economy based on ANN and Contribution Analysis
- Asset Pricing and Portfolio Investment Management Using Machine Learning: Research Trend Analysis Using Scientometrics
- User-centric Smart City Services for People with Disabilities and the Elderly: A UN SDG Framework Approach
- Research on the Problems and Institutional Optimization Strategies of Rural Collective Economic Organization Governance
- The Impact of the Global Minimum Tax Reform on China and Its Countermeasures
- Sustainable Development of Low-Carbon Supply Chain Economy based on the Internet of Things and Environmental Responsibility
- Measurement of Higher Education Competitiveness Level and Regional Disparities in China from the Perspective of Sustainable Development
- Payment Clearing and Regional Economy Development Based on Panel Data of Sichuan Province
- Coordinated Regional Economic Development: A Study of the Relationship Between Regional Policies and Business Performance
- A Novel Perspective on Prioritizing Investment Projects under Future Uncertainty: Integrating Robustness Analysis with the Net Present Value Model
- Research on Measurement of Manufacturing Industry Chain Resilience Based on Index Contribution Model Driven by Digital Economy
- Special Issue: AEEFI 2023
- Portfolio Allocation, Risk Aversion, and Digital Literacy Among the European Elderly
- Exploring the Heterogeneous Impact of Trade Agreements on Trade: Depth Matters
- Import, Productivity, and Export Performances
- Government Expenditure, Education, and Productivity in the European Union: Effects on Economic Growth
- Replication Study
- Carbon Taxes and CO2 Emissions: A Replication of Andersson (American Economic Journal: Economic Policy, 2019)