
Effect of cyclic frequency on fracture mode transitions during corrosion fatigue cracking of an Al-Zn-Mg-Cu alloy
-
Meryl M. Hall
BS (Concord University, 1967) and MS (Michigan State University, 1969) in Physics. PhD in Materials Science and Engineering (Purdue University, 1974) Argonne National Laboratory 1974–1980. Retired from Bettis Atomic Power Laboratory 2008 Consulting civilian nuclear reactor industry and Office of Naval Research/Naval Air 2008–2014. Forty one years materials engineering, engineering management and consulting experience in US Fast Breeder Reactor Program, US Naval Nuclear Propulsion Program and Naval Air Systems Program. Expertise in LMFBR and PWR reactor core materials, PWR reactor plant and steam plant materials. Interests in modeling irradiation creep and swelling of fast reactor core materials, modeling PWR primary side stress corrosion cracking, stress corrosion cracking of high strength alloys used in ambient temperature aircraft applications and compatibility of reactor core and turbine plant materials in high temperature helium gas-cooled fast reactors. TP Hoar Award 2010. EDSM-Science Award 2014.


Abstract
There are complex issues remaining to be resolved before environment-assisted cracking models can be included in structural mechanics programs that are currently used to analyze mechanical fatigue crack growth. Considered here is the effect of cyclic frequency on fracture mode transitions that occur during corrosion fatigue of high-strength Al-Zn-Mg-Cu alloys. These alloys are used in civilian and military aircraft applications where they are exposed to detrimental aqueous saline environments. A previously developed “critical hydrogen at a critical distance” crack growth model is used to rationalize the observed transitions in crack-path fracture-modes, from intergranular (IG), to brittle transgranular (BTG), to ductile transgranular (DTG), as the alternating stress intensity factor and cyclic frequency increase beyond critical values. Corrosion fatigue crack growth rate data obtained on Al-Zn-Mg-Cu alloy 7017-T651 base metal and heat-affected “white zone” metal tested in aqueous NaCl solutions over a frequency range of 0.01–70 Hz are analyzed. For the white zone metal, dependence of the critical crack velocity on the critical frequency, at which the IG-BTG transition occurs, undergoes an abrupt reversal as the critical frequency increases above about 0.1 Hz. Mechanisms potentially responsible for this change in frequency dependency are discussed in the context of the critical hydrogen model. The transition from low to intermediate frequency behavior is speculated to be due to a change in the critical distance from microstructural control, for frequencies at or below 0.1 Hz, to control by the critical hydrogen criterion at higher frequencies. The low frequency behavior is discussed relative to the transition from static load stress corrosion cracking to low frequency corrosion fatigue, which occurs as cyclic frequency increases above zero.
1 Introduction
1.1 Available hydrogen embrittlement models
Environmental effects on fatigue crack growth are currently not included in commercial fracture mechanics based software such as NASGRO (Southwest Research Institute) and AFGROW (LexTech, Inc.), which are used to analyze mechanical fatigue crack growth and fracture of aircraft components. However, high-strength 7000-series aluminum alloys (Al-Zn-Mg-Cu) are used in civilian and military aircraft applications, where they are subject to accelerated fatigue cracking when exposed to aqueous saline environments.
Incorporation of environmental effects requires that the crack advance mechanism be identified and that models be developed. Gangloff (2003) summarized experimental data that support hydrogen embrittlement (HE)-induced cracking of 7000 series aluminum alloys as the crack advance mechanism and hydrogen diffusion as the rate-liming process for subcritical crack growth. A number of researchers (Gangloff, 2003; Gasem & Gangloff, 2000, 2001; Gingell & King, 1993, 1997; Green & Knott, 1989; Hall, 2014; Holroyd & Hardie, 1983; Kotsikos, Sutcliff, & Holroyd, 2000; Mason & Gangloff, 1994) have explored HE models that assume crack advance is rate limited by the time for hydrogen to diffuse a critical distance within the fracture process zone (FPZ), where the hydrogen reaches a critical concentration.
Gangloff (2003) summarized the functional form of these “critical hydrogen” models in a general expression for static-load constant-load stress corrosion cracking (SCC) velocity given by
where ξ is a function of the variables, DE is the effective hydrogen diffusivity, χcrit is the critical hydrogen diffusion distance, CLS (H atoms/lattice volume) is the near-surface diffusible (lattice) hydrogen concentration, and Ccrit is the critical lattice hydrogen concentration at χcrit when crack advance occurs.
Green and Knott (1989) developed a critical hydrogen model to rationalize corrosion fatigue crack growth rate data. They found that aluminium alloy 7475-T6 undergoes a transition in crack-path fracture-mode from brittle transgranular (BTG) to ductile transgranular (DTG) at a critical frequency fcrit. Their model development assumes rate control by hydrogen diffusion and predicts that, as a consequence, the critical fatigue crack growth rate, at which transition occurs, is inversely proportional to √fcrit and is a function of the ratio Ccrit/CLS. Their model equation is
In deriving their equation, Green and Knott followed the lead of Holroyd and Hardie (1983) by assuming that cracks advance by an incremental distance Δa at each load cycle and that the critical hydrogen diffusion distance is χcrit=(Δa/ΔNcrit)N, where N=1, and Δa/ΔNcrit is the per cycle crack advance increment when the crack advances. Green and Knott compare their data to their model and conclude that their model is consistent with hydrogen diffusion as the rate controlling process.
Aluminum alloy 7017-T651 base metal and heat-affected “white zone” metal also undergo transitions in fracture modes, from intergranular (IG) to BTG then DTG (Holroyd & Hardie, 1983; Kotsikos et al., 2000). Corrosion fatigue data obtained on these alloy conditions are analyzed here using the critical hydrogen model of crack advance developed below.
1.2 Issues for the application of HE models
There are issues with the use of Eqs. (1) and (2) that must be resolved before HE models of this type can be used as a basis for data analyses and inclusion of environmental effects in software programs used to predict fatigue crack growth. These issues include the following.
1.2.1 Limitations of continuum models
Bridging the gap between mechanistic understanding and engineering practice requires that mechanistic understanding, formulated at the dislocation, micro, and nano scales, ultimately must be expressible in the continuum variables and parameters that are accessible to the practicing engineer. The analyses performed here are based on principles of continuum mechanics and therefore are not able to address details of the interactions between crack tips and micron-sized microstructural features. However, considerations of processes that may occur at the microstructural level may be used to rationalize data trends revealed by the continuum analyses. An example of an effort underway to bridge the gap between mechanistic understanding and engineering practice is the computational modeling effort by Vashishta et al. (2008) to model environmental cracking (SCC) from molecular to continuum scales.
Over a length scale that extends from a fraction of a micron to tens of microns, which is the range of crack increments per cycle discussed here, metals display a strong size dependence when deformed non-uniformly into the plastic range (Hutchinson, 2000). Plastic behavior at this scale cannot be characterized by conventional plasticity theories because they incorporate no material length scale and predict no size effect. However, continuum theories of strain gradient plasticity are being developed in the literature in order to incorporate size dependence (Hutchinson, 2000).
Continuum expressions for the mechanical crack driving force are expressed in terms of the applied stress intensity factor K and Rice’s J integral. These are measures of the rate with which elastic energy stored in the linear elastic and elastic-plastic strain fields that lie beyond the FPZ may be released during crack advance. This continuum approach is valid, regardless of the processes taking place within the FPZ, so long as the zone of plasticity that surrounds the crack tip is small relative to the crack size and relevant specimen dimensions.
1.2.2 Effective diffusivity
The effective hydrogen diffusivity DE is not well known as it is difficult to measure due to the low solubility of hydrogen in aluminum and the presence of a large density of hydrogen traps in 7000-series aluminium alloys (Scully, Young, & Smith, 2000). Test results are quite variable due in part to the formation of surface oxides, which are difficult to avoid due to the high reactivity of aluminium (Scully et al., 2000). Moreover, within the FPZ of a propagating crack, hydrogen diffusion may potentially be affected by dynamic generation of dislocation and vacancy traps.
Smith and Scully (2000) conducted thermal desorption tests to identify the fraction of hydrogen occupying trap sites in hydrogen-charged AA 2090 (Al-2.15Li-2.56Cu-0.12Zr). They found that dynamic straining at room temperature while cathodically charging under reducing conditions increased the post-test hydrogen desorption rate associated with dislocations by a factor of about 7× for the peak-aged alloy condition with a modest effect (<2×) for the under-aged alloy. However, the total concentration of atomic hydrogen as a fraction of the total number of trap sites available was found to be only 3.8×10⁻⁶ atom fraction for charging of a pre-strained specimen at an applied potential of -1 Vsce (hydrogen fugacity of 2×10¹¹ atm).
This is significantly less than the hydrogen concentrations measured by Young and Scully (2003), who used nuclear reaction analysis to measure hydrogen concentration profiles at crack flanks near the tips of SCC cracks. They found hydrogen concentrations of 0.6–0.8 atom-fraction near the surface, just below the surface oxide, and as much as 0.3 atom-fraction and as far as 1 μm below the surface. This apparent hydrogen solubility is 11 orders of magnitude greater than what can be accounted for by saturation of interstitial and microstructural traps discussed by Smith and Scully. Young and Scully speculate that the apparent hydrogen solubility of this magnitude may be due to the trapping of hydrogen by corrosion-injected vacancies.
Birnbaum et al. (1997) electrochemically introduced very large concentrations of hydrogen in high purity aluminum and found that hydrogen was trapped at vacancies that entered with the hydrogen in a ratio of one hydrogen atom for each injected vacancy. They determined that the vacancies and hydrogen atoms formed Vac-H complexes having a binding energy of 46.1 kJ/mol and that clusters of these complexes formed platelets on the {111} slip planes, the presence of which may assist transgranular cracking by initiating micro-cracks ahead of the macro-crack tip. Lu et al., (2002) and Lu and Kaxiras (2005) conducted first-principle calculations for aluminum base metal that demonstrate that Vac-H clusters may form containing one or more H atoms (as many as 12), with a binding energy for the first H atom comparable to or greater than that of a dislocation in aluminum (~35 kJ/mol; Smith & Scully, 2000). Then, the competition between dislocations and vacancies for hydrogen may favor vacancies due to their large number density and potential trapping capacity. Kato, Iwakiri, and Morishita (2009) and Fukai (2003) conducted first-principle calculations that show that vacancy concentrations of 0.10–0.3 atom-fraction can be stabilized by hydrogen at 27°C (300 K) by forming Vac-H clusters. If this process is active for the introduction of hydrogen electrolytically, this could potentially account for the apparent hydrogen solubility approaching 1 atom fraction.
The relevance of this discussion to effective diffusivity is that, according to Lu and Kaxiras, the lattice mobility of H atoms in aluminum is not impeded by H trapping by mobile vacancies. Hydrogen mobility may be enhanced when greater than one H atom is trapped by a vacancy. Moreover, given that H atoms and vacancies are cogenerated, trapping of H by vacancies may be immediate. As the number of Vac-H clusters may be significantly greater than the number density of dislocation trapping sites, even under dynamic straining, Vac-H trapping is expected to be controlling so that dynamic generation of dislocations at a propagating crack tip is not expected to impede H mobility.
The formation of Vac-H clusters provides a rationale for the very large crack tip hydrogen concentrations reported by Young and Scully and resolves the problem of how a sufficiently high H concentration can be attained in order to embrittle Al alloys, for which the lattice hydrogen solubility is extremely low. Hydrogen permeation measurements, such as those of Huang, Nakajima, Nishikata, and Tsuru (2003), are needed on straining electrodes in environments typical of propagating crack tips in order to evaluate these possibilities.
1.2.3 Critical distance
Independent knowledge of χcrit for SCC and CF crack advance in a hydrogen producing environment has long been an issue for understanding and development of HE models. In modelling SCC using critical hydrogen models, it is customary to assume that the critical hydrogen concentration is attained at a fixed distance ahead of the propagating crack. Moody, Stoltz, and Perra (1985) and Hall, Symons, and Kerns (1992) showed that this fixed distance is the grain diameter for IG cracking of hydrogen pre-charged specimens of high-strength nickel base alloys. However, Page and Gerberich (1982) showed that this distance may be much smaller when hydrogen enters through the surface of a sharp notch. Based on an analysis of static-load hydrogen-environment SCC data obtained on a broad selection of high-strength alloys having hydrogen diffusivities over six orders of magnitude, Gangloff (2008) concluded that χcrit is <1 μm when hydrogen enters through the crack tip.
In modelling corrosion fatigue crack growth in the Paris regime, it is customary to assume per cycle crack advance and equate χcrit to the per cycle increment in crack length Δa/ΔN. Early modelling and data analyses (Holroyd and Hardie, Green and Knott, Gingell and King) assumed that χcrit is the hydrogen diffusion distance over which the crack tip concentration C exceeds a critical value Ccrit sufficient to sustain crack advance by a given fracture mode. Transitions in fracture mode occur when the hydrogen concentration at a distance Δa/ΔNcrit no longer exceeds the Ccrit necessary to sustain crack growth by that fracture mode. This assumption is adopted here with an additional condition that Ccrit is a function of the applied stress intensity factor Kmax.
It has been proposed [Gasem and Gangloff, Kotsikos, Sutcliffe and Holroyd (KSH)] that χcrit is equal to the distance to the location of maximum tensile and hydrostatic stresses ahead of the crack tip, which is at a distance of approximately 2 crack tip opening displacement (CTOD). However, Gasem and Gangloff pointed out that this assumption does not account for comparisons among the data obtained on alloys having different yield strengths. Gingell and King (1997) conjecture that hydrogen will be driven to regions of high hydrostatic stress ahead of the crack tip when discussing the effect of stress on diffusion; however, this plays no part in their model development and data analysis. In an earlier paper (Gingell & King, 1993), they compare measured critical values of Δa/ΔN to calculated CTODs and conclude that the critical condition for transition of crack path from IG to BTG is dependent on the per cycle hydrogen diffusion distance, not on the position of maximum stress. KSH (2000) equated the hydrogen diffusion distance
Another possibility is that χcrit may be a fixed distance established by microstructural features, such as the size of a grain (facet, subgrain) in the case of IG cracking, and the size and spacing of precipitates and dislocation band spacing in the case of TG cracking. Davidson and Lankford (1985) concluded that the relevant microstructural features influencing transgranular fatigue crack propagation in AA 7075-T651 are the intermetallic (IM) particles, which provide obstacles to dislocation movement and thereby limit slip distances. Lankford and Davidson (1983) performed detailed fractographic analyses of AA 7075-T651 to characterize striations found on fatigue surfaces formed in moist air and for ΔK below the Paris regime. They concluded that under these conditions, 1) fatigue crack growth is intermittent (not cycle-by-cycle), 2) crack growth is a two-step process of crack tip blunting followed by an increment of brittle crack advance, and 3) striation spacing corresponds to an increment in crack advance. The effect of the moist air environment is to reduce the level of crack blunting required to advance the crack. Davidson and Lankford’s results provide guidance for interpreting trends in the HH and KSH data.
1.2.4 Near-surface and critical hydrogen concentrations
There has been a lack of independent knowledge of the ratio Ccrit/CLS as both Ccrit and CLS are relatively inaccessible. When seeking to validate Eqs. (1) and (2) in the past, the ratio Ccrit/CLS has been treated as an adjustable parameter. Then, using arbitrarily chosen values of Ccrit/CLS and equations of the Eq. (1) type, measured values of SCC crack velocity da/dt can be used to obtain the ratio DE/χcrit. The results are then used either to obtain estimates of χcrit using the best available estimate of DE (Gangloff, 2003) or to obtain estimates of DE using assumptions regarding the magnitude of χcrit (Holroyd & Hardie, 1983). These approaches to validation are, of course, dependent upon assumptions for which there is much uncertainty.
More recently, Hall and Symons (2001) and Hall (2011, 2014) developed an expression that relates Ccrit/CLS to θcrit/θTS, where θcrit is the critical hydrogen occupancy of trap sites lying along a prospective fracture interface, and θTS is the hydrogen occupancy of near-surface hydrogen trap sites. In this expression, θTS acts as a proxy for the near-surface diffusible hydrogen θLS, which establishes the hydrogen gradient that drives diffusion within the FPZ. Hall and Symons (2001) developed a phenomenological interpolation expression for θcrit based on an analysis of HE data obtained by Symons (1999) on a hydrogen-charged high-strength Ni alloy that undergoes IG fracture
Where K is the applied stress intensity factor, Kc is the inert environment fracture toughness, and KH-crit is the lower-bound hydrogen-affected fracture toughness KH. This equation says that the critical interfacial hydrogen coverage decreases as the applied stress intensity factor increases, from a maximum of θcrit=1 when K=KH-crit, to a minimum of θcrit=0 when K=Kc. Assuming that during load cycling crack advance occurs at the maximum applied stress intensity factor, application of this equation to fatigue crack growth is accomplished by inserting K=Kmax.
Application of this equation to high-strength aluminum alloy fracture data has not been investigated and would be difficult to do so given the low solubility of matrix hydrogen and the overwhelming density of moderate to strong hydrogen traps. However, Hall (2012) showed that a similar interpolation equation can be developed based on the energetics of hydrogen-affected interface decohesion. Although Dadfarnia et al. (2008)’s development provides an interpolation expression for θcrit having a more fundamental basis, Eq. (3) is used here as the two equations are similar, having the same limiting values, but Eq. (3) better fits the data that were used to develop the equation. With this independent knowledge of θcrit, equations of types (1) and (2) can now be evaluated as functions of K (SCC) and Kmax (CF) once a value for θTS is established.
1.2.5 Occupancy of near-surface trap sites as a proxy for occupancy of near-surface normal interstitial lattice sites
Hydrogen occupancy of near-surface trap sites θTS was chosen as a proxy for the occupancy of normal interstitial sites θLS due to the difficulty in measuring interstitial hydrogen in aluminum and its alloys. However, measurement of the total (lattice plus trapped) hydrogen at a crack tip allows estimates of θLS by assuming the equilibrium trapping theory of Oriani (1970), which can be expressed as
Where KT=exp(ΔHB/RT), and ΔHB (a negative quantity) is the trap binding energy. Rearranging Oriani’s equation, θLS can be expressed as
This equation shows that θLS→1 as θTS→1, which, according the discussion above, appears to be a possibility if Vac-H clusters are formed at a surface where corrosion-injected vacancies and electrolytic hydrogen are being absorbed simultaneously.
2 Model development
2.1 Hydrogen embrittlement model
Hall (2011) developed a critical hydrogen SCC model based on the following assumptions:
Embrittlement occurs when hydrogen is diffusively segregated to and trapped at prospective fracture interfaces within the FPZ.
Cracks advance when hydrogen coverage of a fracture interface at a critical distance equals a critical value.
The critical hydrogen coverage is a decreasing function of increasing applied K.
Crack advance is rate limited by hydrogen diffusion.
Diffusible and trapped H are in thermodynamic equilibrium.
Cracks advance steadily and quasi-continuously.
In order to make model development tractable, macro-crack growth is treated as quasi-continuous for constant ΔK fatigue loading. This means that, although micro-crack growth may occur intermittently, individual transient corrosion events, which generate the rate-limiting hydrogen absorbed into the FPZ, may combine to establish steady values within the FPZ of a propagating macro-crack. Kolman and Scully (1999) showed experimentally that overlapping corrosion current transients due to sporadic intermittent events may sum to establish a condition of “quasi-continuous” activation of the crack tip, consistent with the steady-state, quasi-continuous crack propagation assumption.
The distribution of hydrogen within the FPZ can be predicted by adapting an expression derived by Atkinson (1971) for solute concentration ahead of a thin, plate-like precipitate growing by diffusion of solute atoms into the tip of the precipitate. Adapting Atkinson’s expression (Hall, 2014), the hydrogen concentration at a distance χ from the tip of a crack advancing steadily and quasi-continuously is given by
Where CL is the diffusible hydrogen concentration (H atoms per lattice volume) at χ, CLS is the diffusible hydrogen concentration near surface,
It is assumed that, due to creep relaxation of stress to a stress level equal to or perhaps greater than the nominal yield stress, there is no significant stress gradient within the FPZ. This assumption is considered to be acceptable for application to materials that undergo small-scale transient or steady-state creep confined to the FPZ. Polyanskii et al. (1990) obtained creep data for high-strength aluminum alloys tested in NaCl solutions. These data show that room temperature creep occurs at applied stresses greater than the yield stress, and that the yield strength increases with increasing creep strain. This means that the stresses within the FPZ will undergo transient relaxation to a stress at or above the original yield stress and may be weakly dependent on the crack velocity (Hall, 2008a). Then, the assumption of a relaxed, low stress gradient within the FPZ may be appropriate for applications to steady-state crack growth.
By assuming that sustained steady crack growth requires that the hydrogen concentration within the FPZ reach a critical value Ccrit at a critical diffusion distance χcrit, Eq. (6) can be inverted to obtain an equation for the crack velocity
This equation is a specific expression of the more general Eq. (1).
Further assumptions are that embrittlement occurs when H is diffusively segregated to and trapped at prospective fracture interfaces within the FPZ, and that trapped and diffusible hydrogen are in thermodynamic equilibrium. With these assumptions, Hall and Symons (2001) and Hall (2011), showed that Eq. (7) can be rewritten as
Due to a misreading of Atkinson’s manuscript, previous versions of this equation mistakenly included a factor of 4DE, Hall and Symons (2001) and Hall (2011, 2012).
This equation is adapted for modeling corrosion fatigue crack growth by noting that
In this equation, χcrit is considered to be the per cycle hydrogen diffusion distance, which occurs in an elapsed time Δt=1/f. These equations are implicit functions of the applied K (SCC) or Kmax (CF) through the dependence of θcrit on these variables (Eq. 3). They predict a crack growth threshold, that is,
When χcrit is a fixed dimension, independent of cyclic frequency, Δa/ΔN is inversely proportional to f, and Δa/Δt=f Δa/ΔN may be independent of f (Eq. 9), provided that the inverse error function factor is independent of f. When χcrit equals the per cycle increment in crack growth
When applied to critical conditions of Δa/ΔN and f for fracture mode transition, this equation is, within a factor of 2, equal to Green and Knott’s Eq. (2). Note that this equation predicts that the crack velocity Δa/Δtincreases in proportion to
An expression for the occupancy of near-surface hydrogen traps θTS can be obtained by rearranging Eq. (9) and substituting χcrit for Δa/ΔN
Note that, when θcrit is obtained using Eq. (3) and the experimentally determined values of Kmax, KH-crit, and Kc are used in the analysis, the only adjustable parameter in Eq. (11) is the effective hydrogen diffusion coefficient DE.
Eqs. (9–11) are general and can be used to model corrosion fatigue crack growth assuming crack growth by a critical hydrogen mechanism. An unstated assumption is that these equations apply to crack growth at constant ΔK. As discussed below, additional considerations are required in order to apply these equations to an analysis of fracture mode transitions, for which ΔKcrit is not constant but decreases with increasing fcrit.
2.2 Active surface area fraction
The above discussion assumes metal dissolution and hydrogen production occurs at an electrochemically activated metal surface. Surface activation occurs due to dynamic straining at the crack tip, which exposes new reactive metallic surfaces by the rupture of protective oxides, when they are present, and by exposure of emerging dislocations and slip lines (Despic, Raicheff, & Bockris, 1968; Haruyama & Asawa, 1973; Hoar & West, 1962; Raicheff, Damjanovic, & Bockris, 1967), with or without the presence of a protective surface oxide.
To account for the simultaneous effects of crack tip strain rate and repassivation rate on crack tip corrosion activity, Hall (2009) introduced the concept of an equivalent active surface area fraction. The concept is based on an assumption that the anodic current density of a partially activated surface ia can be expressed as a product of the current density of the fully activated surface
Active surface area fraction is used to greatly simplify the complex coupling of surface reaction with near-surface lattice concentration θLS, which can be expressed as
where k is the time-based repassivation rate constant, and γ is the strain-based surface activation rate constant. This equation can be applied to cyclic loading assuming that the magnitude of
2.3 Repassivation rate constants
An issue for this approach is how to establish the rate constants in Eq. (12). The strain-based activation rate constant has a value 0≤γ≤1. If it is assumed that all of the crack tip stretch goes to create additional active surface, γ=1. The time-based repassivation rate constant k is customarily obtained from transient current decay experiments in which bare metal is exposed suddenly to an environment thought to be representative of the crack tip chemistry (Al-3, Cl-, CrO4-2, pH) and electrochemistry (crack tip potential, which determines the hydrogen overpotential).
As discussed above, a preferred test method for obtaining the repassivation rate constant is to measure, as a function of constant applied strain rate, the transient and steady-state corrosion currents established on a straining electrode rather than the customary static electrode; see for example, Haruyama and Asawa (1973). Unfortunately, straining electrode tests of this kind have not been performed on 7000 series aluminum alloys, and there is limited knowledge regarding the environment at the tip of a propagating fatigue crack. There is a limited number of experiments in which crack tip chemistry and electrochemical potential have been determined. The experimental methods require specialized equipment and are costly in terms of time and resources to conduct. Moreover, application of experimental results has limitations as crack-tip chemistry may be dependent on crack tip opening, crack length, stress ratio, and cyclic frequency, greatly expanding the number of variables that can be characterized.
Turnbull (2001) has reviewed modelling of the chemistry and electrochemistry of crack tips and concludes that “crack chemistry modeling is at the stage where the primary uncertainty in prediction should be associated only with the paucity of data for the input parameters”. However, in their current state of development, these computational models are realistically useable only by specialists in electrochemistry having computational skills.
Having neither measurements nor calculations of crack tip chemistries for the HH and KSH alloys and environments, estimates for k must be obtained using the limited experimental measurements of crack tip chemistry, electrochemical potential, and repassivation rate data available on comparable 7000 series alloys. Cooper and Kelly (2007) experimentally characterized the Cl- concentration, pH, and electrochemical potential within the crack enclave of a propagating SCC crack formed in aluminum alloy 7050 in an aqueous solution of 0.05 m NaCl+0.5 m Na2CrO4, pH 9.2, with an applied stress intensity factor of 14 MP√m. During an incubation period of slow crack growth (da/dt≈6×10-10 m/s), they found the crack chemistry to be comparable to the bulk chemistry. However, after an incubation period of 4–50 h, the crack growth rate increased by a factor of 38 (da/dt≈2.3×10-8 m/s). The crack chemistry was quite different from the bulk: chloride increased by a factor of 6–8 (0.3 m–0.4 m CI-), pH decreased from 9.2 to 3, and the crack tip potential decreased to -0.85 Vsce while the applied (crack mouth) potential was -0.445 Vsce.
They found that microinjection at the crack tip of the bulk chemistry having the chromate inhibitor (0.5 m Na2CrO4, pH 9.2) decreased the crack velocity by 90%. However, injection of an aggressive low pH crack tip chemistry having an inhibitor (0.2 m AlCl3+1 m Cr6+ as CrO3+Na2CrO4, pH 3.1) prior to natural transition from slow to fast crack growth resulted in immediate (~10 min) rate increase, by a factor of 65, to the fast crack growth rate. These results show that chromates may not inhibit crack growth when a low-potential, acidic, crack tip chemistry is established. Gasem and Gangloff (2001) report that low concentrations of chromate inhibitor did not inhibit crack growth when the bulk NaCl solution was acidified. Gasem and Gangloff and Warner and Gangloff (2012) discuss the effect that cyclic frequency (CTSR) may have on destabilization of inhibiting films, noting that there are critical CTSRs above which inhibitors are ineffective.
The environment within a corrosion fatigue crack may not be as aggressive as that determined for an SCC crack. Combining modeling and experimental data, Cooper and Kelly (2001) conclude that crack potential distributions are strongly dependent on size of the crack tip opening and the thickness of resistive salt-films that are presumed to form at the crack tip. The IG SCC cracks in the 7000 series aluminum alloys are very sharp (CTOD ~0.2 μm at 1 μm behind the crack tip). However, blunter cracks having CTODs as large as predicted by continuum mechanics do not generate as large a potential drop, and therefore, as aggressive a crack tip chemistry. On the other hand, plastic straining of the crack tip is expected to disrupt crack tip films at a rate determined by ΔK and cyclic frequency, thereby increasing the electrochemical activity of the crack tip, tending to reestablish a crack tip environment having a lower potential, concentrated Al-3 and Cl- and lower pH. Therefore, measurements of repassivation rate constants on open surfaces of static electrodes can only provide an estimate of repassivation rates appropriate to propagating SCC and CF cracks.
Raetzer-Scheibe and Tuck (1994) obtained repassivation rate data on open surfaces of aluminum AA7010-T651 in chemistries and applied potentials comparable to that of the Cooper and Kelly crack tip measurements. Using a microtome to remove metal chips in situ, they measured transient current-time data on bared metal surfaces in an aqueous solution having 0.34 m NaCI adjusted with HCl to pH=3 and with an applied potential of -0.762 Vsce to -0.842 Vsce, for which the repassivation rate constant can be determined to be 2.5 s-1≤k≤6.0 s-1. Based on the discussion above, these repassivation rate data, obtained without chromate inhibitor, are considered most applicable to the occluded crack tip chemistry of a fast propagating SCC crack. Having no information to the contrary, these data also are applied to the HH-KSH experimental results.
2.4 Crack tip strain rate
According to Eq. (12), crack tip strain rate (CTSR) plays an important role in activating a crack tip so that hydrogen may be evolved and absorbed into the FPZ. Treating the instantaneous crack tip opening displacement (CTOD) δ as a gage section, crack tip strain can be defined in terms of the stretch ratio λ=δ/δi, where δi is the initial CTOD. The Cauchy engineering extensional strain or “nominal” strain e can be expressed as the change in CTOD Δδ divided by the initial CTOD as
The Hencky logarithmic strain or “true” strain ε is given by
These equations, respectively, represent the average nominal and true strains over the strain path. In order to take into account the influence of a non-linear strain path, the incremental form of Eq. (14) dε=dδ/δ can be integrated to obtain a correct measure of the final strain.
An average cyclic crack tip strain rate (C-CTSR) can be defined in terms of both the nominal and true strains, Eqs. (13) and (14), respectively. Only the nominal strain is considered here as the nominal strain, defined in terms of the stretch ratio λ, is considered to be more consistent with an assumption that all of the crack tip stretch goes to create additional active surface. Note that this approach will overpredict the true C-CTSR. Lidbury (1983) provides a more extensive discussion of similar strain derivations by a number of researchers.
Considering the up-load half-cycle having a rise time tr=Δt/2, where Δt=1/f is the cyclic period, the average nominal C-CTSR can be expressed as
where δmin=δmax[1-(1-R)2/2], and δmax=2Δδ/(1-R)2. Note that Δδ/Δt and Δδ are separately complex functions of f and ΔK when all components for a propagating crack are considered. This equation is used here to evaluate Eq. (12) for A* and to evaluate the C-CTSR corresponding to fracture mode transitions.
2.5 Adaption of the RDS equations for cyclic loading
Rice and Sorensen (1978) and Rice, Drugan, and Sham (1980) developed continuum mechanics-based CODR and COD equations for a crack propagating in an elastic-ideally plastic (non-hardening) material. These equations are considered to be applicable to high-strength, low-strain hardening aluminum alloys (cyclic strain hardening ≈0.06; Benson and Hancock, 1974).
The Rice, Drugan, and Sham (RDS) equations, which are applicable to monotonically increasing load, can be expressed as
and
where J=K2/E′ for small-scale plasticity, a is the crack size, da/dt is the crack velocity, σo is the yield stress, χ is the distance behind the crack tip, and E′ is the generalized elastic modulus. The notation ϕ for COD is introduced in order to distinguish ϕ in the RDS equations for a propagating crack from the more commonly discussed stationary crack CTOD, δ. These equations were derived for χ→0 and are valid only for distances less than an undefined fraction of the plastic zone size χ/RP«1, where
RDS also proposed a COD criterion for sustained crack growth, which is that a steadily propagating crack must maintain a geometrically similar profile. This means that the crack must maintain a constant COD ϕc at a distance behind the crack χc that is equal to the size to the FPZ. This criterion is equivalent to an assumption that steady-state crack propagation occurs at a fixed CTSR with a constant crack opening angle given by ϕc/χc.
The first term on the RHS of Eq. (16) represents the CODR due to monotonically increasing the applied J at a rate dJ/dt. The second term represents the CODR due to steady-state propagation of cracks, with velocity da/dt, into the logarithmic strain field ahead of the advancing crack. The applied “tearing modulus” introduced by Paris et al., (1979) is proportional to the factor dJ/da in the first term on the RHS of Eq. (17), that is, Tapp=(E/σo)(dJ/da). During monotonic up-loading, Tapp will attain a steady value equal to the materials resistance to tearing Tmat (see Rice et al., 1980). When exposed to an environment that reduces the magnitude of Tmat, the crack COD will be reduced. In an aggressive crack tip environment, the material resistance may be reduced to Tmat=0 such that dJ/da=0. In this limiting case, the COD is due solely to the second term on the RHS of Eq.(17), and the CODR is due solely to the second term on the RHS of Eq. (16). As discussed in Section 3.3 below, these limiting cases have implications for transitions from static load SCC to low and intermediate cyclic frequency corrosion fatigue.
Although Eq. (16) has no provision for rate-dependent deformation or creep, it may be acceptable for application to materials that undergo small-scale creep confined to the near-tip plastic zone. In this case, CODR due to small-scale creep is expected to be much less than that described in Eq. (16).
Modifications are necessary in order to apply Eqs. (16) and (17) to cyclic load. Using a superposition argument, Rice (1967) determined, for a stationary crack, the relationships between monotonic and cyclic versions of the plastic zone size (PZS), CTOD, and strain variation ahead of a crack tip embedded in a cyclic plastic zone. Rice showed that the needed modifications can be accomplished by substituting ΔK for K and
For cyclic loading, the RDS crack similarity criterion for steady crack growth is adopted by requiring that the C-COD range Δϕc=ϕmax-ϕmin must remain constant when evaluated at a distance χc behind the propagating crack, where χc is set equal to the FPZ size. As discussed above, this may be either a fixed distance characteristic of the material or a variable distance equal to the per cycle increment in physical crack size Δa. Note that the subscript “c” refers to the RDS similarity criterion and should not be confused with the subscript “crit”, which refers to critical conditions associated with fracture mode transitions.
Adopting the above assumptions and using ΔJ=ΔK2/E′ (Anderson, 2005), Eq. (16) becomes
and assuming per cycle crack growth, Eq. (17) becomes
Eq. (18) shows that C-CODR is proportional to the cyclic frequency f, χc, and a function of ΔK2. The first term on the right hand side of Eq.(19) is one-half of the stationary crack CTOD, which is consistent with Rice’s superposition model, and the second term is the crack opening due to crack advance by the distance χc. Application of Rice’s superposition methodology for extending Eqs. (16) and (17) to propagating fatigue cracks was introduced by Hall (2014) and, to the author’s knowledge, has not been considered elswhere.
The validity of these equations rests with the justifications given by Rice for his superposition arguments. Rice and Sorensen (1978) provide a detailed discussion of the equation development and applicability of the crack similarity criterion for steady crack growth. Although the derivation of their equations does not consider the strain distribution ahead of a cyclically loaded propagating crack, the analysis for a growing crack may be considered applicable when unloading strains are negligible.
Experimental support for the use of Eqs. (18) and (19) is provided by comparisons, shown in Figure 1, of measured and predicted COD profiles of propagating fatigue cracks. The measured fatigue crack profiles were obtained by Cooper (2001) on AA 7050-T651 fatigue cracks grown at 10 Hz, R=0.3, in air (ΔK=13.3 MPa√m) and in 0.05 m NaCl+0.5 m Na2CrO4, pH 9.2 at Eapp=-0.445 Vsce (ΔK=12.3 MPa√m). Shown for comparison to the CF crack profile is the predicted C-COD obtained using Eq.(19) and ΔK=12.3 MPa√m. This figure shows that the predicted C-COD profile (solid curve) is comparable to the measured fatigue crack profile data trend (dashed curve).
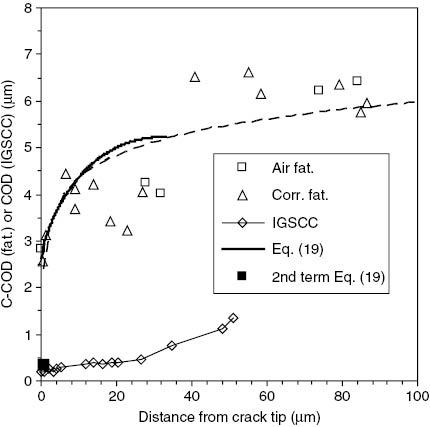
Measured and predicted cyclic crack opening displacement (C-COD) profiles of propagating fatigue and IGSCC cracks obtained by Cooper (2001) on AA 7050-T651. The predicted fatigue crack profile, obtained using Eq. (19), is comparable to the measured fatigue crack profile data trend (dashed line). The closed symbol is the C-COD predicted using only the second term of Eq. (19).
Also shown is the measured COD profile of an IGSCC crack (K=12.9 MPa√m) grown by Cooper in the above environment. The IGSCC crack profile is sharper, by more than an order of magnitude, than the measured and predicted air and CF crack profiles. Shown for comparison is the C-COD predicted using only the second term on the RHS of Eq. (19) and using ΔKcrit=12.9 MPa√m and plotted at χcrit=2.4 μm (choice of this distance is discussed below). As discussed above, use of only the term due to crack advance is appropriate for the limiting case where the material resistance to tearing under rising load conditions Tmat approaches zero due to exposure to an environment that sufficiently embrittles the FPZ. This comparison suggests that corrosion fatigue cracks may have similar profiles to static load SCC cracks for low cyclic frequencies, where CF and IGSCC crack velocities are comparable.
Consideration of the separate effects that load variation and crack advance may have on CODR, COD and enviroment-assisted crack growth rate can be found only in a limited number of studies. Somerday, Young, and Gangloff (2000) used Eq. (16) to rationalize the separate effects of dK/dt and da/dt on environment-assisted cracking of beta-titanium alloys during up- and down-load testing in aqueous NaCl. Hall (2014) used C-CODR, Eq. (18), to analyze the HH corrosion fatigue data.
3 Data analysis and discussion
3.1 The HH and KSH data sets
Detailed discussions of the CF experiments carried out by Holroyd and Hardie (1983) and Kotsikos et al. (2000) can be found in the references. Briefly, base and recrystallized heat-affected “white zone” metals of aluminum alloy 7017 were tested at room temperature in pH 8.2 natural sea water and dry air (base metal) and in 2.5% NaCl+0.5% Na2CrO4 solution acidified to pH 3 with HCl and laboratory air (white zone). Tests were conducted using a triangular wave form, R=0.1, and frequencies from 0.1 to 70 Hz (base metal) and using a sinusoidal wave form, R=0.1, and frequencies from 0.01 Hz to 10 Hz (white metal). Tests were conducted under load control so that ΔK increased during crack growth (base metal) and ΔK held constant (white zone).
The rolled plate base metal (T651) has an unrecrystallized pancake structure elongated in the rolling direction. Grain size information was not provided; however, a 7000 series alloy given a similar mechanical-thermal treatment has grain dimensions of 130, 60, and 18 μm in the L, T, and S directions, respectively. Cracks were oriented so as to propagate in the rolling plane. The fracture surfaces denoted as “IG” showed equiaxed features measuring about 15±3 μm, which suggests that the IG crack growth is along subgrain boundaries. The heat-affected white zone metal has an equiaxed recrystallized structure with a grain diameter of 10.5±3 μm. Cracks were oriented so as to propagate within the thin heat-affected white zone metal separating the base and weld metal. The fracture mode transition data for both base and WZ metal are found in Table 1. Hall (2014) previously performed a detailed analysis of the HH base metal data. The present analysis includes the KSH data and is focused on additional aspects of the observed fracture mode transitions.
Critical conditions associated with transitions in crack-path fracture-mode.
| f crit1/s | Base metal IG to BTG |
Base metal BTG to DTG |
WZ IG to BTG |
||||||
|---|---|---|---|---|---|---|---|---|---|
| ΔKcrit MPa√m |
Δa/ΔNcrit μm/cycle |
C-COD μm |
ΔKcrit MPa√m |
Δa/ΔNcrit μm/cycle |
C-COD μm |
ΔKcrit MPa√m |
Δa/ΔNcrit μm/cycle |
C-COD μm |
|
| 0.01 | – | – | – | – | – | – | 22.0 | 52 | 6.45 |
| 0.02 | – | – | – | – | – | – | 21.5 | 23 | 6.19 |
| 0.05 | – | – | – | – | – | – | 19.5 | 7.0 | 5.21 |
| 0.1 | 17.3 | 3.4 | 3.01 | 21.7 | 7.0 | 4.73 | 17.4 | 2.4 | 4.28 |
| 0.2 | 15.2 | 2.0 | 2.32 | 21.4 | 4.8 | 4.44 | 16.0 | 1.4 | 3.45 |
| 0.5 | 12.8 | 1.2 | 1.68 | 20.8 | 3.3 | 4.11 | 13.5 | 0.78 | 2.39 |
| 0.7 | – | – | – | – | – | – | 13.3 | 0.73 | 2.31 |
| 1 | 10.8 | 0.78 | 1.24 | 20.5 | 2.3 | 3.92 | 12.4 | 0.67 | 2.02 |
| 2 | 10.1 | 0.44 | 1.08 | 18.4 | – | – | 11.0 | 0.38 | 1.54 |
| 4 | 9.2 | 0.34 | 0.921 | 17.5 | 1.1 | 2.87 | 10.3 | 0.26 | 1.33 |
| 10 | 9.1 | 0.29 | 0.900 | 16.3 | 0.65 | 2.50 | 10.0 | 0.18 | 1.23 |
| 20 | 9.0 | 0.18 | 0.875 | 15.0 | 0.55 | 2.15 | – | – | – |
| 30 | 8.9 | 0.18 | 0.859 | 13.9 | 0.44 | 1.87 | – | – | – |
| 70 | 8.8 | 0.17 | 0.842 | 10.8 | 0.29 | 1.20 | – | – | – |
3.2 Values of material parameters used in data analysis
Values of the parameters used in the data analyses are provided in Table 2. These values represent best estimates based on very limited independently determined information. The plane strain elastic modulus E′=E/(1-ν2)=72.3 GPa was determined using the tensile modulus E=65.8 GPa reported for 7017-T651 by Ruiz and Elices (1997) and assuming that ν=0.3. The cyclic yield stress was assumed to be equal to the monotonic yield stress based on the finding by Benson and Hancock (1974) that two aluminum alloys 7075-T6 and 6061-T651 showed stable cyclic behavior. A yield stress of 435 MPa was reported by HH for the base metal. The yield stress of the WZ metal is unknown and would be hard to measure due to its width of only 0.5 mm. However, Bloem, Salvador, Amigó, and Vergara (2011) report micro-hardness of about 140–145 VH for the volume of metal (WZ) that lies within 0.5 mm of the weld fusion line of an aluminum alloy 7020 weld, which is approximately equivalent to a yield stress of 407–428 MPa.
Values of parameters used in data analyses.
| E′ GPa |
k 1/s |
DE m2/s |
Base metal |
WZ |
||||
|---|---|---|---|---|---|---|---|---|
|
K
c
MPa√m |
K
H-crit
MPa√m |
MPa |
K
c
MPa√m |
K
H-crit
MPa√m |
MPa |
|||
| 72.3 | 2.5 | 3.37×10⁻¹² | 31.5 | 8.8 | 435 | 25.0 | 11.0 | 428 |
HH report an average value for Kc of 31.5 MPa√m for the base metal data. Holroyd (private communication) confirmed that Kc of 25.0 MPa√m is representative of the WZ metal. As there are no data available for KH-crit and having no better alternative, the apparent threshold values for Kmax of about 8.8 MPa√m for the base metal and 11.1 MPa√m for the WZ were used as default values. The value for k of 2.5 s-1 from the Raetzer-Scheibe and Tuck data corresponding to a potential of -0.762 Vsce was chosen as it conservatively represents the crack tip potential measured by Cooper and Kelly within 1 mm of the crack tip, where the crack tip chemistry is concentrated.
A value for the effective hydrogen diffusivity was obtained from a critical review by Young and Scully (2003) of the available diffusivity data. They conclude that the value of 3.37×10⁻¹² m2/s obtained from their isothermal desorption measurements is most representative of peak aged alloy 7050-T6 condition. Use of this value in the data analyses below is based on an assumption that dynamic straining within the FPZ does not alter the hydrogen diffusivity, which, as discussed above, is conjectured to be the case when trapping by corrosion-injected vacancies is dominant.
3.3 Critical conditions for fracture mode transitions
Time-domain plots of the HH and KSH crack velocity data Δa/Δt obtained on base and heat-affected white zone metals, respectively, can be found in their publications. Also found in the HH publication are the IGSCC data obtained on the base metal. The HH and KSH data are quite similar even though the base and white zone metal microstructures are quite different, cyclic wave forms are different, and the base metal test environment had no inhibitor, while the white zone environment included chromate inhibitor. The data show that CF crack velocities are comparable and increase with increasing cyclic frequency at similar rates at all values of ΔK. For the lowest frequencies and Kmax values, the white zone CF crack velocities are comparable to the base metal SCC crack velocities. Moreover, KSH note that at frequencies below 0.1 Hz, there are striations on IG-CF fracture surfaces, similar to the ones observed by Scamans (1980) on IGSCC fracture surfaces of AA 7018. Based on high-resolution fractographic studies, Scamans concludes that these are crack arrest markings rather than fatigue striations. KSH speculate that, given the similarities in crack velocity and fracture surface striations and that these markings are not related to load cycling, corrosion fatigue cracks advance by an IGSCC mechanism for frequencies below 0.1 Hz.
Figure 2 is a fracture mode diagram showing the critical values of applied f and ΔK, for the HH and KSH data, corresponding to transitions in fracture modes, from IG to BTG and then to DTG in the case of the HH data. Figure 2 shows that as the cyclic frequency increases (cycle time decreases), decreasing the mechanical driving force ΔK is required to sustain cracking along the more brittle IG and BTG fracture paths. Above a frequency of about 4 Hz, ΔKcrit becomes less dependent on frequency for the IG fracture mode and approaches a value just above the ΔK used to fatigue pre-crack specimens (ΔK=8.5 MPa√m).
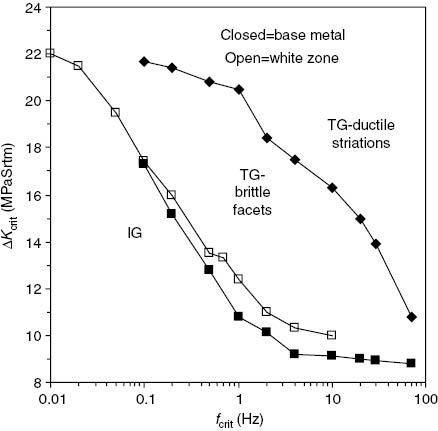
Crack-path fracture mode diagram showing critical values of f and ΔK associated with fracture mode transitions for AA 7017-T651 base metal and heat effected “white zone” metal tested in aqueous chloride solutions. Transitions in fracture modes, from brittle to more ductile, occur as frequency and ΔK are increased above critical values.
An important conclusion that can be drawn from the data in Figure 2 and Eq. (3) for θcrit is that as fcrit increases (and ΔKcrit decreases) the hydrogen coverage of grain boundaries θint must increase in order to satisfy the critical hydrogen criterion θint=θcrit. Figure 3 shows that, for fracture mode transitions from IG to BTG for both base and WZ metal, θcrit increases from a value as low as 0.002 atom fraction, where ΔKcrit has a maximum value of 22 MPa√m, to a high value of 1.0 atom fraction, where ΔKcrit has a minimum value of 8.8 MPa√m, as the cyclic frequency increases from 0.01 to 70 Hz. This means that the critical distance at which θcrit is attained must decrease as the cyclic frequency increases, as the hydrogen diffusion time per cycle decreases as the frequency increases.
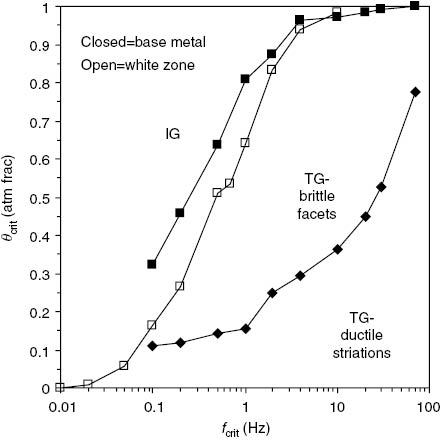
Critical values of the hydrogen coverage Eq. (3) of IG and TG fracture interfaces at transition in fracture modes plotted versus critical frequency. An assumption of the critical hydrogen model is that a crack advances when hydrogen occupancy of the crack path interface, θint, attains the critical occupancy, θcrit. Critical occupancy increases as frequency increases due the fact that the critical ΔK necessary to avoid fracture mode transitions decreases with increasing frequency.
These results are consistent with the results of Holroyd and Hardie (1981), who concluded, based on fractographic examinations of using slow strain rate tests of high-strength aluminum alloy 7049-T651 in saltwater, that the transition from IG fracture to BTG fracture occurs at higher local hydrogen concentrations as the strain-rate is increased. Fracture mode transition from BTG to DTG (base metal) occurs for significantly lower critical values of θint=θcrit at all frequencies.
Establishing separate dependencies of critical crack velocity Δa/Δtcrit on ΔKcrit and fcrit is not possible due to the fact that these are inseparable co-variables. However, Eqs. (18), (19), and (15) show that C-CTSR is a function of both of these variables and therefore provides a measure of their concomitant effects on the crack driving force at fracture mode transition. Using the full HH dataset, Hall (2014) showed more generally that there is a correlation between Stage II crack velocity and C-CODR, the latter evaluated at a distance behind the propagating crack equal to the hydrogen diffusion distance per cycle. This correlation holds for all cyclic frequency -ΔK data combinations and fracture modes, which suggests that C-CODR, or equivalently C-CTSR, is the more fundamental crack driving force variable.
Figure 4 shows the critical C-CTSR
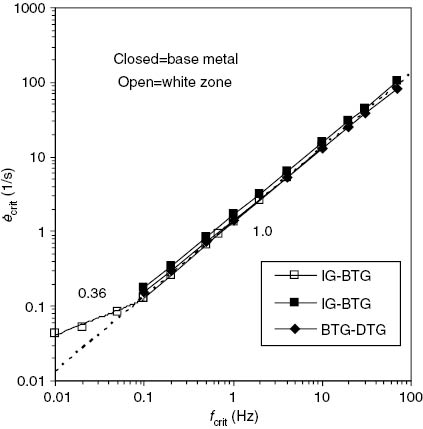
Critical cyclic crack tip strain rate (C-CTSR) versus critical cyclic frequency. C-CTSR is proportional to critical frequency for frequencies greater than 0.1 Hz but decreases more slowly for frequencies lower than 0.1 Hz due to the increasing contribution to CTSR by the velocity-dependent term of Eq. (16).
As discussed above, Scamans (1980) concluded that the striation markings observed on static load IGSCC fracture surfaces of aluminum alloy 7017 are crack arrest markings. Given the similarities between these features and those observed by KSH on IGCF fracture surfaces, for critical frequencies <0.1 Hz, it is assumed here that, in this low-frequency regime, striation markings are crack arrest markings, independent of frequency. Consistent with these assumptions, it is assumed that the critical hydrogen criterion is met at a fixed distance ahead of the propagating crack, independent of frequency. This distance was taken to be 2.4 μm, which is the per cycle value of Δa/ΔNcrit for the WZ metal at fcrit=0.1 Hz (see Table 1). This distance is comparable to the striation spacings observed by Scamans and KSH. With this assumption, the predicted C-CTSR is increasingly larger than that predicted based on the per cycle assumption (dashed curve) as fcrit decreases below 0.1 Hz. This is due to the fact that the COD at a fixed distance behind the crack increases as fcrit decreases (ΔKcrit increases). The fixed distance assumption means that, as the crack advance per cycle increases with decreasing fcrit, this distance is traversed as many as 22 times per load cycle at 0.01 Hz (Δa=52 μm).
The proposal that χcrit is determined by the location of maximum tensile and hydrostatic stress (~2 CTOD from crack tip) can be evaluated simply by comparing entries in Table 1, which provides the calculated C-COD values and the corresponding Δa/ΔNcrit. The comparison shows that Δa/ΔNcrit, as a fraction of 2 C-COD, for the IG-BTG transition (WZ), ranges from 0.08 for the highest frequency data to 0.3 for the lowest frequency data, with similar trends for the base metal transitions. One must conclude, as did Gingell and King (1993), that the transitions in crack path are not dependent on the location of the maximum stress located at a distance of 2 CTOD ahead of the crack tip.
Figure 5 shows the critical crack velocity Δa/Δtcrit plotted versus the critical value of C-CTSR
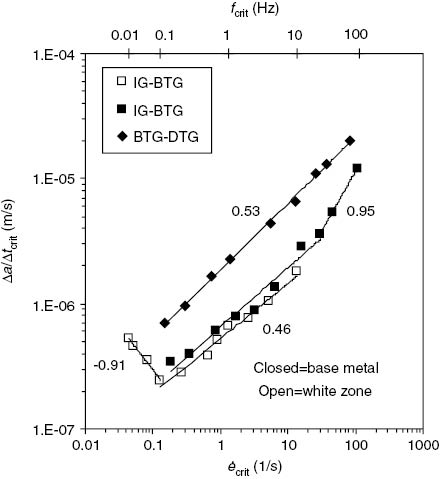
Critical cycle-domain crack growth rates (m/s) associated with fracture mode transitions versus critical C-CTSR. Different C-CTSR (frequency) dependencies are observed in low, intermediate and high frequency regimes. A change in slope indicates transition in the rate limiting step.
A slope of about ~0.5, for the base metal BTG to DTG transition and the IG to BTG transition for the base and white zone metals in the intermediate frequency regime, is consistent with hydrogen diffusion as the rate-limiting crack growth process. A slope of about ~1 for the IG to BTG transition in the high frequency regime is consistent with frequency independent per cycle crack growth, which indicates a change in rate limiting step at a frequency of about 10 Hz, from time-cycle-dependent to cycle-dependent crack growth. The negative slope for frequencies below 0.1 Hz indicates that slow – large amplitude load cycles retard crack growth while time dependent – cycle independent crack growth might otherwise be expected (see e.g. Anderson, 2005).
Increasing crack velocity with increasing
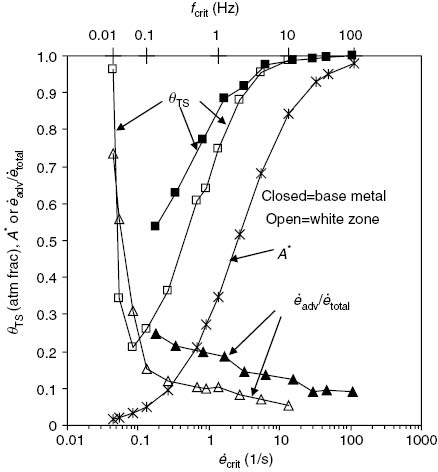
Hydrogen occupancy of near-surface hydrogen traps, active surface area fraction and fraction of the crack tip strain due to crack advance versus the critical C-CTSR necessary to sustain IG crack growth. The data trends can be rationalized based on considerations of the effect of load cycling on crack opening and the effect that this may have on crack tip chemistry, effect of the dominant crack tip strain rate components and strain-induced activation of the crack tip.
The trend in Δa/Δtcrit at or below a frequency of 0.1 Hz then suggests that the electrochemical reactivity at a crack tip first decreases and then increases with increasing frequency. This is consistent with the predictions of Eq. (11) for the hydrogen occupancy of near-surface traps, which, as shown in Figure 6, θTS=0.962 for
This suggests that narrow IGSCC cracks may develop a more aggressive crack tip chemistry than a more open low-frequency IGCF crack. Kelher and Scully (2008) argue that tight cracks can develop a low potential, low pH, and concentrated chloride crack tip chemistry that inhibits the formation of protective surface films. They argue that the ability to develop this environment decreases as the crack opening increases relative to the crack length. Development of an aggressive crack tip environment, supporting increased electrochemical activity, independent of load cycling, is not anticipated in the derivation of Eq. (12).
The possibility of near saturation of near-surface traps during IGSCC crack advance is supported by the crack tip conditions observed by Cooper and Kelly (2007), pH 3 and 0.3 m–0.4 m Cl-, which may destabilize otherwise protective oxide films. The crack tip surface may be expected to be electrochemically reactive under these conditions. When hydrogen entry is unimpeded by protective surface films, the measured crack tip potential of -0.88 Vsce results in a very large hydrogen fugacity that can easily saturate near-surface strong traps such as corrosion-generated Vac-H clusters.
Figure 6 shows that the fraction of
Above 0.1 Hz, the CTSR component due to the applied cyclic load is the dominant term, and
4 Discussion
Speculative consideration is given to the possibility that, below 0.1 Hz, the effect of increasing frequency is to blunt the crack tip, transitioning the crack COD profile from one similar to that of a sharp IGSCC crack to one similar to the more open blunted crack profile observed for corrosion fatigue crack growth in the intermediate frequency regime. According to Kelher and Scully (2008), when COD increases more quickly than crack length, the electrochemical driving force for hydrogen production at the crack tip may be reduced, as the crack tip potential Etip, hydrogen overpotential ηH, and hydrogen fugacity
The significance of 2.4 μm as the critical per-cycle crack advance increment when this reversal occurs cannot be understood in the context of the critical hydrogen model as currently developed. However, consideration of microstructural features potentially limiting both IG and BTG crack advance may provide some additional insight into the critical conditions necessary for transition in the crack path from IG to BTG.
Intrinsic size effects arise due to microstructural constraints, such as grain boundaries and second phase particle precipitation. Davidson and Lankford (1985) concluded that the relevant microstructural parameter involved in transgranular fatigue crack growth in aluminum alloys 7075-T651 and 7091 PM is the mean free path length between IM particles having sizes in the range 0.02–0.5 μm. Using size and volume fraction measurements, they determined that the mean free path of these particles is 3.7–5 μm. Using high-resolution, dynamic observations of crack tip deformation and CTOD and using a geometric crack tip model, they use the mean free path and CTOD information to determine the dislocation slip distances for fatigue crack propagation in vacuum and humid air. For ΔK values just above threshold, slip distances were determined to be 7.2±2 μm in vacuum and 5.0±2 μm in moist air. This is comparable to the critical per-cycle crack advance increment of 7 μm for BTG cracking of the base metal at 0.1 Hz. Lu and Kaxiras (2005) note that, for aluminum alloys, transgranular cracks advance along {111} slip planes, and speculate that the presence of Vac-H clusters on these planes provides a mechanism whereby hydrogen may enhance transgranular cracking. When the slip distance equals or exceeds the critical hydrogen diffusion distance χcrit, cracks may advance cycle-by-cycle at an incremental distance χcrit.
Slip distance also plays a role in IG cracking. Consider the corrosion-enhanced plasticity model developed by Magnin (1996), which proposes that cracks may advance along grain facets by a combination of alternating shear (slip along {111} planes) and tensile decohesion of grain boundaries. Within a slip band emanating from a crack tip, pileups of dislocations, blocked by a grain boundary, may nucleate grain boundary wedge cracks when the grain boundary is embrittled by hydrogen.
Lankford and Davidson (1983) characterized the striations found on fatigue surfaces formed during cyclic loading of AA 7075-T651 in moist air for ΔK below the Paris regime and concluded that crack growth is intermittent (not cycle by cycle) and occurs by a two-step process of crack tip blunting followed by an increment of brittle crack advance. They found that the striation spacing was equal to the dislocation band spacing. This is the case considered by Beltz, Limkin, and Fisher (1999) and Fisher and Beltz (2001) when modeling the competition between dislocation nucleation and atomic decohesion. The critical energy release rate for dislocation emission is initially less than that for decohesion but increases with increasing crack tip radius (blunting) until back stresses exceed a critical level and crack advance by decohesion is favored and the process is repeated.
When the dislocation slip distance is sufficiently large to encompass a grain facet, the macro-crack will advance. Assuming that the grains are space-filling truncated octahedrons, the facet size is 2.4–4.3 μm for the WZ metal grain diameter of 10.5±3.0 μm. This compares well with the critical per-cycle crack advance increment of 2.4 μm at a frequency of 0.1 Hz. The presence of Vac-H clusters, diffusively segregated to grain boundary facets and {111} planes, provides a mechanism whereby hydrogen may enhance TG and IG cracking.
The observations by Scamans (1980) and Kotsikos et al. (2000) of striations on IG facets under slow crack growth conditions (IGSCC crack velocity ~1.4×10⁻⁹ m/s and IGCF crack velocity ~1×10⁻⁸ m/s, respectively) suggest that crack growth along grain facets is intermittent. The spacings of striations found in the Scamans and KSH examinations were both about 0.5 μm, which means that there are up to five striations per facet. Scamans took care to show that these are “crack arrest” markings instead of cycle-driven fatigue striations. These authors did not discuss the potential mechanism whereby these striations may be formed. It is speculated here that each of these striations represents the formation of micro-cracks during the process of advancing the macro-crack one grain facet. This understanding suggests that the crack arrest markings characterized by Scamans may be “stretch” marks formed prior to the brittle crack advance step.
5 Unresolved issues
Issues remain unresolved for applications of “critical hydrogen” HE crack growth models. These include the following:
There remains a need to obtain independent knowledge of the characteristic distance χc for use in SCC and CF models. Dislocation-based micro-mechanical models and experiments utilizing a wide range of grain sizes and micrographic characterization of the crack path are needed.
Additional low-frequency CF tests are needed to test the speculation that there are retarding effects of low-frequency cycling on crack velocity due to mitigating severity of the crack tip chemistry and electrochemistry of crack tip chemistry.
Development of computational models and methods is needed for calculating the crack tip environmental variables that establish near-surface lattice and trapped hydrogen concentrations. These models are needed to establish the effects of external environment, crack size and aspect ratio, cyclic loading, etc., on crack tip environments and near-surface hydrogen concentrations. This information is relatively inaccessible and costly to obtain experimentally. While it is not contemplated that such models will be applied in engineering programs, they are needed to develop the more fundamental understanding that guides the development of engineering models and methods.
Hydrogen permeation experiments using straining electrode samples are needed to develop of a more fundamental understanding of the effects that co-generation and clustering of hydrogen and vacancies may have on hydrogen solubility and diffusion. Formation of these clusters may have important effects on hydrogen and solvent atom diffusion, and the location of these defects at prospective fracture interfaces should have important effects on the micro-mechanism of fracture.
6 Summary of analysis methods and models
A time-domain analysis is used to gain insight into the critical conditions of cyclic frequency, alternating stress intensity factor, interfacial hydrogen coverage, and crack velocity necessary for transitions in fracture modes to occur.
The interrelationships among these variables are rationalized in the context of a critical-hydrogen–critical-distance criterion and model for crack advance. Crack advance is assumed to be rate limited by hydrogen diffusion.
A phenomenological interpolation expression is used to establish the critical interfacial hydrogen coverage.
A phenomenological model expression is used to relate active surface area fraction to crack tip strain rate.
Nominal crack tip strain rate is expressed in terms of crack opening displacement and displacement rate equations developed by RDS for monotonic loading and extended here to apply to cyclic loading.
The RDS criterion for crack similarity (constant crack opening angle) is adopted to establish the critical crack opening displacement when transitions in fracture modes occur.
7 Observations and conclusion
Brittle IG and TG fracture modes can be sustained to high frequencies by decreasing the applied ΔK. The values of Kmax associated with the transition from IG to brittle TG and ductile TG fracture modes decrease as the cyclic frequency increases for both base and WZ metal. This means that the critical hydrogen coverage of prospective fracture interfaces within the FPZ must increase with increasing frequency in order to sustain the more brittle fracture modes at the higher frequencies.
As the gradient in hydrogen distribution ahead of a propagating crack increases with increasing crack velocity, the fracture process must take place more proximate to the crack tip the higher the crack velocity in order to attain the required higher critical hydrogen occupancy of fracture interfaces.
The near-surface trapped hydrogen coverage of prospective interfaces, which is a proxy for the near-surface diffusible lattice hydrogen, is predicted to increase with increasing frequency due to increasing active surface area fraction.
For cyclic frequencies greater than 0.1 Hz,
For cyclic frequencies between 0.01 and 0.1 Hz, the critical crack velocity for the WZ metal decreases with increasing frequency. This reversal in frequency dependence cannot be understood in the context of the critical hydrogen model as originally developed. This reversal is speculated to be due to increasing levels of crack blunting during the rising load half-cycle, which reduces the driving force for hydrogen production in a less aggressive crack tip chemistry and electrochemistry. This is consistent with the model prediction that the near-surface hydrogen concentration first decreases and then increases with increasing frequency above 0.1 Hz.
A conclusion that can be drawn from the data analyses and speculative considerations provided here is that, for low cyclic frequencies, for which the diffusion distance per cycle exceeds the distance between characteristic microstructural obstacles to dislocation slip, cracks advance by incremental distances that are independent of cyclic frequency. At higher frequencies, for which the critical diffusion distance is less than the distance between obstacles to slip, the crack advance per cycle is limited to an incremental distance equal to the critical diffusion distance. Comparisons with microstructure support a speculation that the transition from low to intermediate frequency behavior is due to the transition from microstructure control to control by the critical-hydrogen criterion.
About the author
BS (Concord University, 1967) and MS (Michigan State University, 1969) in Physics. PhD in Materials Science and Engineering (Purdue University, 1974) Argonne National Laboratory 1974–1980. Retired from Bettis Atomic Power Laboratory 2008 Consulting civilian nuclear reactor industry and Office of Naval Research/Naval Air 2008–2014. Forty one years materials engineering, engineering management and consulting experience in US Fast Breeder Reactor Program, US Naval Nuclear Propulsion Program and Naval Air Systems Program. Expertise in LMFBR and PWR reactor core materials, PWR reactor plant and steam plant materials. Interests in modeling irradiation creep and swelling of fast reactor core materials, modeling PWR primary side stress corrosion cracking, stress corrosion cracking of high strength alloys used in ambient temperature aircraft applications and compatibility of reactor core and turbine plant materials in high temperature helium gas-cooled fast reactors. TP Hoar Award 2010. EDSM-Science Award 2014.
Acknowledgments
Recognition is given to the reviewers of the manuscript whose extensive comments provided significant added value.
References
Anderko A. Modeling of aqueous corrosion. In: Richardson JA, editor. Shreir’s corrosion. Volume 2. Oxford, UK: Elsevier, 2010: 585–1629.10.1016/B978-044452787-5.00083-4Search in Google Scholar
Anderson TL. Fracture mechanics: fundamentals and applications, 3rd ed., New York: Taylor and Francis, 2005.10.1201/9781420058215Search in Google Scholar
Atkinson C. Diffusion-controlled growth an array of plates. J Appl Phys 1971; 42: 1994–1997.10.1063/1.1660478Search in Google Scholar
Beltz GE, Lipkin DM, Fischer LL. Role of crack blunting in ductile versus brittle response of crystalline materials. Phys Rev Lett 1999; 82: 4468–4471.10.1103/PhysRevLett.82.4468Search in Google Scholar
Benson K, Hancock JR. Effect of strain rate on the cyclic response of metals. Metall Trans 1974; 5: 1711–1715.10.1007/BF02644132Search in Google Scholar
Birnbaum HK, Buckley C, Zeides F, Sirois E, Rozenak P, Spooner S, Lin JS. Hydrogen in aluminum. J. Alloys Compd 1997; 253–254: 260–264.10.1016/S0925-8388(96)02968-4Search in Google Scholar
Bloem C, Salvador M, Amigó V, Vergara M. Aluminium 7020 alloy and its welding fatigue behaviour. In: Kvackaj T, editor. Aluminium alloys, theory and applications. Rijeka, Croatia: InTech, 2011; Chapter 6: 115–134. Available from: http://www.intechopen.com/books/aluminium-alloys-theory-andapplications/aluminium-7020-alloy-and-its-welding-fatigue-behaviour. Accessed 5 May 2015.10.5772/13949Search in Google Scholar
Cooper KR. Chemistry and electrochemistry of environment-assisted cracking of an Al-Zn-Mg-Cu alloy chemistry and electrochemistry of environment-assisted cracking of an Al-Zn-Mg-Cu alloy. PhD Thesis, University of Virginia, 2001.Search in Google Scholar
Cooper KR, Kelly RF. Measurement and modeling of crack conditions during the environment-assisted cracking of an Al-Zn-Mg-Cu alloy. In: Jones RH, editor. Chemistry and electrochemistry of stress corrosion cracking. Warrendale, PA, USA: TMS, 2001: 335–344.Search in Google Scholar
Cooper KR, Kelly RF. Crack tip chemistry and electrochemistry of environmental cracks in AA 7050. Corros Sci 2007; 49: 2636–2662.10.1016/j.corsci.2006.12.001Search in Google Scholar
Dadfarnia M, Sofronis P, Somerday BP, Liu JB, Johnson DD, Robertson IM. Modeling issues on hydrogen-induced intergranular cracking under sustained load. In: Somerday BP, Sofronis P, Jones RH, editors. Effects of hydrogen on materials. Materials Park, OH, USA: ASM International, 2008: 613–621.Search in Google Scholar
Davidson DL, Lankford J. The effects of aluminum alloy microstructure on fatigue crack growth. Mater Sci Eng 1985; 74: 189–199.10.1016/0025-5416(85)90431-8Search in Google Scholar
Despic AR, Raicheff RG, Bockris JO’M. Mechanism of acceleration of the electrode dissolution of metals during yielding under stress. J Chem Phys 1968; 49: 926–938.10.1063/1.1670162Search in Google Scholar
Fisher LL, Beltz GE. The effect of crack blunting on the competition between dislocation nucleation and cleavage. J Mech Phys Solids 2001; 49: 635–654.10.1016/S0022-5096(00)00042-9Search in Google Scholar
Fukai Y. Superabundant vacancies formed in metal–hydrogen alloys. Phys Scr 2003; T103: 11–14.10.1238/Physica.Topical.103a00011Search in Google Scholar
Gasem ZM, Gangloff RP. Effect of temper on environmental fatigue crack propagation in 7000-series aluminum alloys. Mater Sci Forum 2000; 331–337: 1479–1488.10.4028/www.scientific.net/MSF.331-337.1479Search in Google Scholar
Gasem ZM, Gangloff RP. Rate-limiting processes in environmental fatigue crack propagation in 7000-series aluminum alloys. In: Jones RH, editor. Chemistry and electrochemistry of corrosion and stress corrosion cracking. Warrendale, OH, USA: TMS, 2001: 501–521.Search in Google Scholar
Gangloff RP. Diffusion control of hydrogen environment embrittlement in high strength alloys. In: Moody NR, Thompson AW, Ricker RE, Was GW, Jones RH, editors. Hydrogen effects on material behavior and corrosion deformation interactions. Warrendale, OH, USA: TMS, 2003: 477–497.Search in Google Scholar
Gangloff RP. Critical issues in hydrogen assisted cracking of structural steels. In: Shipilov SA, Jones, RH, Olive JM, Rebak RB, editors. Environment-induced cracking of materials. Oxford, UK: Elsevier, 2008: 141–165.10.1016/B978-008044635-6.50015-7Search in Google Scholar
Gingell ADB, King JE. Effect of frequency on environmentally assisted fatigue crack growth in aluminum alloy 7150-T651. In: ICF8, Eighth International Conference on Fracture, 1993; Kiev, Ukraine: International Congress on Fracture, 1993: 61–67.Search in Google Scholar
Gingell ADB, King JE. The effect of frequency and microstructure on corrosion fatigue crack propagation in high strength aluminum alloys. Acta Mater 1997; 45: 3855–3870.10.1016/S1359-6454(97)00033-5Search in Google Scholar
Green AM, Knott JF. Effects of environment and frequency on the long fatigue crack growth of aluminium alloy 7475. In: Salama K, et al., editors. Advances in fracture research. New York: Pergamon Press, 1989: 1747–1756.10.1016/B978-0-08-034341-9.50186-8Search in Google Scholar
Hall MM Jr. Crack tip strain rate equation with applications to crack tip embrittlement and active path dissolution models of stress corrosion cracking. In: Shipilov S, Jones R, Olive J, Rebak R, editors. Environment-induced cracking of materials. Oxford, UK: Elsevier, 2008a: 59–68.10.1016/B978-008044635-6.50008-XSearch in Google Scholar
Hall MM Jr. An alternative to the Shoji crack tip strain rate equation. Corros Sci 2008b; 50: 2902–2905.10.1016/j.corsci.2008.07.011Search in Google Scholar
Hall MM Jr. Film rupture model for aqueous stress corrosion cracking under constant and variable stress intensity factor. Corros Sci 2009; 51: 225–233.10.1016/j.corsci.2008.08.052Search in Google Scholar
Hall MM Jr. Effect of variable stress intensity factor on hydrogen environment assisted cracking. Metall Mater Trans A 2011; 42A: 304–318.10.1007/s11661-010-0226-2Search in Google Scholar
Hall MM Jr. Environmental crack driving force. Metall Trans A 2012; 44A: 1200–1208.10.1007/s11661-012-1439-3Search in Google Scholar
Hall MM Jr. Effect of cyclic crack opening displacement rate on corrosion fatigue crack velocity and fracture model transitions for Al-Zn-Mg-Cu alloys. Corros Sci 2014; 81: 132–143.10.1016/j.corsci.2013.12.014Search in Google Scholar
Hall MM Jr., Symons DM. Hydrogen assisted creep fracture model for low potential stress corrosion cracking of Ni-Cr-Fe Alloys. In: Jones RH, editor. Chemistry and electrochemistry of stress corrosion cracking. Warrendale, OH, USA: TMS, 2001: 447–466.Search in Google Scholar
Hall MM Jr., Symons DM, Kearns JJ. Strain energy density – distance criterion for the initiation of hydrogen-induced cracking of Alloy X-750. In: Bruemmer et al., editors. Parkins symposium on fundamental aspects of stress corrosion cracking. Warrendale, OH, USA: TMS, 1992: 231–244.Search in Google Scholar
Haruyama S, Asawa S. Mechano-electrochemical dissolution of copper at reversible electrode potential. Corros Sci 1973; 13: 395–407.10.1016/0010-938X(73)90042-5Search in Google Scholar
Holroyd NJH, Hardie D. Strain-rate effects in the environmentally assisted fracture of a commercial high-strength aluminum alloy (7049). Corros Sci 1981; 21: 129–144.10.1016/0010-938X(81)90097-4Search in Google Scholar
Holroyd NJH, Hardie D. Factors controlling crack velocity in 7000 series aluminium alloys during fatigue in an aggressive environment. Corros Sci 1983; 23: 527–546.10.1016/0010-938X(83)90117-8Search in Google Scholar
Hoar TP, West JM. Mechano-chemical anodic dissolution of austenitic stainless steel in hot chloride solution. Proc R Soc London A 1962; 268: 304–315.10.1098/rspa.1962.0142Search in Google Scholar
Huang Y, Nakajima A, Nishikata A, Tsuru T. Effect of mechanical deformation on permeation of hydrogen in iron. ISIJ Int 2003; 43: 548–554.10.2355/isijinternational.43.548Search in Google Scholar
Hutchinson JW. Plasticity at the micron scale. Int J Solids Struct 2000; 37: 225–238.10.1016/S0020-7683(99)00090-6Search in Google Scholar
Kato D, Iwakiri H, Morishita K. First-principle study on binding energy of vacancy-hydrogen cluster in tungsten. J Plasma Fusion Res 2009; 8: 404–407.Search in Google Scholar
Kelher BA, Scully JR. Predicting the effect of applied potential on crack tip hydrogen concentration in low-alloy martensitic steels. Corrosion 2008; 64: 465–477.10.5006/1.3278484Search in Google Scholar
Kolman DG, Scully JR. Continuum mechanics characterization of plastic deformation-induced oxide film rupture. Philos Mag A 1999; 79: 2313–2338.10.1080/01418619908214287Search in Google Scholar
Kotsikos G, Sutcliffe JM, Holroyd NJH. Hydrogen effects in the corrosion fatigue behaviour of the white zone of 7XXX series aluminum alloy welds. Corros Sci 2000; 42: 17–33.10.1016/S0010-938X(99)00047-5Search in Google Scholar
Lankford J, Davidson DL. Fatigue crack micromechanisms in ingot and powder metallurgy 7xxx aluminum alloys in air and vacuum. Acta Metall Mater 1983; 31: 1273–1284.10.1016/0001-6160(83)90189-XSearch in Google Scholar
LexTech, Inc. Centerville, OH, USA. AFGROW. Fracture Mechanics and Fatigue Crack Growth Analysis Software, Retrieved from http://www.afgrow.net. Accessed 5 January 2015.Search in Google Scholar
Lidbury DPG. The estimation of crack tip strain rate parameters characterizing environment assisted crack growth. In: Gangloff RP, editor. Embrittlement by the localized crack environment. American Institute of Mining, Metallurgical and petroleum Engineers, 1983: 149–172.Search in Google Scholar
Lu G, Orlikowski D, Park I, Politano O, Kaxiras E. Energetics of hydrogen impurities in aluminum and their effect on mechanical properties. Phys Rev B 2002; 65: 064102 1-8.10.1103/PhysRevB.65.064102Search in Google Scholar
Lu G, Kaxiras E. Hydrogen embrittlement of aluminum: the crucial role of vacancies. Phys Rev Lett 2005; 94: 1–4.10.1103/PhysRevLett.94.155501Search in Google Scholar PubMed
Magnin T. SCC and CF modellings based on corrosion-deformation Interactions. In: Magnin T, editor. Advances in corrosion – deformation interactions. Mater Sci Forum, Trans Tech Publ., 1996; 202.10.4028/b-HTk8EUSearch in Google Scholar
Mason ME, Gangloff RP. Modeling time-dependent corrosion fatigue crack propagation in 7000 series aluminum alloys. In: Harris CE, editor. FAA/NASA international symposium on advanced structural. ASTM integrity methods for airframe durability and damage tolerance. USA: NASA Conference Publication 3274, 1994: 441–462.Search in Google Scholar
Moody NR, Stoltz RE, Perra MW. The relationship of grain size to critical distance and hydrogen-induced crack growth thresholds. Scr Metall Mater 1985; 20: 119–123.10.1016/0036-9748(86)90224-3Search in Google Scholar
Oriani RA. The diffusion and trapping of hydrogen in steel. Acta Metall Mater 1970; 18: 147–157.10.1016/0001-6160(70)90078-7Search in Google Scholar
Page RA, Gerberich WW. The effect of hydrogen source on crack initiation in 4340 steel. Metall Trans A 1982; 13: 305–311.10.1007/BF02643321Search in Google Scholar
Paris PC, Tada H, Zahoor Z, Ernst H. The theory of instability of the tearing mode of elastic-plastic crack growth. ASTM Int 1979: 5–36.10.1520/STP35825SSearch in Google Scholar
Polyanskii VM, Volkov NI, Gorodkova OM, Kopanov Yu N, Frol’tsova TA, Khailov AN. Creep of medium and high strength aluminum alloys at normal temperature in moist atmospheres. Strength Mater 1990; 22: 59–70. Translated from Problemy Prochnosti 1990; No. I: 50–58.10.1007/BF00774981Search in Google Scholar
Raetzer-Scheibe HJ, Tuck CDS. The polarisation and repassivation behaviour of the aluminium-zinc-magnesium-copper Alloy 7010. Corros Sci 1994; 36: 941–956.10.1016/0010-938X(94)90196-1Search in Google Scholar
Raicheff RG, Damjanovic A, Bockris JO’M. Dependence of the velocity of the anodic dissolution of iron on its yield rate under tension. J Chem Phys 1967; 47: 2198–2199.10.1063/1.1712258Search in Google Scholar
Rice JR, Drugan WJ, Sham T-L. Elastic-plastic analysis of growing cracks, ASTM STP 700. West Conshohocken, PA, USA: ASTM Int 1980: 189–221.10.1520/STP36972SSearch in Google Scholar
Rice JR. Mechanisms of crack tip deformation and extension by fatigue, ASTM STP 415. West Conshohocken, PA, USA: ASTM Int 1967: 247–311.10.1520/STP47234SSearch in Google Scholar
Rice RP, Sorensen EP. Continuing crack tip deformation and fracture for plane-strain crack growth in elastic-plastic solids. J Mech Phys Solids 1978; 26: 163–186.10.1016/0022-5096(78)90007-8Search in Google Scholar
Ruiz J, Elices M. The role of environmental exposure in the fatigue behaviour of an aluminium alloy. Corros Sci 1997; 39: 2117–2141.10.1016/S0010-938X(97)00095-4Search in Google Scholar
Scamans GM. Evidence for crack arrest markings on intergranular stress corrosion fracture surfaces in Al-Zn-Mg alloys. Metall Trans A 1980; 11A: 846–850.10.1007/BF02661215Search in Google Scholar
Scully JR, Young, GA Jr, Smith SW. Hydrogen solubility, diffusion and trapping in high purity aluminum and selected Al-base alloys. Mater Sci Forum 2000; 331–337: 1583–1600.10.4028/www.scientific.net/MSF.331-337.1583Search in Google Scholar
Smith SW, Scully JR. The identification of hydrogen trapping states in an Al-Li-Cu-Zr alloy using thermal desorption spectroscopy. Metall Mater Trans A 2000; 31A: 179–193.10.1007/s11661-000-0064-8Search in Google Scholar
Somerday BP, Young LM, Gangloff RP. Crack tip mechanics effects on environment-assisted cracking of beta-titanium alloys in aqueous NaCl. Fatigue Fract Eng M 2000; 23: 39–58.10.1046/j.1460-2695.2000.00243.xSearch in Google Scholar
Southwest Research Institute. San Antonio, TX, USA: NASGRO, Fracture Mechanics and Fatigue Crack Growth Analysis Software, Retrieved from http://www.swri.org/3pubs/brochure/d18/NASGRO/NASGRO.pdf. Accessed 5 May 2015.Search in Google Scholar
Symons DM. The effect of hydrogen on the fracture toughness of alloy X-750 at elevated temperatures. J Nucl Mater 1999; 265: 225–231.10.1016/S0022-3115(98)00888-5Search in Google Scholar
Turnbull A. Modeling of the chemistry and electrochemistry in cracks–a review. Corrosion 2001; 57: 175–189.10.5006/1.3290342Search in Google Scholar
Vashishta P, Kalia RK, Nakano A, Kaxiras AE, Grama A, Lu G, Eidenbenz S, Voter AF, Hood RQ, Moriarty JA, Yang LH. Hierarchical petascale simulation framework for stress corrosion cracking. J Phys 2008; Conference Series 125: 1–18.10.1088/1742-6596/125/1/012060Search in Google Scholar
Warner JS, Gangloff RP. Alloy induced inhibition of fatigue crack growth in age-hardenable Al–Cu alloys. Int J Fatigue 2012; 42: 35–44.10.1016/j.ijfatigue.2011.04.013Search in Google Scholar
Wriedt HA, Oriani RA. Effect of tensile and compressive elastic stress on equilibrium hydrogen solubility in a solid. Acta Metall Mater 1970; 18: 753–760.10.1016/0001-6160(70)90039-8Search in Google Scholar
Young GA, Scully JR. Hydrogen production, absorption and transport during environment assisted cracking of an Al-Zn-Mg-(Cu) alloy in humid air. In: Moody NR, Thompson AW, Ricker RE, Was GW, Jones RH, editors. Hydrogen effects on material behavior and corrosion deformation interactions. Warrendale, OH, USA: TMS, 2003: 893–907.Search in Google Scholar
©2015 by De Gruyter
Articles in the same Issue
- Frontmatter
- In this issue
- Editorial
- International Symposium on Environmental Damage Under Static and Cyclic Loads in Structural Metallic Materials at Ambient Temperatures III (Bergamo, Italy, June 15–20, 2014)
- Overviews and reviews
- U.S. Naval Aviation: operational airframe experience with combined environmental and mechanical loading
- Thirty-five years in environmentally assisted cracking in Italy: a point of view
- Fatigue and corrosion fatigue
- Transgranular corrosion fatigue crack growth in age-hardened Al-Zn-Mg (-Cu) alloys
- Effect of cyclic frequency on fracture mode transitions during corrosion fatigue cracking of an Al-Zn-Mg-Cu alloy
- Crack growth behavior of 4340 steel under corrosion and corrosion fatigue conditions
- Modeling of environmentally assisted fatigue crack growth behavior
- Factors influencing embrittlement and environmental fracture
- Pre-exposure embrittlement of an Al-Cu-Mg alloy, AA2024-T351
- Electrochemical approach to repassivation kinetics of Al alloys: gaining insight into environmentally assisted cracking
- Localized dissolution of grain boundary T1 precipitates in Al-3Cu-2Li
- Grain boundary anodic phases affecting environmental damage
- Defect tolerance under environmentally assisted cracking conditions
- Role of Mo/V carbides in hydrogen embrittlement of tempered martensitic steel
- Stress corrosion cracking
- The role of crack branching in stress corrosion cracking of aluminium alloys
- An atomistically informed energy-based theory of environmentally assisted failure
- Discrete dislocation modeling of stress corrosion cracking in an iron
- Quasi-static behavior of notched Ti-6Al-4V specimens in water-methanol solution
- Role of excessive vacancies in transgranular stress corrosion cracking of pure copper
- Multiscale investigation of stress-corrosion crack propagation mechanisms in oxide glasses
- Hydrogen assisted cracking
- Hydrogen effects on fracture of high-strength steels with different micro-alloying
- Environmentally assisted cracking and hydrogen diffusion in traditional and high-strength pipeline steels
- Multiscale thermodynamic analysis on hydrogen-induced intergranular cracking in an alloy steel with segregated solutes