
Electrochemical approach to repassivation kinetics of Al alloys: gaining insight into environmentally assisted cracking
-
Monica Trueba
Monica Trueba was born in Cuba (Havana) in 1970. She obtained the Bachelors degree in Chemistry in 1991 and the Masters degree in 2003 at the Faculty of Chemistry of the University of Havana. In this Faculty, she was junior/assistant professor from 1998 until 2004, teaching courses of physical chemistry and of applied statistics. The scientific interests were on electrochemistry of metallic/composite and polymeric materials, focused mainly to electrocatalysis of hydrogen evolution reaction and electro(nano)polymerization of conducting polymers. At the end of 2004, she transferred to Milan (Italy). She received her doctorate degree from the Università degli Studi di Milano in 2008, working in the Department of Chemistry on the corrosion and protection of Al alloys. Since then, she is a post-doc fellow in this university. Her research interests are principally focused on corrosion and protection of light alloys. Major efforts have been dedicated to the understanding of mechanisms governing corrosion and protection. She is author or co-author of more than 25 peer-reviewed papers and 30 oral communications. She is a member of the Italian Association of Metallurgy, of the American Chemical Society, and of the International Society of Electrochemistry.
 und
Stefano P. Trasatti
und
Stefano P. Trasatti
Stefano Trasatti is presently Assistant Professor in the Department of Chemistry of the University of Milan. He received a PhD in Industrial Chemistry in 1995. In the same year he was awarded the Oronzio De Nora prize in the field of electrochemistry. He worked in private companies from 1996 to 2002, where he was responsible for surface treatments (Henkel Surface Technologies) and material testing (Centro Sviluppo Materiali). Since returning to the Università degli Studi di Milano in 2002, he has established a thriving research group working on corrosion and electrochemistry, and related topics, presently composed of 3 research fellows, 2 PhD students and 1 Post-graduated student. He is the author of about 60 peer-reviewed papers, 70 conference proceedings, 70 technical papers and one patent in the field of applied electrochemistry and metallic corrosion. His research interests include protective coatings, active-to-passive alloys, corrosion monitoring and control, applied electrochemistry, development of bioelectrochemical systems.

Abstract
This work provides a broad overview of the systematic experimental studies conducted in our group to understand the factors governing the transition to a more occluded corrosion front during the repassivation of Al alloys, manifested by the appearance of an inflection during anodic polarization into the active region in NaCl solutions. The collected data and the derived empirical relationships enabled us to discern the thermodynamic and kinetic aspects controlling the transition to more occluded local damage. From the thermodynamic standpoint, the potential at the inflection, namely, the pit transition potential Eptp, can be considered as the thermodynamic driving force of Al dissolution in the acidified pit-like solution in contact with a freshly created surface. The associated current density iptp and the steepness of the potential decrease with current below Eptp are determined by interfacial electrochemical kinetics. More importantly, all these properties are influenced by electrochemical and metallurgical events, including residual stresses. These findings point to the electrochemical approach in combination with external mechanical load as a promising tool for investigating environmentally assisted cracking, in particular, crack nucleation and non-steady crack tip processes.
1 Introduction
A limited understanding of the relationships between material properties and performance represents an important technical barrier to the development of the aluminum technology and a vexed scientific issue. Advances in lightweight, cost-effective Al alloys products for structural applications in transportation depend mainly on the performance requirements of durability and damage tolerance. Environmentally assisted cracking (EAC), a localized deformation process accelerated by local corrosion in addition to mechanical load, has long been recognized as a major cause of structural failures (Sadananda & Vasudevan, 2011). Most typical environments induce wet corrosion, and mechanical stress (applied or residual) is inherent to any structural material. Thus, electrochemical performance is decisive for combined high corrosion resistance and high mechanical strength. EAC incorporates many factors and varies according to metal and specific operating conditions. Many different corrosion mechanisms can simultaneously operate in relation to thermochemical and stress-related conditions giving rise to stress corrosion cracking (SCC) and corrosion fatigue (CF). The interrelated processes are determined by the interfacial electrochemical kinetics, where load interactions with the local electrochemical environment govern ductility and toughness.
The basic mechanisms of EAC are still not fully understood, in particular, crack tip processes and relationships between non-steady-state crack growth and stress intensity (Sadananda & Vasudevan, 2011). Although electrochemistry has provided powerful tools for developing a fundamental understanding of corrosion phenomena, there is little experimental knowledge on repassivation mechanisms. The stable surface condition is a passive film, which is expected to form on the newly created surface (e.g. at a slip step promoted by the action of a tensile stress). However, the extent to which film formation occurs depends on interfacial reactions that are affected by electrochemical and metallurgical events (Scully, 1971). Notice the similarity with pitting nucleation, which principally depends on the rate at which the metal can dissolve once the passive film has failed locally.
It is widely recognized that EAC may proceed along grain boundaries (intergranular stress corrosion cracking [IGSCC]) or through the grains (transgranular stress corrosion cracking TGSCC), underlining the role of dissolution and of mechanical loading, respectively (Lynch, 2012). Pitting corrosion (or other forms of localized attack such as crevice, dealloying, and intergranular corrosion) is hard to predict or monitor and tends to trigger mechanical failures by CF or SCC. Pitting corrosion of Al-based alloys has been intensively investigated, mostly under the influence of chloride ions as aggressive species that constitute one of the most significant natural contaminants (Natishan & O’Grady, 2014). Many models based on different approaches have been proposed to explain and to predict passive film breakdown, pit initiation, and propagation (Abodi et al., 2012; Guseva, Schmutz, Suter, & von Trzebiatowski, 2009; Guseva, DeRose, & Schmutz, 2013; Lashgari, Kianpour, & Mohammadi, 2013; McCafferty, 2010; Natishan & O’Grady, 2014). Related studies on localized corrosion other than pitting, such as microstructural corrosion (Ralston et al., 2010; Sorriano, Oltra, Zimmer, Vuillemin, & Borkowski, 2013), intergranular corrosion (Augustin, Andrieu, Baret-Blanc, Delfosse, & Odemer, 2010; Lim, Scully, & Kelly, 2013; Zhang, Ruan, Wolfe, & Frankel, 2003), and (micro)galvanic corrosion (Deshpande, 2011; Murer, Missert, & Buchheit, 2013; Stenta et al., 2014), are scarce. Electrochemical characteristics for model alloys and simulated bulk precipitates have been reported (Birbilis & Buchheit, 2005; Lyndon, Gupta, Gibson, & Birbilis, 2013; Shi et al., 2014). The prediction of localized corrosion occurrence has been principally discussed on the basis of empirical approaches (Engelhardt & Macdonald, 2004; Jarrah et al., 2011).
Considering the numerous studies dedicated to localized corrosion phenomena, less work has been done on the passivation of active surfaces (Anderko, Sridhar, & Dunn, 2004; Broli & Holtan, 1973; Burstein & Cinderey, 1992; Cabot, Centellas, & Perez, 1993; Little, Connolly, & Scully, 2007; Moore, Sykes, & Grant, 2008; Nilsen & Bardal, 1977; Nisancioglu & Holtan, 1978a,b; Pride, Scully, & Hudson, 1994; Raetzer-Scheibe & Tuck, 1994; Yasuda, Weinberg, & Tromans, 1990; Zhang et al., 2003). Film formation and film fracture are crucial steps during stress corrosion crack propagation, highlighting the significance of repassivation kinetics. In this respect, single-cycle anodic polarization, herein called pitting scan (PS) (Figure 1), has provided quite useful information. The width of the hysteresis loop ΔE=|Epit-Eprot| maybe indicative of the difficulty for the simultaneous repassivation of all corroded surfaces. As opposed to iron-based alloys (Wilde & Williams, 1971), the estimation of susceptibility to localized corrosion of Al alloys by ΔE has been argued. Broli and Holtan (1973) have obtained no difference between Epit and Eprot for unalloyed Al in deaerated 3% NaCl solution using the stationary potentiokinetic method, i.e. a stepwise change of potential where each potential is kept until a constant current is established. Nilsen and Bardal (1977) have reported closely equal ΔE values for 1000, 3000, 6000, and 5000 series Al alloys in air-saturated artificial sea water. However, Nisancioglu and Holtan (1978a,b) have emphasized PS as a method for determining characteristic potentials such as Epit and Eprot. In addition, the inflection in the reverse curve (Figure 1) of commercially pure Al in NaCl solutions has been considered as an indication of a transition from macroscopic to crystallographic more occluded corrosion front (Nisancioglu & Holtan, 1978a,b). The Tafel behavior of the polarization response after the inflection, indicating nearly constant active area in the given potential range, was associated with a stepwise propagation of crystallographic pits on very narrow fronts with a sequence of active tip-passive walls. Yasuda et al. (1990) have found that the potential at the inflection, designated as pit transition potential (Eptp) (Figure 1), is independent of the original surface orientation and the amount of pit growth for Al single crystals in 0.5 m NaCl. Only the associated current density (iptp) was shifted to higher values and Eprot to more negative potentials by promoting pit growth. He proposed that the inflection is related to repassivation events in the pit cavity, being virtually indistinguishable for small and shallow pits. Taking into account the morphology of deep pits, often laterally undermined with the mouth narrower than the pit cavity, constricted pit geometry limits mass and charge transfer and produces an ohmic potential drop between the local cell in the pit cavity and the outer bulk solution. Experimental evidence of the inflection associated to a transition from macro- to microcorrosion fronts, in particular, from pitting to one-dimensional tunneling, has been provided for Al 5083 and Al-Mg-Li alloys by Moore et al. (2008). The authors proposed that a concentration gradient within a tunnel drives mass transport during growth and is possible only after pit cavity repassivation. Splitting into active and passive regions in the pitting-to-tunneling transition of Al has been considered earlier by Newman (1995). The analytical approach showed that the time for tunnels to become independent one-dimensional pits is lower than that for pit solution dilution, leading to complete repassivation. Thus, if the potential falls below the value where the surface solution chemistry is exactly at the critical value for repassivation, the tunneling regime can be easily attained. Zhang and Frankel (2003) have proposed a transition from pitting to intergranular corrosion (IGC), causing the inflection at potential values close to Epit for Al 2024-T3 in 1 m NaCl. No inflection was detected in mixed solutions of 1 m NaCl and 0.2 m NaNO3. To our knowledge, the occurrence of an inflection for 7000 series alloys has been reported for Al 7010 (peak-aged and overaged conditions) in mixed solutions of NaCl and Na2CrO4 (pH 3) (Raetzer-Scheibe & Tuck, 1994). Little et al. (2007) have found that the transition is sensitive to artificial aging of Al-Cu-Mg-Ag in alkaline 0.6 m NaCl (pH 10). The decrease in the difference between the potential at the inflection and the repassivation potential of pure Al (99.99%) with increasing aging time correlated with an improvement in IGSCC, as determined by constant extension rate testing (CERT). In systematic corrosion studies of Al 6061 as a function of solution pH and chloride concentration (Zaid, Saidi, Benzaid, & Hadji, 2008) of nanocrystalline and conventional Al 5083 in 0.5 m NaCl, as well as in mixed solutions of 0.1 m NaCl and 0.5 m Na2SO4 (Kus, Lee, Nutt, & Mansfeld, 2006), and very recently of fine grained Al (99.1%) in 3% NaCl (Jilani, Njah, & Ponthiaux, 2014), the inflection has been systematically detected but has attracted little attention. For the latter material, equal channel angular pressing was used for grain refinement. The reverse curves showed an inflection for specimens submitted to higher levels of accumulated strains (repeated pressing). The effect of residual elastic compressive stress on IGC of Al 2024-T3 in 1 m NaCl has been investigated by PS using a microcapillary cell (Liu & Frankel, 2006). Less marked inflection with no change of Eptp (≅Epit) but with a shift to smaller current densities (≅ip) was obtained for the stressed specimen. A study of the combined influence of tensile stress and chemical environment on the pitting susceptibility of Al (99.999%) by integrating open circuit potential measurements and electrochemical repassivation modeling has been reported recently (Mi, Lakhera, Kouris, & Buttry, 2012).
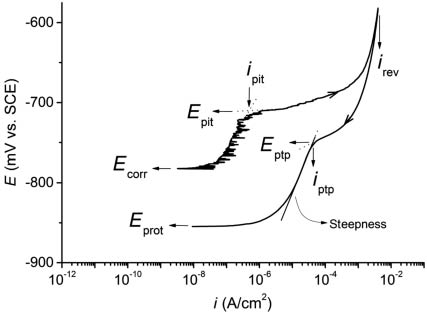
Schematic representation of characteristic parameters of pitting and repassivation processes: Ecorr, potential after 10 min of conditioning at open circuit; Epit and ipit, potential and current density of pitting onset; Eptp and iptp, pit transition potential and the associated current density at the inflection in the reverse scan; Eprot, protection potential; irev, current density limit of the forward scan; steepness, potential decrease with current below the inflection. The curve corresponds to experimental PS (10 mV/min) of polished Al 6082-T6 (Cicolin, Trueba, & Trasatti, 2014, reproduced with permission of Elsevier).
The different experimental conditions in terms of Al-based alloys composition and microstructure, and other factors such as surface state condition (e.g. polished, scratched), test solution composition (chloride concentration, pH, O2, etc.), temperature, among other, as well as time effects related to the duration of the corrosion test encompassing sample preparation and storage, manipulation times, equilibration times prior to polarization, and scan rate, make a comparative analysis difficult. In addition, the current density at the inflection (Figure 1) has been less considered, and Eptp has been designated as true protection potential (Ep1) (Nisancioglu & Holtan, 1978a,b), transition potential (ET or Etrans) (Moore et al., 2008; Pride et al., 1994), and repassivation potential of Al matrix (Erp) (Little et al., 2007). The chemical-physical meaning of this electrochemical property is not yet clear, although the inflection seems to be related to equilibrium-limited local cell reactions favoring transition to a microcorrosion front rather than repassivation. The associated current density (iptp) and the steepness of the potential decrease with current after the inflection merit more attention as valuable information on the repassivation kinetics can be obtained (see next section).
This work provides a broad overview of the systematic experimental studies conducted in our group (Cicolin et al., 2014; Comotti, Trueba, & Trasatti, 2013; Melilli, Trueba, & Trasatti, 2014; Trueba & Trasatti, 2010) to understand the factors governing the appearance of an inflection in the polarization curve of Al-based alloys in the active region (Figure 1). Commercially available wrought Al alloys of dissimilar susceptibility to localized corrosion were submitted to single-cycle anodic polarization in NaCl solutions. Different experimental conditions were explored, namely, surface state condition, corrosion extent, test solution composition, scan rate, and age hardening. The collected electrochemical data and the derived empirical relationships are interpreted in combination with corrosion morphology analysis.
2 Materials, experimental conditions, and data processing
Material used were sheets (1.5–2 mm) of commercial wrought 1050-O, 1050-H24, 6082-T6, 5754-H111, 5083-H111, 2024-T3, and 7075-T6 Al alloys (AVIOMETAL S.p.a, Varese, Italy), whose nominal chemical compositions are given in Table 1. Rectangular surfaces (20×30 mm) were wet ground with abrasive silicon-carbide paper up to 1200 grit, finally cleaned in an ultrasonic bath for 15 min with ethanol, dried in a stream of warm air, and stored in a desiccator overnight. Before use, the specimens were polished with a 3-μm cloth using ethanol and cleaned as indicated previously. Some specimens were used as received, but additional experiments were conducted using thermally treated specimens in the case of Al 7075 and Al 2024, based on reported thermal processes (Little et al., 2007; Zhao & Frankel, 2007a,b).
Chemical composition (wt%) of commercial wrought Al alloys.
| Al alloys | Si | Fe | Cu | Mn | Mg | Zn | Ti | Cr |
|---|---|---|---|---|---|---|---|---|
| 1050-O | 0.25 | 0.40 | 0.05 | 0.05 | 0.05 | 0.07 | 0.05 | <0.03 |
| 1050-H24 | 0.14 | 0.25 | <0.01 | 0.01 | <0.01 | <0.01 | 0.01 | <0.01 |
| 6082-T6 | 0.90 | 0.36 | 0.04 | 0.56 | 1.00 | 0.02 | 0.02 | 0.04 |
| 5754-H111 | 0.08 | 0.26 | 0.03 | 0.18 | 2.73 | 0.01 | <0.01 | 0.05 |
| 5083-H111 | 0.17 | 0.32 | 0.04 | 0.62 | 4.32 | 0.03 | 0.02 | 0.07 |
| 2024-T3 | 0.15 | 0.25 | 4.67 | 0.63 | 1.34 | 0.02 | 0.06 | 0.01 |
| 7075-T6 | 0.04 | 0.13 | 1.60 | 0.02 | 2.52 | 5.90 | <0.01 | 0.19 |
Test solutions of NaCl (Aldrich) were prepared with reagent-grade (98%) or analytical-grade (99.5%) salts and water of quality MilliQ. Chloride concentrations of 0.1, 0.3, and 0.6 m and pH values between 2 and 11 adjusted with 0.1 m HCl (37%, Aldrich) or 0.5 m NaOH (>97%, Aldrich) addition were investigated. Nitrogen and oxygen-saturated solutions were obtained by 20-min bubbling with pure gases (>99.9%, Sapio, Monza, Italy) through a tube with fritted Pyrex glass crucible.
Electrochemical measurements were performed at room temperature in a single-compartment O-ring cell with the working electrode surface (typically 1 cm2) positioned upward or at one side of the cell. For experiments with N2 and O2 saturated stagnant solutions, the gas inlet tube was placed just above the liquid/gas interface. A Pt spiral wire as a counterelectrode and a Haber-Luggin capillary reference probe with a saturated calomel electrode (SCE) were used. Unless otherwise stated, PS was recorded at a scan rate of 10 mV/min after 10 min equilibration at open circuit potential. The scan was reversed into the active direction as the anodic current reached a preselected limiting value (irev). The experiment was terminated when the current became cathodic. Experimental data were collected by PC-driven potentiostats Solartron 1286 (Hampshire, UK), Gamry Reference 600 (Gamry Instruments, Warminster, PA, USA), and PAR 273A (EG&G Princeton Applied Research, Oak Ridge, TN, USA). At least three repeated experiments were conducted with freshly prepared alloy surfaces with a careful control of time-consuming manipulation.
Representative samples of each set of repeated experiments were cleaned with MilliQ water and ethanol (>99.8% Aldrich) in an ultrasonic bath. The cross sections were mounted in a cold-working resin and polished up to 1 μm with diamond paste using ethanol. For examination at the metallographic microscope (Nikon Eclipse MA200, Nikon Instruments, Inc.), the sections were etched to reveal grain border attack, according to standard procedures (ASM Handbook, 1985). Selected samples were analyzed with LEO 1430 scanning electron microscope (SEM) equipped with an EDX spectrometer (Zeiss, Oberkochen, Germany) at a chamber pressure of 8×10⁻⁶ torr and 20 keV accelerating voltage.
Graphical and quantitative analyses of the experimental data were conducted using OriginPro 9.0 program (OriginLab, Northampton, MA, USA). Average PS curves of repeated tests were calculated for each experimental condition. The values of the characteristic electrochemical parameters were obtained from each experimental curve (Figure 1) (for more details, see Cicolin et al., 2014; Comotti et al., 2013). The steepness was calculated by linear regression (R2>0.98) using a Tafel-type equation (E=c+m log i). For each group of data, the analysis of variance (ANOVA, 95% confidence level) was used to determine statistics such as mean, standard deviation, and standard error and to quantify the effect of a given experimental variable (factor) on the above-mentioned characteristics (dependent variable). When possible, empirical relations were derived using Origin built-in functions.
3 Results and discussion
3.1 The width of the hysteresis loop and the inflection in the reverse curve of a PS
Figure 2 reports ΔE values for the investigated Al alloys, determined from PS in 0.6 m NaCl (pH 6.5) using different experimental conditions: as-received and polished surfaces, N2 and air saturated solutions, and extent of promoted corrosion (irev of 1 and 5 mA/cm2) (Comotti et al., 2013; Trueba & Trasatti, 2010). For a given Al alloy, ΔE increases with irev regardless of the surface state condition and the presence of additional cathodic reactant, more importantly for Al 2024-T3 and Al 7075-T6. The comparison of different materials indicates similar ΔE values in the presence of dissolved oxygen for 1000, 6000, and 5000 series Al alloys, in agreement with the findings of Nilsen and Bardal (1977). ΔE is more sensitive to the experimental conditions for Al 2024-T3 and Al 7075-T6, conversely to the other series alloys, indicating some correlation with the susceptibility to localized corrosion. Nevertheless, the mere analysis of ΔE without considering the features of the reverse curve does not provide explanation of different behaviors, also as a function of the experimental conditions. The increase of this magnitude may be caused by the occurrence of an inflection during polarization into the active region, with the consequent shift of Eprot to more negative values (Figure 1) (Comotti et al., 2013; Trueba & Trasatti, 2010).
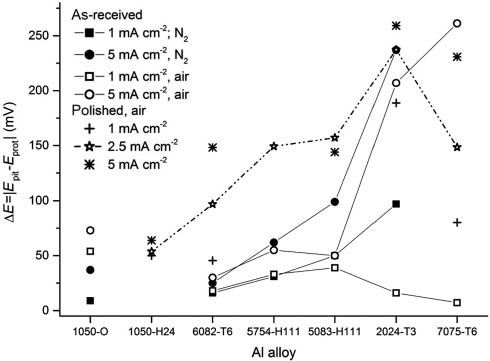
ΔE values for different Al alloys determined from PS (10 mV/min) in 0.6 m NaCl (pH 6.5) using different experimental conditions: as-received and polished surfaces, N2 and air saturated solutions, and extent of promoted corrosion (irev of 1–5 mA/cm2).
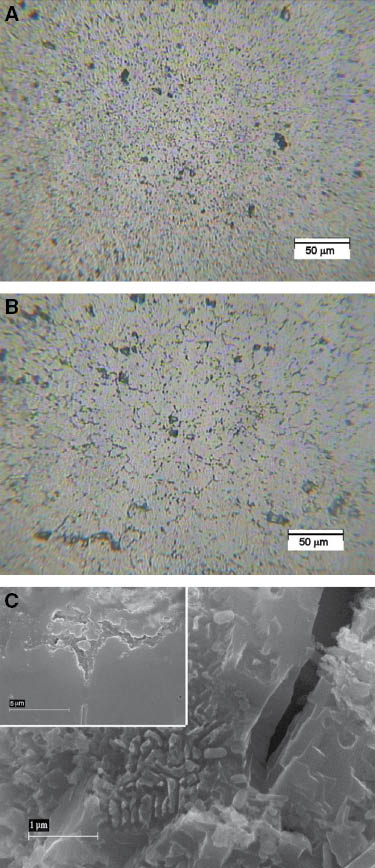
Figure 3A–C shows the average PS of polished Al 6083-T6, Al 2024-T3, and Al 7075-T6, obtained in 0.6 m NaCl (pH 6.5) using different current density limits for scan reversal (irev between 0.1 and 5 mA/cm2) (Comotti et al., 2013). Note the similarity of the forward curves, characterized by a rapid increase of the current at Epit. The inflection, instead, is more or less pronounced depending on Al alloy and on the extent of promoted corrosion (irev). Al 7075-T6 shows two breakdown potentials (Epit1≅Ecorr and Epit2>Epit1), typically reported for the peak-aged condition of this alloy using polished surfaces (Zhao & Frankel, 2007a,b) as well as a second inflection at more negative potentials for irev≥3.25 mA/cm2. The variation of iptp with irev seems to be more important than that of Eptp, whereas this potential is always close to Epit, as reported in other works (Moore et al., 2008; Yasuda et al., 1990). For commercially pure Al 1050, the inflection was always indistinguishable, regardless of the surface state condition (polished and covered with the native Al oxide layer) and the temper (O and H24), although the morphology of attack consistently differs (Figure 4A–C). Crystallographic pitting prevails for polished surfaces, whereas hemispherical etched pits at the metal/film interface were promoted for as-received Al 1050, respectively. For the other alloys, SEM analysis showed constricted localized attack other than pitting (Figure 4D–K). In the case of Al 6082-T6, IG corroded paths in the alloy bulk beneath a corrosion film are promoted with irev=1 mA/cm2 (Figure 4D) because of the selective dissolution of unbalanced Mg2Si (Comotti et al., 2013) along grain boundaries, leaving behind discrete silicon-rich particles (Figure 4E). This may explain the knife-edge type of IG attack for higher irev (Figure 4D, inset), suggesting environmentally induced IGSCC due to the weakening of the grain boundaries as Si-rich particles formed. In the case of high-strength Al 2024-T3 and Al 7075-T6, transitions from IGC to microstructural pitting (Figure 4G–I) and to brittle fracture (Figure 4J and K), respectively, are promoted with irev. For the latter substrate, the transition correlates with the occurrence of the second inflection for irev≥3.25 mA/cm2 (Figure 3C) (Comotti et al., 2013). Fissures along grain boundaries indicate TGSCC induced by stress concentration at the tip of narrow IG corroded paths that acts to pull the metal apart. Increasing stress concentration with fissures growth promotes plastic deformation at the tip bottom and brittle failure.
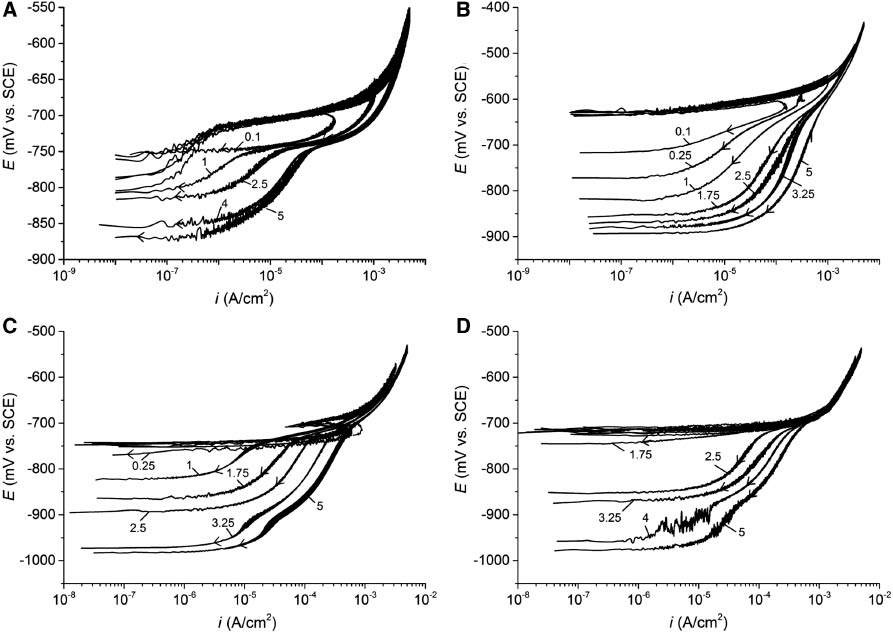
Average PS (10 mV/min) as a function of irev for (A) polished Al 6082-T6, (B) polished Al 2024-T3, and (C, D) polished and as-received Al 7075-T6, in air-saturated 0.6 m NaCl (pH 6.5). The reverse curves are indicated with arrows. Numbers correspond to the anodic current limit (irev) in mA/cm2 (Comotti et al., 2013, reproduced with permission of John Wiley & Sons).
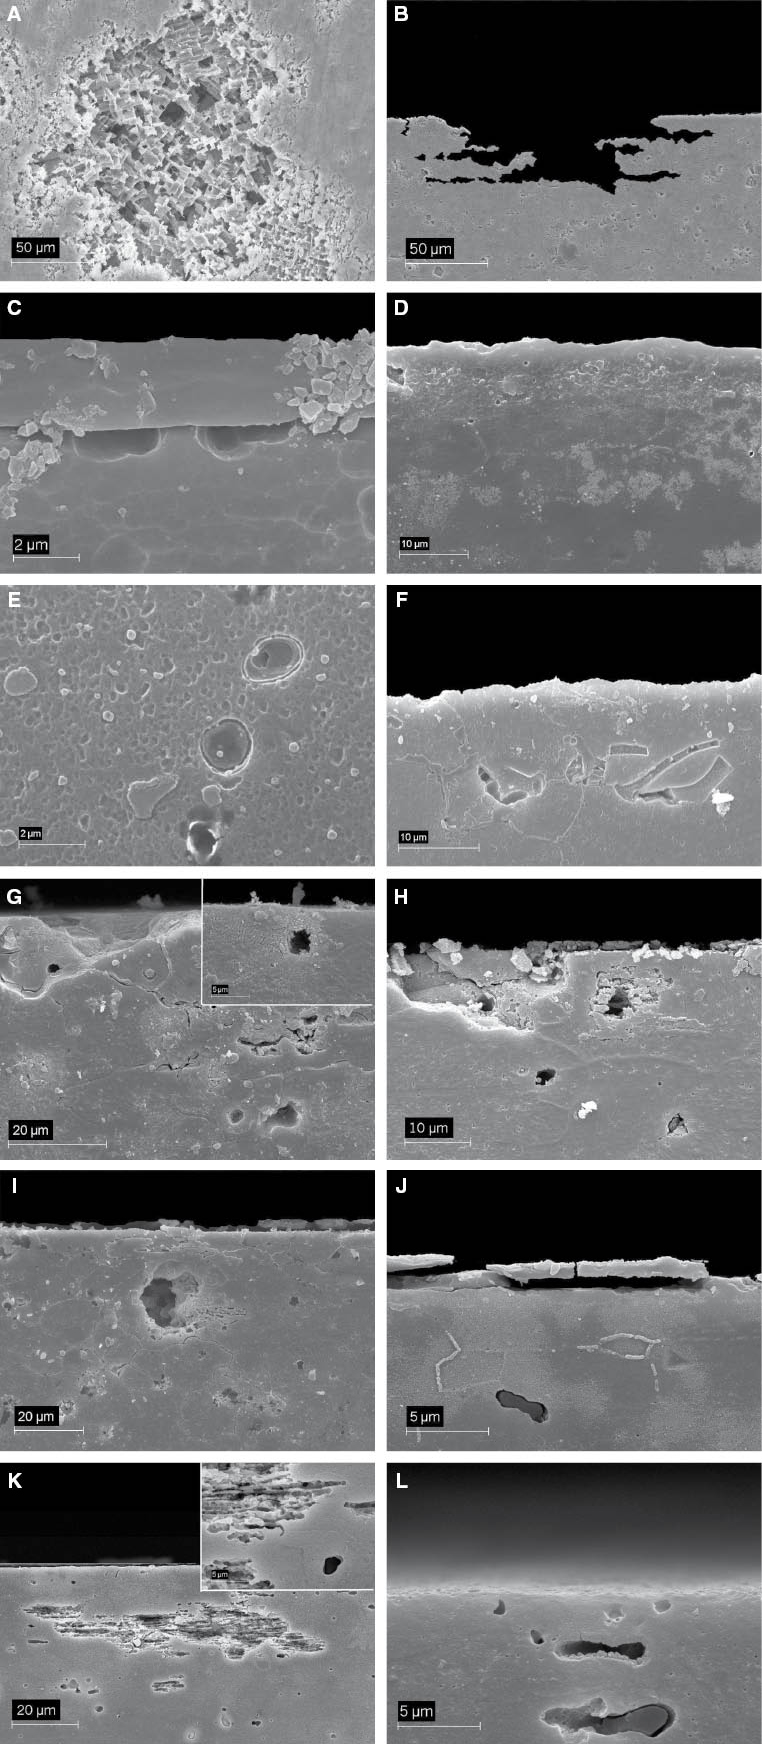
Corrosion morphology of Al alloys after PS (10 mV/min) in air-saturated 0.6 m NaCl (pH 6.5): (A, B) Al 1050-H24 (polished), irev of 4 and 2.5 mA/cm2, respectively; (C) Al 1050-H24 (as-received), irev=5 mA/cm2; (D–F) Al 6082-T6 (polished), irev of 1, 2.5, and 5 mA/cm2; (G–I) Al 2024-T3 (polished), irev of 1, 2.5, and 5 mA/cm2; (J, K) Al 7075-T6 (polished), irev of 2.5 and 5 mA/cm2; (I) Al 7075-T6 (as-received) irev of 5 mA/cm2 (Comotti et al., 2013, reproduced with permission of John Wiley & Sons).
The above-mentioned analyses indicate that the inflection is not only determined by the degree of constriction of pit cavities. Interdependent microstructural and local environment interfacial interactions play a more important role. This consideration is supported by the similar features of the reverse curves of polished and as-received Al 7075-T6 (Figure 3C and D). Although the latter substrate shows only one breakdown in the forward curve, i.e. in the presence of the native Al oxide layer, the potential values at the inflections are closely equal, and fissures along grain boundaries are promoted with irev (Figure 4L). Furthermore, for as-received 5000 series Al alloys, Al 5754-H111 showed a marked inflection in both N2 and air-saturated solutions, different from Al 5083-H111 with indistinguishable inflection in the presence of dissolved oxygen (Trueba & Trasatti, 2010). Corrosion morphology analysis indicated that IGSCC is related to the β-phase (Al3Mg2) at grain boundaries, which acts as a catalyst for crack growth through anodic dissolution, reduction, and ingress pathway for H atoms (Jones, Baer, Danielson, & Vetrano, 2001; Oguocha, Adigun & Yannacopoulos, 2008). β-Phase does not need to be continuous to provide a path for crack propagation, which is the case of Al 5754-H111 presenting fine-grained structure with more discontinuous β-phase (Al3Mg2) precipitates along gain boundaries as compared to Al 5083-H111 (Figure 5A and B) (Trueba & Trasatti, 2010). For this alloy, oxygen-induced alkaline corrosion promotes crevice-like pits and also the precipitation of discrete rodlike β-phase particulate (Figure 5C) (Lyndon et al., 2013; Scamans, Holroyd, & Tuck, 1987), which is beneficial for hydrogen discharge.
Microstructure and corrosion morphology of 5000 series Al alloys. (A, B) Images at the metallographic microscope of as-polished Al 5754-H111 and Al 5083-H111 surfaces after etching with 10% H3PO4 at 60°C; (C) SEM image showing discrete rodlike β-phase particulate (Al3Mg2) on the surface of Al 5083-H111 after PS in air-saturated 0.6 m NaCl (pH 6.5), using as-received specimens and irev=5 mA/cm2, inset – cross-sectional SEM image showing a crevice-like pit (Trueba & Trasatti, 2010, reproduced with permission of Elsevier).
3.2 Effect of corrosion extent
From the characteristic electrochemical parameters of the PS (Figure 3), empirical relationships as a function of corrosion extent (irev) were determined with statistical significance (Comotti et al., 2013). Concerning the characteristic potentials Epit, Eptp, and Eprot, Figure 6A shows an irev-independent Eptp in the case of Al 6082-T6 that differs from Epit by approximately 35 mV, whereas Eprot decreases linearly with irev with 27 V/Acm-2 slope. Conversely, Eptp shifts linearly with 5 V/Acm-2 slope toward Epit, and Eprot decreases exponentially with irev in Al 2024-T3 (Figure 6B). A linear increase of Eptp1 with similar slope (8 V/Acm-2), in between Epit1 and Epit2, and an exponential decay of Eprot with irev are obtained also for Al 7075-T6 (Figure 6C). The significant variation of Eprot between irev of 2.5 and 3.25 mA/cm2 is due to the occurrence of the second inflection at Eptp2 (Figure 3C), which is however irev independent (914±1 mV) (Comotti et al., 2013). A similar result was obtained for as-received Al 7075-T6. In addition, reverse curves recorded for Al 7075-T6 after potentiostatic prepolarization at -700, -600, and -500 mV (versus SCE) (Figure 7A) resemble closely those shown in (Figure 3C). Eptp shifts linearly to less negative potentials as a function of irev with similar slope values (irev is taken as the current density value at the beginning of potentiodynamic polarization) (Figure 7A, inset) (Melilli, 2013). Because the second transition becomes important with brittle fracture, additional resistance due to proton reduction in occluded cavities at very negative potential is more likely. The closely equal behavior of Al 7075-T6, as well as the small difference of Eptp values (≅10 mV) for Al 6082-T6 and Al 2024-T3, regardless of the surface state condition, provides the confirmation of Eptp as a characteristic of Al alloy matrix and not as the conventional repassivation potential (Little et al., 2007; Moore et al., 2008). Surface state condition principally influences the inflection position along the current density axis. More importantly, the variation of Eptp with irev for Al 2024-T3 and Al 7075-T6, in contrast to Al 6082-T6, supports Cu depletion controlling crack tip electrochemistry as opposed to an active precipitate phase as the critical feature (Figure 4) (Knight, Birbilis, Muddle, Trueman, & Lynch, 2010; Wall & Stoner, 1997).
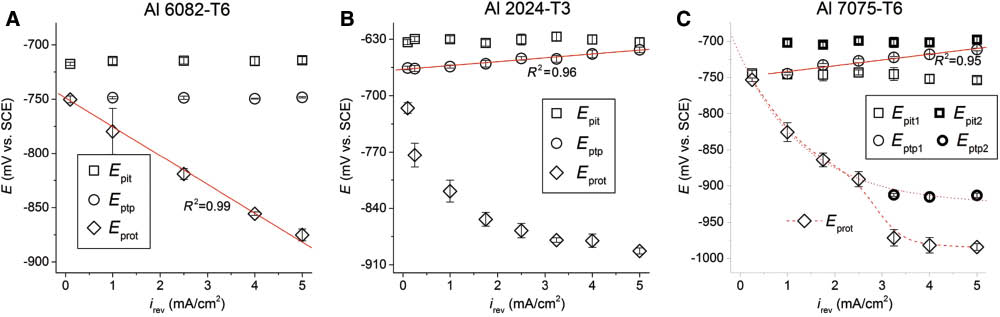
Relationships between average characteristic potentials and irev for polished substrates of: (A) Al 6082-T6, (B) Al 2024-T3, and (C) Al 7075-T6; determined from PS (10 mV/min) in stagnant, air-saturated 0.6 m NaCl (pH 6.5) (Comotti et al., 2013, reproduced with permission of John Wiley & Sons).
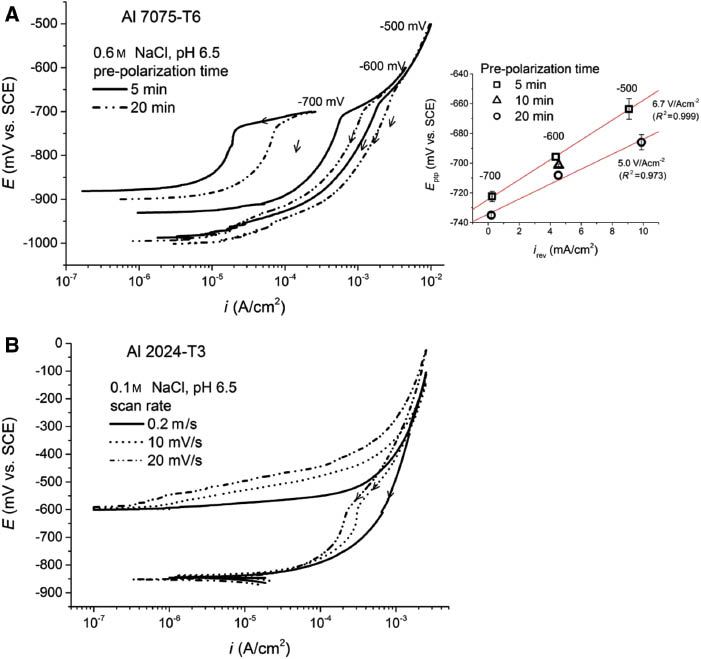
Effect of potentiostatic polarization and scan rate on the inflection during potential scan into the active region. (A) Reverse curves (10 mV/min) in air-saturated 0.6 m NaCl (pH 6.5) of polished Al 7075-T6 after potentiostatic prepolarization at E≥Epit2 in the test solution. Inset – relationships between Eptp and irev (≅current at the beginning of the potentiodyamic polarization into the active region). (B) PS (irev=2.5 mA/cm2) of polished Al 2024-T3 recorded at different scan rates in stagnant, air-saturated 0.1 m NaCl (pH 6.5).
The kinetics of repassivation are evaluated from semilogarithmic relationships between the steepness below the inflection and iptp (Figure 8). The steepness increases linearly for Al 6082-T6 and Al 2024-T3. However, a slope change is evident for the latter alloy for irev≥2.5 mA/cm2. In the case of Al 7075-T6, the steepness reaches a threshold value (≅200 mV/dec). The plateau-like response correlates with stress-independent corrosion due to stress relaxation by brittle fracture (Holroyd, 1990), which was produced at higher irev (Figure 4K). A constant steepness of approximately 200 mV/dec with fissure growth (irev≥2.5 mA/cm2) was obtained also for as-received Al 7075-T6 (Comotti et al., 2013) (Figure 4L). By extrapolation to 0 mV/dec of steepness, an indistinguishable transition with Eptp≅Eprot (Figure 1) is indicated for iptp≅10-7–10-6 A/cm2 (arrows in Figure 8), wherein these values are typical of the passive region. It must be pointed out that the semilogarithmic plots of the steepness as a function of irev are meaningless because extrapolation to irev=0 gives either positive or negative steepness with no physical meaning (Comotti et al., 2013). The similarity of the steepness variation with log iptp to that of crack growth rate as a function of stress intensity factor for Al 6151-T6 (Li, Wang, Ren, Chen, & Mu, 2012), Al 2024-T3 (Henaff, Menan, & Odemer, 2010), and Al 7075-T6 (Holroyd, 1990) in 3.5% NaCl is noteworthy. The Tafel-type behavior of the polarization response below Eptp can thus be associated with a periodic active/passive sequence involving dissolution/passivation/film rupture because of the local action of the corrosive medium with possible competition of hydrogen production/uptake. Differently from Al 6082-T6 and Al 7075-T6, as well as Al 5083-H111, the PS response of Al 2024-T3 is more sensitive to experimental conditions when the amount of promoted corrosion is small (Figure 2) (Comotti et al., 2013; Trueba & Trasatti, 2010). In addition, some effect of local deformation on localized attack propagation was indicated by experiments conducted using different scan rates (Henaff et al., 2010; Melilli, 2013). In particular, the inflection is more pronounced as the scan rate increases, more importantly in diluted NaCl (Figure 7B), and contrary to the behavior of Al 7075-T6 and Al 5083-H111. The effect of the scan rate could be related to the selective dissolution of S-phase (Al2CuMg) precipitates, leading to the formation of Cu-rich layer. If dealloying of S-phase is significant, local cathodic corrosion of the matrix would be enhanced because of Cu enrichment, thus encouraging the formation of solid corrosion products at the bottom of cavities. A peak in the current in the reverse curves of Al 6082-T6 in alkaline NaCl (pH 11.5) under continuous bubbling of O2 showed a correlation with the onset of crevice corrosion by O2 depletion after cavity repassivation (Cicolin et al., 2014).
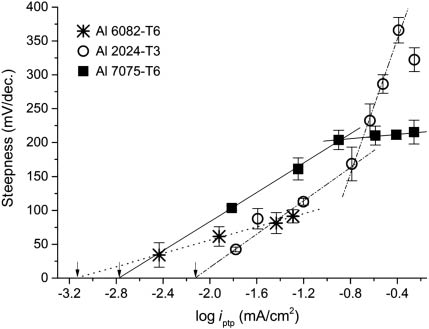
Relationships between average steepness and log iptp for polished Al 6082-T6, Al 2024-T3, and Al 7075-T6; determined from PS (10 mV/min) in stagnant, air-saturated 0.6 m NaCl (pH 6.5) using different irev (Figure 3) (Comotti et al., 2013, reproduced with permission of John Wiley & Sons).
3.3 Effect of test solution composition
From the systematic studies of polished Al 6082-T6 repassivation behavior (irev=2.5 mA/cm2) as a function of chloride concentration [Cl-] and solution pH (2–11.5), as well as under continuous bubbling of oxygen (Cicolin et al., 2014), Eptp is pH independent and tends to Epit by decreasing solution pH and [Cl-] concentration (Figure 9), which correspond closely to acidified pit-like solution. Although Epit shifts to more positive values with log [OH-], the variation is negligible as compared to that reported for iron with pH>10 (slope of 18 mV) because of the external pH contribution buffered by the various hydrolysis steps of Al3+ (Galvele, 1976, 1981). Similarly, iptp changes mainly with [Cl-] (Figure 10A), but values are much higher in 0.1 m NaCl for pH between 4 and 9, corresponding to the pH range of aluminum hydroxide stability. Because the critical pit chemistry is always concentrated, the mass flux out of the pit is promoted in concomitance with cavities opening toward the outer surface by increasing [Cl-]. Thus, the critical concentration for sustaining occluded chemistry decreases, and the dilution of pit cavity solution is more favored (Cicolin et al., 2014). According to these results, Eptp can be considered as the thermodynamic driving force of Al dissolution on freshly created surface rather than on initially passivated surface (Epit). Similarly, iptp can be considered proportional to the rate at which hydrolysis equilibrium is reached, represented by the following general equation to account for the contribution of the OH- at pH higher than 7 (Galvele, 1981):
![Figure 9:
Relationships between average Epit and log [OH-] for polished Al 6082-T6 determined from PS in stagnant, air-saturated NaCl solutions with different concentrations (A–C). Average Eptp values are included for clarity (see the text) (Cicolin et al., 2014, reproduced with permission of Elsevier).](/document/doi/10.1515/corrrev-2015-0054/asset/graphic/j_corrrev-2015-0054_fig_027.jpg)
Relationships between average Epit and log [OH-] for polished Al 6082-T6 determined from PS in stagnant, air-saturated NaCl solutions with different concentrations (A–C). Average Eptp values are included for clarity (see the text) (Cicolin et al., 2014, reproduced with permission of Elsevier).
![Figure 10:
Relationships between (A) iptp and log [OH-] for different [Cl-] and (B) log iptp and log [Cl-] for different pH levels, determined from PS (10 mV/min) in stagnant, air-saturated solutions for polished Al 6082-T6 (Cicolin et al., 2014, reproduced with permission of Elsevier).](/document/doi/10.1515/corrrev-2015-0054/asset/graphic/j_corrrev-2015-0054_fig_028.jpg)
Relationships between (A) iptp and log [OH-] for different [Cl-] and (B) log iptp and log [Cl-] for different pH levels, determined from PS (10 mV/min) in stagnant, air-saturated solutions for polished Al 6082-T6 (Cicolin et al., 2014, reproduced with permission of Elsevier).
In the presence of Cl-, the reaction of H2O with AlCl2+ and Al(OH)Cl+ intermediates produces relatively stable Al(OH)2Cl, which is the initial solid phase leading to the formation of mononuclear and polynuclear species by Al3+ hydrolysis (Galvele, 1976, 1981; Guseva et al., 2009). The nature of the prevailing species depends on Al3+ concentration and solution pH.
Linear relationships with negative slopes for log (iptp) as a function of log [Cl-] at all pH are shown in Figure 10B. The absolute slope values are similar to reaction orders (n) with respect to Cl- for pit initiation of Al alloys in 0.1–3 m KCl solutions at different pH levels (n between 1 and 2), which were determined from logarithmic relationships between the reciprocal of the induction time (rate of pit initiation) and [Cl-] (Natishan & O’Grady, 2014). Such reaction orders suggest transitory stable covalent compounds like Al(OH)2Cl and Al(OH)Cl2, as in diluted acidified pit-like solution. The presence of these species weakens the passive film and promotes further pit nucleation or localized attack reactivation at the transition onset.
The effect of [Cl-] on the repassivation behavior (irev=2.5 mA/cm2) of polished Al 5754-H111, Al 5083-H111, Al 2024-T3, and Al 7075-T6 is summarized in Figure 11 (Melilli, 2013; Melilli et al., 2014). Points missing in the figure correspond to conditions with indistinguishable inflection in the reverse curve. Al 7075-T6 substrates showed two breakdown potentials and only one inflection at potentials close to Epit1 (Figure 3C, irev=2.5 mA/cm2), independent of the [Cl-]. In the case of Mg-rich Al 5754-H111 and Al 5083-H111, two inflections were detected in the reverse curves (Melilli, 2013), the second inflection being more marked. For both alloys, the first transition at Eptp1≅Epit and the second one at Eptp2 just below Epit shifted in concomitance with Epit to less negative values by increasing [Cl-] (Figure 11A). The same result was obtained for Eptp and Epit of Al 2024-T3 and Al-7075-T6 (Figure 11A), as well as for Al 6082-T6 (Cicolin et al., 2014). Although the corrosion morphology evolution with [Cl-] of the former alloys was similar to that shown in Figure 4G–K, transitions from IGC to crystallographic pitting and to crevice corrosion, respectively, were obtained with Mg-rich alloys (Melilli, 2013). Pitting corrosion was promoted with [Cl-] in the case of Al 6082-T6 as well (Cicolin et al., 2014). The quite similar electrochemical behavior of 5000 and 6000 series alloys is indicated further by the comparison of Eptp and Epit (Cicolin et al., 2014; Melilli, 2013). Eptp2 is shifted below the corresponding Epit by 30–40 mV (Figure 11A). In addition, Epit and Eptp2 decrease linearly with log [Cl-] with slope values between 60 and 120 mV/dec. The higher absolute slope values (≅200–300 mV/dec) estimated for Al 2024 and Al 7075 (Figure 11A) indicate more important changes in local surface and solution compositions because of microstructural evolution with corrosion (Knight et al., 2010; Wall & Stoner, 1997). Notice that Eptp tends to differ from Epit with the dilution of the test solution.
![Figure 11:
Empirical relationships between (A, B) electrochemical parameters (see Figure 1 and text for clarity) and log [Cl-]; (C) steepness and log [Cl-]; (D) steepness and log iptp (labels near the symbols indicate the corresponding [Cl-]), determined from PS (10 mV/min) in stagnant, air-saturated solutions (pH 6.5) for polished Al 5754-H111, 5083-H111, Al 2024-T3, and Al 7075-T6. The values near the lines in panels A–C indicate to slopes values.](/document/doi/10.1515/corrrev-2015-0054/asset/graphic/j_corrrev-2015-0054_fig_030.jpg)
Empirical relationships between (A, B) electrochemical parameters (see Figure 1 and text for clarity) and log [Cl-]; (C) steepness and log [Cl-]; (D) steepness and log iptp (labels near the symbols indicate the corresponding [Cl-]), determined from PS (10 mV/min) in stagnant, air-saturated solutions (pH 6.5) for polished Al 5754-H111, 5083-H111, Al 2024-T3, and Al 7075-T6. The values near the lines in panels A–C indicate to slopes values.
From the relationships between log iptp and log [Cl-] (Figure 11B), absolute slope values close to 1 are obtained for the second transition of Mg-rich alloys, indicating that mononuclear Al(OH)2Cl is involved. Values <1 for the first transition of Al 5083-H111 suggest the participation of less stable complex ions such as AlCl2+ and Al(OH)Cl+, which is supported by the indistinguishable inflection in 0.1 m NaCl (Figure 11B). Similarly, the [Cl-]-independent iptp for Al 5754 (n≅0) suggests the participation of loosely held chemisorbed species. These differences may be related to the alloy microstructural features and the type of corrosion attack (Figure 5). Crevice corrosion was promoted with [Cl-] for Al 5083-H111 and crystallographic pitting for Al 5754-H111 (Melilli, 2013). Higher iptp values and fractional reaction orders (n between 0.4 and 0.7) are obtained for Al 2024-T3 and Al 7075-T6 (Figure 11B). Fractional n indicates chain reactions or complex reaction mechanisms because reaction orders higher that 2 should be obtained with the present test conditions if more stable hydrolysis products are formed. Accordingly, consecutive reactions involving consumption/generation of H+ in the stepwise propagation of localized attack are more likely. This is not excluded but contributes in a lesser extent in the case of Mg-rich alloys.
The plots of the steepness as a function of log [Cl-] (Figure 11C) show similar slope values for Al 5754-H111, although the steepness after the first transition is less marked. This suggests similar reaction processes are involved but that concentration polarization occurs at later stages of alloy repassivation as a consequence of the onset of corrosion front propagation on a narrower front at less negative potentials (E≅Eptp1). Considering crystallographic pitting promoted with [Cl-], the linear decrease of the steepness with log [Cl-] is consistent with repassivation by the dilution of occluded cavity solution (Cicolin et al., 2014). For Al 5083-H111 (Figure 11C), steepness versus log[Cl-] plot for the second inflection shows a change of the slope for [Cl-]≥0.3 m, which suggests a change in the repassivation mechanism because of the onset of crevice corrosion as salt precipitation at the bottom of damaged sites occurs with [Cl-] (Melilli et al., 2014). A similar result is obtained for Al 7075-T6 (Figure 11C), but the steepness is even more important and increases more markedly. These differences show a correlation with fractional n values (Figure 11B) and brittle fracture induced by [Cl-] (Melilli et al., 2014), in support of proton reduction controlling the anodic dissolution of Al. Accordingly, the magnitude of the steepness can be considered proportional to local acidity removal for full hydrolysis to be reached at Eprot. If this occurs, the steepness tends to decrease while iptp increases. Notice that both electrochemical properties increase with irev but for constant [Cl-] (Figure 6) (Comotti et al., 2013). Notice also that, for the first inflection of Al 5754-H111, the steepness changes more importantly than iptp with [Cl-], in correlation with the activity of small discontinuous β-phase precipitates along grain boundaries (Figure 5). Thus, iptp is influenced by the corroded area, while the steepness is principally determined by the kinetics of dissolution processes after the transition onset at Eptp. Although the previous analyses cannot be done for Al 2024-T3 with the present test conditions due to indistinguishable inflection in 0.1 m NaCl (Figure 11C), high steepness values ([Cl-]≥0.3 m) suggest important dissolution kinetics after the transition onset.
Additional experiments conducted with specimens positioned on one side of the O-ring cell showed less marked inflection, indicating the influence of mass transfer between the occluded cavity and the outer bulk solutions. Thus, gravity assists in the formation of metastable salt layers regulating the transport of ions in and out of occluded cells, i.e. with face-up specimens. On the basis of the reaction orders with respect to [Cl-] during repassivation (Figure 11B), the previous observation correlates with the formation of metastable Al hydroxychloride compounds, although local cell reactions depend also on the alloy composition as well as on microstructural evolution during corrosion. For vertically positioned specimens, the inflection was almost indistinguishable for Al 2024-T3 and Al 7075-T6, but the width of the hysteresis loop was still important (Melilli, 2013). In the case of Mg-rich alloys, a distinguishable inflection (between Eptp1 and Eptp2 of faced-up positioned specimens, Figure 11A) was still detected.
Table 2 reports the results of the effect of [Cl-] (0.1 and 0.6 m, pH 6.5), working area (1 and 0.1 cm2), and scan rate (ν of 0.2 and 10 mV/s), and of their interactions, on the electrochemical parameters in experiments using faced-up positioned specimens and a statistical analysis (95% confidence level). The p-values (significant if p<0.05), which enabled the estimation of the effect of the above-mentioned factors on the electrochemical properties, were determined by multifactor ANOVA. The regression coefficients, R2, that provide an estimation of the linear model that includes the variation of the experimental data as a function of all the factors investigated were determined by linear multiple regression (LMR). A quantitative evaluation of multifactor effects generated by experimental observations indicates a significant effect of [Cl-] on Epit and Eptp (p=0.000). Conversely, the characteristic parameters of the kinetics of repassivation such as iptp and steepness are not influenced by [Cl-] (p≥0.05). In addition, the steepness does not depend on the working surface area. This further supports the view that iptp is related to the critical Al3+ concentration at the transition onset. Similarly, the scan rate has a major effect on the steepness, as compared to iptp, which provides the confirmation of electrochemical events at the bottom of the occluded cell governing the sequence of active tip-passive walls and consequent microstructural evolution. It is interesting to note the similar effect of the working area on Eptp for Al 5083-H111 and Al 7075-T6, both prone to the formation of surface corrosion films. The analysis of R2 values indicates less important nonlinear, and thus nonadditive, effects of the investigated factors in the case of Al 5754-H111, which exhibits crystallographic pitting as the main type of localized attack. A more significant nonlinearity is estimated for Al alloys prone to geometrically constricted localized attack other than pitting.
Results of multifactor ANOVA and of multiple linear regression for the effect of chloride concentration ([Cl-] 0.1 and 0.6 m, pH 6.5), working electrode surface area (0.1 and 1 cm2), and scan rate (ν 10 mV/min and 10 mV/s), on the PS response for different Al alloys.
| Al alloy | Factor | p-Valuesa |
||||
|---|---|---|---|---|---|---|
| E pit | E ptp | i ptp | Steepness | E prot | ||
| 5754-H111a | [Cl-] | 0.0000 | 0.0000 | 0.0961 | 0.0018 | 0.2600 |
| Area | 0.0005 | 0.0005 | 0.0158 | 0.0001 | 0.0001 | |
| ν | 0.0001 | 0.0000 | 0.0074 | 0.0000 | 0.0000 | |
| R 2(%) | 92.5 | 99.1 | 63.6 | 93.4 | 95.4 | |
| Al 5083-H111a | [Cl-] | 0.0000 | 0.0009 | 0.7269 | 0.0466 | 0.0026 |
| Area | 0.0098 | 0.7165 | 0.0156 | 0.0813 | 0.3787 | |
| ν | 0.0000 | 0.0063 | 0.0151 | 0.0006 | 0.3669 | |
| R 2(%) | 96.6 | 82.0 | 45.7 | 80.6 | 45.1 | |
| Al 2024 | [Cl-] | 0.0000 | 0.0000 | 0.7132 | 0.2436 | 0.0000 |
| Area | 0.3385 b | 0.0046 | 0.0006 | 0.6263 | 0.1095 | |
| ν | 0.7949 | 0.0000 | 0.0272 | 0.0091 | 0.0031 | |
| R 2(%) | 95.8 | 85.7 | 72.3 | 62.4 | 67.6 | |
| Al 7075 | [Cl-] | 0.0000 | 0.0091 | 0.9693 | 0.1967 | 0.1162 |
| Area | 0.1512 | 0.8210 | 0.0050 | 0.1626 | 0.0174 | |
| ν | 0.0023 | 0.0449 | 0.0111 | 0.0035 | 0.0000 | |
| R 2(%) | 96.0 | 65.1 | 68.4 | 80.4 | 86.9 | |
ap-Values <0.05 indicate significant effect of a given factor on the electrochemical property. bp-Value >0.05 in bold.
3.4 Effect of age hardening
To evaluate the effect of microstructure evolution induced with aging on the repassivation kinetics Al 2024 and Al 7075-based alloys, different thermal treatments were followed using Al 2024-T3 and Al 7075-T6 as starting materials (Guastafferro, 2013; Pogliana, 2013). Figure 12 schematically shows the heat treatment conditions used for each alloy, based on reported procedures (Little et al., 2007; Zhao & Frankel, 2007a,b). These were chosen because of the similarity of the electrochemical approaches and alloy systems, although the reverse scan in the case of Al 7075 was not recorded. In the case of Al 2024, annealed specimens (O temper) were also investigated. PS was recorded at 10 mV/min for irev=2.5 mA/cm2 in 0.6 m NaCl (pH 6.5) using faced-up positioned specimens. Figure 13A reports the representative PS of Al 2024 for different thermal treatments. The inflection in the reverse curve is always detected at Eptp values close to the corresponding Epit, despite the remarkable shift of this electrochemical parameter to more negative potentials with age hardening. This provides additional confirmation that these potentials are closely related, as previously indicated. The width of the hysteresis loop changes more importantly than Eprot (between -850 and -900 mV). The quantitative analysis of Epit and Eptp (Figure 13B) indicates good agreement with the trend obtained for Al-Cu-Mg-Ag alloys in alkaline, deaerated 0.6 m NaCl (pH 10) as a function of the approximate wt% Cu in solid solution (XRD) (Little et al., 2007). An improvement in the IGSCC behavior on overaging, evaluated by CERT, was consistent with a decrease in Eptp with increasing aging time and showed a correlation with the decrease in global Cu content in solid solution toward the Cu solid solution concentration in equilibrium with grain boundary precipitates. Diffractograms in Figure 13C also indicate a decrease of global Cu content with aging, according to the decrease of the peak at approximately 25° assigned to AlCu phase (Biswas, Siegel, Wolverton, & Seidman, 2011). Nevertheless, annealed surfaces (O temper in Figure 12A) show a quite intense AlCu peak, but Epit and Eptp values are in between those obtained for T8 and OA aging conditions (Figure 13B and C). Surface SEM/EDX analysis of as-polished surfaces after T8 and O treatments (Figure 14) indicated the precipitation of Cu-rich phases at grain boundaries, more importantly for the latter temper state. This suggests that Eptp alone is not a sufficient parameter for evaluating the resistance against IGSCC of Cu-rich alloys. Figure 15 reports steepness and log iptp values for the different thermal treatments (Figure 13A). No correlation is obtained between these electrochemical characteristics and the intensity of AlCu peak, in contrast to the localized attack morphology (cross-sectional SEM images in Figure 15). The smallest values of steepness and log iptp are obtained for OA treatment, which exhibit wide open pits with some IG attack at the pit bottom. Both parameters increase as IG attack tends to prevail (T8), where the increase of log iptp could be related to the decrease of liquid-to-solid ratio in narrow corroded paths. The highest steepness is obtained for SHT and T3 tempers, being both susceptible to TGSCC, notwithstanding the different intensities of the AlCu peak as well as the closely similar Eptp values (Figure 13B and C). Results suggest that Cu global content in solid solution and, consequently, Cu solid solution concentration in equilibrium with grain boundary precipitates have little effect on the transition onset and localized attack reactivation. The associated interfacial reactions seem to be determined by interdependent electrochemical and metallurgical events.
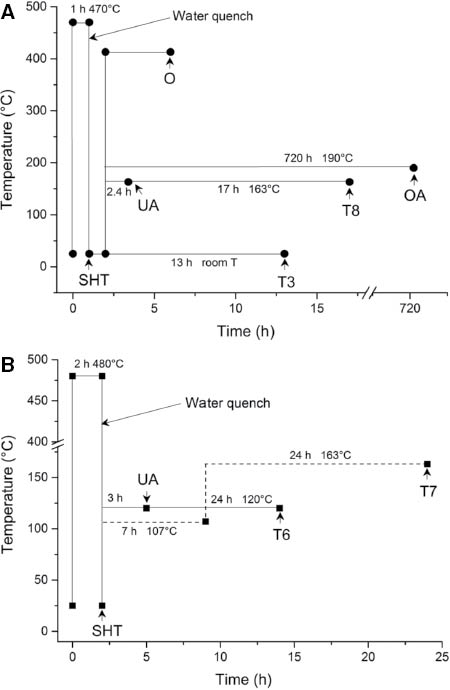
Heat-treatment processes for (A) Al 2024 and (B) Al 7075 (SHT, solution heat treated; UA, underaged; T3, naturally aged; T6 and T8, artificially aged; OA and T7, overaged; O, annealed).
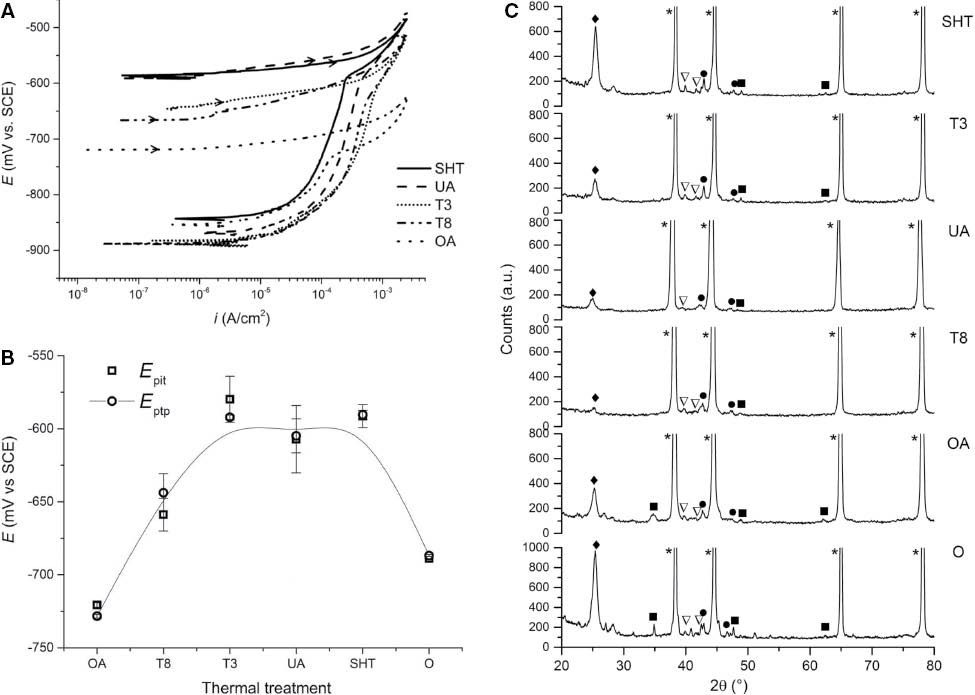
Electrochemical behavior and composition of Al 2024 as a function of the thermal treatment. (A) PS of Al 2024 after different thermal treatments (Figure 12A) recorded at 10 mV/min with irev=2.5 mA/cm2 in stagnant, air saturated 0.6 m NaCl (pH 6.5). (B) Variation of Epit and Eptp as a function of the thermal treatment. (C) Diffractograms of as-polished Al 2024 surfaces; symbols correspond to (*) Al, (•) Al2Cu, (♦) AlCu, (■) AlCuMg, and (∇) Al7Cu2Fe.
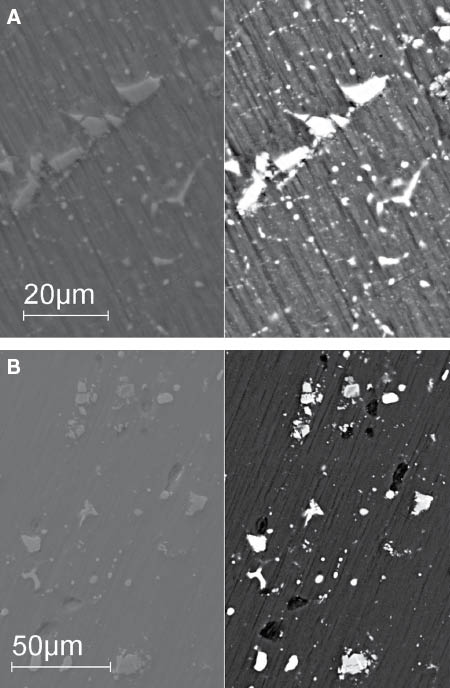
Surface SEM BSE/SE images of as-polished Al 2024 after annealing (A) and T8 (B) thermal treatments.
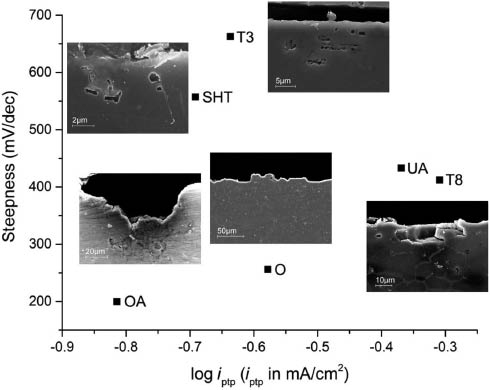
Relationship between steepness and log iptp of Al 2024 (Figure 13A). Cross-sectional SEM images of corroded substrates for all treatment conditions but UA are included.
In the case of Al 7075, PS shows major differences in the forward curves with two breakdowns detected for peak-aged (T6) and overaged (T7) treatment conditions (Figure 16A), in agreement with previous findings (Zhao & Frankel, 2007a,b). Epit1 and Epit2 shift to less negative potentials, whereas Eptp tends to Epit2 with aging (Figure 16B). According to XRD analysis (Figure 16C), thermal treatment favors the precipitation of silicon- and chromium-rich phases. Unlike Al 2024, log iptp increases as cavities open, while the steepness slightly changes (Figure 17). Common to both alloys, however, is the remarkable increase of the steepness in the presence of TGSCC (T6). The comparison of Al 7075-T6 and Al 7075-T7 indicates similar log iptp (as well as Eptp) but smaller steepness for the latter specimen, which correlates with a lower degree of damage of the alloy bulk (Figure 17). Thus, the steepness seems to be more adequate for estimating the degree of localized attack reactivation as a function of complex factors, as governed by local electrochemical reactions.
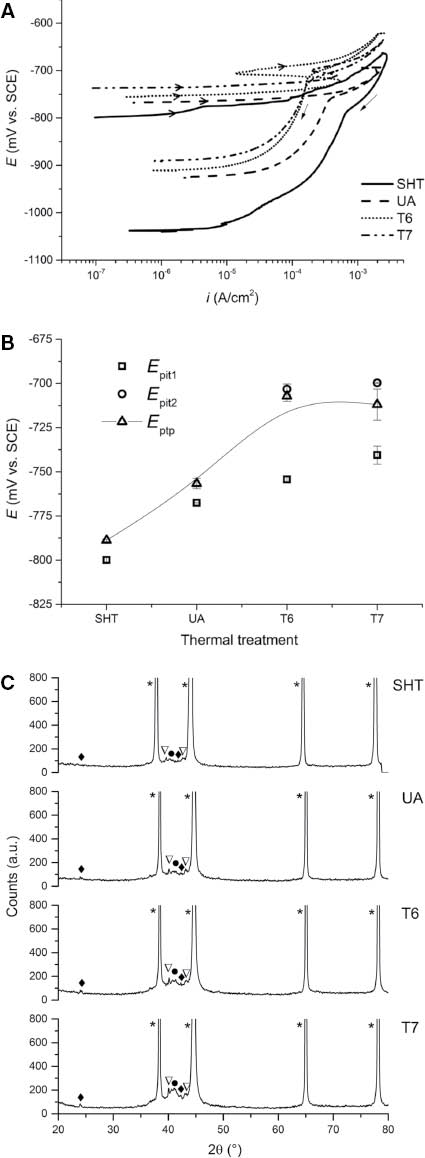
Electrochemical behavior and composition of Al 7075 as a function of the thermal treatment. (A) PS of Al 7075 after different thermal treatments (Figure 12B) recorded at 10 mV/min with irev=2.5 mA/cm2 in stagnant, air saturated 0.6 m NaCl (pH 6.5). (B) Variation of Epit and Eptp as a function of the thermal treatment. (C) Diffractograms of as-polished Al 7075 surfaces; symbols correspond to (*) Al, (•) Mg2Si, (∇) MgZn2, and (♦) Al17Cr2Fe.
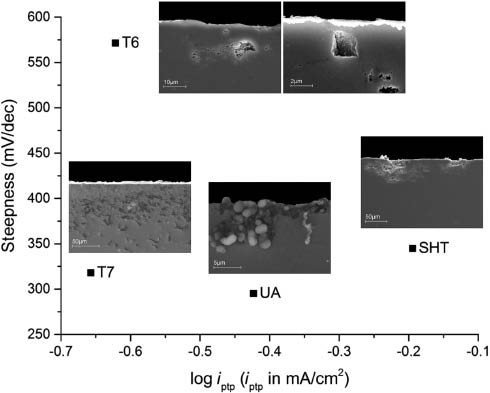
Relationships between steepness and log iptp of Al 7075 (Figure 16A). Cross-sectional SEM images of corroded substrates for all treatment conditions are included.
To consider also the effect of mechanical properties, microhardness measurements by microindentation (ISO 14577, DIN 50359) were conducted, using as-treated surfaces (Figure 12). Among the properties derived from the load-indentation depth plot, Vickers hardness was always higher for Al 7075 substrates. No correlation was found for electrochemical properties with the exception of the steepness. As shown in Figure 18, the percentage of plastic deformation in the case of Al 2024 and the elastic modulus in the case of Al 7075 changes with the thermal treatment as the steepness. Good match is also indicated for as-received alloys after 10 years of storage. Considering that steepness is principally determined by the kinetics of dissolution processes after the transition onset, results suggest that residual stresses interact with the local environment, influencing interfacial electrochemical kinetics in the periodic active-passive sequence involving dissolution-passivation-film rupture. The residual stress effect manifested by different mechanical properties correlates with the higher strength of Al 7075 and the greater toughness and ductility of Al 2024.
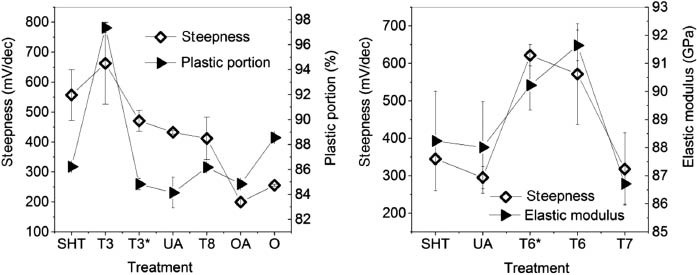
Correlation between steepness and mechanical properties for (A) Al 2024 and (B) Al 7075 for different thermal treatments (T3* and T6*, respectively, correspond to as-received alloy after 10 years of storage).
According to these findings, an investigation of the repassivation kinetics in the presence of externally applied mechanical load has been undertaken to implicitly consider the four interrelated major variables of EAC: material, environment, electrochemical state, and stress. Fatigue studies combined with critical electrochemical potentials provide criterion for cracking but do not shed light on the features that dominate crack growth kinetics, which can be based on different mechanisms for controlling propagation rates (Little et al., 2007; Wall & Stoner, 1997). Thus, the electrochemical approach described herein could provide an understanding of non-steady state crack tip processes and on the fundamental mechanisms of environmental embrittlement.
4 Conclusions
Summing up the effect of different experimental conditions on the repassivation behavior of Al alloys, through the collected data and derived relationships mainly on electrochemical bases, we can conclude that the transition to a microcorrosion front is determined by equilibrium-limited local cell reactions. The pit transition potential Eptp, considered as the thermodynamic driving force of Al dissolution on freshly created surfaces, is more adequate for evaluating possible microstructure evolution during corrosion. Similarly, the associated current density iptp, which is proportional to the rate at which hydrolysis equilibrium is reached at a critical concentration of Al3+, estimates the nature of the intermediate species that limit passive film formation. The steepness of the potential decrease after the transition onset provides an indication of limited repassivation due to corrosion propagation on a narrower front. The associated dissolution processes are likely determined by the local acidity removal for full hydrolysis to be reached at Eprot. More importantly, the steepness seems to be influenced by internal stresses (or residual stresses induced with thermal treatment) in the case of high-strength Al 2024-T3 and Al 7075-T6. This indication points out the possible evaluation of the extent of electrochemical and metallurgical events affecting interfacial reactions. On this basis, the electrochemical approach enables the investigation of EAC, in particular, nonsteady crack nucleation and growth, by considering the average behavior of freshly created surfaces within geometrically constricted cavities, similar to those found in practical situations. The PS method in combination with externally applied mechanical load is presently being explored to provide an electrochemical basis for probing trends in SCC and CF of high-strength series 2000 and 7000 Al alloys.
About the authors
Monica Trueba was born in Cuba (Havana) in 1970. She obtained the Bachelors degree in Chemistry in 1991 and the Masters degree in 2003 at the Faculty of Chemistry of the University of Havana. In this Faculty, she was junior/assistant professor from 1998 until 2004, teaching courses of physical chemistry and of applied statistics. The scientific interests were on electrochemistry of metallic/composite and polymeric materials, focused mainly to electrocatalysis of hydrogen evolution reaction and electro(nano)polymerization of conducting polymers. At the end of 2004, she transferred to Milan (Italy). She received her doctorate degree from the Università degli Studi di Milano in 2008, working in the Department of Chemistry on the corrosion and protection of Al alloys. Since then, she is a post-doc fellow in this university. Her research interests are principally focused on corrosion and protection of light alloys. Major efforts have been dedicated to the understanding of mechanisms governing corrosion and protection. She is author or co-author of more than 25 peer-reviewed papers and 30 oral communications. She is a member of the Italian Association of Metallurgy, of the American Chemical Society, and of the International Society of Electrochemistry.
Stefano Trasatti is presently Assistant Professor in the Department of Chemistry of the University of Milan. He received a PhD in Industrial Chemistry in 1995. In the same year he was awarded the Oronzio De Nora prize in the field of electrochemistry. He worked in private companies from 1996 to 2002, where he was responsible for surface treatments (Henkel Surface Technologies) and material testing (Centro Sviluppo Materiali). Since returning to the Università degli Studi di Milano in 2002, he has established a thriving research group working on corrosion and electrochemistry, and related topics, presently composed of 3 research fellows, 2 PhD students and 1 Post-graduated student. He is the author of about 60 peer-reviewed papers, 70 conference proceedings, 70 technical papers and one patent in the field of applied electrochemistry and metallic corrosion. His research interests include protective coatings, active-to-passive alloys, corrosion monitoring and control, applied electrochemistry, development of bioelectrochemical systems.
Acknowledgments
The authors thank Dr. W. Nickerson ONR, Washington, DC, for funding the program and for stimulating technical discussions.
References
Abodi LC, DeRose JA, Van Damme S, Demeter A, Suter T, Deconinck J. Modeling localized aluminum alloy corrosion in chloride solutions under non-equilibrium conditions: steps toward understanding pitting initiation. Electrochim Acta 2012; 63: 169–178.10.1016/j.electacta.2011.12.074Suche in Google Scholar
Anderko A, Sridhar N, Dunn DS. A general model for the repassivation potential as a function of multiple aqueous solution species. Corros Sci 2004; 46: 1583–1612.10.1016/j.corsci.2003.10.002Suche in Google Scholar
Augustin C, Andrieu E, Baret-Blanc C, Delfosse J, Odemer G. Empirical propagation laws of intergranular corrosion defects affecting 2024 T351 alloy in chloride solutions. J Electrochem Soc 2010; 157: C428–C436.10.1149/1.3497297Suche in Google Scholar
Birbilis N, Buchheit RG. Electrochemical characteristics of intermetallic phases in aluminum alloys. An experimental survey and discussion. J Electrochem Soc 2005; 152: B140–B151.10.1149/1.1869984Suche in Google Scholar
Biswas A, Siegel DJ, Wolverton C, Seidman DN. Precipitates in Al-Cu alloys revisited: atom-probe tomographic experiments and first-principles calculations of compositional evolution and interfacial segregation. Acta Materialia 2011; 59: 6187–6204.10.1016/j.actamat.2011.06.036Suche in Google Scholar
Broli A, Holtan H. Use of potentiokinetic methods for the determination of characteristic potentials for pitting corrosion of aluminium in a deaerated solution of 3% NaCl. Corros Sci 1973; 13: 237–246.10.1016/0010-938X(73)90002-4Suche in Google Scholar
Burstein GT, Cinderey RJ. Evolution of the corrosion potential of repassivating aluminum surfaces. Corros Sci 1992; 33: 475–492.10.1016/0010-938X(92)90075-ESuche in Google Scholar
Cabot PL, Centellas FA, Perez E. Pitting and repassivation processes of Al-Zn-Mg alloys in chloride solutions containing sulfate. Electrochim Acta 1993; 38: 2741–2748.10.1016/0013-4686(93)85093-ESuche in Google Scholar
Cicolin D, Trueba M, Trasatti SP. Effect of chloride concentration, pH and dissolved oxygen, on the repassivation of 6082-T6 Al alloy. Electrochim Acta 2014; 124: 27–35.10.1016/j.electacta.2013.09.003Suche in Google Scholar
Comotti I, Trueba M, Trasatti SP. The pit transition potential in the repassivation of aluminium alloys. Surf Interface Anal 2013; 45: 1575–1584.10.1002/sia.5270Suche in Google Scholar
Deshpande KB. Numerical modeling of micro-galvanic corrosion. Electrochim Acta 2011; 56: 1737–1745.10.1016/j.electacta.2010.09.044Suche in Google Scholar
Engelhardt G, Macdonald DD. Unification of the deterministic and statistical approaches for predicting localized corrosion damage. I. Theoretical foundation. Corros Sci 2004; 46: 2755–2780.10.1016/j.corsci.2004.03.014Suche in Google Scholar
Galvele JR, Transport processes and the mechanism of pitting of metals. J Electrochem Soc 1976; 123: 464–474.10.1149/1.2132857Suche in Google Scholar
Galvele JR. Transport processes in passivity breakdown-II. Full hydrolysis of the metal ions. Corros Sci 1981; 21: 551–579.10.1016/0010-938X(81)90009-3Suche in Google Scholar
Guastafferro D. Effect of thermal treatment on the microstructure of Al 2024 and Al 7075. BSc thesis, Università degli Studi di Milano, Milan, Italy, 2013.Suche in Google Scholar
Guseva O, Schmutz, Suter T, von Trzebiatowski O. Modelling of anodic dissolution of pure aluminium in sodium chloride. Electrochim Acta 2009; 54: 4514–4524.10.1016/j.electacta.2009.03.048Suche in Google Scholar
Guseva O, DeRose JA, Schmutz P. Modelling the early stage time dependence of localised corrosion in aluminium alloys. Electrochim Acta 2013; 88: 821–831.10.1016/j.electacta.2012.10.059Suche in Google Scholar
Henaff G, Menan F, Odemer G. Influence of corrosion and creep on intergranular fatigue crack path in 2XXX aluminium alloys. Eng Fract Mech 2010; 77: 1975–1988.10.1016/j.engfracmech.2010.03.039Suche in Google Scholar
Holroyd NJH. Environment-induced cracking of high-strength al alloys. In: Gangloff RP, Ives MB, editors. Environment-induced cracking of metals. NACE-10. Houston, Texas: National Association of Corrosion Engineers, 1990: 311–345.Suche in Google Scholar
Jarrah A, Bigerelle M, Guillemot G, Najjar D, Iost A, Nianga JM. A generic statistical methodology to predict the maximum pit depth of a localized corrosion process. Corros Sci 2011; 53: 2453–2467.10.1016/j.corsci.2011.03.026Suche in Google Scholar
Jilani O, Njah N, Ponthiaux P. Transition from intergranular to pitting corrosion in fine grained aluminum processed by equal channel angular pressing. Corros Sci 2014; 87: 259–264.10.1016/j.corsci.2014.06.031Suche in Google Scholar
Jones RH, Baer DR, Danielson MJ, Vetrano JS. Role of Mg in the stress corrosion cracking of an Al-Mg alloy. Metall Mater Trans A 2001; 32: 1699–1711.10.1007/s11661-001-0148-0Suche in Google Scholar
Knight SP, Birbilis N, Muddle BC, Trueman AR, Lynch SP. Correlations between intergranular stress corrosion cracking, grain-boundary microchemistry, and grain-boundary electrochemistry for Al-Zn-Mg-Cu alloys. Corros Sci 2010; 52: 4073–4080.10.1016/j.corsci.2010.08.024Suche in Google Scholar
Kus E, Lee Z, Nutt S, Mansfeld F. A comparison of the corrosion behavior of nanocrystalline and conventional Al 5083 samples. Corrosion 2006; 62: 152–161.10.5006/1.3278260Suche in Google Scholar
Lashgari M, Kianpour E, Mohammadi E. Aluminum pitting corrosion in halide media: a quantum model and empirical evidence. J Mater Eng Perf 2013; 22: 3620–3625.10.1007/s11665-013-0669-xSuche in Google Scholar
Li XD, Wang XS, Ren HH, Chen YL, Mu ZT. Effect of prior corrosion state on the fatigue small cracking behaviour of 6151-T6 aluminum alloy. Corros Sci 2012; 55: 26–33.10.1016/j.corsci.2011.09.025Suche in Google Scholar
Lim MLC, Scully JR, Kelly RG. Intergranular corrosion penetration in an Al-Mg alloy as a function of electrochemical and metallurgical conditions. Corrosion 2013; 69: 35–47.10.5006/0722Suche in Google Scholar
Little DA, Connolly BJ, Scully JR. An electrochemical framework to explain the intergranular stress corrosion behavior in two Al-Cu-Mg-Ag alloys as a function of aging. Corros Sci 2007; 49: 347–372.10.1016/j.corsci.2006.04.024Suche in Google Scholar
Liu X, Frankel GS. Effects of compressive stress on localized corrosion in AA2024-T3. Corros Sci 2006; 48: 3309–3329.10.1016/j.corsci.2005.12.003Suche in Google Scholar
Lynch S. Mechanistic and fractographic aspects of stress corrosion cracking. Corros Rev 2012; 30: 63–104.10.1515/corrrev-2012-0501Suche in Google Scholar
Lyndon JA, Gupta RK, Gibson MA, Birbilis N. Electrochemical behaviour of the β-phase intermetallic (Mg2Al3) as a function of pH as relevant to corrosion of aluminium-magnesium alloys. Corros Sci 2013; 70: 290–293.10.1016/j.corsci.2012.12.022Suche in Google Scholar
McCafferty E. Pit initiation on aluminum as a queueing process. J Electrochem Soc 2010; 157: C382–C387.10.1149/1.3482021Suche in Google Scholar
Melilli E. Study of Al alloys corrosion as a function of different parameters by cyclic anodic polarization. MSc thesis, Università degli Studi di Milano, Milan, Italy, 2013.Suche in Google Scholar
Melilli E, Trueba M, Trasatti SP. Effect of chloride concentration on the repassivation behavior of structural Al alloys. La Metallurgia Italiana 2014; 7–8: 29–33.Suche in Google Scholar
Metallography and microstructure. ASM Handbook, Volume 9. Materials Park, OH: ASM International, 1985: 351–388.Suche in Google Scholar
Mi C, Lakhera N, Kouris DA, Buttry DA. Repassivation behaviour of stressed aluminium electrodes in aqueous chloride solutions. Corros Sci 2012; 54: 10–16.10.1016/j.corsci.2011.08.053Suche in Google Scholar
Moore KL, Sykes JM, Grant PS. An electrochemical study of repassivation of aluminium alloys with SEM examination of the pit interiors using resin replicas. Corros Sci 2008; 50: 3233–3240.10.1016/j.corsci.2008.08.027Suche in Google Scholar
Murer N, Missert NA, Buchheit RG. Finite element modeling of the galvanic corrosion of aluminum at engineered copper particles. J Electrochem Soc 2013; 159: C265–C276.10.1149/2.102206jesSuche in Google Scholar
Natishan PM, O’Grady WE. Chloride ion interactions with oxide-covered aluminum leading to pitting corrosion: a review. J Electrochem Soc 2014; 161: C421–C432.10.1149/2.1011409jesSuche in Google Scholar
Newman RC. Local chemistry considerations in the tunneling corrosion of aluminium. Corros Sci 1995; 37: 527–533.10.1016/0010-938X(94)00163-ZSuche in Google Scholar
Nilsen N, Bardal E. Short duration tests and a new criterion for characterization of pitting resistance of Al alloys. Corros Sci 1977; 17: 635–646.10.1016/0010-938X(77)90061-0Suche in Google Scholar
Nisancioglu K, Holtan H. Measurement of the critical pitting potential of aluminium. Corros Sci 1978a; 18: 835–849.10.1016/0010-938X(78)90019-7Suche in Google Scholar
Nisancioglu K, Holtan H. The protection potential of aluminum. Corros Sci 1978b; 18: 1011–1023.10.1016/0010-938X(78)90035-5Suche in Google Scholar
Oguocha INA, Adigun OJ, Yannacopoulos S. Effect of sensitization heat treatment on properties of Al-Mg alloy AA5083-H116. J Mater Sci 2008; 43: 4208–4214.10.1007/s10853-008-2606-1Suche in Google Scholar
Pogliana M. Effect of thermal treatment on the repassivation of Al 2024 and Al 7075. BSc thesis, Università degli Studi di Milano, Milan, Italy, 2013.Suche in Google Scholar
Pride ST, Scully JR, Hudson JL. Metastable pitting of aluminium and criteria for the transition to stable pit growth. J Electrochem Soc 1994; 141: 3028–3040.10.1149/1.2059275Suche in Google Scholar
Raetzer-Scheibe HJ, Tuck CDS. The polarization and repassivation behavior of the aluminium-zinc-magnesium-copper alloy 7010. Corros Sci 1994; 36: 941–956.10.1016/0010-938X(94)90196-1Suche in Google Scholar
Ralston KD, Birbilis N, Cavanaugh MK, Weyland M, Muddle BC, Marceau RKW. Role of nanostructure in pitting of Al-Cu-Mg alloys. Electrochim Acta 2010; 55: 7834–7842.10.1016/j.electacta.2010.02.001Suche in Google Scholar
Sadananda K, Vasudevan AK. Role of slip mode on stress corrosion cracking behavior. Metall Mater Trans A 2011; 42: 279–295.10.1007/s11661-010-0472-3Suche in Google Scholar
Scamans GM, Holroyd NJH, Tuck CDS. The role of magnesium segregation in the intergranular stress corrosion cracking of aluminium alloys. Corros Sci 1987; 27: 329–347.10.1016/0010-938X(87)90076-XSuche in Google Scholar
Scully JC. The theory of stress corrosion cracking in alloys, 1st ed., England: Maney and Son LTD, 1971.Suche in Google Scholar
Shi H, Tian Z, Hua T, Liu F, Han EH, Taryba M, Lamaka SV. Simulating corrosion of Al2CuMg phase by measuring ionic currents, chloride concentration and pH. Corros Sci 2014; 88: 178–186.10.1016/j.corsci.2014.07.021Suche in Google Scholar
Sorriano C, Oltra R, Zimmer A, Vuillemin B, Borkowski C. Microstructural corrosion of aluminium alloys: a predictive finite element model based on corrosion-mimicking experiments. Surf Interface Anal 2013; 45: 1649–1653.10.1002/sia.5223Suche in Google Scholar
Stenta A, Basco S, Smith A, Clemons CB, Golovaty D, Kreider KL, Wilder J, Young GW, Lillard RS. One-dimensional approach to modeling damage evolution in galvanic corrosion. Corros Sci 2014; 88: 36–48.10.1016/j.corsci.2014.07.012Suche in Google Scholar
Trueba M, Trasatti SP. Study of Al alloy corrosion in neutral NaCl by the pitting scan technique. Mater Chem Phys 2010; 121: 523–533.10.1016/j.matchemphys.2010.02.022Suche in Google Scholar
Wall FD, Stoner GE. The evaluation of the critical electrochemical potentials influencing environmentally assisted cracking of Al-Li-Cu alloys in selected environments. Corros Sci 1997; 39: 835–853.10.1016/S0010-938X(97)81154-7Suche in Google Scholar
Wilde BE, Williams E. The use of current/voltage curves for the study of localized corrosion and passivity breakdown on stainless steels in chloride media. Electrochim Acta 1971; 16: 1971–1985.10.1016/0013-4686(71)85151-4Suche in Google Scholar
Yasuda M, Weinberg F, Tromans D. Pitting corrosion of Al and Al-Cu single crystals. J Electrochem Soc 1990; 137: 3708–3715.10.1149/1.2086291Suche in Google Scholar
Zaid B, Saidi D, Benzaid A, Hadji S. Effects of pH and chloride concentration on pitting corrosion of AA6061 aluminum alloy. Corros Sci 2008; 50: 1841–1847.10.1016/j.corsci.2008.03.006Suche in Google Scholar
Zhang W, Frankel GS. Transitions between pitting and intergranular corrosion in AA2024. Electrochim Acta 2003; 48: 1193–1210.10.1016/S0013-4686(02)00828-9Suche in Google Scholar
Zhang W, Ruan S, Wolfe DA, Frankel GS. Statistical model for intergranular corrosion growth kinetics. Corros Sci 2003; 45: 353–370.10.1016/S0010-938X(02)00090-2Suche in Google Scholar
Zhao Z, Frankel GS. On the first breakdown in AA7075. Corros Sci 2007a; 49: 3064–3088.10.1016/j.corsci.2007.02.001Suche in Google Scholar
Zhao Z, Frankel GS. The effect of temper on the first breakdown in AA7075. Corros Sci 2007b; 49: 3089–3111.10.1016/j.corsci.2007.02.004Suche in Google Scholar
©2015 by De Gruyter
Artikel in diesem Heft
- Frontmatter
- In this issue
- Editorial
- International Symposium on Environmental Damage Under Static and Cyclic Loads in Structural Metallic Materials at Ambient Temperatures III (Bergamo, Italy, June 15–20, 2014)
- Overviews and reviews
- U.S. Naval Aviation: operational airframe experience with combined environmental and mechanical loading
- Thirty-five years in environmentally assisted cracking in Italy: a point of view
- Fatigue and corrosion fatigue
- Transgranular corrosion fatigue crack growth in age-hardened Al-Zn-Mg (-Cu) alloys
- Effect of cyclic frequency on fracture mode transitions during corrosion fatigue cracking of an Al-Zn-Mg-Cu alloy
- Crack growth behavior of 4340 steel under corrosion and corrosion fatigue conditions
- Modeling of environmentally assisted fatigue crack growth behavior
- Factors influencing embrittlement and environmental fracture
- Pre-exposure embrittlement of an Al-Cu-Mg alloy, AA2024-T351
- Electrochemical approach to repassivation kinetics of Al alloys: gaining insight into environmentally assisted cracking
- Localized dissolution of grain boundary T1 precipitates in Al-3Cu-2Li
- Grain boundary anodic phases affecting environmental damage
- Defect tolerance under environmentally assisted cracking conditions
- Role of Mo/V carbides in hydrogen embrittlement of tempered martensitic steel
- Stress corrosion cracking
- The role of crack branching in stress corrosion cracking of aluminium alloys
- An atomistically informed energy-based theory of environmentally assisted failure
- Discrete dislocation modeling of stress corrosion cracking in an iron
- Quasi-static behavior of notched Ti-6Al-4V specimens in water-methanol solution
- Role of excessive vacancies in transgranular stress corrosion cracking of pure copper
- Multiscale investigation of stress-corrosion crack propagation mechanisms in oxide glasses
- Hydrogen assisted cracking
- Hydrogen effects on fracture of high-strength steels with different micro-alloying
- Environmentally assisted cracking and hydrogen diffusion in traditional and high-strength pipeline steels
- Multiscale thermodynamic analysis on hydrogen-induced intergranular cracking in an alloy steel with segregated solutes