
An atomistically informed energy-based theory of environmentally assisted failure
-
Sriram Ganesan
Sriram Ganesan graduated with a Bachelor’s-Master’s Dual Degree (B.Tech-M.Tech) in Aerospace Engineering from the Indian Institute of Technology, Kanpur in 2012. He is currently pursuing a PhD in Aerospace Engineering at the University of Michigan, Ann Arbor. His current research is focused on multi-scale modeling of crack initiation and developing improved crystal plasticity constitutive models for predicting deformation response of magnesium alloys.
Veera Sundararaghavan is an Associate Professor in the Department of Aerospace Engineering and the Director of the Multi-scale Structural Simulations Laboratory (MSSL) at the University of Michigan. He received his PhD in Mechanical Engineering from Cornell University in 2007 and his Bachelor’s and Master’s degrees from the Indian Institute of Technology, Madras. He is a recipient of a National Science Foundation CAREER award and a Defense Threat Reduction Agency Young Investigator award for research in multi-scale materials modeling and integrated computational materials engineering (ICME).


Abstract
The critical energy release rate, defined as Gc=2γ+γp (where γ is the cohesive energy and γp is the plastic work), is widely used as a macroscopic fracture criterion. During embrittlement of aluminum by gallium, impurity segregation is localized to a small region along the grain boundary and the bulk plastic properties are unaffected. Yet, the critical energy release rate (which is predominantly described by the plastic work [γp] since γp>>γ) significantly decreases. In this work, we recognize that as the cohesive energy (γ) decreases during corrosion due to an increase in impurity concentration, the stress needed at the notch tip to form the crack decreases, and this, in turn, decreases the plastic work by reducing dislocation emission at the notch tip. We study two different models proposed in the past that can capture this dependence of γp on γ during liquid metal (Ga) embrittlement of aluminum alloy (Al 7075). The parameters in these models are computed from first principles atomistic calculations and recent experiments. We compare and contrast these models on their ability to describe various aspects of embrittlement such as fracture toughness, KIC, and subcritical value of stress intensity, KIscc. Extension of the approach to predict threshold fatigue crack initiation in Al7075 is suggested.
1 Introduction
The thermodynamic criterion for propagation of crack in a stressed solid is that the energy supplied to the solid is equal to the energy needed for increase in the area of the crack. The critical energy release rate as suggested by Orowan (1945), given below, is widely used as a fracture property:
This simple expression links the supplied mechanical energy (Gc) to the chemical work (γ) needed to separate the bonds at a crack tip and is thus invaluable in understanding corrosive failure. The chemical work (γ) that is needed to form an ideal crack can now be reliably found using the density functional theory (DFT) (Dawson et al., 1996) for a large variety of atomic structures and composition. However, the above expression is seldom used in engineering analysis due to the difficulty in modeling the plastic work γp, which predominantly determines the critical energy release rate (since, γp>>γ). Engineering models based on linear elastic fracture mechanics instead use expressions such as
Embrittlement is widely seen in metals, e.g. steels with phosphorous, tin, or antimony and aluminum with gallium or mercury (Vasudevan, 2013). It proceeds with reduction of cohesive energy, resulting in decohesion of grain boundary (GB) under stress. Experimental studies indicate that segregation of less than one monolayer of Bi atoms can lead to significant changes in the electronic structure, resulting in a large drop in the work of fracture in Cu bicrystals (Duscher, Chisholm, Alber, & Rühle, 2004). Since segregation and decohesion occur preferentially along grain boundaries, bulk parameters such as yield strength or plastic work (γp) are not expected to affected. However, the drop in cohesive energy alone due to segregation is insignificant compared to the observed drop in the critical energy release rate (Gc).
This opens the possibility of the plastic work (γp) being a strong function of the cohesive energy (γ), and this has been considered in the context of microcrack propagation by Rice (1965) and further explored by West (1980) and Jokl et al. (1980). The early model by West, called the microbrittle model, was based on mechanistic considerations. Here, cracks were assumed to propagate in the form of discrete jumps. The plastic work was assumed to be equal to the work done by a constant yield stress in the ensuing crack wake that spans the size of the plastic zone. The model predicts the plastic work to be linearly proportional to the cohesive energy. In this way, small changes in the cohesive energy can have an amplifying effect on the plastic work through a large coefficient of proportionality. The approach by Jokl et al., called the concomitant dislocation emission (CDE) model, employed the phenomenological theory of dislocation emission from crack tips. A time-dependent Dugbale-Bilby-Cottrell-Swinden (DBCS) model (Ewing, 1978) based on a strip zone model of plasticity ahead of the crack was used to model the stresses at the crack tip. The crack opening displacement was related to the velocity of dislocation emission from the crack tip. The approach gave a closed form expression for γp in terms of γ in the form of a power law. In this paper, we show that the CDE model provides a better explanation of the ductile-to-brittle transitions observed in experiments when compared to the microbrittle model. Also, we explain that the microbrittle model, by itself, can be considered as a special case of CDE theory if the velocity of emitted dislocations scaled with crack tip stresses with a power law exponent of 1.5.
In the rest of the paper, we test these models on a particular case of liquid metal (Ga) embrittlement of aluminum alloy (Al 7075). Liquid metals such as mercury (Hg) and gallium (Ga) can significantly reduce the GB cohesive energy, as shown in Figure 1. To correctly model the change in cohesive energy (γ) during this process, we employ first principles atomistic calculations and recent experiments. The cohesive energy of the GB is computed using DFT as the difference between the surface energy and the GB energy of the material (Thomson, Heine, Payne, Marzari, & Finnis, 2000; Wu, Freeman, & Olson, 1994). Yamaguchi et al. (2010) and Yamaguchi et al. (2011) calculated the effect on cohesive energy due to solute segregation of hydrogen and gallium atoms on Al Σ5(012) symmetrical tilt GBs. Using the DFT data from Yamaguchi et al. (2010) in the models by West (1980) and Jokl et al. (1980), we show that a small reduction in cohesive energy due to few Ga atoms can significantly reduce the fracture toughness of the alloy. In rest of the paper, we first describe the models in detail and then test their ability to describe various aspects of embrittlement such as fracture toughness, KIC and subcritical value of stress intensity, KIscc. Extension of the theory to predict threshold fatigue crack initiation in Al7075 is also suggested.
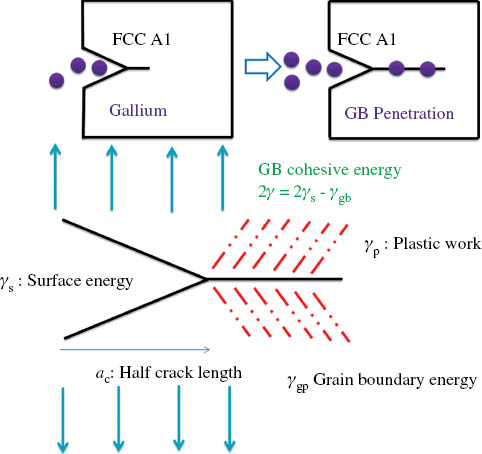
LME, followed by penetration and adsorption of solute, followed by crack propagation (from Yamaguchi, Ebihara, Itakura, Suzudo, & Kaburaki, 2010).
2 Plastic work models
2.1 Microbrittle theory
The microbrittle model is the simplest model that relates the plastic work to the cohesive energy and is based on purely mechanistic considerations. In this model (West, 1980), it is assumed (following Kfouri & Miller, 1976) that crack propagation occurs as a result of discrete jumps Δa as shown in Figure 2. A characteristic of a microbrittle material is that these incremental jumps are considerably greater than the plastic zone size
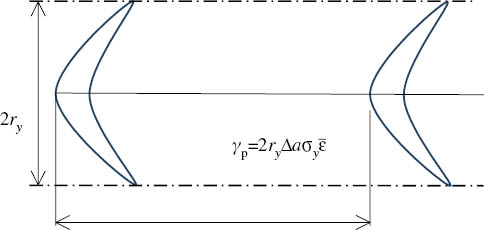
Incremental crack extension Δa in microbrittle material. The blue lines denote the crack face and crack moves from right to left during a crack increment.
with
The thermodynamic criterion for crack initiation is a Griffith-type equation:
Using this equation, the plastic work can be written in terms of the cohesive energy as
Thus, γp is computed to be directly proportional to cohesive energy γ. An interesting case is when the cohesive energy is zero, the plastic work is also computed to be zero. Physically, this implies that the atomic planes can unravel without the need for any dissipation (through dislocation emission). In practice, there are situations where the cohesive energy is extremely low where the critical k is close to zero. One example is 70-30 brass in ammoniacal solution where KIC=200 MNm-1.5 and KIscc=1 MNm-1.5. Another example is the embrittlement of Al by Ga, as seen later in the examples.
2.2 CDE theory (Jokl et al., 1980)
The model by Jokl et al. (1980) is based on the experimental evidence that dislocation emission and breaking of bonds occur simultaneously at a crack tip, with the crack opening displacement (φ) taken to be equal to the total Burgers vector of dislocations emitted from the tip (Figure 3). The plastic work is computed by summing the energy dissipation associated with this dislocation emission from the time of loading until the moment of failure. Failure is considered to occur when a pair of atoms located at the crack tip reaches a critical failure separation (at which the restoring forces between the atom pair vanish). The theory is briefly explained here.
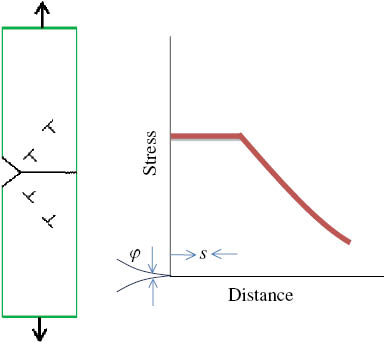
(Left) Schematic representation of microcrack nucleation under local tensile stress. (Right) Schematic representation of the stress relaxation ahead of the microcrack.
2.2.1 Dislocation emission
The rate of increase in crack opening displacement is proportional to the velocity of dislocations υ moving away from the crack tip. The dependence of υ on the local stress τ is commonly expressed in the form of a power law (with exponent n between 1 and 2; Jokl et al., 1980). If g-1 is the linear spacing of emitted dislocations, then
where G is the shear modulus, b is the Burger vector, and φo=gbυo is the constant of proportionality. The local stress τ at the tip of a microcrack is approximated using the DBCS analytical solution of a slit shaped crack. The DBCS solution (Ewing, 1978) is based on a strip zone model of plasticity ahead of the crack (with plastic zone area of φs, where s is the plastic zone length). The expressions for the stress and plastic zone length are obtained (in the limit of small-scale yielding) as:
The plastic work (due to dislocation emission during time t) can be approximated as
In the above model, it is assumed that the dislocation nucleation energy is negligible and all the dissipated energy is related to lattice resistance to dislocation motion. Using Eqs. (4)–(6) in Eq. (7), the plastic work is obtained as follows:
2.2.2 Bond breaking
The value of plastic work at the point of brittle failure is calculated by finding the time taken for a pair of atoms at the crack tip to reach a critical separation δ. In the direction of the bond stretching, the equation of motion of the atom pair is given by,
where m is the mass of one atom, κ is the spring constant of the bond, and b2 is the area per atom. When the applied stress intensity factor (k) is large, the b2τ(t) dominates and the restoring force (κy) term can be neglected in order to obtain an analytical solution for the motion of the atom pair:
where
The time (tB) taken to break the bond, as defined by the condition y(tB)=δ, is given as
Since it is assumed that bond breaking and dislocation emission at the microcrack tip are concomitant, tB can be substituted in Eq. (8) to compute the plastic work at the point of failure:
By absorbing the expressions containing material constants (b, υ, δ, φo, G, m, n) into two other constants (λ, ξ), the above expression can be written as a power law γp=λkξ. Using the thermodynamic criterion for crack initiation [Eq. (2)], the relationship between the cohesive energy and the plastic work can then be obtained as:
3 Results and discussion
In the previous section, two different models that relate the cohesive energy to plastic work were described. Fundamentally, both models employ the use of a thermodynamic criteria E≤0 [Eq. (2)] to model the brittle crack transition. This criterion implies that the crack extends only if the energy dissipated (2γ+γp) can be compensated by the release of elastic energy. There is a critical value of k below which the dissipated energy can remain larger and the crack cannot advance in a brittle manner. This situation corresponds to a ductile material where cracks are blunted by plastic flow. Through Eqs. (3) and (13), it can be seen that the critical k value depends on the magnitude of the cohesive energy. A decrease in cohesive energy (e.g. due to impurity atoms) can convert an otherwise ductile material into one in which brittle fracture may occur. This is exactly the situation that occurs during liquid metal embrittlement (LME). On the other end of the spectrum, addition of impurity atoms can also help enhance the ductility of a material. An example is the addition of carbon to iron.
The microbrittle model, as given by Eq. (3), gives a linear relationship between the cohesive energy and plastic work. The CDE model results in a power law relationship [Eq. (13)] between these variables; with the exponent solely related to the value of n in the power law relating dislocation velocity and the local stress [Eq. (4)]. The value of n typically ranges from large numbers (>30) for low dislocation velocities to a value of zero as the terminal velocity is achieved. Due to high stresses in the tip of the microcrack, high dislocation velocities are expected, corresponding to small values of n (n<2). The microbrittle model and the CDE model are identical if the exponent n in the power law relating dislocation velocity and local stress is chosen to be 1.5. Interestingly, n=1.5 is also a critical exponent in the CDE model. That is, for n<1.5, the CDE model never achieves the critical value Kcr and brittle fracture occurs regardless of the values of the cohesive energy (Jokl et al., 1980). Thus, 1.5<n<2 provides a reasonable bound of values that models the embrittlement process.
The embrittlement process of an Al bicrystal interface due to penetration of Ga along an isolated GB was studied in situ using high-energy x-ray projection microscopy (Pereiro-Lopez, Ludwig, Bellet, Cloetens, & Lemaignan, 2005). The experiment considered Ga penetration along a 150° symmetric tilt around a 0.8-mm-thick <110> Al bicrystal. The experiment reveals that penetration is accompanied by continuous relative separation of the Al grains even in the absence of external stress. The slope of the displacement profile of the intact crystal away from the GB is well represented by a purely isotropic elastic crack propagation solution with a constant stress intensity factor given by
This can be contrasted with the fracture toughness of Al 7075 of KI=27 MPam0.5 (taken to be the mean value of fracture toughness of Al7075 T6 alloy in T-L and L-T orientations; Aluminum 7075-T6, 2015). Note that the plastic zone size scales as square of the stress intensity factor. Although dislocation emission was not measured in the experiment, a plastic zone size that scales as the square of the stress intensity factor of KI=0.045 MPam0.5 is possible. However, the zone size will be several orders of magnitude smaller than during the brittle transition in a pristine Al alloy. To get an approximate value of cohesive energy of the saturated Al/Ga system, we neglect the small plasticity and use the energy balance equation as follows:
Using these experimental data, one could calibrate both the microbrittle model and the CDE model. The constants in these models were obtained by matching KI and KIscc for the corresponding cohesive energies. The parameters in each model are listed in Table 1. The constants computed in the CDE model for Al 7075 are not far from the data from Jokl et al. (1980) for steel, with significant difference only in the power law exponent n. The published data are also tabulated.
Calibrated constants for static and fatigue loading, microbrittle, and CDE models.
| Al 7075 | |
|---|---|
| ξ | 2.0002 (2.0952 for Ni-Cr steel [3]) |
| λ (*G(ξ-1)b(0.5ξ-1)) | 0.3497 (0.3095 for Ni-Cr steel [3]) |
| α(*G) | 0.3499 |
| c 1 | 2.0002 |
| c 2 | 2.0002 |
|
|
0.3497 |
|
|
0.3495 |
| N th | 5.8 |
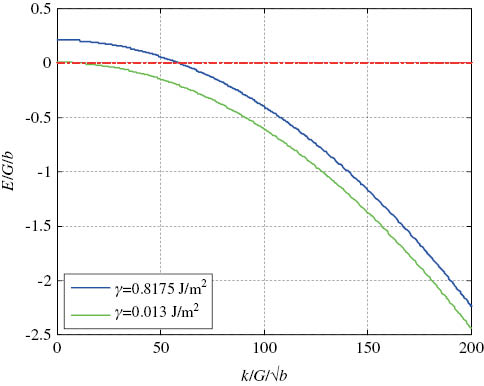
The dependence of energy E on k using the CDE theory and microbrittle model for two different values of γ is shown in Figures 4 and 5, respectively. These plots are normalized with the shear modulus and the Burgers vector of Al (b=2.862 Å). When the energy becomes negative (i.e. the curve intersects the x-axis), the crack becomes unstable, leading to brittle failure. The k value at which the energy becomes negative is hereafter referred to as Kcr.
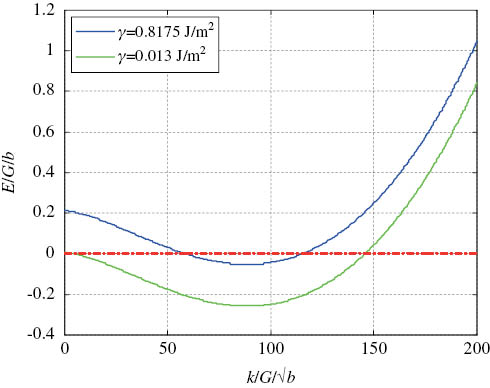
Dependence of energy of the system on stress intensity for various cohesive energies using the CDE approach.
Dependence of energy of the system on stress intensity for various cohesive energies using microbrittle model.
For the material parameters used here, the CDE model has an inflection point and can have up to two solutions, with the lower of the two k values determining the critical stress intensity factor Kcr. When γ is large enough, the inflection may happen at positive values of E and the curve in Figure 4 (CDE model) will not have any solutions. At these high values of γ, the material remains ductile and the dissipated energy is larger than the elastic strain energy release at all times, with the crack continuously blunted by the plastic flow. This situation happens only in the CDE model. The microbrittle model gives a monotonically decreasing function that has only one solution. This implies that all values of γ lead to brittle fracture if a sufficiently large stress intensity factor is applied. As explained previously, for n<1.5, the CDE model will also show behavior similar to the microbrittle model (Jokl et al., 1980).
The critical stress intensity Kcr and the corresponding plastic work
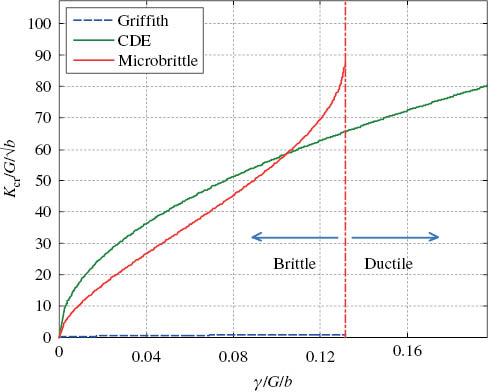
Dependence of critical stress intensity on GB cohesive energy.
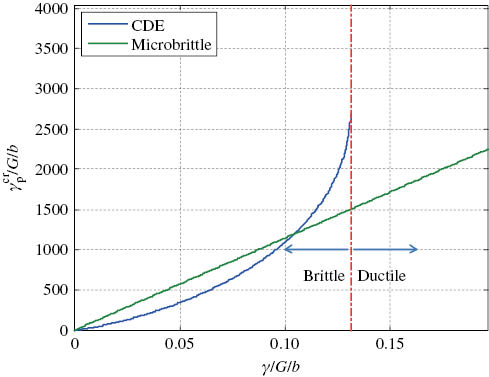
Dependence of critical plastic work on GB cohesive energy.
At the same time, when γ<γM, it is seen from Figure 7 that
For practical engineering applications, Figure 6 provides valuable data correlating the fracture toughness and the external environment. The plot directly correlates the chemistry (through the cohesive energy) to the mechanics (the fracture toughness). A more useful plot that correlates the concentration of impurity atoms to the fracture toughness can be obtained by integrating this plot with atomistic (DFT) calculations of the cohesive energy.
For this purpose, we use the data from Yamaguchi et al. (2010), where the cohesive energy of Al Σ5(012) symmetrical tilt (tilt angle of 36.9°) GB was computed with and without Ga substitution (Figure 8). The data were obtained from structurally relaxed calculations using the VASP software (VASP Group, Theoretical Physics Department, Vienna, Austria) employing the Perdew-Burke-Ernzerhof Projector augmented-wave method (PAW-PBE) exchange correlation function. The area of the Σ5 GB is 37.3 Å2. When one of the Al atoms in the GB was replaced with a Ga atom, the GB energy (γgb) relaxed by 0.06 eV and the surface energy (2γs) relaxed by 0.35 eV. The change in cohesive energy is the difference, i.e. 0.29 eV/atom, equal to Δγga=0.1245 J/m2 when converted to SI units. Thus, addition of a gallium atom to the Al GB is energetically favorable and releases 0.1245 J/m2 of strain energy in the material.
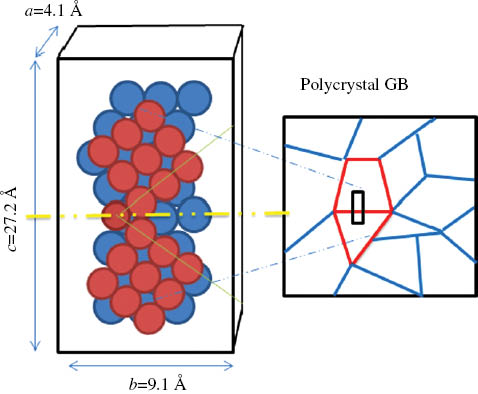
Modeling of FCC Al GB (from Yamaguchi et al., 2010).
The effect of penetration of multiple Ga atoms is modeled by linearly scaling the energy with the number of atoms, as employed by Yamaguchi and Kameda (2014). A rough calculation of the critical number of Ga atoms for complete loss of cohesion is given by ncritΔγga=(2γsat-2γvac) Yamaguchi and Kameda (2014), leading to ncrit=13. The calculation indicates that the addition of Ga atoms starts to decrease the cohesive energy until complete decohesion occurs when 13 atoms wet either side of the GB. At this point, more gallium atoms flow into the GB in an invasion-like manner. Experiments lend credence to such a mechanism and a fast linear penetration rate of 3.4 μm/s has been measured (Pereiro-Lopez et al., 2005).
In the following calculation, we base our results on the Σ5 GB calculation for demonstration. The cohesive energy was expressed as a function of number of atoms (n) using 2γ=2γvac-nΔγga and the data were employed in the microbrittle and CDE models to compute the Kcr as a function of n. In practice, cohesive energy changes with GB character (Rajagopalan, Bhatia, Tschopp, Srolovitz, & Solanki, 2014) and a range of γsat can be expected. The dependence of energy (E) on stress intensity is plotted in Figures 9 and 10 using the CDE and microbrittle models, respectively. The plots are identical to the earlier plots shown in Figures 4 and 5 except that the results are shown as a function of the number of Ga atoms at the GB.
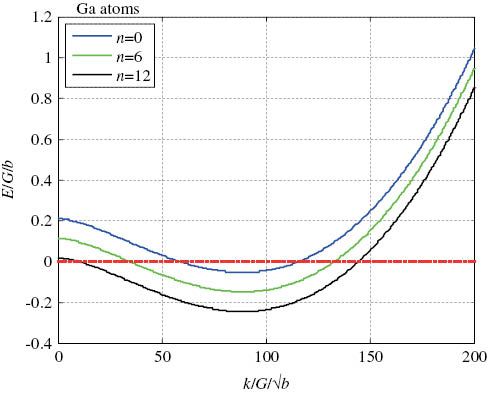
Dependence of energy on stress intensity using the CDE approach.
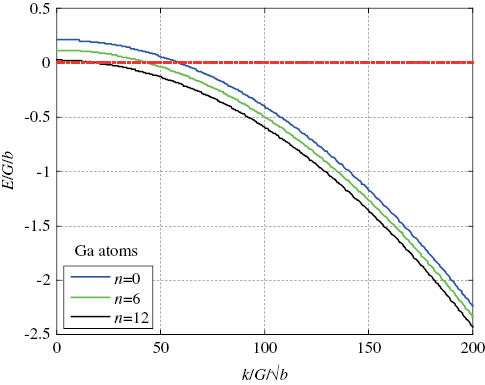
Dependence of energy on stress intensity using the microbrittle model.
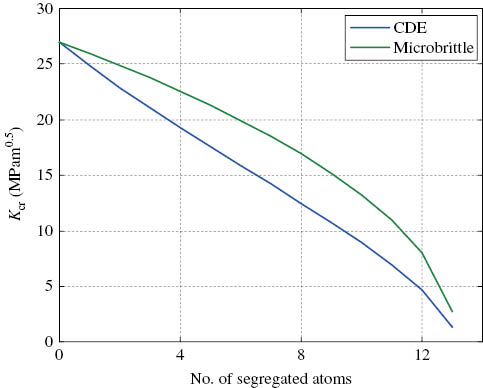
The results show that the critical stress intensity factor (as measured by the location where energy E becomes negative) decreases with the number of atoms at the GB. The critical stress intensity factor is small (Kcr=4.6 MPam0.5 in the CDE theory and Kcr=7.9 MPam0.5 in the microbrittle theory) when 12 Ga atoms accumulate at the GB. Using these results, we replace the cohesive energy in the x-axis of Figure 6 with the number of Ga atoms at the GB, and the result is shown in Figure 11.
Variation of critical stress intensity with segregation of Ga atoms.
Table 2 summarizes the data shown in Figure 11. The CDE model shows a sharper drop in critical stress intensity factor for small amount of segregated atoms compared to the microbrittle model.
Critical stress intensity with adsorption of Ga atoms.
| No. of adsorbed Ga atoms | Critical stress intensity factor Kcr (MPam0.5) |
|
|---|---|---|
| CDE theory | Microbrittle model | |
| 0 | 27.0 | 27.0 |
| 2 | 22.9 | 24.9 |
| 4 | 19.2 | 22.5 |
| 6 | 15.8 | 19.9 |
| 8 | 12.4 | 16.9 |
| 10 | 8.9 | 13.2 |
| 12 | 4.6 | 7.9 |
| 13 | 1.3 | 2.7 |
The Kcr values for the CDE model are consistently lower than those for the microbrittle model for the same number of segregated Ga atoms. The critical stress intensity factor predicted by the microbrittle model gets closer to the CDE model predictions as the segregation reaches the saturated state.
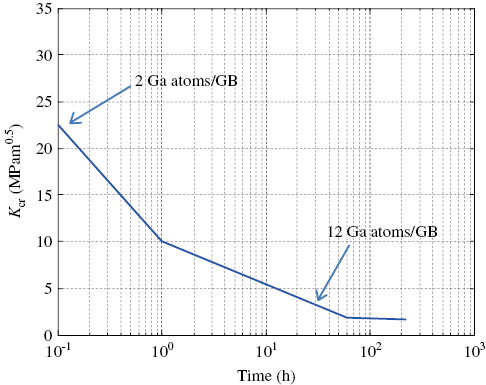
The variation in critical stress intensity with time for a WOL specimen of Al 7075 alloy exposed to Ga as reported in Chu et al. (1999) is shown in Figure 12. In the experiment, the time to crack initiation was monitored using an optical microscope under various applied loads (KI). From this plot, the average concentration of Ga atoms at the grain boundaries at the point of crack nucleation can be inferred using data listed in Table 2. Within 6 min of exposure to gallium, the critical stress intensity drops to 22 MPam0.5, corresponding to about two atoms of Ga per GB as per CDE theory. Within an hour of exposure, the critical stress intensity factor is just 10 MPam0.5, corresponding to nine atoms of Ga per GB.
Critical stress intensity vs. time to crack initiation of 7075 alloy in liquid Ga (Chu et al., 1999).
The concentrations reported here can be assumed to be an average across the several grain boundaries around the crack tip within a process zone. While the lower average concentrations are reached quickly (within an hour of exposure), it takes a lot more time to reach the saturation concentrations across all grain boundaries. The threshold stress intensity factor for crack nucleation (1.7 MPam0.5) is reached only after over 100 h of exposure, corresponding to the saturated state of 13 atoms per GB. While the current model does not include the kinetics of gallium transport, it would be of value to develop transport (e.g. percolation) models (Hugo and Hoagland, 2000) that can be used to correlate the average concentration and time in a more predictive manner.
3.1 Extension to modeling threshold fatigue behavior
The analysis described here may also be extended to modeling threshold fatigue crack response where material failure occurs at stresses much smaller than the static fracture stresses under repeated loading and unloading. Mura (1987) derived an expression for the total plastic work during fatigue for a slit-like crack as a function of number of loading cycles N. In this analysis, the displacement field of a Dugbale-Barenblatt slit-shaped crack problem was solved using the Papkovich-Neuber potential. Based on this solution, plastic work is taken to be of the form
where c1, c2, C1, and C2 are four material constants. In a similar vein to the static analysis, we can assume that the crack becomes unstable when total elastic energy release rate exceeds the dissipation. That is, the thermodynamic criterion for crack initiation is
The first two terms are the energy release rate for cyclic loading (from Mura, 1987). Figure 13 shows a schematic representation of fatigue crack growth behavior under inert and aggressive environments for Al alloys. At the threshold stress intensity amplitude ΔKth, the crack growth rate da/dN tends to zero. Eq. (15) specifically models the threshold behavior, which is interpreted as the loading (ΔKth) at which the microcrack becomes unstable [E<0 in Eq. (15)]. It is also seen from Figure 13 that the presence of aggressive environment such as liquid metal (Ga) exposure reduces ΔKth (Vasudevan & Sadananda, 2009). To explain this effect using Eq. (15), we first assume that the power law constants c1=ξ and C1=λ for the first term in Eq. (14) are unchanged from the results of the static loading analysis [Eq. (13)]. Secondly, it is assumed that the power law exponent for the second term involving Δk in Eq. (14) is the same as the first term involving k (i.e. c1=c2). To obtain C2, we use the threshold stress intensity curve for Al 7075 obtained from experiments done in vacuum (Lafarie-Frenot & Gasc, 1983) as shown in Figure 14. In these experiments, the thresholds were identified from the Paris law measured at different R ratios in vacuum. The curve fit was validated by threshold stress intensity amplitude ΔKth measured at a high fatigue ratio R (Kmin/Kmax) (Lee, Glinka, Vasudevan, Iyyer, & Phan, 2009). The number of cycles to failure (Nth) was not reported by Lafarie-Frenot and Gasc (1983), and hence, we fitted both Nth and C2 to the experimental vacuum data as shown in Figure 14. All material parameters in the model are listed in Table 1.
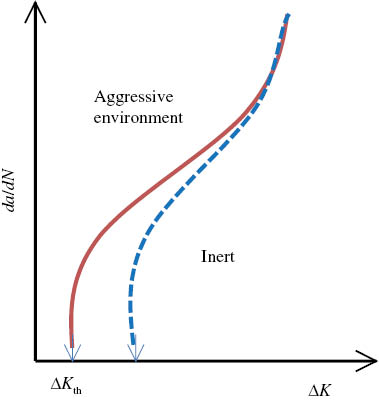
Schematic representation of threshold fatigue behavior in inert and aggressive environment (Vasudevan & Sadananda, 2009).
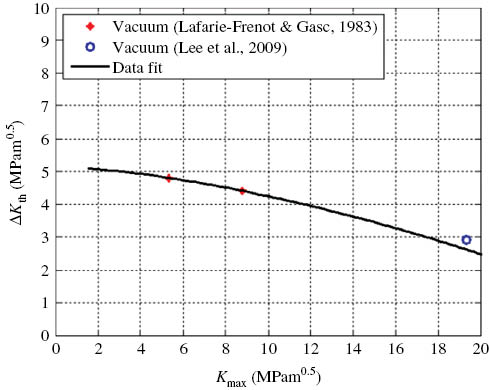
Fundamental threshold curve, plot, showing experimentally measured variation of ΔKth with Kmax.
Using this model, the variation of energy E with Kmax for various fatigue ratios, R, was computed and plotted in Figure 15. Crack initiation occurs when the energy E becomes negative. In this figure, R=1 corresponds to the static loading case. As R decreases, stress intensity (Kmax) leading to failure decreases, consistent with experimental observations. Figure 16 shows the variation in fatigue threshold stress intensity amplitude ΔKth with γ for different R ratios. For a given GB cohesive energy, ΔKth decreases with an increase in fatigue ratio. It is also seen that ΔKth approaches zero as the cohesive energy decreases for all fatigue ratios. This is due to the fact that a decrease in cohesive energy makes the material more susceptible to failure, leading to lower threshold stress intensity amplitudes. Thus, the simple model is able to qualitatively capture the threshold fatigue behavior of Al 7075 alloys. A further quantitative development of the present approach can be achieved by developing a multiscale interpretation (e.g. through dislocation emission theory) for the plastic work in Eq. (14) as well as experiments that capture the cycle (N) dependence along with the threshold loads both in vacuum and aggressive environments.
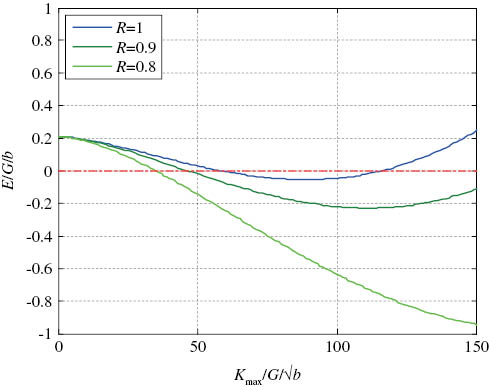
Variation of energy with Kmax for different fatigue ratios.
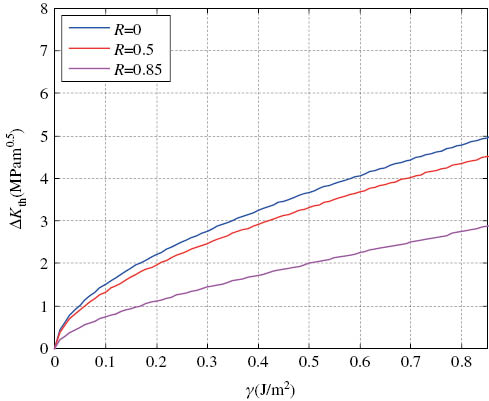
Variation of ΔKth with GB cohesive energy for different fatigue ratios.
4 Conclusions
We have shown that it is possible to link the mechanics and chemistry of intergranular fracture by using models that link plastic work to the cohesive energy (work of ideal fracture). Two models, based on a small-scale yielding assumption, that provide such a relationship were compared. We find that both models capture the sharp drop in fracture toughness seen during LME of Al by Ga. This is explained by the drastic effect of the decrease in cohesive energy due to segregation of impurity atoms at grain boundaries on the plastic dissipation work. The microbrittle model gives a linear relationship between the plastic dissipation and the cohesive energy. In this model, the brittle-to-ductile transition observed at larger values of cohesive energy is not captured. The CDE model gives a closed form expression for γp in terms of γ in the form of a power law. In this model, a clear brittle-to-ductile transition is observed when cohesive energies are high, at which point the increase in plastic dissipation cannot be compensated by the elastic release of strain energy due to cracking. We show that the microbrittle model, by itself, can be considered as a special case of CDE theory if the velocity of emitted dislocations scaled with crack tip stresses with a power law exponent of 1.5. Recent evidence from Yamaguchi and Kameda (2014) also points to the use of such relationship between γ and γp to predict embrittlement of steel with other compounds such as antimony (Sb), tin (Sn), and phosphorus (P).
For practical engineering applications, it may be valuable to correlate fracture toughness with impurity concentration and time of exposure. For this purpose, we employed first principles data to correlate the concentration of impurity atoms at GB to the fracture toughness predicted by these models. The data predict a saturation concentration of 13 gallium atoms per GB in order to achieve a threshold stress intensity factor. While the current model does not include the kinetics of gallium transport, it would be of value to develop transport (e.g. percolation) models (Hugo & Hoagland, 2000) that can be used to correlate the concentration to time in a more predictive manner. Another extension of the model for modeling threshold fatigue behavior was considered. The results are qualitative, in that the form of the plastic work was assumed and the model reproduces the trends observed during threshold fatigue. The interdependence between threshold fatigue parameters (Kmax and ΔKth) can be captured, with the thresholds decreasing at all fatigue ratios as a result of a decrease in cohesive energy due to segregation. A further quantitative development of the present approach can be achieved by developing a mechanistic link to the interpretation of plastic work in Eq. (21) and directed threshold fatigue experiments in vacuum as well as aggressive environments that also capture the cycle dependence. Work in these directions is underway.
About the authors

Sriram Ganesan graduated with a Bachelor’s-Master’s Dual Degree (B.Tech-M.Tech) in Aerospace Engineering from the Indian Institute of Technology, Kanpur in 2012. He is currently pursuing a PhD in Aerospace Engineering at the University of Michigan, Ann Arbor. His current research is focused on multi-scale modeling of crack initiation and developing improved crystal plasticity constitutive models for predicting deformation response of magnesium alloys.

Veera Sundararaghavan is an Associate Professor in the Department of Aerospace Engineering and the Director of the Multi-scale Structural Simulations Laboratory (MSSL) at the University of Michigan. He received his PhD in Mechanical Engineering from Cornell University in 2007 and his Bachelor’s and Master’s degrees from the Indian Institute of Technology, Madras. He is a recipient of a National Science Foundation CAREER award and a Defense Threat Reduction Agency Young Investigator award for research in multi-scale materials modeling and integrated computational materials engineering (ICME).
Acknowledgments
We gratefully acknowledge the support of the Office of Naval Research Fatigue and Fracture Program via grant N00014-12-1-0567. We acknowledge Dr. A.K. Vasudevan for his scientific guidance during the course of this research.
References
Aluminum 7075-T6, 7075-T651. ASM Material Data Sheet. 2015. Retrieved from http://asm.matweb.com/. Accessed on January 1, 2015.Suche in Google Scholar
Chu WY, Liu XM, Luo JL, Qiao LJ. Mechanism of embrittlement of Al alloy by liquid metal (Ga). Can Metall Q 1999; 38: 127–132.10.1179/cmq.1999.38.2.127Suche in Google Scholar
Dawson I, Bristowe PD, Lee MH, Payne MC, Segall MD, White JA. First-principles study of a tilt grain boundary in rutile. Phys Rev B 1996; 54: 13727.10.1103/PhysRevB.54.13727Suche in Google Scholar
Duscher G, Chisholm MF, Alber U, Rühle M. Bismuth-induced embrittlement of copper grain boundaries. Nat Mater 2004; 3: 621–626.10.1038/nmat1191Suche in Google Scholar PubMed
Ewing DJF. Strip yield models of creep crack incubation and growth. Int J Fract 1978; 14: 101–117.10.1007/BF00032388Suche in Google Scholar
Hugo RC, Hoagland RG. The kinetics of gallium penetration into aluminum grain boundaries – in situ TEM observations and atomistic models. Acta Mater 2000; 48: 1949–1957.10.1016/S1359-6454(99)00463-2Suche in Google Scholar
Jokl ML, Vitek V, McMahon CJ. A microscopic theory of brittle fracture in deformable solids: a relation between ideal work to fracture and plastic work. Acta Mater 1980; 28: 1479–1488.10.1016/0001-6160(80)90048-6Suche in Google Scholar
Kfouri AP, Miller KJ. Crack separation energy rates in elastic-plastic fracture mechanics. Proc Inst Mech Eng 1976; 190: 571–584.10.1243/PIME_PROC_1976_190_060_02Suche in Google Scholar
Lafarie-Frenot MC, Gasc C. The influence of age hardening on fatigue crack propagation behaviour in 7075 aluminium alloy in vacuum. Fatigue Fract Eng Mater Struct 1983; 6: 329–344.10.1111/j.1460-2695.1983.tb00348.xSuche in Google Scholar
Lee EU, Glinka G, Vasudevan AK, Iyyer N, Phan ND. Fatigue of 7075-T651 aluminum alloy under constant and variable amplitude loadings. Int J Fatigue 2009; 31: 1858–1864.10.1016/j.ijfatigue.2008.11.013Suche in Google Scholar
Mura T. Micromechanics of defects in solids. Vol. 3. Springer, 1987: 268–272, Dordrecht, Netherlands.10.1007/978-94-009-3489-4Suche in Google Scholar
Orowan E. Notch brittleness and the strength of metals. Trans Inst Eng Shipbuilders Scotland 1945; 89: 165.Suche in Google Scholar
Pereiro-Lopez E, Ludwig W, Bellet D, Cloetens P, Lemaignan C. Direct evidence of nanometric invasionlike grain boundary penetration in the Al/Ga system. Phys Rev Lett 2005; 95: 215501.10.1103/PhysRevLett.95.215501Suche in Google Scholar PubMed
Rajagopalan M, Bhatia MA, Tschopp MA, Srolovitz DJ, Solanki KN. Atomic-scale analysis of liquid-gallium embrittlement of aluminum grain boundaries. Acta Mater 2014; 73: 312–325.10.1016/j.actamat.2014.04.011Suche in Google Scholar
Rice JR. Plastic yielding at a crack tip. International Conference on Fracture, Japan, 1965.Suche in Google Scholar
Thomson DI, Heine V, Payne MC, Marzari N, Finnis MW. Insight into gallium behavior in aluminum grain boundaries from calculation on Σ=11 (113) boundary. Acta Mater 2000; 48: 3623–3632.10.1016/S1359-6454(00)00175-0Suche in Google Scholar
Vasudevan AK. Applied stress affecting the environmentally assisted cracking. Metall Mater Trans A 2013; 44: 1254–1267.10.1007/s11661-012-1585-7Suche in Google Scholar
Vasudevan AK, Sadananda K. Classification of environmentally assisted fatigue crack growth behavior. Int J Fatigue 2009; 31: 1696–1708.10.1016/j.ijfatigue.2009.03.019Suche in Google Scholar
West JM. Chemical potential and surface energy in stress–corrosion cracking. Met Sci 1980; 14: 534–540.10.1179/030634580790426067Suche in Google Scholar
Wu R, Freeman AJ, Olson GB. First principles determination of the effects of phosphorus and boron on iron grain boundary cohesion. Science 1994; 265: 376–380.10.1126/science.265.5170.376Suche in Google Scholar PubMed
Yamaguchi M, Kameda J. Multiscale thermodynamic analysis on fracture toughness loss induced by solute segregation in steel. Philos Mag 2014; 94: 2131–2149.10.1080/14786435.2014.906757Suche in Google Scholar
Yamaguchi M, Ebihara K, Itakura M, Suzudo T, Kaburaki H. Decohesion of Al grain boundary by hydrogen and liquid metals: a first-principles study. In Proceedings of 12th International Conference on Aluminum Alloys (ICAA-12), Yokohama, Japan, 2010.Suche in Google Scholar
Yamaguchi M, Ebihara KI, Itakura M, Kadoyoshi T, Suzudo T, Kaburaki H. First-principles study on the grain boundary embrittlement of metals by solute segregation: part II. Metal (Fe, Al, Cu)-hydrogen (H) systems. Metall Mater Trans A 2011; 42: 330–339.10.1007/s11661-010-0380-6Suche in Google Scholar
©2015 by De Gruyter
Artikel in diesem Heft
- Frontmatter
- In this issue
- Editorial
- International Symposium on Environmental Damage Under Static and Cyclic Loads in Structural Metallic Materials at Ambient Temperatures III (Bergamo, Italy, June 15–20, 2014)
- Overviews and reviews
- U.S. Naval Aviation: operational airframe experience with combined environmental and mechanical loading
- Thirty-five years in environmentally assisted cracking in Italy: a point of view
- Fatigue and corrosion fatigue
- Transgranular corrosion fatigue crack growth in age-hardened Al-Zn-Mg (-Cu) alloys
- Effect of cyclic frequency on fracture mode transitions during corrosion fatigue cracking of an Al-Zn-Mg-Cu alloy
- Crack growth behavior of 4340 steel under corrosion and corrosion fatigue conditions
- Modeling of environmentally assisted fatigue crack growth behavior
- Factors influencing embrittlement and environmental fracture
- Pre-exposure embrittlement of an Al-Cu-Mg alloy, AA2024-T351
- Electrochemical approach to repassivation kinetics of Al alloys: gaining insight into environmentally assisted cracking
- Localized dissolution of grain boundary T1 precipitates in Al-3Cu-2Li
- Grain boundary anodic phases affecting environmental damage
- Defect tolerance under environmentally assisted cracking conditions
- Role of Mo/V carbides in hydrogen embrittlement of tempered martensitic steel
- Stress corrosion cracking
- The role of crack branching in stress corrosion cracking of aluminium alloys
- An atomistically informed energy-based theory of environmentally assisted failure
- Discrete dislocation modeling of stress corrosion cracking in an iron
- Quasi-static behavior of notched Ti-6Al-4V specimens in water-methanol solution
- Role of excessive vacancies in transgranular stress corrosion cracking of pure copper
- Multiscale investigation of stress-corrosion crack propagation mechanisms in oxide glasses
- Hydrogen assisted cracking
- Hydrogen effects on fracture of high-strength steels with different micro-alloying
- Environmentally assisted cracking and hydrogen diffusion in traditional and high-strength pipeline steels
- Multiscale thermodynamic analysis on hydrogen-induced intergranular cracking in an alloy steel with segregated solutes