Theory vs practice: Patterns of the ASEAN-10 agri-food trade
-
Tamás Mizik


Abstract
During the past decades, agricultural trade is enormously expanded. One of its driving factors is the World Trade Organization. However, regional agreements can give further trade opportunities for the participating countries. Association of Southeast Asian Nations (ASEAN) is one of them. This article aims to give a detailed overview of ASEAN members’ agri-food trade by using the world and regional level data. The country level competitiveness is calculated by four different Balassa-type indices and highlights whether the agri-food trade (practice) of these countries is in line with the revealed comparative advantages/competitiveness of the different product groups (theory). According to the results, commodities with the highest comparative advantages overlap with the most important export products. This confirms a tight connection between theory and practice. It should also be noted that world level values are generally higher than that of the regional levels. Moreover, countries with significant agri-food production (Thailand, Indonesia, Vietnam, and Malaysia) can be characterized by higher comparative advantages compared to the other ASEAN member states. These results can help to better understand these countries’ trade specialization and international trade performance.
1 Introduction
It has been 27 years since the World Trade Organization (WTO) was established at the GATT’s Uruguay Round. Currently, it has 164 member states, including all the 10 members of the Association of Southeast Asian Nations (ASEAN). The main goal of the WTO is “to ensure that trade flows as smoothly, predictably and freely as possible” (WTO website 2020). However, the effects of the WTO agreements can be questioned, for example, Rose (2004) could not find their substantive impact on international trade. As regional agreements can give further trade opportunities for the participating countries, their increasing number can be witnessed. Currently, there are 304 regional agreements in force, including the ASEAN Free Trade Area (WTO RTA 2020). The impact of this agreement on agricultural trade is strong as ASEAN members (Brunei, Cambodia, Indonesia, Laos, Malaysia, Myanmar, the Philippines, Singapore, Thailand, and Vietnam) apply and maintain a strong market protection (tariff and nontariff measures) level for agricultural products (Febriningtyas et al. 2018). By analyzing five ASEAN member states, Hamid and Aslam (2017) identified policy mismatch as a barrier of further integration of the agriculture industry.
The objectives of ASEAN are as follows (ASEAN 2015): (i) a highly integrated economy, essentially embodied in the free trade area; (ii) a competitive, innovative, and dynamic region, with such elements as consumer protection or sustainability; (iii) tighter connection and sectoral co-operation in the field of e-commerce, agriculture, food industry, etc.; (iv) a flexible, inclusive, and people-centered region, including a strong private sector or reduction of the economic disparities between its members; and (v) integration into the global economy.
As a result of the cooperation, a closer economic relationship was established among the members, which is expected to be reflected in their trade data. This article aims to present the characteristics of both extra-trade and intra-trade and their comparison by using four different types of Balassa indices (RCA, revealed comparative advantage; RSCA, revealed symmetric comparative advantage; RTA, relative trade advantage; RC, revealed competitiveness). The major contribution to the existing literature is the comprehensive, detailed agri-food trade analysis of each ASEAN member state (practice) and its comparison with the results of the different Balassa indices (theory). This gives the opportunity to compare world and regional level data to reveal the agri-food trade differences between the different destinations. Therefore, the major research question of this study is whether the practice (agri-food trade of the ASEAN countries) and the theory (revealed trade advantage and competitiveness) show similar patterns on the product group level. The detailed dataset provided the opportunity to analyze this question on both regional (ASEAN level) and world levels. The general expectation is that the most important export products have revealed trade advantage and/or revealed trade competitiveness.
The structure of this article is as follows. Section 2 summarizes the related literature, where the different ASEAN countries were analyzed with the same tools that are used in this article. Section 3 provides a detailed overview of the methodologies applied and the data sources used. Section 4 presents the outline of the basic trade characteristics of the ASEAN countries. Section 5 presents the analysis of the region’s agri-food trade by different Balassa-type indices (RCA, RSCA, RT, and RC). Section 6 concludes this study.
2 Literature review
Comprehensive, ASEAN level agri-food trade analysis is very rare in the international literature. Some of the related articles deal with comparisons between one chosen country (mostly India) and the ASEAN countries. Chandran (2011) used the trade intensity index and revealed the comparative advantage to analyze the trade between India and the ASEAN between 1990 and 2007. According to his results, most of the significant ASEAN agri-food producers had comparative advantage for both agricultural and food products (Vietnam, Thailand, Indonesia, Malaysia, and the Philippines in a decreasing order of the RCA values). As a matter of the fish and different fish products, most of the ASEAN countries showed revealed competitiveness, but lower than that of India (Chandran and Sudarsan 2012). It was one of the major reasons why the import of marine products did not increase substantially even in case of a tariff reduction. Based on the Balassa and Lafay index, Reyes (2014) showed high indices in the agri-food sector for most of the analyzed ASEAN-6 countries, except for Brunei and Singapore between 2007 and 2011. The highest comparative advantage was noted in Indonesia for animal or vegetable fats and oils and their cleavage products, prepared edible fats, and animal or vegetable waxes. This product group enjoyed strong comparative advantage in Malaysia and the Philippines.
Other authors carried out country-level and mostly sector-specific studies by using Balassa type indices. Riandi and Pratomo (2017) used RCA and dynamic RCA (DRCA) for Indonesia. He found revealed comparative advantages for at least 40% of the commodities between 2003 and 2013, including fish and fish products or edible fruits and nuts. On the basis of the relative export competitiveness and the relative symmetric export competitiveness, Kea et al. (2020) obtained an increasing trend of competitiveness of the Cambodian rice export; however, these values were lower than those of its major competitors. The authors highlighted the importance of the domestic supply/demand management as a critical element of maintaining this competitiveness. Suntharalingam and Othman (2017) obtained comparative advantages for Malaysia over some of its rivals for the selected commodities (banana, watermelon, papaya, pineapple, starfruit, and mango), but highlighted the need for adoption of innovative technologies to customize them according to the market needs. The shrimp sector, in general, showed comparative disadvantage, except the nonfrozen shrimp in the period of 1999–2009 (Khai et al. 2016). Khai et al. (2016) also found that, contrary to Malaysia, Thailand showed remarkable trade competitiveness in the shrimp sector. Benalywa et al. (2019) used four Balassa type indices (RXA, RTA, ln RXA, and RC) for the Malaysian broiler industry from 2009 to 2017. They compared these results with Thailand, the Netherlands, Indonesia, and the Philippines. According to their results, countries’ performance varied from one subgroup to the other. Only whole chickens and capons and frozen subgroup showed overall trade competitiveness in Malaysia, but the authors highlighted the importance of new technologies and cost competitiveness, particularly feed cost, to deal with the continuously increasing market competition. Zhang and Chen (2019) concluded that Myanmar has a great agricultural potential; however, achieving that requires policy actions and investments, especially in the processing sector. Thailand showed substantial international competitiveness in the tuna industry in 1996–2006; however, profitability requires merger of small farms (Kuldilok et al. 2013). By using RTA index for Vietnam, Hoang et al. (2017) found competitive advantage for 27 agricultural sectors, particularly for wood in chips, spices, and rice, and competitive disadvantage for 34 sectors, particularly for cotton, unmilled maize, and animal feed, in 2014. They also identified with convergency, meaning increasing competitiveness in the initial weak competitive sectors and decreasing competitiveness in the initial strong competitive sectors.
3 Methodology and materials
The importance of agriculture can be measured by three widely used indicators: agricultural value added as a share of gross domestic product (GDP) (%), the share of agricultural employment (%), and the gross agricultural output in million constant 2004–2006 international dollars. The latter one is a theoretical currency used by FAO (Food and Agriculture Organization), World Bank, IMF (International Monetary Fund), or UN (United Nations). It combines the exchange rate, purchasing power parity, and international average prices of commodities. It shows the purchasing power that the US dollar had in the United States in the given year. Therefore, it is better for comparisons, but cannot be directly converted into other currencies simply using exchange rates. These data can be downloaded from the World Bank’s WDI (World Development Indicators) database and the FAO’s databank.
To explore the trade patterns more deeply, a wide range of Balassa indices are employed. The original index of the revealed comparative advantage is defined as follows (Balassa 1965):
where X means exports, i indicates a given country, j is a given product, t is a group of products, and n is a group of countries. The revealed comparative advantage (or disadvantage) can be calculated by comparing a given country’s export share with its total exports with the export share to total exports of a reference group of countries. This article uses “world,” as well as ASEAN countries, as a reference group. If the B index is higher than 1, the given country has a comparative advantage compared to the reference countries, or in contrast, the given country has a revealed comparative disadvantage if B is less than 1. RCA is an outstanding tool of descriptive trade statistics and can help to avoid misinterpretation of sectoral or country-level results (Deardorff 2011). This can be a useful analytical tool in the detection of comparative advantages and predicting its dynamics in a changing environment, such as market changes (Hoang and Tran 2019).
However, it was criticized because it does not deal directly with the different effects of agricultural policies and exhibits asymmetric values. The relatively long time series helps to lower the possible distortion. Moreover, due to the asymmetric value of the B index, it extends from 1 to infinity if a country enjoys a comparative advantage, but in the case of comparative disadvantage, it varies between 0 and 1, which overestimates a sector’s relative weight. Therefore, other RCA-related indices were computed to deal with this distortion.
First, the RSCA normalizes the value of RCA, ranging from −1 to +1 (Dalum et al. 1998). Laursen (1998) identified this index as RSCA, and it is calculated as follows:
According to Laursen (2015), this index gives the best measure of the comparative advantage.
Both RCA and RSCA can be classified into four groups (Hinloopen and Marrewijk 2001):
No comparative advantage when 0 < RCA < 1 or −1 < RSCA < 0;
Low comparative advantage when 1 < RCA < 2 or 0 < RSCA < 0.33;
Medium comparative advantage when 2 < RCA < 4 or 0.33 < RSCA < 0.6;
Strong comparative advantage when 4 < RCA or 0.6 < RSCA.
Besides, two modified indices are calculated, the RTA and the revealed competitiveness (RC), both were offered by Vollrath (1991). The RTA is equal to the difference between RXA and RMA:
where RXA stands for the relative export advantage (calculated as the original RCA index), while RMA, as its counterpart), is the relative import advantage (Vollrath 1991). The latter equation is the same as the original RCA index, but export is replaced by import. This is the most important difference between the previous indices and the RTA, which takes import into account. It shows relative comparative trade advantage when RTA > 1, relative comparative trade disadvantage when RTA < 1, while zero means none of them.
Finally, RC can be calculated as the difference between the natural logarithm of RXA and RMA:
Its positive value indicates revealed competitiveness, while its negative value means the lack of it.
The data source of agricultural exports, imports, and trade balances, as well as the detailed analysis, was downloaded from World Bank’s WITS (World Integrated Trade Solution) database at HS-2 level for agricultural products (Chapters 1–24) for the period of 2000–2019 in line with the Cambodian accession in 1999. The codes for each product group are presented in Table 1.
Codes of product groups by HS-2 classification
| Product groups | Code |
|---|---|
| Live animals | 1 |
| Meat and edible meat offal | 2 |
| Fish and crustaceans, molluscs, and other aquatic invertebrates | 3 |
| Dairy produce, birds’ eggs, natural honey, edible products of animal origin not elsewhere specified or included | 4 |
| Products of animal origin, not elsewhere specified or included | 5 |
| Live trees and other plants, bulbs, roots and the like, cut flowers and ornamental foliage | 6 |
| Edible vegetables and certain roots and tubers | 7 |
| Edible fruit and nuts, peel of citrus or melons | 8 |
| Coffee, tea, mat, and spices | 9 |
| Cereals | 10 |
| Products of the milling industry, malt, starches, inulin, wheat gluten | 11 |
| Oil seeds and oleaginous fruits, miscellaneous grains, seeds and fruit, industrial or medicinal plants, straw and fodder | 12 |
| Lac, gums, resins, and other vegetable saps and extracts | 13 |
| Vegetable plaiting materials, vegetable products not elsewhere specified or included | 14 |
| Animal or vegetable fats and oils and their cleavage products, prepared edible fats, animal or vegetable waxes | 15 |
| Preparations of meat, of fish or of crustaceans, molluscs, or other aquatic invertebrates | 16 |
| Sugar and sugar confectionery | 17 |
| Cocoa and cocoa preparations | 18 |
| Preparations of cereals, flour, starch or milk, pastrycooks’ products | 19 |
| Preparations of vegetables, fruit, nuts, or other parts of plants | 20 |
| Miscellaneous edible preparations | 21 |
| Beverages, spirits and vinegar | 22 |
| Residues and waste from food industries, prepared animal fodder | 23 |
| Tobacco and manufactured tobacco substitutes | 24 |
World Bank’s WITS database (2020).
Trade data have been categorized into ASEAN and the World subgroups to identify intra-trade (within the community) and extra-trade (outside the community) patterns. In case of missing values for world trade and ASEAN trade, shares from the other years were used to estimate them as they showed a relatively stable pattern.
-
Ethical approval: The conducted research is not related to either human or animal use.
4 Basic trade characteristics of the ASEAN countries
The three indicators presented in the methodological section are summarized in Figure 1, in which the size of the circles represents the size of the gross agricultural production measured in millions of international dollars. The centers of the circles are the agricultural value added as a share of GDP (x-axis) and the share of agricultural employment (y-axis). These indicators are close to zero in Brunei and Singapore; therefore, they are not included in the figure.
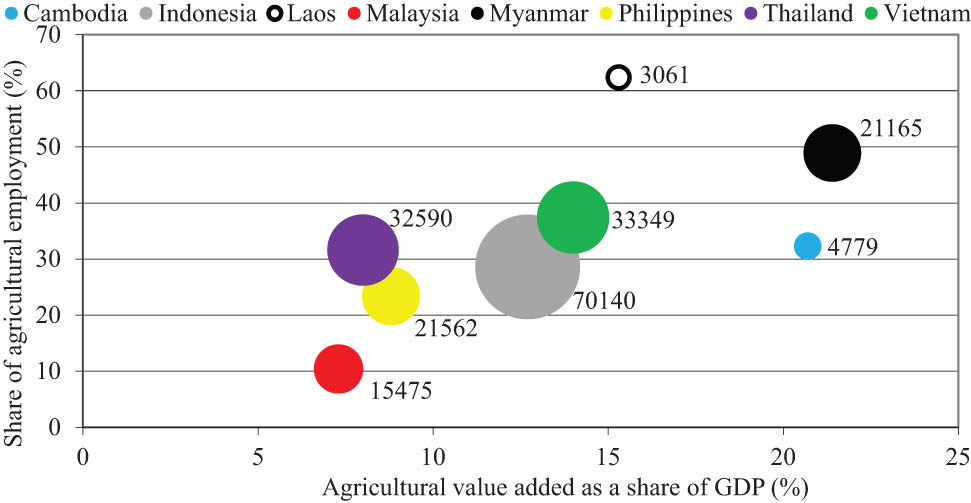
This figure shows that agriculture is the almost exclusive employer in Laos (62.4%) followed by Myanmar and Vietnam (48.9 and 37.4%). The value of this indicator is lowest in Malaysia (10.4%). The added value of agriculture as a share of GDP is on a high level in Myanmar and Cambodia (21.4 and 20.7%) and around 15% in Laos and even in Vietnam.[1] Since Laos’ production value is the smallest out of the analyzed countries (only 1.5%), 15.3% of the total value added could be considered high. Taking into consideration of the fact that more than 6 of 10 employees work in this sector, agriculture faces serious efficiency problems. As a general principle, the region has a strong growth potential in terms of productivity and prosperity (Teng and Oliveros 2015).[2] Figure 1 also shows that the largest producers in the region are Indonesia, Vietnam, and Thailand.
The role of agriculture can also be measured by its share within the total export and import (Figure 2). Concerning the overall time series, there were no general export and import share trends. The share of agricultural export was the highest in Myanmar (24.3%), followed by Indonesia (19.2%) and Thailand (15.2%) in 2019. At the same time, it is interesting that this value was relatively low for the significant producer Vietnam (9.9%). On the import side, agri-food commodities add up to 15.8% of the total import in Laos, followed by the Philippines and Myanmar (12.4 and 12.0%, respectively).
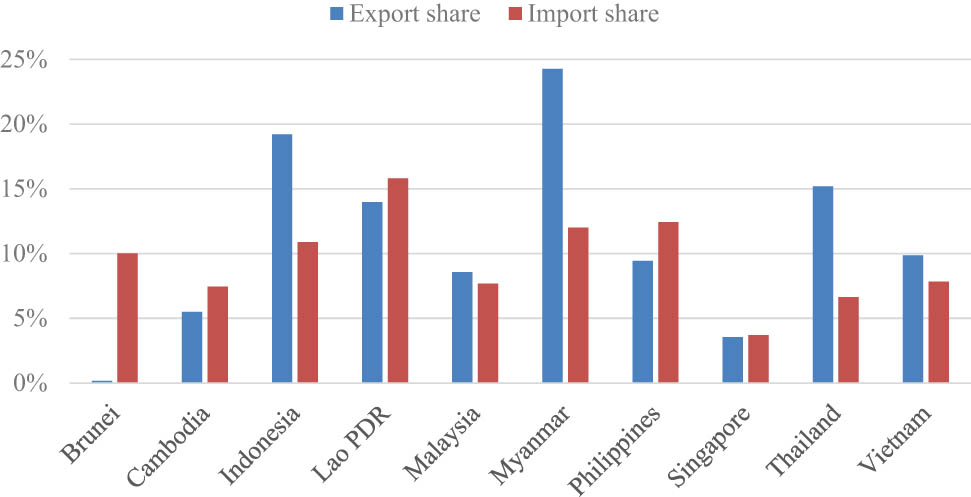
The share of agricultural export and import within the total export and import in the ASEAN, 2019. Author’s composition based on the World Bank’s WITS (2020) database.
The widely used indicator of agricultural performance is the trade balance shown in Figure 3 for the analyzed ASEAN countries.
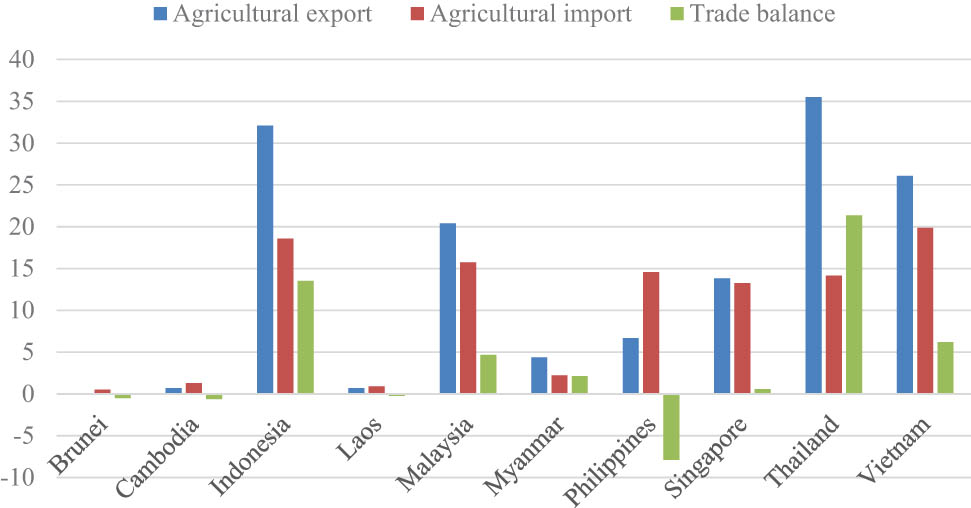
The agricultural trade of the ASEAN, 2019 (billion USD). Author’s composition based on World Bank’s WITS (2020) database.
As shown in Figure 2, major producers (Indonesia, Vietnam, and Thailand) have a trade surplus, and the size is over 20 billion USD for Thailand and almost 14 billion USD for Indonesia. Besides Vietnam, Malaysia, Myanmar, and Singapore have trade surplus. It is worth mentioning that despite of the insignificant agricultural sector of Singapore, the country was able to reach trade surplus in terms of value. It is a clear sign of a significant value added. Overall, of the 10 countries analyzed, the export value exceeds the import value for six countries. All this amounts to 39.2 billion USD trade surplus at the regional level. The basis of trade success is a competitive agriculture and food industry. Positive agri-food trade balance could be a useful tool against the present and the future crises (Dokić et al. 2020). Different decision support systems (DDSs) can help to achieve this strategic aim. However, the technical limitations of the DDGs, as well as the farmers’ potentially negative attitudes toward those technologies, may slow down the adoption process (Fenu and Malloci 2020).[3]
Analyzing the trade data at the product group level, two categories were created: intra-trade (within the ASEAN community) and extra-trade (outside the ASEAN community). This shows the characteristics of the agricultural trade, namely, which product groups are exported mostly at the regional level and which are exported mainly to the world markets.
Table 2 presents the three most important product groups divided into two categories: the world and ASEAN relation. The region’s major export product is undoubtedly animal or vegetable fats and oils (15) in both directions.
TOP 3 agri-food export products of the ASEAN, 2019
| World (ASEAN included) | ASEAN | ||
|---|---|---|---|
| Product code | Export (million USD) | Product code | Export (million USD) |
| 15 | 34,677 | 15 | 4,413 |
| 08 | 12,592 | 22 | 3,915 |
| 03 | 12,430 | 21 | 3,555 |
| Share of the TOP 3 product groups in world trade | 41.51% | Share of the TOP 3 product groups in ASEAN trade | 35.56% |
Author’s calculations based on the World Bank’s WITS (2020) database.
At the world level, edible fruits and nuts (08) and fish and other aquatic products (3) are the second and third most important product groups. It is not surprising as, except Laos, all ASEAN countries have direct sea access. Due to the location and endowments, fish production is expected to grow, and the share of the ASEAN region is going to reach one-quarter of the global production by 2030 (Chan et al. 2017). Agricultural export seems to be fairly concentrated as TOP 3 product groups account for more than 40% of the total agricultural export. As a matter of the ASEAN relation, animal or vegetable fats and oils are followed by beverages, spirits and vinegar (22) and miscellaneous edible preparations (21). In this case, export concentration is a bit less but accounts for 36%.
The relevance of the ASEAN trade agreement can be seen on the detailed trade data. Table 3 shows the TOP 3 most and least traded product groups among the member states. The proportion of the first one shows the significance of the association because the higher the share of intra-trade, the higher the impact of the ASEAN on its member states’ agricultural economic connections. The codes for each product group can be found at the end of the methodology and materials section.
The TOP 3 most and least traded product groups at ASEAN level, 2018
| Product code | Total agricultural export (million USD) | ASEAN-related agricultural export (million USD) | Share of ASEAN (%) |
|---|---|---|---|
| 24 | 3,517 | 2,380 | 67.66 |
| 01 | 1,031 | 627 | 60.99 |
| 22 | 6,431 | 3,915 | 60.87 |
| 15 | 34,677 | 4,413 | 12.73 |
| 20 | 3,794 | 438 | 11.55 |
| 16 | 12,112 | 727 | 6.00 |
| Agri-food trade | 143,817 | 33,417 | 23.24 |
Author’s calculations based on the World Bank’s WITS (2020) database.
Table 3 shows that the most commonly intra-traded product groups are tobacco and processed tobacco substitutes (24), live animals (1), as well as beverages, alcoholic liquids, and vinegar (22). The higher share of live animals (almost 61%) can be easily interpreted as the rate of mortality increases proportionally with the distance. For the other two categories of goods, distance does not really matter, but the high rate can be traced back to individual effects.
The least traded product groups among the ASEAN countries are animal or vegetable fats and oils (15), vegetables and fruit preparations (20), and processed aquatic products (16). The first of these is the region’s main export item (Table 2), so it is not surprising that it cannot be completely marketed within the member states. Fish and other aquatic products are the region’s local products. Except for Laos, all the member countries have direct access to the sea, so the surplus can be sold only on external markets. However, what is common among the TOP extra-traded product groups is that all three are processed products and therefore can be transported without significant loss of quality. Overall, almost one-fourth of the agri-food products are marketed locally, which is a clear sign of the effectiveness of the ASEAN trade agreement.
5 Revealed comparative advantages of the ASEAN agri-food trade
All the indices were calculated for every year. For better interpretation, 5-year averages were used in the tables. It makes easier to show the results, as well as offsets the outliers (exceptionally low or high individual values).
As shown in Figure 1, basic agricultural indicators for Brunei and Singapore are close to zero, which anticipates low or zero revealed trade advantage. As presented in Table 4, all the four Balassa type indices suggest revealed trade disadvantages even for the agri-food product groups with the highest values. Except for the RTA, the most competitive product groups measured by RCA, RSCA, and RC are different at world and ASEAN levels. This shows different trade characteristics between the different destinations. In terms of value, the major export products of Brunei are fish and other aquatic products (3), preparations of cereals, flour, starch, or milk (19) and dairy produce (4) in both directions (world and ASEAN), which partly correlates with the comparative (dis)advantages. Appendix Table 1 contains the TOP 3 product groups in terms of value for each country and both directions.
The three highest Balassa indices of Brunei at World and ASEAN level, 2000–2019
| B index | Product group | 2000–2004 | 2005–2009 | 2010–2014 | 2015–2019 | ||||
|---|---|---|---|---|---|---|---|---|---|
| World | ASEAN | World | ASEAN | World | ASEAN | World | ASEAN | ||
| RCA | 3/20 | 0.02 | 0.00 | 0.06 | 0.01 | 0.04 | 0.13 | 0.11 | 0.07 |
| 22/4 | 0.00 | 0.00 | 0.00 | 0.00 | 0.05 | 0.04 | 0.03 | 0.06 | |
| 21/7 | 0.00 | 0.00 | 0.00 | 0.00 | 0.01 | 0.05 | 0.02 | 0.04 | |
| RSCA | 3/4 | −0.95 | −1.00 | −0.89 | −0.99 | −0.92 | −0.92 | −0.81 | −0.92 |
| 22/3 | −0.99 | −0.97 | −0.99 | −0.97 | −0.92 | −0.95 | −0.94 | −0.95 | |
| 21/6 | −1.00 | −1.00 | −0.99 | −1.00 | −0.99 | −0.97 | −0.96 | −0.96 | |
| RTA | 24/24 | −3.19 | −1.57 | −2.87 | −2.38 | −0.75 | −0.49 | 0.00 | 0.00 |
| 5/5 | −0.11 | −0.36 | −0.01 | −0.07 | −0.16 | −0.74 | 0.00 | −0.02 | |
| 14/14 | −0.70 | −0.18 | −0.40 | −0.13 | −0.15 | −0.03 | −0.09 | −0.02 | |
| RC | 3/12 | −3.82 | −7.87 | −3.37 | −8.60 | −3.99 | −5.85 | −2.68 | −3.19 |
| 12/6 | −8.20 | n/a | −9.65 | −8.06 | −7.15 | −7.52 | −2.78 | −3.90 | |
| 24/3 | −8.63 | −4.01 | −10.76 | −4.72 | −11.31 | −4.21 | −3.01 | −4.12 | |
Author’s calculations based on the World Bank’s WITS (2020) database.
Cambodia has higher values showing revealed comparative advantages for the selected product groups (Table 5). Cereals (10) have particularly high values in every case and for both markets (world and ASEAN). Results show strong comparative advantages (RCA > 4 and RSCA > 0.6) for cereals. Kea at al. (2020) received the same high and even increasing values of the Cambodian rice export competitiveness. Cereals and rice basically refer to rice as rice accounts for 89% of the total Cambodian cereals production (FAO 2020).
The three highest Balassa indices of Cambodia at World and ASEAN level, 2000–2019
| B index | Product group | 2000–2004 | 2005–2009 | 2010–2014 | 2015–2019 | ||||
|---|---|---|---|---|---|---|---|---|---|
| World | ASEAN | World | ASEAN | World | ASEAN | World | ASEAN | ||
| RCA | 10/10 | 0.25 | 0.15 | 0.26 | 0.09 | 3.51 | 0.68 | 4.99 | 0.68 |
| 17/17 | 0.00 | 0.00 | 0.01 | 0.00 | 1.15 | 0.18 | 2.02 | 0.55 | |
| 11/7 | 0.31 | 0.02 | 0.95 | 0.14 | 0.40 | 0.13 | 1.93 | 0.38 | |
| RSCA | 10/10 | −0.62 | −0.75 | −0.59 | −0.85 | 0.48 | −0.32 | 0.67 | −0.23 |
| 17/17 | −0.33 | −1.00 | 0.00 | −1.00 | 0.11 | −0.77 | 0.30 | −0.33 | |
| 11/7 | −0.62 | −0.96 | −0.11 | −0.77 | −0.45 | −0.79 | 0.29 | −0.38 | |
| RTA | 10/10 | −0.96 | −0.37 | −0.30 | −0.12 | 3.21 | 0.55 | 4.68 | 0.52 |
| 17/7 | −4.10 | −0.08 | −1.61 | 0.06 | −0.03 | 0.04 | 0.93 | 0.41 | |
| 7/17 | −0.04 | −2.51 | −0.04 | −0.91 | 0.30 | −0.29 | 0.38 | 0.23 | |
| RC | 10/5 | −1.77 | 2.18 | −0.75 | −0.82 | 2.37 | −0.61 | 2.85 | 4.43 |
| 7/7 | −0.65 | −1.59 | −0.86 | 0.22 | 0.85 | −0.12 | 1.79 | 2.09 | |
| 8/13 | 1.54 | −2.08 | 1.85 | −2.82 | −0.48 | 0.68 | 0.81 | 1.84 | |
Author’s calculations based on the World Bank’s WITS (2020) database.
This result is in line with their trade value as cereals are the most important export commodity of the country followed by sugar and sugar confectionery (17) and products of the milling industry (11). Selling cereals on the regional markets makes some sense; however, it would be better to trade with its processed forms (flour, preparations, etc.) on the world markets. Overall, the low Cambodian comparative advantages and trade competitiveness follow from low production efficiency of agriculture as the sector has a relatively high share in national GDP, as well as in total employment.
Indonesia is the largest agri-food producer of the region with exceptionally high Balassa indices (Table 6). Animal or vegetable fats and oils (15) have high and increasing comparative, as well as trade advantage. Not surprisingly, this is the major export product of the country in both directions (world and ASEAN). Reyes (2014) also received the highest RCA values for product group 15 in Indonesia in the period of 2007–2011. Vegetable plaiting materials, vegetable products (14) and coffee, tea, mat, and spices (9), are the rest of the TOP 3 highest indices, while preparations of meat and aquatic products (16) showed revealed competitiveness. This in line with the results of the study by Chandran (2011), who identified revealed comparative advantages for the major ASEAN agri-food producers. Moreover, 10 of the 24 agri-food product groups showed revealed comparative advantage, which is similar to the results of the study by Riandi and Pratomo’s (2017) for the period of 2003–2013.
The three highest Balassa indices of Indonesia at World and ASEAN level, 2000–2019
| B index | Product group | 2000–2004 | 2005–2009 | 2010–2014 | 2015–2019 | ||||
|---|---|---|---|---|---|---|---|---|---|
| World | ASEAN | World | ASEAN | World | ASEAN | World | ASEAN | ||
| RCA | 15/14 | 10.89 | 0.66 | 17.63 | 0.90 | 19.03 | 0.79 | 21.98 | 1.43 |
| 14/17 | 8.26 | 0.42 | 8.74 | 0.88 | 5.51 | 0.79 | 15.74 | 1.08 | |
| 9/15 | 4.64 | 0.58 | 4.74 | 0.93 | 3.83 | 0.91 | 4.08 | 1.01 | |
| RSCA | 15/14 | 0.83 | −0.21 | 0.89 | −0.08 | 0.90 | −0.14 | 0.91 | 0.19 |
| 14/15 | 0.78 | −0.28 | 0.79 | −0.04 | 0.68 | −0.05 | 0.87 | 0.02 | |
| 9/17 | 0.64 | −0.42 | 0.65 | −0.07 | 0.58 | −0.15 | 0.60 | 0.01 | |
| RTA | 15/14 | 10.55 | 0.62 | 17.35 | 0.88 | 18.81 | 0.78 | 21.74 | 1.48 |
| 14/15 | 7.97 | 0.50 | 8.54 | 0.86 | 5.42 | 0.87 | 15.60 | 0.99 | |
| 9/9 | 4.13 | 0.63 | 4.40 | 0.60 | 3.32 | 0.50 | 3.52 | 0.58 | |
| RC | 14/14 | 3.34 | 2.76 | 3.99 | 4.36 | 4.13 | 5.23 | 4.78 | 7.03 |
| 15/1 | 3.45 | 2.56 | 4.17 | 4.94 | 4.49 | 6.20 | 4.50 | 4.91 | |
| 16/3 | 2.77 | 2.41 | 2.97 | 2.47 | 3.39 | 2.72 | 3.02 | 3.50 | |
Author’s calculations based on the World Bank’s WITS (2020) database.
The major difference between the world and ASEAN trade is the sugar and sugar confectionery (17) for the RCA and RSCA and live animals (1) and fish and other aquatic products (3) for the RC. The Indonesian agri-food trade seems to be effective as the major export items are processed products (product groups 15 and 9), except for the second important export commodity group, fish and other aquatic products. Processing of these products requires significant actions due to the complex problems of the seafood industry. The major problems are small-scale fish harbors and fishing vessels, high logistics costs, weak cold chain system, and quality and safety issues (Kusano and Kusano 2019). Investing into the processing sector would increase the value added of the sector, resulting in higher export prices.
In the case of Laos, data were available only for 2010–2019. As Laos has the highest share of agricultural employment in the region, high Balassa indices are expected. Data for 2015–2019 show high and increasing values in both directions compared to the previous period (Table 7). Products of the milling industry (11) have the highest revealed comparative advantage although this is not among the TOP 3 traded agri-food products. The major export products of the country are edible fruits and nuts (8), edible vegetables and certain roots and tubers (7), and coffee, tea, mat, and spices (9). The predominance of the raw materials is not surprising because most of the processing takes part at the households under limited skills and equipment, which particularly hinders the coffee and tea sectors (GiZ 2017). Therefore, government-initiated investment supports would be essential and beneficial for the whole economy. However, these product groups can be found on the list of the highest Balassa indices, especially when the import side has also been taken into account (RTA). In ASEAN relation, product group 7 and 9 is followed by 24 (tobacco and manufactured tobacco substitutes) as major export products. It should also be noted that vegetable plaiting materials and products (14) have the highest revealed competitiveness.
The three highest Balassa indices of Laos at World and ASEAN level, 2000–2019
| B index | Product group | 2000–2004 | 2005–2009 | 2010–2014 | 2015–2019 | ||||
|---|---|---|---|---|---|---|---|---|---|
| World | ASEAN | World | ASEAN | World | ASEAN | World | ASEAN | ||
| RCA | 11/7 | n/a | n/a | n/a | n/a | 4.51 | 5.72 | 8.37 | 12.57 |
| 7/1 | n/a | n/a | n/a | n/a | 3.23 | 0.41 | 7.37 | 4.13 | |
| 1/9 | n/a | n/a | n/a | n/a | 0.66 | 2.87 | 7.30 | 3.86 | |
| RSCA | 11/7 | n/a | n/a | n/a | n/a | 0.82 | 0.67 | 0.76 | 0.85 |
| 7/9 | n/a | n/a | n/a | n/a | 0.69 | 0.38 | 0.75 | 0.56 | |
| 24/1 | n/a | n/a | n/a | n/a | 0.67 | −0.55 | 0.74 | 0.41 | |
| RTA | 7/7 | n/a | n/a | n/a | n/a | 2.73 | 5.07 | 6.79 | 12.53 |
| 9/9 | n/a | n/a | n/a | n/a | 11.58 | 2.84 | 6.57 | 3.71 | |
| 8/12 | n/a | n/a | n/a | n/a | 4.11 | 6.69 | 5.82 | 2.41 | |
| RC | 14/14 | n/a | n/a | n/a | n/a | 5.72 | 5.66 | 5.10 | 4.89 |
| 9/13 | n/a | n/a | n/a | n/a | 6.06 | 5.19 | 4.53 | 4.38 | |
| 13/9 | n/a | n/a | n/a | n/a | 5.08 | 4.79 | 3.17 | 4.24 | |
Author’s calculations based on the World Bank’s WITS (2020) database.
Regarding Malaysia, animal or vegetable fats and oils and their cleavage products (15) are the most important export commodity of the country in both directions. It corresponds with the results of most of the Balassa indices (Table 8). Over the period 2007–2011, Reyes (2014) also received the highest RCA value for animal or vegetable fats and oils in Malaysia. Contrary to Suntharalingam and Othman (2017), edible fruits and nuts, peel of citrus or melons (product group 8) did not show comparative advantage, and all the indices were below 1 (RCA) or negative (RSCA, RTA, and RC) for both trade relations.
The three highest Balassa indices of Malaysia at World and ASEAN level, 2000–2019
| B index | Product group | 2000–2004 | 2005–2009 | 2010–2014 | 2015–2019 | ||||
|---|---|---|---|---|---|---|---|---|---|
| World | ASEAN | World | ASEAN | World | ASEAN | World | ASEAN | ||
| RCA | 15/6 | 11.73 | 0.76 | 12.68 | 0.80 | 13.94 | 0.94 | 10.45 | 0.90 |
| 14/18 | 0.27 | 0.20 | 1.53 | 0.20 | 5.44 | 0.42 | 5.88 | 0.71 | |
| 18/1 | 1.16 | 0.73 | 1.99 | 0.82 | 2.28 | 0.73 | 2.15 | 0.53 | |
| RSCA | 15/6 | 0.84 | −0.14 | 0.85 | −0.11 | 0.87 | −0.03 | 0.82 | −0.05 |
| 14/18 | −0.58 | −0.67 | −0.15 | −0.67 | 0.69 | −0.43 | 0.71 | −0.17 | |
| 18/1 | 0.06 | −0.16 | 0.33 | −0.10 | 0.39 | −0.16 | 0.36 | −0.33 | |
| RTA | 15/6 | 10.56 | 0.75 | 11.02 | 0.75 | 11.75 | 0.89 | 8.79 | 0.87 |
| 14/1 | −0.33 | 0.68 | −0.66 | 0.76 | 4.09 | 0.62 | 5.57 | 0.48 | |
| 6/4 | 0.17 | 0.11 | 0.27 | 0.23 | 0.48 | 0.40 | 0.46 | 0.42 | |
| RC | 14/6 | −0.85 | 4.24 | −0.57 | 2.83 | 1.69 | 2.98 | 2.94 | 3.40 |
| 6/1 | 1.70 | 2.76 | 1.79 | 2.97 | 2.23 | 2.07 | 2.20 | 3.29 | |
| 15/4 | 2.36 | 0.55 | 2.04 | 1.45 | 1.92 | 2.58 | 1.84 | 2.49 | |
Author’s calculations based on the World Bank’s WITS (2020) database.
Export related indices (RCA and RSCA) show strong comparative advantages (10.45 and 0.82, respectively), but trade indices are also high. The other two significant Malaysian export products are cocoa and cocoa preparations (18) and preparations of cereals, flour, starch, or milk (19). At ASEAN level, live trees and other plants (6) have the highest value in every case, although these are only the 18th export product measured in value. Balassa indices show weak comparative advantages of either product group (6, 18, 1, or 4). By using the same Balassa type indices, Benalywa et al. (2019) received that the whole chickens and capons and frozen subgroup within product group 2 had trade competitiveness. However, this cannot be verified on the HS-2 level dataset.
In the ASEAN trade, the second and third most important product groups are preparations of cereals, flour, starch, or milk (19) and miscellaneous edible preparations (21). One of the reasons behind the predominance of the processed products is the successful transformation of the sector driven by the supportive agricultural policy and capital transfers from the other sectors (World Bank 2019).
The length of the dataset for Myanmar is the same as for Laos. Myanmar has the largest agricultural value added as a share of GDP and is the second largest agricultural sector in the region in terms of employment. These are the main reasons for the highest average RCA or RSCA indices of the TOP 3 product groups (Table 9). These values highly correspond with the actual exports, as the country’s major products are cereals (10), edible vegetables and certain roots (7), and fish and crustaceans, molluscs, and other aquatic invertebrates (3) in both directions. The exceptions are sugar and sugar confectionery (17) at the world level, and oil seeds and oleaginous fruits, miscellaneous grains, seeds and fruit, industrial or medicinal plants, straw, and fodder (12) at the ASEAN level. This highlights the fact that a significant part of Myanmar’s export relies on land-intensive commodities (Zhang and Chen 2019). The major shortcoming of this production structure is that these bulk products can be produced anywhere; therefore, their unit values are generally low. Myanmar should at least increase the value added of these products by processing. Like in the other countries, Balassa indices are higher for the world markets and lower for the regional (ASEAN) markets.
The three highest Balassa indices of Myanmar at World and ASEAN level, 2000–2019
| B index | Product group | 2000–2004 | 2005–2009 | 2010–2014 | 2015–2019 | ||||
|---|---|---|---|---|---|---|---|---|---|
| World | ASEAN | World | ASEAN | World | ASEAN | World | ASEAN | ||
| RCA | 7/7 | n/a | n/a | n/a | n/a | 32.40 | 15.45 | 19.41 | 6.54 |
| 17/12 | n/a | n/a | n/a | n/a | 0.66 | 3.23 | 17.22 | 4.02 | |
| 10/3 | n/a | n/a | n/a | n/a | 8.52 | 4.42 | 11.52 | 3.45 | |
| RSCA | 7/7 | n/a | n/a | n/a | n/a | 0.93 | 0.87 | 0.89 | 0.68 |
| 10/12 | n/a | n/a | n/a | n/a | 0.75 | 0.42 | 0.83 | 0.61 | |
| 17/3 | n/a | n/a | n/a | n/a | 0.80 | 0.61 | 0.80 | 0.54 | |
| RTA | 7/7 | n/a | n/a | n/a | n/a | 32.14 | 15.43 | 19.12 | 5.62 |
| 10/12 | n/a | n/a | n/a | n/a | 8.09 | 3.14 | 10.72 | 4.10 | |
| 3/3 | n/a | n/a | n/a | n/a | 9.41 | 4.26 | 6.42 | 3.37 | |
| RC | 3/3 | n/a | n/a | n/a | n/a | 5.10 | 5.71 | 5.09 | 5.53 |
| 7/7 | n/a | n/a | n/a | n/a | 6.20 | 7.26 | 4.57 | 5.15 | |
| 14/12 | n/a | n/a | n/a | n/a | 3.49 | 3.68 | 4.12 | 3.91 | |
Author’s calculations based on the World Bank’s WITS (2020) database.
As a matter of the Philippines, Balassa indices show an increasing trend over the analyzed period (Table 10). Lac, gums, resins, and other vegetable saps and extracts (13) have the highest comparative advantage on both markets, even if the import side is taken into account (RTA). This is followed by edible fruits and nuts, peel of citrus, or melons (8), which is the major export product of the country. By export value, group 8 is followed by animal or vegetable fats and oils and their cleavage products (15) and preparations of vegetables, fruit, nuts, or other parts of plants (20). The first one can be found on the list below, while the other has only the third place for RCA on the ASEAN market. In the regional markets, tobacco and manufactured tobacco substitutes (24), different fats (15), and preparations of cereals, flour, starch or milk, pastrycooks’ products (19) are the major export products. This is not the case for the comparative advantages, except for the product group 24. The roots of the country’s trade deficit can be partly explained by the significant differences between the export values and the comparative advantages. The Filippo agri-food sector suffers from many problems. Restrictive trade policies, inefficient logistics, and postharvest losses result in less efficient trade and higher commodity prices compared to the other ASEAN countries (Briones et al. 2017).
The three highest Balassa indices of the Philippines at World and ASEAN level, 2000–2019
| B index | Product group | 2000–2004 | 2005–2009 | 2010–2014 | 2015–2019 | ||||
|---|---|---|---|---|---|---|---|---|---|
| World | ASEAN | World | ASEAN | World | ASEAN | World | ASEAN | ||
| RCA | 13/13 | 3.50 | 0.31 | 4.74 | 0.36 | 6.57 | 1.52 | 6.75 | 1.70 |
| 8/24 | 2.72 | 0.12 | 3.04 | 0.41 | 3.99 | 0.56 | 3.69 | 0.45 | |
| 15/20 | 3.42 | 0.19 | 3.40 | 0.49 | 4.19 | 0.83 | 3.51 | 0.31 | |
| RSCA | 13/13 | 0.55 | −0.54 | 0.63 | −0.49 | 0.73 | 0.17 | 0.74 | 0.21 |
| 15/24 | 0.54 | −0.81 | 0.54 | −0.42 | 0.61 | −0.29 | 0.55 | −0.41 | |
| 8/4 | 0.46 | −0.48 | 0.50 | −0.13 | 0.58 | −0.40 | 0.55 | −0.59 | |
| RTA | 13/13 | 2.51 | −0.03 | 3.52 | 0.06 | 5.39 | 1.33 | 5.72 | 1.43 |
| 8/24 | 2.57 | −0.10 | 2.78 | 0.27 | 3.51 | 0.40 | 3.19 | 0.27 | |
| 16/8 | 1.04 | 0.05 | 1.76 | 0.28 | 2.89 | 0.44 | 1.91 | 0.05 | |
| RC | 16/13 | 2.11 | −0.11 | 3.36 | 0.16 | 3.86 | 2.17 | 2.28 | 2.25 |
| 8/1 | 2.97 | 0.45 | 2.51 | 2.13 | 2.11 | 2.64 | 1.94 | 1.83 | |
| 13/8 | 1.26 | 0.94 | 1.32 | 3.15 | 1.71 | 2.76 | 1.90 | 1.08 | |
Author’s calculations based on the World Bank’s WITS (2020) database.
Singapore has no significant agricultural sector (Figure 1); however, the country had a positive agri-food trade balance in 2019 (Figure 3). This is undoubtedly a clear sign of the country’s successful trade/re-export. In case of Singapore, Balassa indices and “real” trade are consistent, as the major export product groups are almost the same (miscellaneous edible preparations – 21; beverages, spirits and vinegar – 22; preparations of cereals, flour, starch or milk, pastrycooks’ products – 19) with no real difference on the different markets (instead of product group 19, tobacco and manufactured tobacco substitutes (24) is the third important export product on the ASEAN markets). Taking into account the import side (RTA and RC), meat and edible meat offal (2) have noticeable trade advantage on the regional markets (Table 11). Besides Brunei, Singapore has the lowest comparative advantages among the analyzed countries, even the highest values are considered as weak.
The three highest Balassa indices of Singapore at World and ASEAN level, 2000–2019
| B index | Product group | 2000–2004 | 2005–2009 | 2010–2014 | 2015–2019 | ||||
|---|---|---|---|---|---|---|---|---|---|
| World | ASEAN | World | ASEAN | World | ASEAN | World | ASEAN | ||
| RCA | 21/22 | 0.63 | 0.28 | 0.50 | 0.35 | 0.77 | 0.32 | 1.82 | 0.28 |
| 24/24 | 1.24 | 0.38 | 0.62 | 0.23 | 0.86 | 0.24 | 1.29 | 0.28 | |
| 22/21 | 0.48 | 0.20 | 0.70 | 0.16 | 1.01 | 0.16 | 1.07 | 0.23 | |
| RSCA | 21/24 | −0.35 | −0.46 | −0.18 | −0.62 | 0.00 | −0.62 | 0.23 | −0.55 |
| 24/22 | 0.08 | −0.57 | −0.23 | −0.49 | −0.08 | −0.51 | 0.13 | −0.56 | |
| 22/21 | −0.44 | −0.66 | −0.20 | −0.73 | −0.02 | −0.73 | 0.03 | −0.62 | |
| RTA | 21/2 | −0.04 | −0.23 | −0.05 | 0.18 | 0.22 | 0.10 | 1.20 | 0.16 |
| 19/21 | −0.06 | −0.02 | 0.33 | −0.04 | 0.57 | 0.04 | 0.53 | 0.15 | |
| 24/19 | 0.01 | −0.08 | −0.02 | 0.03 | 0.06 | 0.10 | 0.19 | 0.12 | |
| RC | 21/23 | −0.06 | 1.44 | −0.10 | 2.03 | 0.28 | 1.98 | 0.99 | 1.63 |
| 19/2 | −0.15 | −1.25 | 0.67 | 1.24 | 0.91 | 0.89 | 0.83 | 1.26 | |
| 23/21 | 0.40 | −0.09 | 0.78 | −0.23 | 0.67 | 0.29 | 0.61 | 1.02 | |
Author’s calculations based on the World Bank’s WITS (2020) database.
The major export product group of Thailand is the preparations of meat, fish, or of crustaceans, molluscs, or other aquatic invertebrates (16), which corresponds with all the Balassa indices. Khai et al. (2016) also received remarkable trade competitiveness in the shrimp sector between 1999 and 2009. Similarly, to the matching result of the practice and theory in the world direction, sugar and sugar confectionery (17) is the most important export product group and has the highest, however, a very low comparative advantage in the ASEAN relation. Besides, Thailand seems to be specialized on the product of the milling industry (11) and sugar products (17) on the international markets and different animal products on the ASEAN level (2 and 5). Worth mentioning that these are different from the major export products: cereals (10) and edible fruits and nuts, peel of citrus or melons (8) at the world level, and beverages, spirits, and vinegar (22) and edible fruits and nuts (8) at the ASEAN level (Table 12).
The three highest Balassa indices of Thailand at World and ASEAN level, 2000–2019
| B index | Product group | 2000–2004 | 2005–2009 | 2010–2014 | 2015–2019 | ||||
|---|---|---|---|---|---|---|---|---|---|
| World | ASEAN | World | ASEAN | World | ASEAN | World | ASEAN | ||
| RCA | 16/17 | 13.27 | 0.95 | 12.01 | 1.00 | 11.60 | 1.12 | 9.25 | 1.11 |
| 11/5 | 3.24 | 0.84 | 3.67 | 0.22 | 5.23 | 0.64 | 5.25 | 0.90 | |
| 17/11 | 4.64 | 0.74 | 3.89 | 0.83 | 5.24 | 0.89 | 5.08 | 0.81 | |
| RSCA | 16/17 | 0.86 | −0.02 | 0.85 | 0.00 | 0.84 | 0.06 | 0.80 | 0.05 |
| 11/5 | 0.64 | −0.09 | 0.58 | −0.65 | 0.67 | −0.24 | 0.68 | −0.06 | |
| 17/11 | 0.53 | −0.15 | 0.57 | −0.09 | 0.68 | −0.06 | 0.67 | −0.11 | |
| RTA | 16/17 | 13.16 | 0.92 | 11.86 | 0.96 | 11.33 | 1.08 | 8.79 | 1.07 |
| 17/2 | 4.48 | 0.61 | 3.69 | 0.38 | 4.98 | 0.86 | 4.72 | 0.77 | |
| 11/11 | 1.39 | 0.68 | 2.05 | 0.74 | 3.85 | 0.81 | 4.00 | 0.72 | |
| RC | 4/2 | 4.33 | 5.24 | 3.41 | 2.35 | 4.26 | 5.81 | 3.82 | 9.47 |
| 16/17 | 4.78 | 3.34 | 4.45 | 3.30 | 3.80 | 3.34 | 3.02 | 3.57 | |
| 17/10 | 3.38 | 5.31 | 2.96 | 3.50 | 3.00 | 3.27 | 2.65 | 2.93 | |
Author’s calculations based on the World Bank’s WITS (2020) database.
Thailand is not only the largest exporter of agri-food products in the region but also has by far the largest trade surplus. Besides the predominance of the processed products in its export portfolio, Thailand has a very efficient processing industry compared to its many neighbors. With smaller coastline and lesser territorial water, Thailand exports 71% more fish in value compared to Indonesia (Kusano and Kusano 2019). This efficiency was one of the reasons why Kuldilok et al. (2013) observed substantial international competitiveness in the Thai tuna industry in the period of 1996–2006.
Major Vietnamese product groups at the world level are fish and crustaceans, molluscs, and other aquatic invertebrates (3), edible fruits and nuts, peel of citrus or melons (8), and coffee, tea, mat and spices (9). Except (8), the other two product groups can be found on the list of the highest Balassa indices (Table 10). As a matter of the ASEAN relation, cereals (10) are followed by fish and other aquatic invertebrates (3), and miscellaneous edible preparations (21). It should be noted that all the commodity groups in the table below show comparative disadvantages in that direction. Moreover, the majority of the values decreased by the end of the analyzed period in both directions (Table 13).
The three highest Balassa indices of Vietnam at World and ASEAN level, 2000–2019
| B index | Product group | 2000–2004 | 2005–2009 | 2010–2014 | 2015–2019 | ||||
|---|---|---|---|---|---|---|---|---|---|
| World | ASEAN | World | ASEAN | World | ASEAN | World | ASEAN | ||
| RCA | 9/10 | 18.71 | 2.53 | 19.56 | 2.63 | 13.52 | 1.67 | 7.26 | 0.73 |
| 3/9 | 15.84 | 1.45 | 12.97 | 1.53 | 8.16 | 1.01 | 4.16 | 0.58 | |
| 11/3 | 2.73 | 1.03 | 4.23 | 1.05 | 5.90 | 0.57 | 3.85 | 0.43 | |
| RSCA | 9/10 | 0.90 | 0.43 | 0.90 | 0.44 | 0.86 | 0.23 | 0.75 | −0.21 |
| 3/9 | 0.88 | 0.15 | 0.86 | 0.20 | 0.78 | −0.01 | 0.61 | −0.32 | |
| 11/3 | 0.43 | 0.01 | 0.61 | 0.02 | 0.71 | −0.28 | 0.58 | −0.41 | |
| RTA | 9/10 | 18.53 | 2.44 | 19.35 | 2.51 | 13.03 | 1.56 | 6.85 | 0.62 |
| 16/3 | 1.97 | 0.94 | 3.76 | 0.82 | 4.52 | 0.43 | 3.25 | 0.32 | |
| 3/9 | 15.32 | 1.39 | 12.22 | 1.39 | 7.19 | 0.68 | 3.17 | 0.29 | |
| RC | 16/10 | 4.32 | 3.33 | 4.50 | 3.22 | 4.66 | 2.73 | 3.54 | 2.80 |
| 9/2 | 4.76 | 4.67 | 4.61 | 1.77 | 3.33 | 3.27 | 2.88 | 2.47 | |
| 14/16 | 1.83 | 2.25 | 1.93 | 2.38 | 2.52 | 3.07 | 1.93 | 2.18 | |
Author’s calculations based on the World Bank’s WITS (2020) database.
Although Vietnam is an export-oriented country, its agri-food trade suffers from serious problems. As it was analyzed earlier, its export is dominated by raw materials with almost no value added. This can be only successful by using low-cost labor and having favorable natural conditions (Junaid and Dinh Thi 2017). The convergency that Hoang et al. (2017) identified can be only partially seen on the longer dataset. Of the eight product groups that showed initially revealed trade advantage, seven decreased by the end of the analyzed period, but two of them turned out to be even negative. Conversely, the majority of the product groups (12 of 18) with comparative trade disadvantage became even lower during the same period. Most of the cases this meant a slight increase from a larger to a smaller negative value. Moreover, only 1 of these 12 product groups turned from comparative trade disadvantage to comparative trade advantage.
6 Conclusions
Based on the aforementioned results, several conclusions can be drawn on ASEAN countries’ agricultural trade: (i) according to the standard indicators (agricultural employment, agricultural value added to the GDP), agriculture still plays an important role in the region, e.g., it is the major employer in some countries; (ii) the export share of the sector is significant and proportional to the level of development of the member countries; (iii) countries with the significant agricultural output have a trade surplus and, overall, ASEAN countries are net exporters of agricultural goods. An efficient agri-food sector can largely contribute to the trade balance. This sector becomes even more important in the case of crises, such as the current COVID-19 pandemic (Dokić et al. 2020).
The region’s major export product is animal or vegetable fats and oils in both directions; however, this is due to the significant producers (e.g., Indonesia and Malaysia). ASEAN countries show great divergence in agri-food trade, mostly cooperating rather than competing. The most commonly intra-traded product groups are tobacco and processed tobacco substitutes, live animals, and beverages, alcoholic liquids, and vinegar. Live animals have high share in ASEAN-level trade (almost 61%), which can be easily interpreted as the rate of mortality increases proportionally with the distance. For the other two categories of goods, distance does not really matter, and the high rates can be traced back to individual effects.
The least traded product groups among the ASEAN countries are animal or vegetable fats and oils, vegetables and fruit preparations, and processed aquatic products. The first of these is the region’s main export item, so it is not surprising that it cannot be completely marketed within the member states. Fish and other aquatic products are the region’s local products. Except for Laos, all the member countries have direct access to the sea, so the surplus can be sold only on external markets. However, what is common among the TOP extra-traded product groups is that all three are processed products and therefore can be transported without significant loss of quality. Overall, almost one-fourth of the agri-food products are marketed within the ASEAN region, which is a clear sign of the effectiveness of the ASEAN trade agreement.
ASEAN level comparative advantages are lower than that of the world levels. This means that not only the exports but also the imports of these countries differ from one market to the other. Most of the RC values (all the three for Cambodia, Indonesia, Malaysia, Singapore, and Thailand, two values for Myanmar, and one value for Laos and Vietnam) are higher for the ASEAN markets. The relatively low RMA values compared to the RXA values explains this because RC is equal to the difference between ln(RXA) and ln(RMA). Regarding the connection between the theory (Balassa type indices) and practice (export value), a high correlation can be noted. The list of the commodities with high comparative advantages overlaps with the list of the most important export products. This clearly and positively confirms the primary research question of the article, which is the major scientific value added of this research. Besides, and in accordance with Chandran’s (2011) results, it was also approved that the significant agri-food producers of the ASEAN region (Thailand, Indonesia, Vietnam, and Malaysia) can be characterized by higher comparative advantages. Results can be used for agricultural policy makers for deeper understanding the countries’ trade specialization and international trade performance, which is an important element of the future success (Mizik et al. 2020).
The major problem behind the lower agri-food trade performances is always the low or no value-added caused by the inefficient or infant processing industry. Building up or strengthening the processing sector exceeds the financial opportunities of the stakeholders. Besides the necessary policy actions and investment supports, solving this problem requires significant investments into human resources by education and training programs on both production and processing levels. This seems to be the major advantage of the Thai agri-food sector compared to its regional rivals because only a limited number of countries (e.g., Malaysia) have the opportunity for significant capital transfers from the other sectors.
Overall, regional trade agreements can well complement the WTO activities, which may be particularly needed if there is a significant trade surplus of the given region. Based on the results received, further ways of research could be a deeper analysis of the agri-food trade by using more detailed HS level trade data (4 or 6). Another research path for the future could be the analysis of the impacts of the COVID pandemic on the agri-food trade; however, that requires data at least for 2020.
In line with the further research paths, the major limitation of the study is the dataset used. HS-2 level trade data refer only to product groups blurring the differences within them. Their reliability can also be questioned, especially for those countries that have not provided data for the whole analyzed period (Laos and Myanmar).
Appendix
-
Funding information: This work was supported by the National Research Development and Innovation Office under grant number 119669, “Competitiveness of Agriculture in International Trade: A Global Perspective.” The author gratefully acknowledges this support.
-
Author contribution: TM: study conception and design, data collection, analysis and interpretation of results, and manuscript preparation.
-
Conflict of interest: The authors state no conflict of interest.
-
Data availability statement: The datasets analyzed during the current study are available in the [World Bank’s WDI] and [World Bank’s WITS] databases, [http://databank.worldbank.org/data/reports.aspx?source=world-development-indicators] and [http://wits.worldbank.org/]
References
[1] ASEAN. ASEAN economic community blueprint 2025. Jakarta, Indonesia: The ASEAN Secretariat; 2015.Suche in Google Scholar
[2] Balassa B. Trade liberalization and revealed comparative advantage. Manchester Sch Econ Soc Stud. 1965;33(2):99–123.10.1111/j.1467-9957.1965.tb00050.xSuche in Google Scholar
[3] Benalywa ZA, Ismail MM, Shamsudin MN, Yusop Z. Revealed comparative advantage and competitiveness of broiler meat products in Malaysia and selected exporting countries. Int J Bus Soc. 2019;20(1):383–96.Suche in Google Scholar
[4] Briones R, Antonio E, Habito C, Porio E, Songco D. Food security and nutrition in the Philippines. Manila, The Philippines: Brain Trust Inc; 2017.Suche in Google Scholar
[5] Chandran D. Trade complementarity and similarity between India and ASEAN countries in the context of the RTA. SSRN Electron J. 2011;763299. 10.2139/ssrn.1763299.Suche in Google Scholar
[6] Chandran D, Sudarsan PK. Revealed comparative advantage (RCA) and trade complementarity between India-ASEAN trade: a study with reference to fisheries sector. SSRN Electron J. 2012;2054132. 10.2139/ssrn.2054132.Suche in Google Scholar
[7] Chan CY, Tran N, Dao DC, Sulser TB, Philips MJ, et al. Fish to 2050 in the ASEAN region; 2017. Penang, Malaysia: WorldFish and Washington DC, USA: International Food Policy Research Institute (IFPRI). Working Paper: 2017-01.Suche in Google Scholar
[8] Dalum B, Laursen K, Villumsen G. Structural change in OECD export specialization patterns: de-specialisation and stickiness. Int Rev Appl Econ. 1998;12(3):423–43. 10.1080/02692179800000017.Suche in Google Scholar
[9] Deardorff AV. Comparative advantage: the theory behind measurement. OECD: globalisation, comparative advantage and the changing dynamics of trade. Paris, France: OECD Publishing; 2011. p. 27–40. 10.1787/9789264113084-en.Suche in Google Scholar
[10] Dokić D, Gavran M, Gregić M, Gantner V. The impact of trade balance of agri-food products on the state’s ability to withstand the crisis. HighTech Innov J. 2020;1(3):107–11. 10.28991/HIJ-2020-01-03-02.Suche in Google Scholar
[11] FAO. Faostat; 2020 [cited: 2020 Jan 8] Available from: http://www.fao.org/faostat/en/#dataSuche in Google Scholar
[12] Febriningtyas M, Oktaviani R, Arifin A. Rules of origin in ASEAN+1 free trade agreements on agriculture commodity. Signifikan Jurnal Ilmu Ekonomi. 2018;7(1):15–26. 10.15408/sjie.v7i1.6432.Suche in Google Scholar
[13] Fenu G, Malloci FM. DSS lands: a decision support system for agriculture in Sardinia. HighTech Innov J. 2020;1(3):129–35. 10.28991/HIJ-2020-01-03-05.Suche in Google Scholar
[14] GiZ. Sector skills study and value chain analysis. Bonn, Germany: Deutsche Gesellschaft für Internationale Zusammenarbeit GmbH; 2017.Suche in Google Scholar
[15] Hamid MFS, Aslam M. The competitiveness and complementarities of agriculture trade among ASEAN-5 countries: an empirical analysis. Int J Econ Financ. 2017;9(8):88–102.10.5539/ijef.v9n8p88Suche in Google Scholar
[16] Hinloopen J, Van Marrewijk C. On the empirical distribution of the Balassa index. Weltwirtsch Arch. 2001;137(1):1–35. 10.1007/BF02707598.Suche in Google Scholar
[17] Hoang VV, Tran KT. Comparative advantages of alternative crops: a comparison study in Ben Tre, Mekong Delta, Vietnam. AGRIS On-line Pap Econ Inform. 2019;11(1):35–47. 10.7160/aol.2019.110104.Suche in Google Scholar
[18] Hoang VV, Tran KT, Tu BV. Assessing the agricultural competitive advantage by the RTA index: a case study in Vietnam. AGRIS On-line Pap Econ Inform. 2017;9(3):15–26. 10.7160/aol.2017.090302.Suche in Google Scholar
[19] Junaid MS, Dinh Thi BL. Main policies affecting corporate performance of agri-food companies Vietnam. Acad Acc Financ Stud J. 2017;21(2):17.Suche in Google Scholar
[20] Kea S, Li H, Shahriar S, Abdullahi NM. Relative export competitiveness of the Cambodian rice sector. Brit Food J. 2020;122(12):3757–78. 10.1108/BFJ-12-2019-0950.Suche in Google Scholar
[21] Khai NX, Ismail MM, Sidique SF. Consistency tests of comparative advantage measures: an empirical evidence from the Malaysian and selected Asian shrimp products. Int Food Res J. 2016;23(6):2752–8.Suche in Google Scholar
[22] Kuldilok KS, Dawson PJ, Lingard J. The export competitiveness of the tuna industry in Thailand. Brit Food J. 2013;115(3):328–41. 10.1108/00070701311314174.Suche in Google Scholar
[23] Kusano S, Kusano E. Indonesian seafood supply chain. In: Kusano E, (ed). Food value chain in ASEAN: case studies focusing on local producers ERIA research project report, no. 5. Jakarta: ERIA; 2019. p. 134–63.Suche in Google Scholar
[24] Laursen K. Revealed comparative advantage and the alternatives as measures of international specialization. Eur Bus Rev. 2015;5(1):99–115. 10.1007/s40821-015-0017-1.Suche in Google Scholar
[25] Laursen K. Revealed comparative advantage and the alternatives as measures of international specialisation. Working paper No. 98–30. 1998. p. 24.Suche in Google Scholar
[26] Mizik T, Gál P, Török Á. Does agricultural trade competitiveness matter? The case of the CIS countries. Agris On-line Pap Econ Inform. 2020;12(1):61–72. 10.7160/aol.2020.120106.Suche in Google Scholar
[27] Reyes GU. Examining the revealed comparative advantage of the ASEAN 6 countries using the Balassa index and Lafay index. J Glob Bus Trade. 2014;10(1):1–11.Suche in Google Scholar
[28] Riandi R, Pratomo Y. Indonesian comparative advantage entering the ASEAN economic community. Jurnal Ekonomi dan Studi Pembangunan. 2017;9(1):87–102. 10.17977/um002v9i12017p086.Suche in Google Scholar
[29] Rose AK. Do we really know that the WTO increases trade? Am Econ Rev. 2004;94(1):98–114. 10.1257/000282804322970724.Suche in Google Scholar
[30] Suntharalingam C, Othman MF. Competitiveness of Malaysia’s fruits in the global market: revealed comparative advantage analysis. Malays J Math Sci. 2017;11(S):143–57.Suche in Google Scholar
[31] Teng PP, Oliveros JA. AEC2015: implications for investment in ASEAN agriculture. RSIS commentaries, no. 147. Singapore: Nanyang Technological University; 2015.Suche in Google Scholar
[32] Vollrath TL. A theoretical evaluation of alternative trade intensity measures of revealed comparative advantage. Weltwirtsch Arch. 1991;130:265–79. 10.1007/BF02707986.Suche in Google Scholar
[33] World Bank. Agricultural transformation and inclusive growth. The Malaysian experience. Washington, USA: World Bank; 2019.Suche in Google Scholar
[34] World Bank’s WDI. World development indicators; 2020 [cited: 2020 Jul 14] Available from: http://databank.worldbank.org/data/reports.aspx?source=world-development-indicatorsSuche in Google Scholar
[35] World Bank’s WITS. World integrated trade solution database; 2020 [cited: 2020 Jul 10] Available from: http://wits.worldbank.org/Suche in Google Scholar
[36] WTO website. The WTO. 2020 [cited: 2020 Jul 1] Available from: https://www.wto.org/english/thewto_e/thewto_e.htmSuche in Google Scholar
[37] WTO RTA. WTO regional trade agreements information system; 2020 [cited: 2020 Jul 13] Available from: https://rtais.wto.org/UI/PublicMaintainRTAHome.aspxSuche in Google Scholar
[38] Zhang H, Chen K. Assessing agricultural trade comparative advantage of Myanmar and its main competitors: findings from UN Comtrade, IFPRI discussion paper 01823. Washington DC, USA: International Food Policy Research Institute; 2019.Suche in Google Scholar
© 2021 Tamás Mizik, published by De Gruyter
This work is licensed under the Creative Commons Attribution 4.0 International License.
Artikel in diesem Heft
- Regular Articles
- The nutmeg seedlings growth under pot culture with biofertilizers inoculation
- Recovery of heather (Calluna vulgaris) flowering in northern Finland
- Soil microbiome of different-aged stages of self-restoration of ecosystems on the mining heaps of limestone quarry (Elizavetino, Leningrad region)
- Conversion of land use and household livelihoods in Vietnam: A study in Nghe An
- Foliar selenium application for improving drought tolerance of sesame (Sesamum indicum L.)
- Assessment of deficit irrigation efficiency. Case study: Middle Sebou and Innaouene downstream
- Integrated weed management practices and sustainable food production among farmers in Kwara State, Nigeria
- Determination of morphological changes using gamma irradiation technology on capsicum specie varieties
- Use of maturity traits to identify optimal harvestable maturity of banana Musa AAB cv. “Embul” in dry zone of Sri Lanka
- Theory vs practice: Patterns of the ASEAN-10 agri-food trade
- Intake, nutrient digestibility, nitrogen, and mineral balance of water-restricted Xhosa goats supplemented with vitamin C
- Physicochemical properties of South African prickly pear fruit and peel: Extraction and characterisation of pectin from the peel
- An evaluation of permanent crops: Evidence from the “Plant the Future” project, Georgia
- Probing of the genetic components of seedling emergence traits as selection indices, and correlation with grain yield characteristics of some tropical maize varieties
- Increase in the antioxidant content in biscuits by infusions or Prosopis chilensis pod flour
- Altitude, shading, and management intensity effect on Arabica coffee yields in Aceh, Indonesia
- Climate change adaptation and cocoa farm rehabilitation behaviour in Ahafo Ano North District of Ashanti region, Ghana
- Effect of light spectrum on growth, development, and mineral contents of okra (Abelmoschus esculentus L.)
- An assessment of broiler value chain in Nigeria
- Storage root yield and sweetness level selection for new honey sweet potato (Ipomoea batatas [L.] Lam)
- Direct financial cost of weed control in smallholder rubber plantations
- Combined application of poultry litter biochar and NPK fertilizer improves cabbage yield and soil chemical properties
- How does willingness and ability to pay of palm oil smallholders affect their willingness to participate in Indonesian sustainable palm oil certification? Empirical evidence from North Sumatra
- Investigation of the adhesion performance of some fast-growing wood species based on their wettability
- The choice of information sources and marketing channel of Bali cattle farmers in Bali Province
- Preliminary phytochemical screening and in vitro antibacterial activity of Plumbago indica (Laal chitrak) root extracts against drug-resistant Escherichia coli and Klebsiella pneumoniae
- Agronomic and economic performance of maize (Zea mays L.) as influenced by seed bed configuration and weed control treatments
- Selection and characterization of siderophores of pathogenic Escherichia coli intestinal and extraintestinal isolates
- Effectiveness of cowpea (Vigna unguiculata L.) living mulch on weed suppression and yield of maize (Zea mays L.)
- Cow milk and its dairy products ameliorate bone toxicity in the Coragen-induced rat model
- The motives of South African farmers for offering agri-tourism
- Morphophysiological changes and reactive oxygen species metabolism in Corchorus olitorius L. under different abiotic stresses
- Nanocomposite coatings for hatching eggs and table eggs
- Climate change stressors affecting household food security among Kimandi-Wanyaga smallholder farmers in Murang’a County, Kenya
- Genetic diversity of Omani barley (Hordeum vulgare L.) germplasm
- Productivity and profitability of organic and conventional potato (Solanum tuberosum L.) production in West-Central Bhutan
- Response of watermelon growth, yield, and quality to plant density and variety in Northwest Ethiopia
- Sex allocation and field population sex ratio of Apanteles taragamae Viereck (Hymenoptera: Braconidae), a larval parasitoid of the cucumber moth Diaphania indica Saunders (Lepidoptera: Crambidae)
- Comparison of total nutrient recovery in aquaponics and conventional aquaculture systems
- Relationships between soil salinity and economic dynamics: Main highlights from literature
- Effects of soil amendments on selected soil chemical properties and productivity of tef (Eragrostis tef [Zucc.] Trotter) in the highlands of northwest Ethiopia
- Influence of integrated soil fertilization on the productivity and economic return of garlic (Allium sativum L.) and soil fertility in northwest Ethiopian highlands
- Physiological and biochemical responses of onion plants to deficit irrigation and humic acid application
- The incorporation of Moringa oleifera leaves powder in mutton patties: Influence on nutritional value, technological quality, and sensory acceptability
- Response of biomass, grain production, and sugar content of four sorghum plant varieties (Sorghum bicolor (L.) Moench) to different plant densities
- Assessment of potentials of Moringa oleifera seed oil in enhancing the frying quality of soybean oil
- Influences of spacing on yield and root size of carrot (Daucus carota L.) under ridge-furrow production
- Review Articles
- A review of upgradation of energy-efficient sustainable commercial greenhouses in Middle East climatic conditions
- Plantago lanceolata – An overview of its agronomically and healing valuable features
- Special Issue on CERNAS 2020
- The role of edible insects to mitigate challenges for sustainability
- Morphology and structure of acorn starches isolated by enzymatic and alkaline methods
- Evaluation of FT-Raman and FTIR-ATR spectroscopy for the quality evaluation of Lavandula spp. Honey
- Factors affecting eating habits and knowledge of edible flowers in different countries
- Ideal pH for the adsorption of metal ions Cr6+, Ni2+, Pb2+ in aqueous solution with different adsorbent materials
- Determination of drying kinetics, specific energy consumption, shrinkage, and colour properties of pomegranate arils submitted to microwave and convective drying
- Eating habits and food literacy: Study involving a sample of Portuguese adolescents
- Characterization of dairy sheep farms in the Serra da Estrela PDO region
- Development and characterization of healthy gummy jellies containing natural fruits
- Agro-ecological services delivered by legume cover crops grown in succession with grain corn crops in the Mediterranean region
- Special issue on CERNAS 2020: Message from the Editor
- Special Issue on ICESAT 2019
- Climate field schools to increase farmers’ adaptive capacity to climate change in the southern coastline of Java
- Special Issue on the International Conference on Agribusiness and Rural Development - IConARD 2020
- Supply chain efficiency of red chili based on the performance measurement system in Yogyakarta, Indonesia
- Sustainable value of rice farm based on economic efficiency in Yogyakarta, Indonesia
- Enhancing the performance of conventional coffee beans drying with low-temperature geothermal energy by applying HPHE: An experimental study
- Opportunities of using Spirulina platensis as homemade natural dyes for textiles
- Special Issue on the APA 2019 - 11th Triennial Conference
- Expanding industrial uses of sweetpotato for food security and poverty alleviation
- A survey on potato productivity, cultivation and management constraints in Mbala district of Northern Zambia
- Orange-fleshed sweetpotato: Strategies and lessons learned for achieving food security and health at scale in Sub-Saharan Africa
- Growth and yield of potato (Solanum tuberosum L.) as affected by storage conditions and storage duration in Jos, Plateau State, Nigeria
- Special Issue on the International Conference on Multidisciplinary Research - Agrarian Sciences
- Application of nanotechnologies along the food supply chain
- Special Issue on Agriculture, Climate Change, Information Technology, Food and Animal (ACIFAS 2020)
- The use of endophytic growth-promoting bacteria to alleviate salinity impact and enhance the chlorophyll, N uptake, and growth of rice seedling