Wireless sensor node localization algorithm combined with PSO-DFP
-
Jingjing Sun
 ,
Peng Zhang
,
Peng Zhang

Abstract
In wireless communication technology, wireless sensor networks usually need to collect and process information in very harsh environment. Therefore, accurate positioning of sensors becomes the key to wireless communication technology. In this study, Davidon–Fletcher–Powell (DFP) algorithm was combined with particle swarm optimization (PSO) to reduce the influence of distance estimation error on positioning accuracy by using the characteristics of PSO iterative optimization. From the experimental results, among the average precision (AP) values of DFP, PSO, and PSO-DFP algorithms, the AP value of PSO-DFP was 0.9972. In the analysis of node positioning error, the maximum node positioning error of PSO-DFP was only about 21 mm. The results showed that the PSO-DFP algorithm had better performance, and the average positioning error of the algorithm was inversely proportional to the proportion of anchor nodes, node communication radius, and node density. In conclusion, the wireless sensor node location algorithm combined with PSO-DFP has a better location effect and higher stability than the traditional location algorithm.
1 Introduction
With the increasing maturity of industrial production, semiconductor, sensor technology, and communication technology have gradually developed. Wireless technology has gradually entered people’s lives. Nowadays, wireless technology has been widely used in communication networks and other fields. As a very important information collection and information processing method, wireless sensor network (WSN) technology has been widely used in all walks of life. In WSN, node location is the key to its technology [1]. The WSN environment is often used in some places with very harsh conditions, which usually cannot be directly reached by humans [2]. Therefore, how to arrange sensor nodes in an infinite sensor network has become a problem to be solved. Usually, GPS satellites are used to locate some nodes, and then each node communicates with each other and is related to each other, so as to use a specific positioning algorithm to complete the positioning layout of all nodes [3].
The traditional particle swarm optimization (PSO) has the characteristics of the convenient iterative method and fast convergence, but the algorithm lacks more refined search ability in local optimization, which also leads to the algorithm often being prone to the convergence stagnation problem [4]. The innovation of this research is that the Newton method (Davidon–Fletcher–Powell (DFP) algorithm) is introduced to integrate the particle swarm algorithm, so that it has a better optimization effect. Newton’s method is a commonly used numerical solution method. This algorithm has extremely fast convergence in local optimization. It is an optimal iterative algorithm in the local search, and it just makes up for the defects of PSO [5]. Therefore, the two algorithms are integrated to form a new PSO-DFP this time, thereby forming a better infinite sensor node positioning algorithm.
In this study, Section 2 introduces the research of WSN at home and abroad and the PSO and DFPs; in Section 3, the structure of the WSN is introduced in detail and the PSO-DFP proposed in this research is carried out; in Section 4, the feasibility of the PSO-DFP is first analyzed, then the positioning accuracy and the influencing factors of the positioning accuracy are analyzed, and finally, the energy consumption in the positioning is also analyzed. Finally, it is also verified that the method proposed in this study has a good optimization effect in the positioning of wireless sensor nodes.
2 Related works
Pan et al. [6] introduced a hybrid algorithm based on whale optimization algorithm and quasi-radiative transformation evolution for modeling and analysis of the node location problem in WSN. The experimental results show that this fusion algorithm had a more significant optimization effect than the previous single algorithm and greatly improved the calculation efficiency, and finally, this algorithm was used to obtain accurate positioning information. When Keswani and Bhaskar [7] studied the network communication problem, aiming to obtain more accurate WSN node information, they introduced flower pollination and genetic algorithm to calculate it. The experimental results also show that the network node information calculated by this algorithm was more accurate, and the performance of the network was greatly improved. When Houssein et al. [8] studied the lifespan of large-scale WSN, aiming to determine the location of each sink node, the hybrid harmony search and particle swarm optimization algorithm was introduced and compared with the flower pollination algorithm and the gray wolf algorithm. The algorithm proposed in this study had lower energy consumption and smaller positioning error than these two algorithms, and finally, it also effectively prolonged the life of the network. When Li et al. [9] studied the real-time positioning of low-level shallow sources, aiming to effectively denoise the signals of WSN nodes to improve the accuracy and efficiency of positioning, a delayed least mean square algorithm was introduced to calculate it. The introduction of this algorithm greatly improved the noise reduction effect of the signal and also provided a solid foundation for the final accurate positioning. Zhang et al. [10] found that 3D WSN had higher node energy consumption than low-dimensional sensor networks and introduced multi-hop routing clustering protocol and fragile ant colony algorithm to solve this problem. This method could greatly reduce the energy consumption of nodes and greatly improved the performance of network load balancing.
Wu et al. [11] introduced the microbial cell factories in biotechnology-particle swarm optimization for the localization problem of node movement in the research of 3D WSN. The introduction of the algorithm solved the particle degeneracy problem of the traditional algorithm, and the algorithm had a faster convergence speed and a more accurate optimal solution and finally provided more accurate positioning information for nodes. Prithi and Sumathi [12] introduced a particle algorithm to optimize the intrusion detection problem in WSN. After the introduction of the algorithm, the intrusion detection efficiency of the entire network was greatly improved. Mozamir et al. [13] found that there was a certain estimation error in the node positioning when performing WSN positioning. For this issue, a global optimal local neighborhood PSO algorithm was introduced for optimization. From the experimental results, compared with before optimization, the error rate of the optimized algorithm was reduced by 0.01%, and the computational efficiency was also improved by 87.01%. In the research of WSN, Jin [14] introduced the final improved chaotic PSO algorithm for the problem that the signal strength indicator was easily affected by the surrounding environment. Compared with the previous algorithm, the algorithm had a better convergence effect and greatly reduced the influence of ranging error on positioning, thereby enhancing the effect of positioning. When Ling et al. [15] studied the position of the control sensor, aiming to ensure a high coverage rate of the area, an improved particle swarm algorithm was introduced to constrain and optimize it. The improved algorithm had a better positioning effect and could better improve the space utilization. To sum up, many methods have been used in wireless sensor node positioning, but there still exists the problem of positioning accuracy. In response to this problem, this research will continue to study on this basis.
3 Wireless sensor node localization algorithm combined with PSO-DFP
3.1 WSN structure and characteristics of sensor nodes
WSN is a distributed sensor network that integrates computers, networks, microelectronics, communications, and integrated circuits. Sensors that can detect the outside world are distributed at the ends of this network [16]. A schematic diagram of a common WSN architecture is shown in Figure 1.

Schematic diagram of the WSN system structure.
In Figure 1, the structure of WSN is mainly composed of sensor nodes, network nodes, and management nodes distributed in the monitoring area. Among them, sensor nodes play a very important role in the WSN structure. It not only needs to collect and process the information in the region but also needs to process the data transmitted by other nodes, and finally, the processed information is transferred to the next node [17]. The workflow of WSN architecture is to first arrange a large number of sensor nodes in the detection area. These sensor nodes form a network, and then the network nodes are used to send relevant instructions. After receiving the instruction, the sensor node collects information according to the instruction requirements and transmits the information to the management user through the network [18].
Figure 2 shows the sensor node diagram. In Figure 2, each sensor has an independent ability to collect, process, analyze, and transmit data information. Usually, due to the limitation of the small size of wireless sensors, sensor nodes cannot use too large a volume. Therefore, the node can only be powered by the limited amount of disposable batteries, and after the battery is exhausted, new sensor nodes must be re-launched [19]. The WSN mainly has the following characteristics when it works. WSN is first a distributed system without a center. All sensor nodes have equal probability when collecting, analyzing, and transmitting information, and each node plays the same role. The damage or the addition of nodes will not cause damage to the stability of the system; WSN has the characteristics of strong portability and operability, which also limits its size. Therefore, it cannot store too much energy itself, resulting in one-time delivery of nodes. Limited by the working environment and energy, the topology of the system structure is easily changed. Each sensor node has limited energy storage, and the stored energy is limited. Therefore, a high density of sensor nodes is required in a monitoring area to improve the adaptability of the network. Due to the large density of nodes, information redundancy will inevitably occur [20].
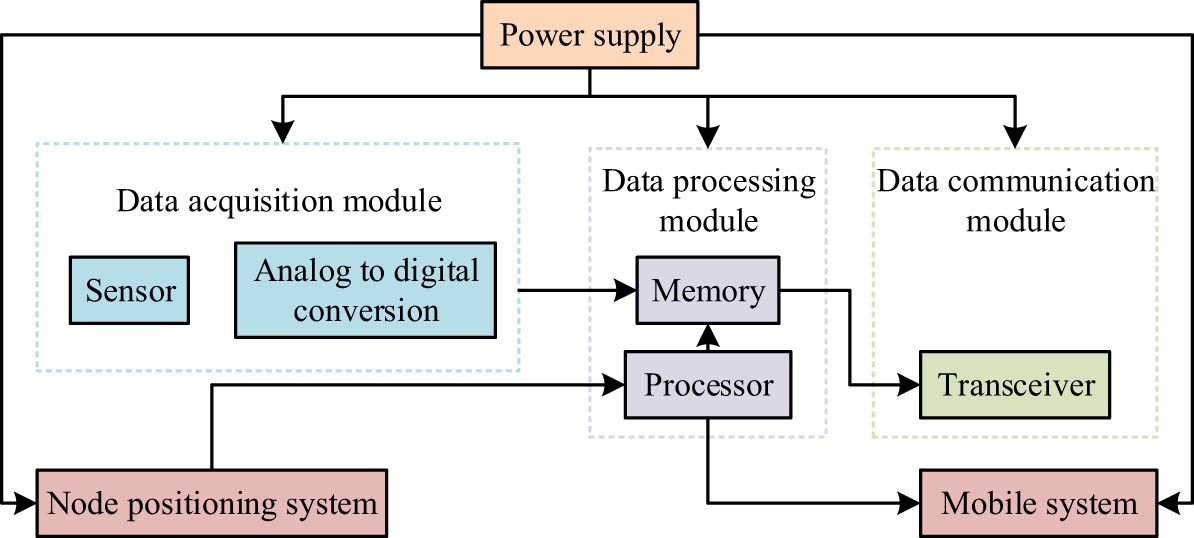
Schematic diagram of sensor node structure.
3.2 The structure and characteristics of the PSO
PSO is a global optimization algorithm proposed at the end of the 20th century. This algorithm is similar to the genetic algorithm in that it is established on the basis of population and fitness. The difference is that there are no genetic operators such as selection, crossover, and mutation in the calculation of the noisy PSO. Instead, it uses the memory of particles and groups to search for optimization in the solution space. This method also makes the optimization objective function converge to the global optimal solution with a very high probability. It is precisely because of this characteristic of the PSO that the algorithm has a relatively significant effect on nonlinear optimization problems and combinatorial optimization problems [21].
When the PSO is running, it is first necessary to initialize any one of the populations, so that the position of any particle in the population is a feasible solution to the problem to be optimized. At the same time, aiming to ensure the flight of particles in the iterative, each particle must also be given an initial speed. At this time, each particle has a corresponding fitness value, which is determined by the objective function of the particle’s position, and the particle fitness value ultimately determines the pros and cons of the particle’s position [22]. In algorithm optimization, each particle will set its subsequent flight trajectory and speed according to the flight experience of itself and the surrounding particles. In the iterative optimization, the particle velocity and position are calculated as shown in equation (1).
In equation (1), c
1 and c
2 represent a positive learning factor.
In equation (3),
In equation (6), d n represents the distance between the unknown node and the anchor node, and ε n represents the difference between the estimated distance and the real distance. The optimization of the unknown node position by the PSO algorithm is calculated by equation (7).
Then the fitness value is used to judge the pros and cons of the position of the particle, and the calculation method of the fitness value is shown in equation (8).
To sum up, the flow of PSO operation is shown in Figure 3.

The basic schematic diagram of PSO operation.
From Figure 3, when the PSO is running, the population is first initialized. Then, the optimal solution of each individual is calculated according to the calculated fitness value. Compared with each other, the optimal solution in the group is obtained. The flying speed and position of each particle are calculated again to determine whether the iteration stop condition is satisfied. If satisfied, it outputs the result. On the contrary, it needs to jump to the urgent need solution fitness value and enter the next iteration until the end of the loop.
3.3 Node location based on PSO-DFP hybrid algorithm
As one of the most effective methods in solving nonlinear problems, Newton’s method finds the optimal solution through several iterations during the operation. Before the algorithm starts to run, an estimated solution is set, and the objective function or optimal function
Assuming that
In equation (10),
If the Hessian matrix is invertible, there is equation (12).
As shown in equation (12), it is the final result of the Newton iteration method. When the number of matrix columns is large, the traditional Newton’s method needs to perform extremely complex calculations. Therefore, a new quasi-Newton method (DFP algorithm) is introduced. This algorithm shows extremely strong performance in solving the unconstrained optimization extremum, and the calculation amount is also greatly reduced [25]. In the operation, sometimes it is necessary to find a substitute matrix similar to the Hessian matrix, and equation (13) is obtained from equation (11).
In equation (13),
Equations (14) and (15) are called quasi-Newton conditions. Aiming to solve the complexity of the Hessian matrix calculation, a new variable is introduced, as shown in equation (16).
The DFP has a high convergence speed under the condition of local convergence. However, if there is a certain distance from the minimum point

Basic schematic diagram of node location algorithm based on PSO-DFP.
From Figure 4, when the WSN based on PSO-DFP is running, it first determines whether it is an anchor node. If it is not an anchor node, it transmits its own information and receives information from other anchor nodes. It needs to calculate the average hopping distance, and then transmit the average hopping distance. If it is an anchor node, it will accept the information of the anchor node and judge the number of information and the size of the population. If it is greater than
4 Experimental results and analysis
The study uses Matlab 8.0 to establish a simulation environment to verify the effectiveness of the ant colony particle swarm algorithm in area coverage optimization, and the sensor nodes are deployed in a randomized manner using the model presented in the study. To compare the accuracy of the three-node localization algorithms of fusion PSO-DFP, PSO, and DFP, the precision recall (PR) curves of the three localization algorithms were analyzed.
The PR curve is an important reference index to evaluate model performance. The horizontal coordinate of the PR curve is the recall rate and the vertical coordinate is the precision rate, so the curve can directly reflect the optimal performance of the model. Moreover, the area enclosed by the curve can also directly reflect the performance of the model. From Figure 5, the average precision values of the DFP, PSO, and fusion PSO-DFP were 0.9324, 0.9455, and 0.9972, respectively. From the results, the fusion PSO-DFP had a higher precision rate and a better balance between the precision rate and the recall rate and was more stable than the other two algorithms. There was a close relationship between the number of particles in PSO and the PSO-DFP. Before the start of the experiment, the influence between the number of particles and the PSO-DFP was first analyzed.
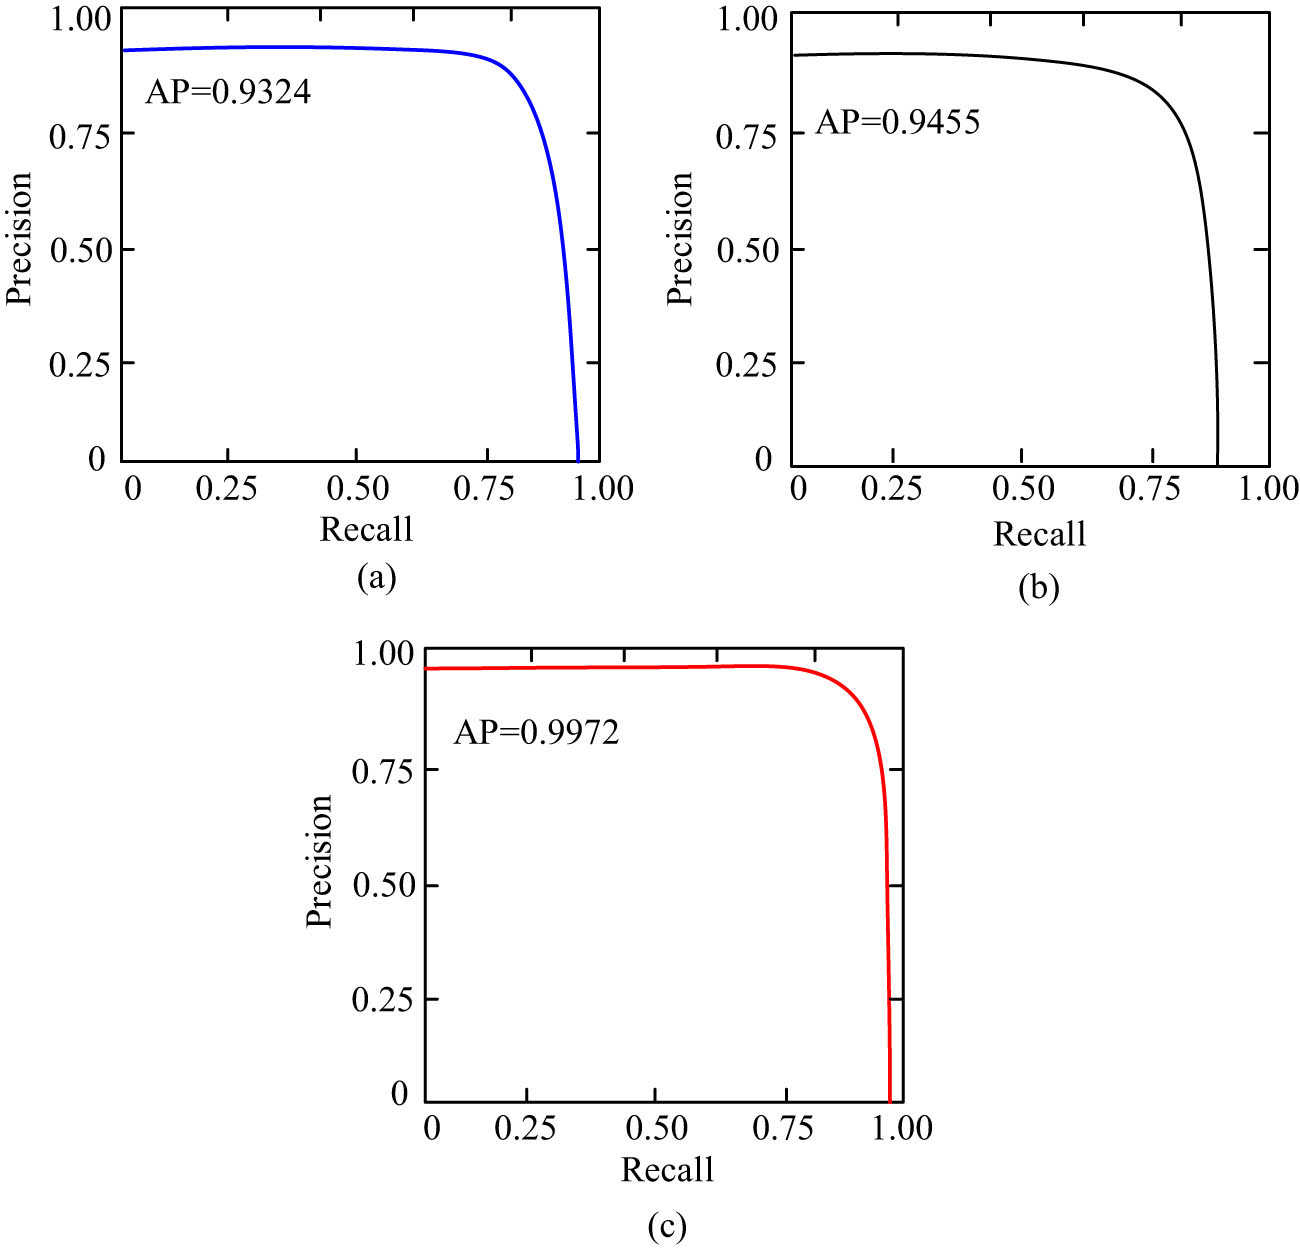
PR curves of three algorithms. (a) PR curve of DFP algorithm, (b) PR curve of PSO algorithm, and (c) PR curve of PSO-DFP algorithm.
In Table 1, two functions are used to verify the influence of particle number on model performance. The F 1 test function is the Rosenbrock function, which is a typical narrow, long, and deep valley function and has certain difficulty in minimization. The Schaffer test function was used for F 2 function, which had a strongly oscillating multimodal function and was difficult to obtain the optimal solution by the traditional algorithm. From the results shown in Table 1, the influence of the particle number on the F 1 function was relatively weak. In the F 2 test function, the number of particles had a great influence on the hybrid algorithm. When the number of particles was less than or equal to 10, the highest success rate was only 46%. As the number of particles continued to increase, the success rate also continued to increase. When the number of particles was 100, the success rate was as high as 100%. In summary, it is necessary to select as many particles as possible when calculating complex functions. As shown in Figure 6, it is a plan view of the sensor unknown nodes and the distribution of anchor points.
Influence of particle number on PSO-DFP
| N | Testing frequency | Search for the optimal value | Success rate (%) | Average time (s) | ||
|---|---|---|---|---|---|---|
| Function | F 1 | 10 | 50 | 48 | 96 | 0.02632781 |
| 20 | 50 | 48 | 96 | 0.0274725 | ||
| 30 | 50 | 50 | 100 | 0.0153846 | ||
| 100 | 50 | 50 | 100 | 0.021978 | ||
| F 2 | 10 | 50 | 23 | 46 | 0.004778261 | |
| 20 | 50 | 38 | 76 | 0.01879697 | ||
| 30 | 50 | 42 | 84 | 0.04186285 | ||
| 100 | 50 | 50 | I00 | 0.0648351 | ||

Plane distribution of unknown nodes and anchor points in the simulation experiment.
In Figure 6, 10 anchor nodes and 80 unknown nodes were used for verification in the simulation experiment, and the distribution of unknown nodes and anchor nodes was irregular and random. Therefore, there is also a certain randomness in the calculation, and the operation of performing several calculations to obtain the average value will also be taken during the experiment. To verify the positioning error of the PSO-DFP, the node positioning errors of PSO, DFP, and PSO-DFP hybrid algorithms were calculated.
Figure 7 shows the average error results of 50 unknown node error calculations by different algorithms. In Figure 7, the abscissa represents the number of node distribution, and the ordinate represents the error of node positioning. In practice, it shows the distance of deviation from the actual coordinates. The larger the deviation, the greater the error of node positioning. From the results under the same node number, the node error of the PSO-DFP was significantly smaller than that of the PSO and the DFP. In the PSO, the node positioning error was up to about 36 mm; in the DFP, the node positioning error was up to about 43 mm; and in the PSO-DFP, the node positioning error was up to about 21 mm. In summary, the PSO-DFP fusion positioning algorithm had higher stability and positioning accuracy. In node positioning, the factors that affect the positioning accuracy were also the distribution of anchor nodes, which had an extremely important influence.

Average error results of unknown nodes located by three algorithms: (a) unknown node positioning error based on PSO algorithm positioning, (b) unknown node location error based on the DFP algorithm location, and (c) unknown node positioning error based on PSO-DFP algorithm positioning.
From Figure 8, as the proportion of anchor nodes increased, the average positioning error also decreased. The overall error of the PSO-DFP was the smallest. In the PSO-DFP, when the proportion of anchor nodes was 5%, the average positioning error was around 0.59 dm. As the proportion of anchor nodes increased, the average positioning error also decreased. When the proportion of anchor nodes increased to 30%, the average positioning error dropped to about 0.21 dm. The overall positioning average error was about 20% lower than that of the PSO and about 31% lower than that of the DFP. With the continuous increase of the node communication radius, the average positioning errors of three algorithms were significantly reduced. In the PSO-DFP, when the node communication radius was 20, the average error of node positioning was about 0.5 dm, and with the continuous increase of the communication radius, the error also decreased. When the communication radius increased to 60, the error dropped to 0.35 dm. Among the three algorithms, the overall error of the PSO-DFP was the smallest. In conclusion, irrespective in the environment with low or high communication radius, the PSO-DFP had greater advantages. The positioning accuracy of nodes was also positively correlated with the distribution density of nodes. The average positioning error decreased with the increase in node density, and the PSO-DFP was the most significant. In the PSO-DFP, when the number of nodes was 60, the error was about 0.5 dm. As the number of nodes increased, the error also decreased. When the number of nodes increased to 140, the error decreased to 0.19 dm. In summary, the proportion of anchor nodes, the communication radius of nodes, and the distribution density of nodes will have a great impact on the positioning accuracy of nodes. After analyzing the positioning accuracy of the nodes, this study continued to analyze the energy consumption during the positioning. In the positioning, the convergence speed of the algorithm was the key factor affecting the node energy consumption. The convergence rates of the three algorithms, PSO, DFP, and PSO-DFP, were analyzed. The analysis results are shown in Figure 9.

Influence of anchor nodes on positioning accuracy. (a) The effect of different anchor node ratios on the positioning accuracy, (b) influence of communication radius of different nodes on positioning accuracy, and (c) influence of node density on positioning accuracy.

Convergence speed comparison of three algorithms.
Figure 9 shows that among the three algorithms, the calculation of the DFP was relatively simple, so it also had a slower convergence speed and lower energy consumption, but it was also slightly insufficient in accuracy. In comparison, the PSO-DFP had the highest accuracy and the fastest convergence speed, which required the highest energy consumption. Considering the two aspects of comprehensive accuracy and energy consumption, the PSO-DFP was still more dominant in positioning.
The research selected three different improved algorithms to compare with the proposed algorithms, including PSO-DBN, backpropagation neural network-particle swarm optimization (BPNN-PSO), and invasive weed optimization algorithm-particle swarm optimization algorithms [29,30,31,32]. Figure 10 shows the impact of the four algorithms on sensor energy consumption. In Figure 10, the impact of the four algorithms on the energy consumption of the sensor at the same time was not different. The energy consumption of the BPNN-PSO algorithm was relatively high, with the energy consumption of 0.67 W. The energy consumption of the PSO-DBN algorithm used in the study was relatively low, with an energy consumption of 0.54 W per hour. The results showed that the proposed PSO-DBN algorithm had longer endurance.

Influence of each algorithm on sensor energy consumption.
5 Conclusion
In the wireless sensor application, the precise positioning of wireless sensor nodes also means the accuracy of data detection. In this study, the PSO-DFP was introduced to optimize the node positioning. When analyzing the comprehensive positioning accuracy of the three algorithms under the same node number, it was observed that the node error of the PSO-DFP was smaller than that of the PSO and the DFP. In the PSO, the node positioning error was up to about 36 mm; in the DFP, the node positioning error was up to about 43 mm; and in the PSO-DFP, the node positioning error was up to about 21 mm. It showed that among the three algorithms, the PSO-DFP had higher precision and stability. When discussing the specific influence of nodes on the positioning accuracy, it was found that with the continuous increase in the proportion of anchor nodes, the node communication radius, and the node density, the average positioning error decreased accordingly. Compared with the other two algorithms, this fusion positioning algorithm had lower positioning error.
There are still many areas for improvement in this research. For example, compared with the single PSO and DFPs, the PSO-DFP fusion positioning algorithm has greatly improved the positioning accuracy, but due to the computational complexity and high convergence of the algorithm, it greatly improves the energy consumption. The distribution of anchor nodes greatly affects the positioning accuracy. To sum up, the energy consumption and the deployment of anchor nodes need to be further improved.
-
Funding information: No funding was received.
-
Author contributions: Jingjing Sun contributed to the motivation, the interpretation of the methods, the data analysis and results, and provided the draft versions and revised versions, references. Peng Zhang provided the data and results, the revised versions and references. Xiaohong Kong provided the related concepts and minor recommendations, extracted the conclusion and discussion.
-
Conflict of interest: It is declared by the authors that this article is free of conflict of interest.
-
Data availability statement: The datasets used and/or analyzed during the current study are available from the corresponding author on reasonable request.
References
[1] Messous S, Liouane H. Online sequential DV-Hop localization algorithm for wireless sensor networks. Mob Inf Syst. 2020;2020(1):27–32.10.1155/2020/8195309Search in Google Scholar
[2] Chen J, Sackey SH, Anajemba JH. Energy-efficient clustering and localization technique using genetic algorithm in wireless sensor networks. Complexity. 2021;2021:1–12.10.1155/2021/5541449Search in Google Scholar
[3] Zhou ZG, Wang Y, Li PP. Node location privacy protection in unattended wireless sensor networks. Math Probl Eng. 2021;2021:1–17.10.1155/2021/5539382Search in Google Scholar
[4] Swapna SB, Santhosh R. Performance analysis of ant-lion optimization based routing algorithm for wireless sensor networks. Int J Intell Unmanned Syst. 2021;9(2):119–32.10.1108/IJIUS-09-2019-0055Search in Google Scholar
[5] Han D, Yu Y, Li KC. Enhancing the sensor node localization algorithm based on improved DV-Hop and DE algorithms in wireless sensor networks. Sensors. 2020;20(2):343–51.10.3390/s20020343Search in Google Scholar PubMed PubMed Central
[6] Pan JS, Fan F, Chu SC, Du Z, Zhao H. A node location method in wireless sensor networks based on a hybrid optimization algorithm. Wirel Commun Mob Comput. 2020;2020(4):1–14.10.1155/2020/8822651Search in Google Scholar
[7] Keswani K, Bhaskar A. Flower pollination and genetic algorithm based optimization for node deployment in wireless sensor networks. Int J Eng Technol Manag Res. 2020;5(2):281–93.10.29121/ijetmr.v5.i2.2018.658Search in Google Scholar
[8] Houssein EH, Saad MR, Hussain K. Optimal sink node placement in large scale wireless sensor networks based on Harris’ Hawk optimization algorithm. IEEE Access. 2020;8:81–97.10.1109/ACCESS.2020.2968981Search in Google Scholar
[9] Li J, Li M, Meng M. The on-chip D-LMS filter design method of wireless sensor node based on FPGA. Shock Vib. 2020;2020:1–16.10.1155/2020/4850438Search in Google Scholar
[10] Zhang T, Chen G, Zeng Q, Song G, Li C, Duan H. Routing clustering protocol for 3D wireless sensor networks based on fragile collection ant colony algorithm. IEEE Access. 2020;8:58874–88.10.1109/ACCESS.2020.2982691Search in Google Scholar
[11] Wu H, Liu J, Dong Z, Liu Y. A hybrid mobile node localization algorithm based on adaptive MCB-PSO approach in wireless sensor networks. Wirel Commun Mob Comput. 2020;2020(6):1–17.10.1155/2020/3845407Search in Google Scholar
[12] Prithi S, Sumathi S. LD2FA-PSO: A novel learning dynamic deterministic finite automata with PSO for secured energy efficient routing in wireless sensor networks. Ad Hoc Netw. 2020;97:24–36.10.1016/j.adhoc.2019.102024Search in Google Scholar
[13] Mozamir MS, Bakar R, Wan I, Musa Z. GbLN-PSO algorithm for indoor localization in wireless sensor networks. IOP Conf Ser Mater Sci Eng. 2020;769:33–54.10.1088/1757-899X/769/1/012033Search in Google Scholar
[14] Jin XA. CPSO for optimization of wireless sensor networks positioning. Int J Circuits. 2020;14:758–63.10.46300/9106.2020.14.96Search in Google Scholar
[15] Ling H, Zhu T, He W. Coverage optimization of sensors under multiple constraints using the improved PSO. Math Probl Eng. 2020;2020(2):2–10.10.1155/2020/8820907Search in Google Scholar
[16] Hu P, Zhang B. Research on centroid localization algorithm in wireless sensor networks. J Phys Conf Ser. 2021;1883(1):26–33.10.1088/1742-6596/1883/1/012026Search in Google Scholar
[17] Wang D, Huang Q, Chen X. Location of three-dimensional movement for a human using a wearable multi-node instrument implemented by wireless body area networks. Comput Commun. 2020;153:34–41.10.1016/j.comcom.2020.01.070Search in Google Scholar
[18] Hu F, Lu Y, Jin L. Hybrid energy efficiency friendly frequency domain TR algorithm based on PSO evaluated by novel maximizing HPA efficiency evaluation criteria. Energies. 2022;15:89–101.10.3390/en15030917Search in Google Scholar
[19] Ngansop B, Götz S, Eckl M. Comparison study of the combination of the SPSA algorithm and the PSO algorithm. 2022;2022:27–44. 10.48550/arXiv.2204.11908.Search in Google Scholar
[20] Li H, Li X, Zhao YC, Zhong Z, Zhang J, Yang Y, et al. The multilayer structure design of magnetic-carbon composite for ultra-broadband microwave absorption via PSO algorithm. J Alloy Compd. 2022;5(1):44–51.Search in Google Scholar
[21] Xu L, Cao M, Song B. A new approach to smooth path planning of mobile robot based on quartic Bezier transition curve and improved PSO. Neurocomputing. 2022;2022:473–4.10.1016/j.neucom.2021.12.016Search in Google Scholar
[22] Jing XD, Wang XF. PSO tuning PI_ PID controller parameters of quad-rotor UAV. J Phys Conf Ser. 2022;2228(1):17–22.10.1088/1742-6596/2228/1/012017Search in Google Scholar
[23] Song X, Wang C. Hyperspectral remote sensing image classification based on spectral-spatial feature fusion and PSO. J Phys Conf Ser. 2022;2189(1):10–29.10.1088/1742-6596/2189/1/012010Search in Google Scholar
[24] Huang Y, Watanabe T, Bando M. PSO parameter settings and optimal multi-rotor layout design. Int J Sustain Aviat. 2022;2022(8–2):89–104.10.1504/IJSA.2022.122324Search in Google Scholar
[25] Han X, Pagnacco E. Response EPSD of chain-like MDOF nonlinear structural systems via wavelet-Galerkin method. Appl Math Model. 2022;103:475–92.10.1016/j.apm.2021.10.036Search in Google Scholar
[26] Wei J, Shao S, Ma H. High-resolution ISAR imaging with modified joint range spatial-variant autofocus and azimuth scaling. Sensors. 2020;20(18):26–49.10.3390/s20185047Search in Google Scholar PubMed PubMed Central
[27] Stojanović B, Gajević S, Kostić N, Miladinović S, Vencl A. Optimization of parameters that affect wear of A356/Al2O3 nanocomposites using RSM, ANN, GA and PSO methods. Ind Lubr Tribol. 2022;74(3):350–9.10.1108/ILT-07-2021-0262Search in Google Scholar
[28] Zhang H, Peng Q. PSO and K-means-based semantic segmentation toward agricultural products. Future Gener Comput Syst. 2022;126:82–7.10.1016/j.future.2021.06.059Search in Google Scholar
[29] Su Z, Yang J, Li P, Jing J, Zhang H. A precise method of color space conversion in the digital printing process based on PSO-DBN. Text Res J. 2022;92(9–10):1673–81.10.1177/00405175211067287Search in Google Scholar
[30] Fu C, Ma X, Zhang L. Fuzzy-PID strategy based on PSO optimization for pH control in water and fertilizer integration. IEEE Access. 2022;10:4471–82.10.1109/ACCESS.2021.3138910Search in Google Scholar
[31] Moghaddam MA, Kolahan F. Modeling and optimization of A-GTAW process using Box-Behnken design and hybrid BPNN-PSO approach. Proc Inst Mech Eng E J Process Mech Eng. 2022;236(3):859–69.10.1177/09544089211050457Search in Google Scholar
[32] Zhao J, Zhu X, Song T. Serial manipulator time-jerk optimal trajectory planning based on hybrid IWOA-PSO algorithm. IEEE Access. 2022;10:6592–604.10.1109/ACCESS.2022.3141448Search in Google Scholar
© 2023 the author(s), published by De Gruyter
This work is licensed under the Creative Commons Attribution 4.0 International License.
Articles in the same Issue
- Research Articles
- Salp swarm and gray wolf optimizer for improving the efficiency of power supply network in radial distribution systems
- Deep learning in distributed denial-of-service attacks detection method for Internet of Things networks
- On numerical characterizations of the topological reduction of incomplete information systems based on evidence theory
- A novel deep learning-based brain tumor detection using the Bagging ensemble with K-nearest neighbor
- Detecting biased user-product ratings for online products using opinion mining
- Evaluation and analysis of teaching quality of university teachers using machine learning algorithms
- Efficient mutual authentication using Kerberos for resource constraint smart meter in advanced metering infrastructure
- Recognition of English speech – using a deep learning algorithm
- A new method for writer identification based on historical documents
- Intelligent gloves: An IT intervention for deaf-mute people
- Reinforcement learning with Gaussian process regression using variational free energy
- Anti-leakage method of network sensitive information data based on homomorphic encryption
- An intelligent algorithm for fast machine translation of long English sentences
- A lattice-transformer-graph deep learning model for Chinese named entity recognition
- Robot indoor navigation point cloud map generation algorithm based on visual sensing
- Towards a better similarity algorithm for host-based intrusion detection system
- A multiorder feature tracking and explanation strategy for explainable deep learning
- Application study of ant colony algorithm for network data transmission path scheduling optimization
- Data analysis with performance and privacy enhanced classification
- Motion vector steganography algorithm of sports training video integrating with artificial bee colony algorithm and human-centered AI for web applications
- Multi-sensor remote sensing image alignment based on fast algorithms
- Replay attack detection based on deformable convolutional neural network and temporal-frequency attention model
- Validation of machine learning ridge regression models using Monte Carlo, bootstrap, and variations in cross-validation
- Computer technology of multisensor data fusion based on FWA–BP network
- Application of adaptive improved DE algorithm based on multi-angle search rotation crossover strategy in multi-circuit testing optimization
- HWCD: A hybrid approach for image compression using wavelet, encryption using confusion, and decryption using diffusion scheme
- Environmental landscape design and planning system based on computer vision and deep learning
- Wireless sensor node localization algorithm combined with PSO-DFP
- Development of a digital employee rating evaluation system (DERES) based on machine learning algorithms and 360-degree method
- A BiLSTM-attention-based point-of-interest recommendation algorithm
- Development and research of deep neural network fusion computer vision technology
- Face recognition of remote monitoring under the Ipv6 protocol technology of Internet of Things architecture
- Research on the center extraction algorithm of structured light fringe based on an improved gray gravity center method
- Anomaly detection for maritime navigation based on probability density function of error of reconstruction
- A novel hybrid CNN-LSTM approach for assessing StackOverflow post quality
- Integrating k-means clustering algorithm for the symbiotic relationship of aesthetic community spatial science
- Improved kernel density peaks clustering for plant image segmentation applications
- Biomedical event extraction using pre-trained SciBERT
- Sentiment analysis method of consumer comment text based on BERT and hierarchical attention in e-commerce big data environment
- An intelligent decision methodology for triangular Pythagorean fuzzy MADM and applications to college English teaching quality evaluation
- Ensemble of explainable artificial intelligence predictions through discriminate regions: A model to identify COVID-19 from chest X-ray images
- Image feature extraction algorithm based on visual information
- Optimizing genetic prediction: Define-by-run DL approach in DNA sequencing
- Study on recognition and classification of English accents using deep learning algorithms
- Review Articles
- Dimensions of artificial intelligence techniques, blockchain, and cyber security in the Internet of medical things: Opportunities, challenges, and future directions
- A systematic literature review of undiscovered vulnerabilities and tools in smart contract technology
- Special Issue: Trustworthy Artificial Intelligence for Big Data-Driven Research Applications based on Internet of Everythings
- Deep learning for content-based image retrieval in FHE algorithms
- Improving binary crow search algorithm for feature selection
- Enhancement of K-means clustering in big data based on equilibrium optimizer algorithm
- A study on predicting crime rates through machine learning and data mining using text
- Deep learning models for multilabel ECG abnormalities classification: A comparative study using TPE optimization
- Predicting medicine demand using deep learning techniques: A review
- A novel distance vector hop localization method for wireless sensor networks
- Development of an intelligent controller for sports training system based on FPGA
- Analyzing SQL payloads using logistic regression in a big data environment
- Classifying cuneiform symbols using machine learning algorithms with unigram features on a balanced dataset
- Waste material classification using performance evaluation of deep learning models
- A deep neural network model for paternity testing based on 15-loci STR for Iraqi families
- AttentionPose: Attention-driven end-to-end model for precise 6D pose estimation
- The impact of innovation and digitalization on the quality of higher education: A study of selected universities in Uzbekistan
- A transfer learning approach for the classification of liver cancer
- Review of iris segmentation and recognition using deep learning to improve biometric application
- Special Issue: Intelligent Robotics for Smart Cities
- Accurate and real-time object detection in crowded indoor spaces based on the fusion of DBSCAN algorithm and improved YOLOv4-tiny network
- CMOR motion planning and accuracy control for heavy-duty robots
- Smart robots’ virus defense using data mining technology
- Broadcast speech recognition and control system based on Internet of Things sensors for smart cities
- Special Issue on International Conference on Computing Communication & Informatics 2022
- Intelligent control system for industrial robots based on multi-source data fusion
- Construction pit deformation measurement technology based on neural network algorithm
- Intelligent financial decision support system based on big data
- Design model-free adaptive PID controller based on lazy learning algorithm
- Intelligent medical IoT health monitoring system based on VR and wearable devices
- Feature extraction algorithm of anti-jamming cyclic frequency of electronic communication signal
- Intelligent auditing techniques for enterprise finance
- Improvement of predictive control algorithm based on fuzzy fractional order PID
- Multilevel thresholding image segmentation algorithm based on Mumford–Shah model
- Special Issue: Current IoT Trends, Issues, and Future Potential Using AI & Machine Learning Techniques
- Automatic adaptive weighted fusion of features-based approach for plant disease identification
- A multi-crop disease identification approach based on residual attention learning
- Aspect-based sentiment analysis on multi-domain reviews through word embedding
- RES-KELM fusion model based on non-iterative deterministic learning classifier for classification of Covid19 chest X-ray images
- A review of small object and movement detection based loss function and optimized technique