A multi-crop disease identification approach based on residual attention learning
-
Kirti
 and
Navin Rajpal
and
Navin Rajpal

Abstract
In this work, a technique is proposed to identify the diseases that occur in plants. The system is based on a combination of residual network and attention learning. The work focuses on disease identification from the images of four different plant types by analyzing leaf images of the plants. A total of four datasets are used for the work. The system incorporates attention-aware features computed by the Residual Attention Network (Res-ATTEN). The base of the network is ResNet-18 architecture. Integrating attention learning in the residual network helps improve the system's overall accuracy. Various residual attention units are combined to create a single architecture. Unlike the traditional attention network architectures, which focus only on a single type of attention, the system uses a mixed type of attention learning, i.e., a combination of spatial and channel attention. Our technique achieves state-of-the-art performance with the highest accuracy of 99%. The results show that the proposed system has performed well for both purposes and notably outperformed the traditional systems.
1 Introduction
Agricultural productivity is affected by various factors such as increasing global population, the effects on crops caused by extreme weather variations and various epidemics occurring on a severe level affect the food security. The farmers use disease control measures which are costly and can exceed the yield losses. The farmers would only take actions at the time when it is too late for the disease to stop from spreading because it will cost too much for the farmers to implement the crop protection measures during the early onset of the diseases which results in very less benefits [1]. Many procedures can be adopted for crop disease management so that yield loss can be minimized, and crop health can be improved.
One of the main criteria for crop protection is the early detection of the plant diseases and implementation of the suitable treatment methods and keep it as confined as possible to lessen the requirement of the chemicals used for the methods. These methods should be implemented ideally before the symptoms of the disease are significantly visible [2]. The plant leaves are the parts of plants that are usually considered to detect the disease from the affected portions, which are extremely helpful in judging the disease [3,4,5,6,7,8]. It has been observed that computer devices with the technology of computer vision can be helpful in various fields of real-life problems [9,10,11,12,13,14,15]. It can be used in crop protection practices as they can detect disease, pests, malnutrition, by means of graphics, image processing, and artificial intelligence [16,17].
Mishra et al. developed a real-time corn disease recognition system using various deep-learning networks. The main focus was to develop a system which does not need any internet connection for the processing. The method was implemented on an embedded system using Raspberry pi. The system used corn plant leaf images. A total of 679 healthy/diseased leaf images were used, and the system could achieve an accuracy of 88.46%. The proposed system could recognize single-plant diseases [18]. Sujatha et al. proposed a plant disease detection system using Citrus leaf images. The dataset contained images of healthy citrus plant leaves and images of different diseases that occur in the citrus plant. The system used two classification methods, i.e., the traditional ML methods (SGD, RF, SVM) and deep learning methods (Inception-v3, VGG-16, VGG-19). The proposed technique could achieve the highest accuracy of 89.5% and focus on single-plant problems [19].
A few short learning approaches was proposed by Argüeso et al. that used two training architectures (two Siamese networks with Inception v3 Network) for plant disease classification. Experiments were performed on two datasets containing 32 classes (48,775 images) and 6 classes (5,528 images), respectively. The technique showed the highest accuracy at 90%. The system proved incapable of discriminating the leaves with similar morphologies [20]. A transfer learning based technique for detecting diseases and pests from the images of the Hot Pepper dataset was proposed by Yin et al. The dataset contained 28,011 images with 34 classes of diseased and pest-infested leaves of Hot Pepper. The classification was performed using MobileNet, ResNet 50, Inception, Inception v4, DenseNet, Xception, VGG16, and VGG19. The technique achieved the highest accuracy of 93.62%, which seems to be much less [21]. Arsenovic et al. developed a plant disease detection system, the Plant Disease Net, as a novel, two-stage architecture. The system was evaluated using 79,265 images of healthy/diseased leaves of plants. YOLO was used for classification purposes. The system exhibited the highest accuracy of 93.67%, which was significantly low compared to the current systems [22].
Wu proposed a disease identification system for identifying Soybean plant diseases. Seven hundred images were labelled as Bacterial,Downy mildew, Health, Pest, Pesticide, Spider mite, and Virus disease. Since the dataset was very small and the system posed an overfitting issue, the data augmentation procedure was applied to generate 8,470 soybean leaf images from 700 images. The pre-trained deep learning models, AlexNet, GoogLeNet, and ResNet, were used to evaluate the system. The system achieved an accuracy of 94.29%. The limitation of this system was that it emphasized a single crop [23]. A nine-layer deep convolutional neural network was introduced by Geetharamani and Arun. The network used 38 different classes (61,486 images) of crop images for evaluating the performance. The system could achieve only an accuracy of 96.46% even after possessing such an extensive training set [24]. Gajjar et al. designed a real-time convolutional neural network to detect and identify plant leaf diseases on an embedded platform. A novel single-shot detector CNN was created that could identify the disease and localize the leaf. The system showed an accuracy of 96.88%. In this case, the system needed extra computation to extract the region of interest or affected portion of the leaf [25]. Thenmozhi and Srinivasulu created a deep convolutional network to classify pests in the crop images. Three types of datasets were used to evaluate the performance of the network – NBAIR insect dataset (40 classes), Xie1 (24 classes) insect dataset, and Xie2 (40 classes) insect dataset. VGG-16, AlexNet, ResNet-101, VGG-19, and ResNet-50 were incorporated into the system for the classification task. The network achieved an accuracy of 97.47%. The approach used extra computation in localizing the region of interest [26].
Turkoglu et al. developed a DNN named as PlantDiseaseNet using an ensemble method. The classification task was accomplished using deep learning architectures such as AlexNet, GoogLeNet, ResNet-18, ResNet-50, ResNet-l01, and DenseNet-201 and a traditional machine learning classifier, SVM. The input dataset contained a total of 15 distinct classes and 4,447 images. The system displayed an accuracy of 97.56%. The issue with the system was that the feature length was too high, leading to high computation [27]. Picon et al. designed three types of convolutional neural networks for massive multi-crop plant disease classification. The images for the dataset were captured using a mobile phone. The proposed approach integrated the contextual non-image meta-data, such as crop information, with an image-based CNN. The dataset contained 17 different types of diseases and 5 types of crops. The architecture of ResNet-50 DNN inspired the system. The approach managed to achieve 98% of accuracy. The system failed to integrate a promised feature in the network, i.e., multiplicative suppression [28].
Shin et al. created a DNN for detecting powdery mildew disease in the strawberry plant. The dataset contained 1,450 RGB images of strawberry plant leaves. The low amount of dataset created an over-fitting issue, which was overcome using data augmentation operations with eight types of rotations. Six types of deep learning architectures were used for evaluation, i.e., SqueezeNet-MOD1, SqueezeNet-MOD2, AlexNet, GoogLeNet, SqueezeNet, and ResNet-50. The system could achieve 98.11% accuracy. The dataset was created in a controlled environment, hence the system could not overcome real-life complexities, such as variations in lighting conditions [29]. Li proposed an approach based on deep learning for classifying disease severity in the Ginkgo plant. Three labels were given to the images of the dataset – healthy, mild, and severe. A total of 1,322 images were captured under laboratory conditions which were used to create 15,670 images using data augmentation. Similarly, 2,408 Ginkgo plant leaf images were clicked under field conditions that were used to create 15,670 more images with data augmentation. Two deep learning architectures, VGG16 and Inception V3, were integrated for the classification task. The system could achieve 98.44% accuracy. The approach showed significantly less accuracy for the classification of field images [30].
The main challenges in this field of research include difficulties in detecting different diseases showing similar symptoms on the images of the leaves, and detecting the diseases from the images with different lightening conditions, i.e., images not captured in a controlled environment but natural conditions. In this research, various experiments were performed to overpower current systems’ limitations and make the system more practical to implement.
The critical contribution of this work is four-fold and embodies as follows:
Incorporated residual attention learning for the task of disease identification.
Obtained high accuracy with publicly available standard datasets.
The system can distinguish between 4 different crops and 20 different classes.
The rest of this work is organized as follows: Section 2 contains the illustration and explanation of the research methodology, including the architecture followed by the various composite units of the proposed approach. The description of the datasets, the specifications of the system used for experiments, and the details of evaluation metrics are contained in Section 3. Section 4 consists of the details about the experimental and parameter setup, observed results from various experiments and the performance comparison of the various models used and current models for disease identification. Section 5 gives the conclusion.
2 Research methodology
In this section, the architecture of the proposed technique is illustrated, and the related concepts are discussed in detail.
2.1 Architecture
The proposed architecture is based on the ResNet-18 network. The Attention mechanism is integrated into ResNet-18 architecture and a novel deep neural network (DNN) is developed. The attention modules are placed after every residual unit of ResNet-18. The attention mechanism blends the local and global information and learns the discriminative feature for classification [31]. The proposed architecture for plant disease identification is inspired by the Residual Attention (Res-ATTEN) network introduced in a previous study [32] and uses Attention-56 Network, as shown in Figure 1.

Architecture of the proposed approach for plant disease identification.
The architecture is structured by assembling various attention modules, which is an application of a special kind of attention, i.e., mixed attention (a fusion of spatial and channel attention) which makes the architecture capable of capturing different kinds of attention from the attention modules. A direct stacking up of attention modules might lead to a decline in the system’s performance. So, to avoid this issue, Res-ATTEN network came into the picture, which imitates the bottom-up fast feedforward process and top-down attention feedback in a single feedforward process that permits the creation of an end-to-end network that can be trained with top-down attention.
The first layer of the plant disease identification architecture denotes the input layer, which acquires an image with an input size of
The residual unit is followed by an attention module, attention module stage1 producing an output of
2.2 Residual learning units
The increase in the depth of the architectures leads to a saturation in the system accuracy. Eventually, it degrades at a point. This problem is known as the degradation problem. The degradation problem can be avoided by creating shallower architectures in combination with their deeper counterparts which contain the identity mappings copied from the layers of already learned shallower architecture, as illustrated in Figure 2. The desired residual mappings can be denoted as

Residual learning block.
The original mapping can be re-casted as in equation (2).
The residual networks show tremendous results and better accuracy even in deeper networks [23], which shows that optimizing the residual mapping is much easier than optimizing the original or unreferenced mappings. Therefore, it was observed that it was easier to optimize residual networks than their counterparts, i.e., the plain networks since there is an increase in training error with an increase in depth.
2.3 Residual attention learning
Residual learning is combined with the attention mechanism, which developed the concept of the Res-ATTEN network. The mixed type of attention is used in the attention modules. The attention modules contain the residual units, convolutional layers, interpolation layers, and sigmoid function, as shown in Figures 3–5.
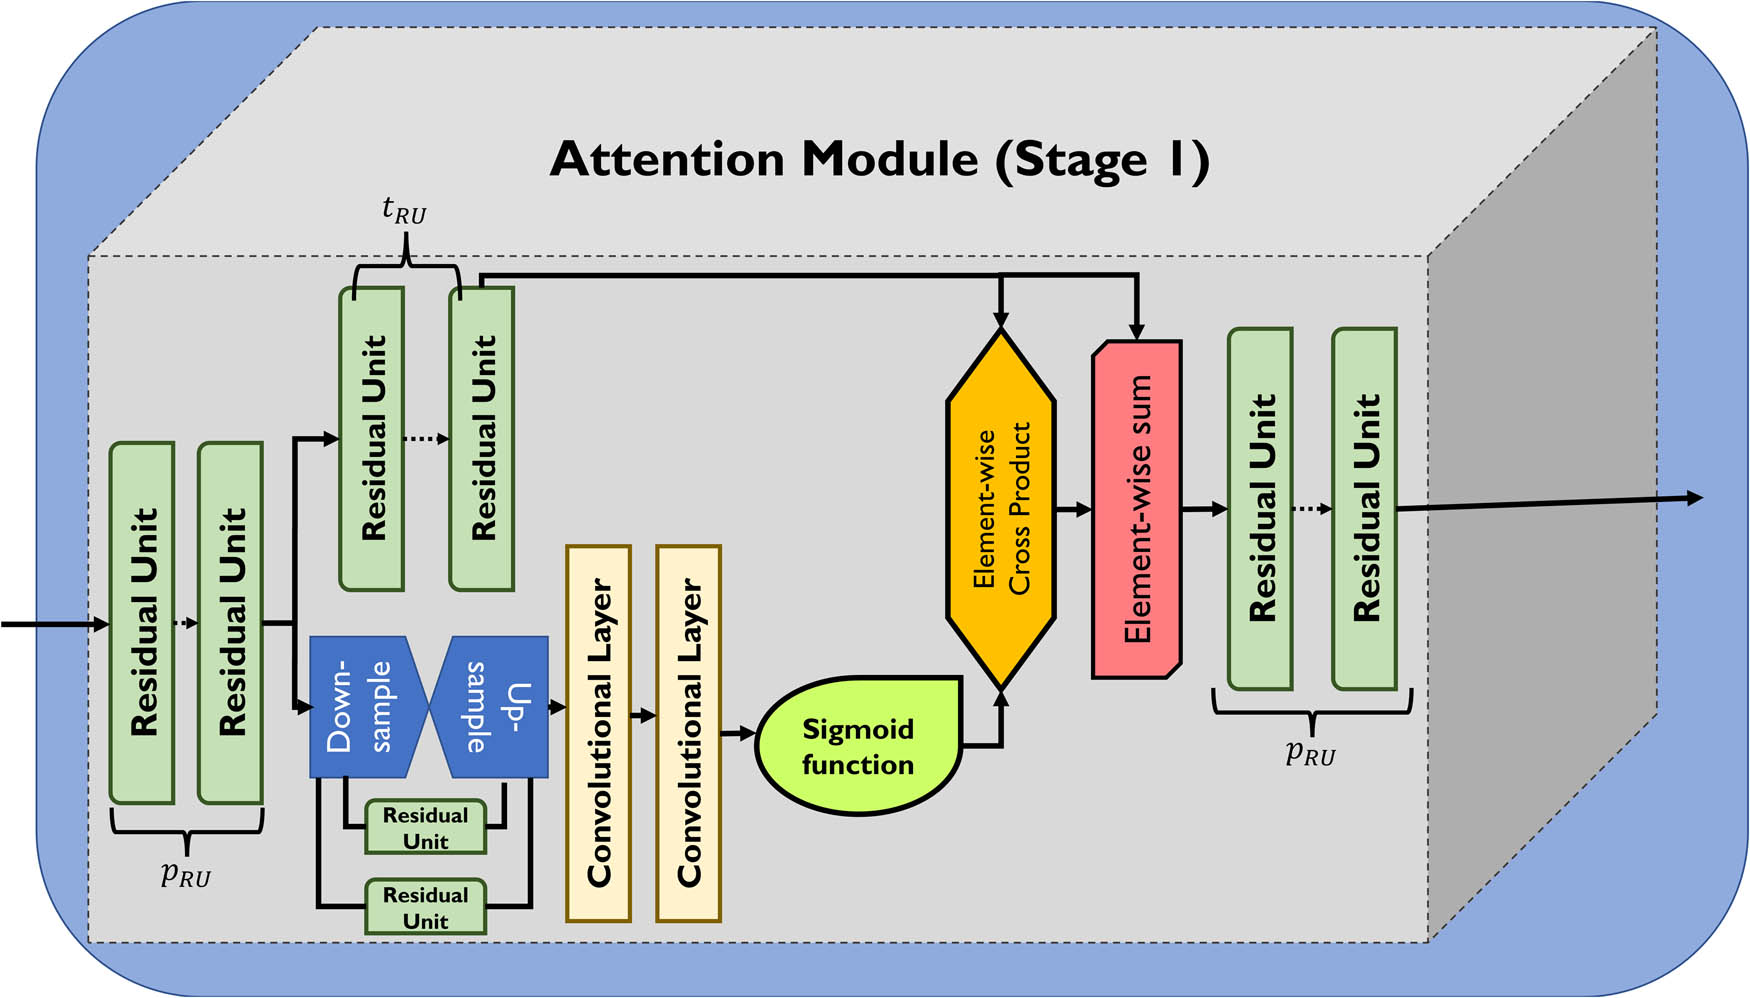
Attention module (stage 1).

Attention module (stage 2).

Attention module (stage 3).
The attention modules employed in the proposed architecture contain two types of branches (1) Trunk branch (Tk) and (2) Soft mask branch (Mk), as shown in Figure 6. The output of attention module

Attention module: soft mask branch and trunk branch.
where
where the range
Trunk branch:
The trunk branch contains the operations which perform the feature extraction tasks. The soft mask branch imitates the fast feedforward and feedback attention process and employs the bottom-up and top-down structures to acquire a mask
Soft mask branch: The soft mask branch comprises two operations – the first is the fast feedforward sweep that accumulates the global information from the entire image and the second is the top-down feedback process which interfuses the global information with the original feature maps.
The up-sampling of output is performed using linear interpolation layers after the processing from some residual units. The input coming from the previous layers gets entered into attention modules. After the processing in few residual unit, the max pooling operation is performed on the inputs numerous times for increasing the size of the receptive field rapidly. The global information expands by the help of a top-down architecture which is symmetrical in nature, as soon as the lowest resolution approaches. This process was intended to guide the input features in each position. After that, to ensure the output size is same as the input feature maps, the number of bilinear operations was kept the same as the number of max pooling layers.
The output then gets normalized using a sigmoid function as in mixed attention, there are no additional restrictions. It uses a simple sigmoid function, as illustrated in Figure 7, for each channel and spatial position. The function for the mixed type of attention is as in equation (5).
where

Attention module: soft mask branch.
The element-wise cross-product of the output from the soft mask branch and the trunk branch was done. The output of this process was then summed up (element-wise) with the output of the trunk branch and further passed from the residual units. The output was passed from an average pooling layer to the fully connected layer, where the classification label gets generated. The number of pre-processing residual units is denoted as
3 Datasets, system specifications, and evaluation metrics
This section provides details about the datasets used for disease identification and the specifications of the system employed for the experiments.
3.1 Datasets for disease identification
The experiments for the disease identification task employed four datasets from two different databases, i.e., PlantVillage Database and Rice Disease Database, as illustrated in Figure 8.

Sample images from the datasets for disease identification.
Apple, corn, and grape datasets are taken from the PlantVillage database [33]. Each dataset contains the leaf images of the mentioned plants. All the images are in jpeg format and have a resolution of
Details of dataset for disease identification
| Dataset name | Plant | No. of classes | No. of total images | Format | Resolution |
|---|---|---|---|---|---|
| PlantVillage | Apple | 4 | 3,171 | .jpeg |
|
| Corn | 4 | 3,852 | .jpeg |
|
|
| Grape | 4 | 4,062 | .jpeg |
|
|
| Rice leaf disease dataset | Rice | 4 | 5,932 | .jpeg |
|
The datasets are structured in the following manner: the first type of leaf images are the plant's healthy leaf images without any visible disease symptoms. The rest of the images are distributed as three different kinds of diseases. The apple dataset contains three types of diseases: apple scab (630 images), black rot (621 images), and cedar rust (275 images), along with healthy leaf images (1,645 images). Similarly, the corn dataset consisted of three types of diseases: Cercospora leaf spot (513 images), common rust (1,192 images), and northern leaf blight (985 images), along with healthy leaf images (1,162 images). The grape dataset has three types of diseases: black measles (1,383 images), black rot (1,180 images), and Isariopsis leaf spot, along with healthy leaf images (423 images).
The Rice leaf disease dataset is the second database used for disease identification [34]. There are a total of 5,932 images contained in this dataset. The images are captured in the rice crop fields and have four types of diseases, i.e., rice tungro (1,308 images), brown spot (1,600 images), rice blast (1,440 images), and bacterial blight (1,584 images). All the Rice leaf disease dataset images are in jpeg format with a resolution of
3.2 System specifications
A Lenovo Legion 64-bit system with a 4GB NVIDIA Geforce GTX 1650 graphical processing unit (GPU) is employed for performing the experiments and obtaining the results. The system possessed an Intel(R) Core (TM) i5-9300H CPU with a clock speed of 2.40 GHz and 16 GB RAM.
3.3 Evaluation metrics
The testing accuracy has been used as an evaluation metric for the performance comparison of the classification models. The accuracy signifies the number of correct predictions the model provides over the total number of predictions [35]. The method to compute the accuracy of the model is as follows:
where
4 Experiments and results
This section discusses the experimental setup and results from various experiments, along with the performance comparison of DNN models.
4.1 Experimental setup for experiments
The four ResNets, ResNet-18, ResNet-50, ResNet-101, and Res-ATTEN, were employed for the classification task in disease identification. The mini-batch size was kept to eight to adapt to the system. The datasets were split into the ratio of 80:10:10, i.e., 80% of the data was employed for training purposes, 10% was used for validation purposes, and the rest of the 10% of data from each dataset was kept aside for testing purposes. ADAM optimizer and Cross entropy are chosen for computing loss function. The execution environment was set to be on GPU. The parameter setup is encapsulated in Table 2.
Parameter setup for experiments
| Parameter | Value |
|---|---|
| Mini batch size | 8 |
| Data split | 80:10:10 |
| Loss function | Cross entropy |
| Optimizer | ADAM |
| Execution environment | GPU |
A learning rate (LR) scheduler was incorporated, which declines the value of the learning rate of each parameter group by a value known as gamma after every epoch [36]. This scheduler helps the DNN to determine the optimal LR for minimizing the loss in the network. For every five epochs (i.e., setting step size = 5), the learning rate will decay by half (i.e., gamma = 0.5). For example, if the initial LR was 0.01, then after five epochs, the learning rate value will be 0.01 divided by 0.5, which is 0.02.
4.1.1 Data augmentation
There are cases of image classification in machine learning problems where the data in classes are not uniformly available, which causes an issue known as over-fitting. So, to avoid this issue, a technique, namely, data augmentation, is employed for composing a dataset where each class contains an almost equal number of images [37]. Various operations, such as cropping an area from the original image, translation, rotation, and flipping, are applied to the original images, and new images are created [38]. In this work, the following operations are performed to virtually enlarge the datasets to avoid the issue mentioned above, with mentioned parameter values, as shown in Table 3.
Operations on images for data augmentation
| Operations | Values/range |
|---|---|
| Rotation |
|
| Scaling |
|
| Shear |
|
| Horizontally flip |
|
The random rotation operations are performed within a range of
4.2 Performance comparison of DNNs with Res-ATTEN for disease identification
Three types of experiments were performed on all datasets. Four types of DNNs, i.e., ResNet-18, ResNet-50, ResNet-101, and Res-ATTEN, are employed to compute the testing accuracy of the system, and a performance comparison between the DNNs was made accordingly. The LRs varied for the experiments in the following manner: 1st experiment with LR = 0.1, 2nd experiment with LR = 0.001, and 3rd experiment with LR = 0.0001. The performance comparison between the DNNs is made according to the highest testing accuracy. All three LRs are compared, and the best testing accuracy providing DNN was selected. The experiments on DNNs are run on categories, i.e., Epochs = 10 and 25. Various optimizing experiments select the optimal number of epochs to get the best accuracy.
4.2.1 Performance on PlantVillage (apple) dataset
The results of the experiments performed on PlantVillage (apple) dataset for the identification of the labels/classes: healthy, scab, black rot, and cedar rust are encapsulated in Table 4.
Performance comparison of DNNs with Res-ATTEN for disease identification for PlantVillage (apple)
| Testing accuracy (%): PlantVillage – apple | ||||
|---|---|---|---|---|
| Batch size = 8, optimizer step size = 5, gamma = 0.5 | ||||
| DNN/testing accuracy | LR = 0.01 | LR = 0.001 | LR = 0.0001 | |
| ResNet-18 | Epochs = 10 | 95 | 94 | 90 |
| Epochs = 25 | 92 | 92 | 93 | |
| ResNet-50 | Epochs = 10 | 86 | 95 | 87 |
| Epochs = 25 | 95 | 95 | 90 | |
| ResNet-101 | Epochs = 10 | 90 | 93 | 89 |
| Epochs = 25 | 95 | 94 | 93 | |
| Res-ATTEN | Epochs = 10 | 90 | 93 | 96 |
| Epochs = 25 | 96 | 99 | 97 | |
The results show that the highest accuracy for PlantVillage (apple) dataset with ResNet-18 is LR = 0.01 with 95% at 10epochs. The highest accuracy ResNet-50 showed was 95% with LR = 0.01 at 10 epochs and LR = 0.001 at 10 and 25 epochs. The ResNet-101 DNN provided the highest accuracy of 95% with LR = 0.01 at 25 epochs, as illustrated in Figure 9. In comparison with all the DNNs, the proposed Res-ATTEN-based approach produced the highest accuracy of 99% with LR = 0.001 at 25epochs.

Graphs showing the comparison of testing accuracy among DNNs at (a) LR = 0.01, (b) LR = 0.001, and (c) LR = 0.0001 for PlantVillage (apple) dataset.
4.2.2 Performance on PlantVillage (corn) dataset
The results of the experiments performed on the PlantVillage (corn) dataset for the identification of the labels/classes: healthy, leaf spot, common, rust, and northern leaf blight, are encapsulated in Table 5.
Performance comparison of DNNs with Res-ATTEN for disease identification for PlantVillage (corn)
| Testing accuracy (%): PlantVillage – corn | ||||
|---|---|---|---|---|
| Batch size = 8, optimizer step size = 5, gamma = 0.5 | ||||
| LR = 0.01 | DNN/testing accuracy | LR = 0.001 | LR = 0.0001 | |
| ResNet-18 | Epochs = 10 | 83 | 86 | 87 |
| Epochs = 25 | 88 | 89 | 83 | |
| ResNet-50 | Epochs = 10 | 85 | 89 | 90 |
| Epochs = 25 | 90 | 90 | 89 | |
| ResNet-101 | Epochs = 10 | 84 | 87 | 87 |
| Epochs = 25 | 92 | 90 | 90 | |
| Res-ATTEN | Epochs = 10 | 83 | 89 | 94 |
| Epochs = 25 | 93 | 92 | 94 | |
The results showed that the highest accuracy for PlantVillage (corn) dataset with ResNet-18 is 89% with LR = 0.001 at 25 epochs. The highest accuracy ResNet-50 showed is 90% with LR = 0.01 at 25 epochs, LR = 0.001 at 25 epochs, and LR = 0.0001 at 10 epochs. The ResNet-101 DNN provided the highest accuracy of 92% with LR = 0.01 at 25 epochs, as illustrated in Figure 10. In comparison with all the DNNs, the proposed Res-ATTEN-based approach produced the highest accuracy of 94% with LR = 0.0001 at 25 epochs.

Graphs showing the comparison of testing accuracy among DNNs at (a) LR = 0.01, (b) LR = 0.001, and (c). LR = 0.0001 for PlantVillage (corn) dataset.
4.2.3 Performance on PlantVillage (grape) dataset
The results of the experiments performed on the PlantVillage (grape) dataset for the identification of the labels/classes: healthy, black rot, black measles, and leaf spot are encapsulated in Table 6.
Performance comparison of DNNs with Res-ATTEN for disease identification for PlantVillage (grape)
| Testing accuracy (%): PlantVillage – grape | ||||
|---|---|---|---|---|
| Batch size = 8, optimizer step size = 5, gamma = 0.5 | ||||
| DNN/testing accuracy | LR = 0.01 | LR = 0.001 | LR = 0.0001 | |
| ResNet-18 | Epochs = 10 | 93 | 94 | 89 |
| Epochs = 25 | 93 | 88 | 90 | |
| ResNet-50 | Epochs = 10 | 84 | 90 | 90 |
| Epochs = 25 | 94 | 91 | 89 | |
| ResNet-101 | Epochs = 10 | 93 | 92 | 93 |
| Epochs = 25 | 93 | 92 | 94 | |
| Res-ATTEN | Epochs = 10 | 83 | 88 | 96 |
| Epochs = 25 | 96 | 95 | 97 | |
The results showed that the highest accuracy for PlantVillage (grape) dataset with ResNet18 is LR = 0.001 with 94% at 10 epochs. The highest accuracy ResNet-50 showed is 94% with LR = 0.01 at 25 epochs. The ResNet-101 DNN provided the highest accuracy of 92% with LR = 0.01 at 25 epochs, as illustrated in Figure 11. In comparison with all the DNNs, the proposed Res-ATTEN-based approach produced the highest accuracy of 97% with LR = 0.0001 at 25 epochs.
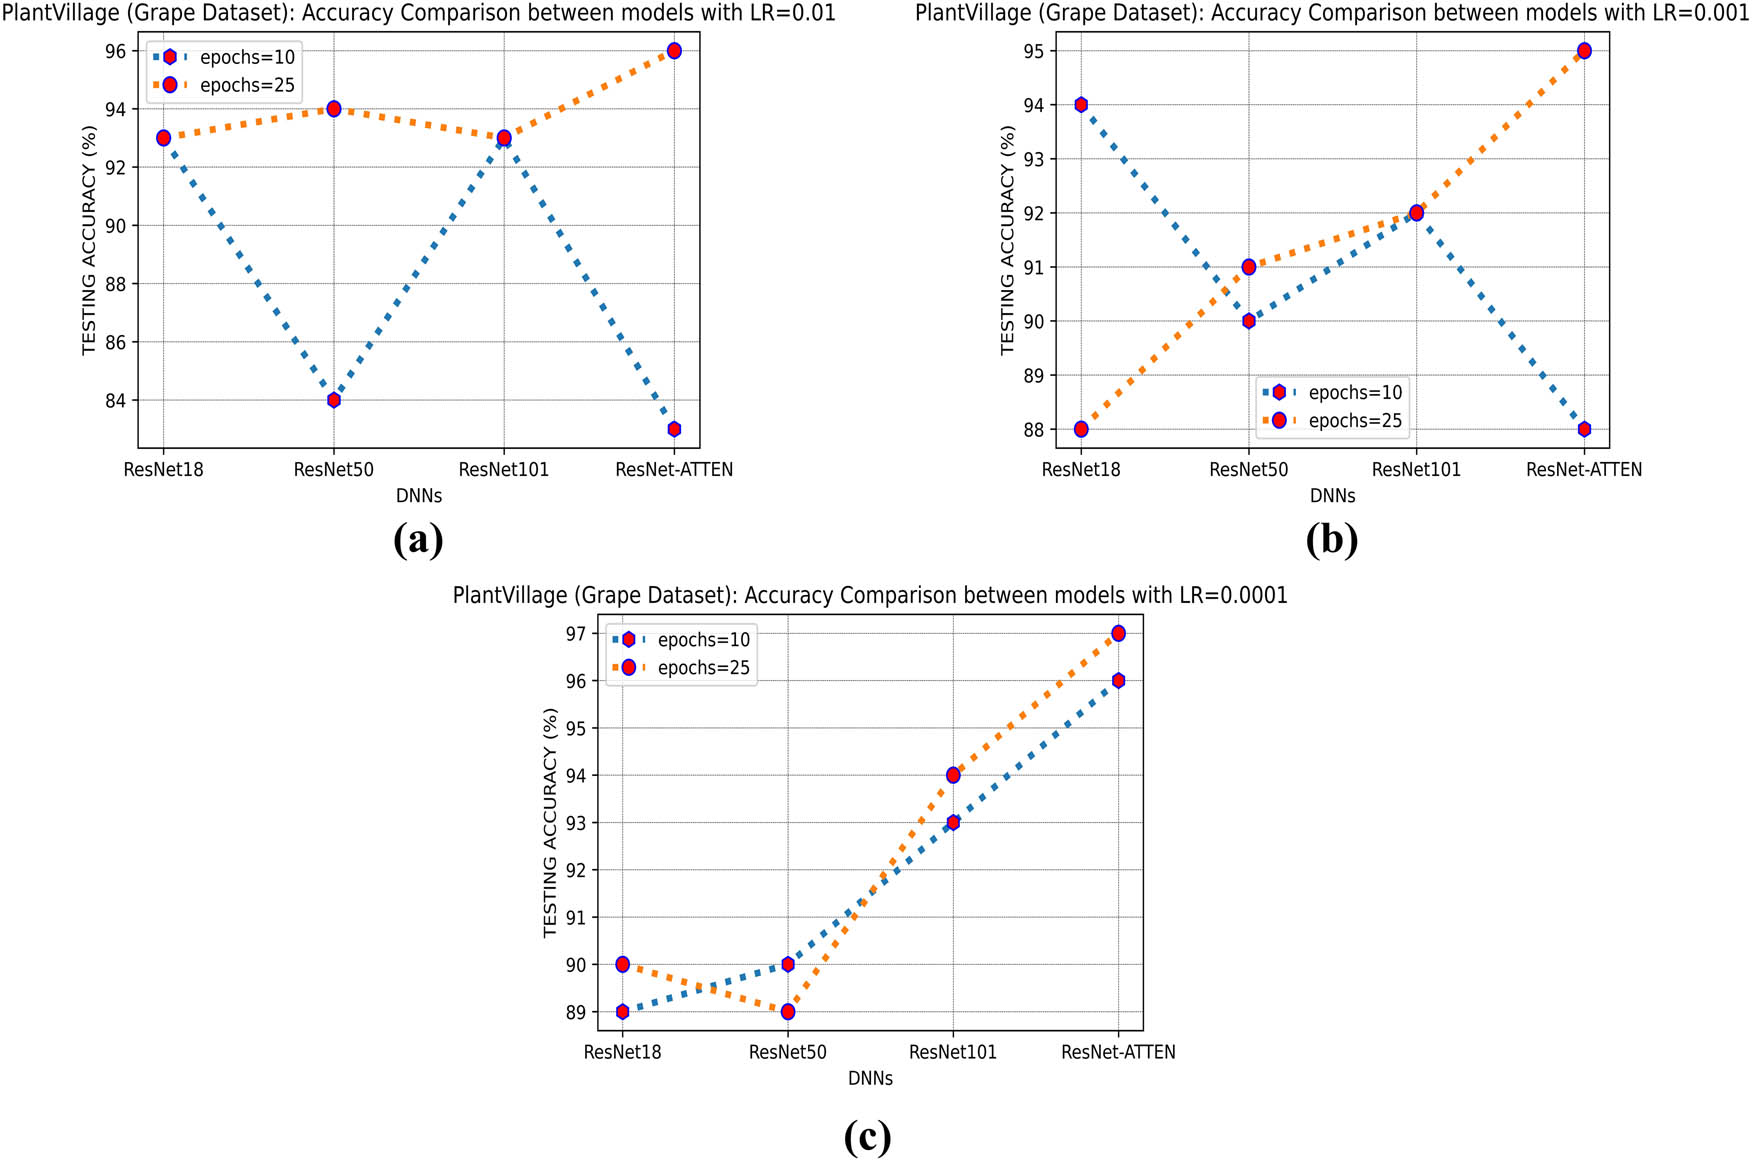
Graphs showing the comparison of testing accuracy among DNNs at (a) LR = 0.01, (b) LR = 0.001, and (c) LR = 0.0001 for PlantVillage (grape) dataset.
4.2.4 Performance on Rice leaf disease dataset
The results for the experiments performed on the Rice leaf disease dataset for the identification of the labels/classes: Tungro, Brown Spot, Blast, and bacterial leaf blight, are encapsulated in Table 7.
Performance comparison of DNNs with Res-ATTEN for disease identification for Rice leaf disease dataset
| Testing accuracy (%): Rice leaf disease dataset | ||||
|---|---|---|---|---|
| Batch size = 8, optimizer step size = 5, gamma = 0.5 | ||||
| DNN/testing accuracy | LR = 0.01 | LR = 0.001 | LR = 0.0001 | |
| ResNet-18 | Epochs = 10 | 84 | 87 | 82 |
| Epochs = 25 | 87 | 87 | 84 | |
| ResNet-50 | Epochs = 10 | 88 | 89 | 88 |
| Epochs = 25 | 92 | 92 | 78 | |
| ResNet-101 | Epochs = 10 | 88 | 88 | 86 |
| Epochs = 25 | 90 | 90 | 88 | |
| Res-ATTEN | Epochs = 10 | 92 | 94 | 97 |
| Epochs = 25 | 98 | 99 | 99 | |
The results showed that the highest accuracy for Rice leaf disease dataset with ResNet-18 is 87%, with LR = 0.01 at 25 epochs and LR = 0.001 at 10 and 25 epochs. The highest accuracy ResNet-50 showed was 92% with LR = 0.01 and LR = 0.001 at 25 epochs. The ResNet-101 DNN provided the highest accuracy of 90% with LR = 0.01 and LR = 0.001 at 25 epochs, as illustrated in Figure 12. In comparison with all the DNNs, the proposed Res-ATTEN-based approach produced the highest accuracy of 99% with LR = 0.001 and LR = 0.0001 at 25 epochs.

Graphs show the testing accuracy comparison among DNNs at (a) LR = 0.01, (b) LR = 0.001, and (c) LR = 0.0001 for Rice leaf disease dataset.
The overall highest testing accuracy achieved by each dataset at each DNN for the disease identification task is as follows: for PlantVillage (apple) dataset – 95% with ResNet-18, ResNet-50, and ResNet-101 and 99% with Res-ATTEN. For PlantVillage (corn) – 89% with ResNet-18, 90% with ResNet-50, 92% with ResNet-101, and 94% with Res-ATTEN. For PlantVillage (grape) – 94% with ResNet-18, ResNet-50, and ResNe-t101 and 97% with Res-ATTEN. For Rice leaf disease dataset – 87% with ResNet-18, 92% with ResNet-50, 90% with ResNet-101, and 99% with Res-ATTEN, as encapsulated in Table 8, and illustrated in Figure 13.
Overall highest testing accuracy achieved by each dataset at each DNN
| Datasets | Crop | Highest testing accuracy achieved (%) | |||
|---|---|---|---|---|---|
| ResNet-18 | ResNet-50 | ResNet-101 | Res-ATTEN | ||
| PlantVillage | Apple | 95 | 95 | 95 | 99 |
| Corn | 89 | 90 | 92 | 94 | |
| Grape | 94 | 94 | 94 | 97 | |
| Rice leaf disease | Rice | 87 | 92 | 90 | 99 |
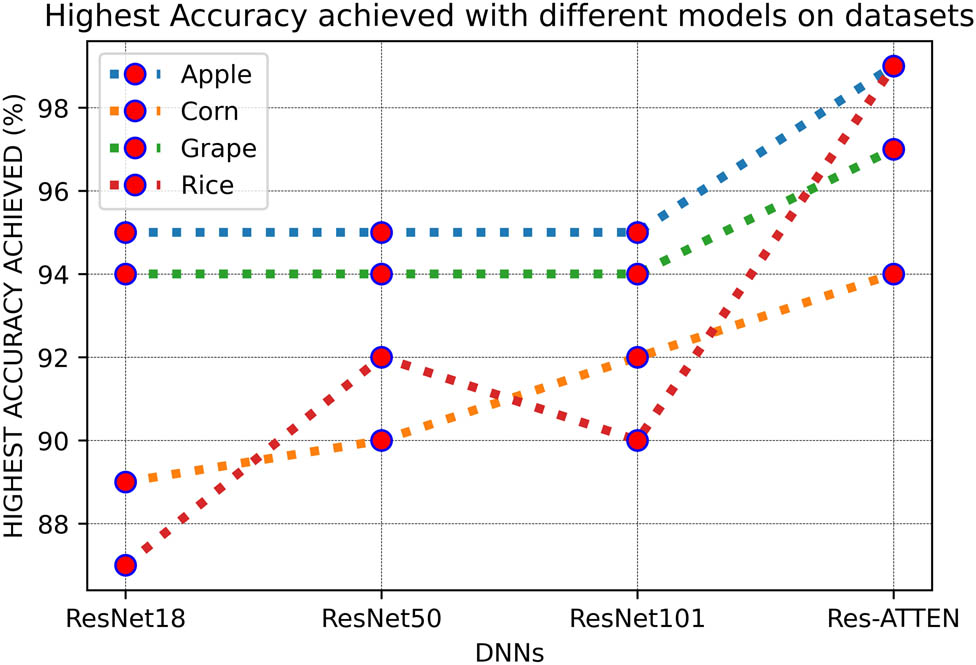
Highest accuracy achieved by datasets with different DNNs.
It was observed that the Res-ATTEN-based plant disease identification system provided the highest accuracy for every dataset compared to other ResNets.
4.2.5 Performance comparison of the proposed approach with traditional approaches
The performance metric for comparing the traditional and proposed approaches was chosen to be accuracy. Various researchers implemented the traditional approaches for plant disease and observed the accuracy as high as 88.46, 89.5, 90, 93.62, 93.67, 94.2996.46, 96.88, 97.47, 97.56, 98, 98.11, and 98.44%, as shown in Table 9. The proposed approach performed well with even small training data and provided the highest accuracy of 99%, as illustrated in Figure 14.
Accuracy comparison between traditional approaches and the proposed approach
| Approaches | Accuracy (%) |
|---|---|
| Mishra et al. [18] | 88.46 |
| Sujatha et al. [19] | 89.5 |
| Argüeso et al. [20] | 90 |
| Yin et al. [21] | 93.62 |
| Arsenovic et al. [22] | 93.67 |
| Wu et al. [23] | 94.29 |
| Geetharamani and Arun Pandian [24] | 96.46 |
| Gajjar et al. [25] | 96.88 |
| Thenmozhi and Srinivasulu [26] | 97.47 |
| Turkoglu et al. [27] | 97.56 |
| Picon et al. [28] | 98 |
| Shin et al. [29] | 98.11 |
| Li et al. [30] | 98.44 |
| Proposed approach | 99 |

Comparison of the proposed approach with traditional approaches.
5 Conclusion
The proposed technique for disease identification from the healthy/diseased plant leaf Images was based on the Residual-Attention Learning Network. The research was performed on PlantVillage Database (apple, corn, and grape datasets) and Rice leaf disease dataset. Four types of ResNets, i.e., ResNet-18, ResNet-50, ResNet-101, and a unique Res-ATTEN network (a combination of residual network with attention learning), were employed to compute the accuracy for disease identification. The testing accuracy of the system was set to be a parameter to judge the best model out of all the ResNets. Various experiments were performed with parameters such as epochs and LRs, and performance comparison was made among all four ResNets. The developed technique handled large datasets very efficiently and provided the highest accuracy in every experiment. It provided a very prominent accuracy with the standard datasets. The system achieved the highest accuracy of 99% and performed well than the existing ResNet-based approaches for plant disease identification systems.
Acknowledgements
The authors express their gratitude towards the Guru Gobind Singh Indraprastha University Delhi, India, for the opportunity to do this research. The work involves the thesis work by the first author.
-
Funding information: The first author wholeheartedly thanks University Grants Commission, India, for providing the UGC-Junior Research Fellowship and Guru Gobind Singh Indraprastha University Delhi for providing the environment for pursuing the research.
-
Author contributions: Kirti has conceptualized the whole proposed approach, executed the architecture, collected and concluded the results. Navin Rajpal has validated the concept of approach, analyzed the results & methodology. Also, he audited the whole architecture of the approach and the results.
-
Conflict of interest: The authors declare no conflict of interest.
-
Compliance with ethical standards: This article is entirely an original work of its authors; it has not been published before and will not be sent to other publications until the JISYS editorial board decides not to accept it for publication.
References
[1] Vurro M, Bonciani B, Vannacci G. Emerging infectious diseases of crop plants in developing countries: Impact on agriculture and socio-economic consequences. Food Security. 2010;2(2):113–32. 10.1007/s12571-010-0062-7.Search in Google Scholar
[2] Richard B, Qi A, Fitt BDL. Control of crop diseases through Integrated Crop Management to deliver climate-smart farming systems for low- and high-input crop production. Plant Pathol. Jan. 2022;71(1):187–206. 10.1111/PPA.13493.Search in Google Scholar
[3] Zhang F and Fu LS. Application of computer vision technology in agricultural field. Appl Mech Mater. 2014;462–463:72–6. 10.4028/WWW.SCIENTIFIC.NET/AMM.462-463.72.Search in Google Scholar
[4] Kirti, Rajpal N. Black rot disease detection in grape plant (vitis vinifera) using colour based segmentation machine learning. In Proceedings - IEEE 2020 2nd International Conference on Advances in Computing, Communication Control and Networking, ICACCCN 2020; Dec. 2020. p. 976–9. 10.1109/ICACCCN51052.2020.9362812.Search in Google Scholar
[5] Kirti N, Rajpal, Arora M. Comparison of texture based feature extraction techniques for detecting leaf scorch in strawberry plant (Fragaria × Ananassa). In Lecture Notes in Electrical Engineering. Singapore: Springer. vol. 698; 2021. p. 659–70. 10.1007/978-981-15-7961-5_63.Search in Google Scholar
[6] Kirti K, Rajpal N, Yadav J. Black Measles Disease Identification in Grape Plant (Vitis vinifera) Using Deep Learning. In 2021 International Conference on Computing, Communication, and Intelligent Systems (ICCCIS); Feb. 2021. p. 97–101. 10.1109/ICCCIS51004.2021.9397205.Search in Google Scholar
[7] KK, Rajpal N, Yadav J, Mondal KK. Multi-resolution analysis and deep neural network architecture based hybrid feature extraction technique for plant disease identification and severity estimation. Evol Intell. Dec. 2022;1–21. 10.1007/S12065-022-00800-4.Search in Google Scholar
[8] Kirti, Rajpal N, Yadav J. A novel DWT and deep learning based feature extraction technique for plant disease identification. Singapore: Springer. 2022. p. 355–67. 10.1007/978-981-16-3346-1_29.Search in Google Scholar
[9] Nayak SC, Ansari MD. COA-HONN: Cooperative optimization algorithm based higher order neural networks for stock forecasting. Recent Adv Comput Sci Commun. Sep. 2019;14(7):2376–92. 10.2174/2213275912666190902121153.Search in Google Scholar
[10] Goel AK, Chakraborty R, Agarwal M, Ansari MD, Gupta SK, Garg D. Profit or Loss: A long short term memory based model for the prediction of share price of DLF group in India. Proc. 2019 IEEE 9th International Conference Advanced Computing IACC 2019; Dec. 2019. p. 120–4. 10.1109/IACC48062.2019.8971601.Search in Google Scholar
[11] Bhat SS, Selvam V, Ansari GA, Ansari MD, Rahman MH. Prevalence and early prediction of diabetes using machine learning in North Kashmir: A case study of district Bandipora. Comput Intell Neurosci. 2022;2022:1–12. 10.1155/2022/2789760.Search in Google Scholar
[12] Ting L, Khan M, Sharma A, Ansari MD. A secure framework for IoT-based smart climate agriculture system: Toward blockchain and edge computing. J Intell Syst. Jan. 2022;31(1):221–36. 10.1515/JISYS-2022-0012/MACHINEREADABLECITATION/RIS.Search in Google Scholar
[13] Gaddam DKR, Ansari MD, Vuppala S. On sudoku problem using deep learning and image processing technique. Lect Notes Electr Eng. 2021;698:1405–17. 10.1007/978-981-15-7961-5_128/COVER.Search in Google Scholar
[14] Jaiswal A, Krishnama Raju A, Deb S. Facial emotion detection using deep learning. 2020 International Conference for Emerging Technology INCET 2020; Jun. 2020. 10.1109/INCET49848.2020.9154121.Search in Google Scholar
[15] Gaddam DKR, Ansari MD, Vuppala S, Gunjan VK, Sati MM. A performance comparison of optimization algorithms on a generated dataset. Lect Notes Electr Eng. 2022;783:1407–15. 10.1007/978-981-16-3690-5_135/COVER.Search in Google Scholar
[16] Gunjan VK, Kumar S, Ansari MD, Vijayalata Y. Prediction of agriculture yields using machine learning algorithms. Lect Notes Netw Syst. 2022;237:17–26. 10.1007/978-981-16-6407-6_2/COVER.Search in Google Scholar
[17] Agarwal M, Bohat VK, Ansari MD, Sinha A, Gupta SK, Garg D. A Convolution Neural Network based approach to detect the disease in Corn Crop. Proc. 2019 IEEE 9th International Conference Advanced Computing IACC 2019; Dec. 2019. p. 176–81. 10.1109/IACC48062.2019.8971602.Search in Google Scholar
[18] Mishra S, Sachan R, Rajpal D. Deep convolutional neural network based detection system for real-time corn plant disease recognition. Procedia Comput Sci. 2020;167:2003–10. 10.1016/j.procs.2020.03.236.Search in Google Scholar
[19] Sujatha R, Chatterjee JM, Jhanjhi NZ, Brohi SN. Performance of deep learning vs machine learning in plant leaf disease detection. Microprocess Microsyst. Feb. 2021;80:1–11. 10.1016/j.micpro.2020.103615.Search in Google Scholar
[20] Argüeso D, Picon A, Irusta U, Medela A, San-Emeterio MG, Bereciartua A, et al. Few-Shot Learning approach for plant disease classification using images taken in the field. Comput Electron Agric. Aug. 2020;175:1–8. 10.1016/j.compag.2020.105542.Search in Google Scholar
[21] Yin H, Gu YH, Park CJ, Park JH, Yoo SJ. Transfer learning-based search model for hot pepper diseases and pests. Agriculture. Oct. 2020;10(10):1–16. 10.3390/agriculture10100439.Search in Google Scholar
[22] Arsenovic M, Karanovic M, Sladojevic S, Anderla A, Stefanovic D. Solving current limitations of deep learning based approaches for plant disease detection. Symmetry (Basel). Jul. 2019;11(7):1–21. 10.3390/sym11070939.Search in Google Scholar
[23] Wu Q, Zhang K, Meng J. Identification of soybean leaf diseases via deep learning. J Inst Eng Ser A. 2019;100(4):659–66. 10.1007/s40030-019-00390-y.Search in Google Scholar
[24] Geetharamani G, Arun Pandian J. Identification of plant leaf diseases using a nine-layer deep convolutional neural network. Comput Electr Eng. Jun. 2019;76:323–38. 10.1016/j.compeleceng.2019.04.011.Search in Google Scholar
[25] Gajjar R, Gajjar N, Thakor VJ, Patel NP, Ruparelia S. Real-time detection and identification of plant leaf diseases using convolutional neural networks on an embedded platform. Vis Comput. 2021;38:2923–38. 10.1007/s00371-021-02164-9.Search in Google Scholar
[26] Thenmozhi K, Srinivasulu Reddy U. Crop pest classification based on deep convolutional neural network and transfer learning. Comput Electron Agric. Sep. 2019;164:1–11. 10.1016/j.compag.2019.104906.Search in Google Scholar
[27] Turkoglu M, Yanikoğlu B, Hanbay D. PlantDiseaseNet: Convolutional neural network ensemble for plant disease and pest detection. Sig Image Video Process. 2021;16:301–9. 10.1007/s11760-021-01909-2.Search in Google Scholar
[28] Picon A, Seitz M, Alvarez-Gila A, Mohnke P, Ortiz-Barredo A, Echazarra J. Crop conditional Convolutional Neural Networks for massive multi-crop plant disease classification over cell phone acquired images taken on real field conditions. Comput Electron Agric. Dec. 2019;167:1–10. 10.1016/j.compag.2019.105093.Search in Google Scholar
[29] Shin J, Chang YK, Heung B, Nguyen-Quang T, Price GW, Al-Mallahi A. A deep learning approach for RGB image-based powdery mildew disease detection on strawberry leaves. Comput Electron Agric. Apr. 2021;183:1–8. 10.1016/j.compag.2021.106042.Search in Google Scholar
[30] Li K, Lin J, Liu J, Zhao Y. Using deep learning for image-based different degrees of ginkgo leaf disease classification. Information. Feb. 2020;11(2):1–15. 10.3390/info11020095.Search in Google Scholar
[31] Guan Q, Huang Y, Zhong Z, Zheng Z, Zheng L, Yang Y. Thorax disease classification with attention guided convolutional neural network. Pattern Recognit Lett. Mar. 2020;131:38–45. 10.1016/j.patrec.2019.11.040.Search in Google Scholar
[32] Wang F. Residual attention network for image classification. In Proceedings - 30th IEEE Conference on Computer Vision and Pattern Recognition, CVPR 2017. 2017(January), Apr. 2017. p. 6450–8. 10.1109/CVPR.2017.683.Search in Google Scholar
[33] “GitHub - spMohanty/PlantVillage-Dataset: Dataset of diseased plant leaf images and corresponding labels.” https://github.com/spMohanty/PlantVillage-Dataset. (accessed Jan. 13, 2021).Search in Google Scholar
[34] Sethy PK, Barpanda NK, Rath AK, Behera SK. Deep feature based rice leaf disease identification using support vector machine. Comput Electron Agric. 2020;175:1–9. 10.1016/j.compag.2020.105527.Search in Google Scholar
[35] Ferri C, Hernández-Orallo J, Modroiu R. An experimental comparison of performance measures for classification. Pattern Recognit Lett. Jan. 2009;30(1):27–38. 10.1016/j.patrec.2008.08.010.Search in Google Scholar
[36] “StepLR — PyTorch 1.10.1 documentation.” https://pytorch.org/docs/stable/generated/torch.optim.lr_scheduler.StepLR.html#torch.optim.lr_scheduler.StepLR(accessed Jan. 06, 2022).Search in Google Scholar
[37] Inoue H. Data augmentation by pairing samples for images classification. arXiv Prepr arXiv180102929; Jan. 2018. [Online]. http://arxiv.org/abs/1801.02929.Search in Google Scholar
[38] Kwasigroch A, Mikołajczyk A, Grochowski M. Deep convolutional neural networks as a decision support tool in medical problems – malignant melanoma case study. In Advances in Intelligent Systems and Computing. Vol. 577. Springer Verlag; 2017. p. 848–56.Search in Google Scholar
© 2023 the author(s), published by De Gruyter
This work is licensed under the Creative Commons Attribution 4.0 International License.
Articles in the same Issue
- Research Articles
- Salp swarm and gray wolf optimizer for improving the efficiency of power supply network in radial distribution systems
- Deep learning in distributed denial-of-service attacks detection method for Internet of Things networks
- On numerical characterizations of the topological reduction of incomplete information systems based on evidence theory
- A novel deep learning-based brain tumor detection using the Bagging ensemble with K-nearest neighbor
- Detecting biased user-product ratings for online products using opinion mining
- Evaluation and analysis of teaching quality of university teachers using machine learning algorithms
- Efficient mutual authentication using Kerberos for resource constraint smart meter in advanced metering infrastructure
- Recognition of English speech – using a deep learning algorithm
- A new method for writer identification based on historical documents
- Intelligent gloves: An IT intervention for deaf-mute people
- Reinforcement learning with Gaussian process regression using variational free energy
- Anti-leakage method of network sensitive information data based on homomorphic encryption
- An intelligent algorithm for fast machine translation of long English sentences
- A lattice-transformer-graph deep learning model for Chinese named entity recognition
- Robot indoor navigation point cloud map generation algorithm based on visual sensing
- Towards a better similarity algorithm for host-based intrusion detection system
- A multiorder feature tracking and explanation strategy for explainable deep learning
- Application study of ant colony algorithm for network data transmission path scheduling optimization
- Data analysis with performance and privacy enhanced classification
- Motion vector steganography algorithm of sports training video integrating with artificial bee colony algorithm and human-centered AI for web applications
- Multi-sensor remote sensing image alignment based on fast algorithms
- Replay attack detection based on deformable convolutional neural network and temporal-frequency attention model
- Validation of machine learning ridge regression models using Monte Carlo, bootstrap, and variations in cross-validation
- Computer technology of multisensor data fusion based on FWA–BP network
- Application of adaptive improved DE algorithm based on multi-angle search rotation crossover strategy in multi-circuit testing optimization
- HWCD: A hybrid approach for image compression using wavelet, encryption using confusion, and decryption using diffusion scheme
- Environmental landscape design and planning system based on computer vision and deep learning
- Wireless sensor node localization algorithm combined with PSO-DFP
- Development of a digital employee rating evaluation system (DERES) based on machine learning algorithms and 360-degree method
- A BiLSTM-attention-based point-of-interest recommendation algorithm
- Development and research of deep neural network fusion computer vision technology
- Face recognition of remote monitoring under the Ipv6 protocol technology of Internet of Things architecture
- Research on the center extraction algorithm of structured light fringe based on an improved gray gravity center method
- Anomaly detection for maritime navigation based on probability density function of error of reconstruction
- A novel hybrid CNN-LSTM approach for assessing StackOverflow post quality
- Integrating k-means clustering algorithm for the symbiotic relationship of aesthetic community spatial science
- Improved kernel density peaks clustering for plant image segmentation applications
- Biomedical event extraction using pre-trained SciBERT
- Sentiment analysis method of consumer comment text based on BERT and hierarchical attention in e-commerce big data environment
- An intelligent decision methodology for triangular Pythagorean fuzzy MADM and applications to college English teaching quality evaluation
- Ensemble of explainable artificial intelligence predictions through discriminate regions: A model to identify COVID-19 from chest X-ray images
- Image feature extraction algorithm based on visual information
- Optimizing genetic prediction: Define-by-run DL approach in DNA sequencing
- Study on recognition and classification of English accents using deep learning algorithms
- Review Articles
- Dimensions of artificial intelligence techniques, blockchain, and cyber security in the Internet of medical things: Opportunities, challenges, and future directions
- A systematic literature review of undiscovered vulnerabilities and tools in smart contract technology
- Special Issue: Trustworthy Artificial Intelligence for Big Data-Driven Research Applications based on Internet of Everythings
- Deep learning for content-based image retrieval in FHE algorithms
- Improving binary crow search algorithm for feature selection
- Enhancement of K-means clustering in big data based on equilibrium optimizer algorithm
- A study on predicting crime rates through machine learning and data mining using text
- Deep learning models for multilabel ECG abnormalities classification: A comparative study using TPE optimization
- Predicting medicine demand using deep learning techniques: A review
- A novel distance vector hop localization method for wireless sensor networks
- Development of an intelligent controller for sports training system based on FPGA
- Analyzing SQL payloads using logistic regression in a big data environment
- Classifying cuneiform symbols using machine learning algorithms with unigram features on a balanced dataset
- Waste material classification using performance evaluation of deep learning models
- A deep neural network model for paternity testing based on 15-loci STR for Iraqi families
- AttentionPose: Attention-driven end-to-end model for precise 6D pose estimation
- The impact of innovation and digitalization on the quality of higher education: A study of selected universities in Uzbekistan
- A transfer learning approach for the classification of liver cancer
- Review of iris segmentation and recognition using deep learning to improve biometric application
- Special Issue: Intelligent Robotics for Smart Cities
- Accurate and real-time object detection in crowded indoor spaces based on the fusion of DBSCAN algorithm and improved YOLOv4-tiny network
- CMOR motion planning and accuracy control for heavy-duty robots
- Smart robots’ virus defense using data mining technology
- Broadcast speech recognition and control system based on Internet of Things sensors for smart cities
- Special Issue on International Conference on Computing Communication & Informatics 2022
- Intelligent control system for industrial robots based on multi-source data fusion
- Construction pit deformation measurement technology based on neural network algorithm
- Intelligent financial decision support system based on big data
- Design model-free adaptive PID controller based on lazy learning algorithm
- Intelligent medical IoT health monitoring system based on VR and wearable devices
- Feature extraction algorithm of anti-jamming cyclic frequency of electronic communication signal
- Intelligent auditing techniques for enterprise finance
- Improvement of predictive control algorithm based on fuzzy fractional order PID
- Multilevel thresholding image segmentation algorithm based on Mumford–Shah model
- Special Issue: Current IoT Trends, Issues, and Future Potential Using AI & Machine Learning Techniques
- Automatic adaptive weighted fusion of features-based approach for plant disease identification
- A multi-crop disease identification approach based on residual attention learning
- Aspect-based sentiment analysis on multi-domain reviews through word embedding
- RES-KELM fusion model based on non-iterative deterministic learning classifier for classification of Covid19 chest X-ray images
- A review of small object and movement detection based loss function and optimized technique