RES-KELM fusion model based on non-iterative deterministic learning classifier for classification of Covid19 chest X-ray images
-
Arshi Husain
 and
Virendra P. Vishvakarma
and
Virendra P. Vishvakarma

Abstract
In this research, a novel real time approach has been proposed for detection and analysis of Covid19 using chest X-ray images based on a non-iterative deterministic classifier, kernel extreme learning machine (KELM), and a pretrained network ResNet50. The information extraction capability of deep learning and non-iterative deterministic training nature of KELM has been incorporated in the proposed novel fusion model. The binary classification is carried out with a non-iterative deterministic learning based classifier, KELM. Our proposed approach is able to minimize the average testing error up to 2.76 on first dataset, and up to 0.79 on the second one, demonstrating its effectiveness after experimental confirmation. A comparative analysis of the approach with other existing state-of-the-art methods is also presented in this research and the classification performance confirm the advantages and superiority of our novel approach called RES-KELM algorithm.
1 Introduction
A worldwide pandemic was brought on by Covid19 (SARS-CoV-2), which originated in Wuhan, China. Although the PCR test is the main diagnostic technique, non-contact methods are always preferred. Covid19 has a terrible impact on the world economy, business, and public health. The COVID-19 pandemic exhibited all the symptoms of a crisis, on a larger scale, both in terms of how severe the changes in people’s behavior were and in terms of their geographic reach [1]. The ability to identify COVID-19 patients early, for example by the evaluation of chest X-ray (ChXR) images, is a crucial requirement in the fight against the pandemic [2]. Deep learning has been explored, utilized in a number of applications, and has achieved impressive results in various real-world applications like face recognition, map prediction, etc. [3,4,5,6]. Deep learning, being an effective method of machine learning, automates medical image analysis and may contribute to examine a huge number of ChXR images that can have a considerable impact on the Covid19 screening process. There has been a rise in publicly available ChXR images from both healthy as well as people infected with Covid19 since March 2020 allowing researchers to analyze medical images and recognize patterns which may lead to the disease being automatically diagnosed.
1.1 Deep learning
A technical definition of deep learning is the use of neural networks with multiple layers between the input and output layers. The term deep in deep learning refers to stacking multiple layers, and the word learning refers to parameter optimization [7]. Fundamentally, deep learning is a machine learning approach that prepares a computer to filter inputs that may be in the form of images, text, or sound through layers with the aim of learning how to predict and categorize information. Deep learning learns the features from high-dimensional raw data (image pixel tensors or text embedding matrices) automatically, i.e., the features need not be extracted manually.
1.2 Residual network (ResNet)
Deep convolutional networks have recently shown significant advances in image generation, classification, and other domains. The difficulty of training deep networks has been simplified with the introduction of ResNet, which are composed of residual blocks. The residual learning module enables training with hundreds or even thousands of layers while maintaining great performance. To prevent classification accuracy saturation brought on by several convolution layers, the fundamental idea behind residual learning is to retain some of the original input data during convolution neural network (CNN) training. The skip connection, which combines previous layer outputs with stacked layer outputs, is the core element of residual blocks. By incorporating skip connections, we allow the network to skip training for the layers that are irrelevant and do not contribute value to overall accuracy. Skip connections make networks dynamic, so that they can tune the number of layers appropriately throughout the training process [8]. The residual block represented by Figure 1 illustrates the skip connection. The ResNet trains on F(x), whereas other deep learning models train on the output. In simpler terms, ResNet tries to make F(x) = 0 so that output = x. Without the skip connection, input x gets multiplied by the weights of the layer followed by adding a bias term, then comes the activation function, F and we get the output as F(w*x + b) = F(x). But the skip connection causes the output to differ and we get F(x) + x.

Residual block.
1.3 Extreme learning machine (ELM)
ELMs, proposed by G. Huang in 2004, are feedforward neural networks and are based on the idea of inverse matrix approximation. In an ELM, weights and biases are randomly assigned [9], unlike other iterative algorithms, and do not need to be learned iteratively making it faster with better generalization performance as compared to networks trained using the backpropagation approach. It is due to this randomness that ELMs have been shown to have universal approximation theorem powers with relatively small nodes in the hidden layer. ELM was introduced to minimize the training error and the computational cost [10], but because of its high space and time complexity and memory-residency, the traditional ELM was not able to train big data quickly and efficiently and it also raised the possibility of local minima issue and over-fitting [11,12]. The output function of ELM is defined as follows:
where the pth hidden neuron and input node are interconnected by a weight vector pu
p
that was randomly assigned. Bias s
p
is the learning parameter of hidden layer neurons,
where B is the matrix corresponding to the hidden layer’s output and G is the output vector for n count of training samples. The input matrix P can be presented in matrix form as follows:
The size of P is v × r, where r is the dimension of input data.
Equation (2) is deemed to be a linear system and the solution to it is as follows:
where
A positive number is added to the diagonal of
where o(k) is the feature mapping, which is known to the user in ELM network, and L is the regularization coefficient.
The output weight matrix of ELM is determined as follows:
1.4 Kernel extreme learning machine (KELM)
The architecture of KELM [10] is shown below in Figure 2, which is an extension of ELM. In 2010, it was suggested by Huang et al. that kernel matrix with ELM can be utilized to overcome these problems of local minima and overfitting which were associated with traditional ELM. There are several kernel functions which can be used in the kernel-based ELM, for instance, polynomial kernel, sigmoidal kernel, Laplacian kernel, wavelet kernel, and radial basis function (RBF) kernel. KELM significantly decreases computing cost, while effectively improving the generalization performance and stability caused by the stochastic behavior of the hidden layer output matrix. In addition, in KELM, the parameter optimization of kernel function is facilitated significantly, and is set to preserve more structure information of sample data. Using KELM, classification performance can be improved by optimizing the values of two variables that are the regularization coefficient and kernel parameter [12,15].
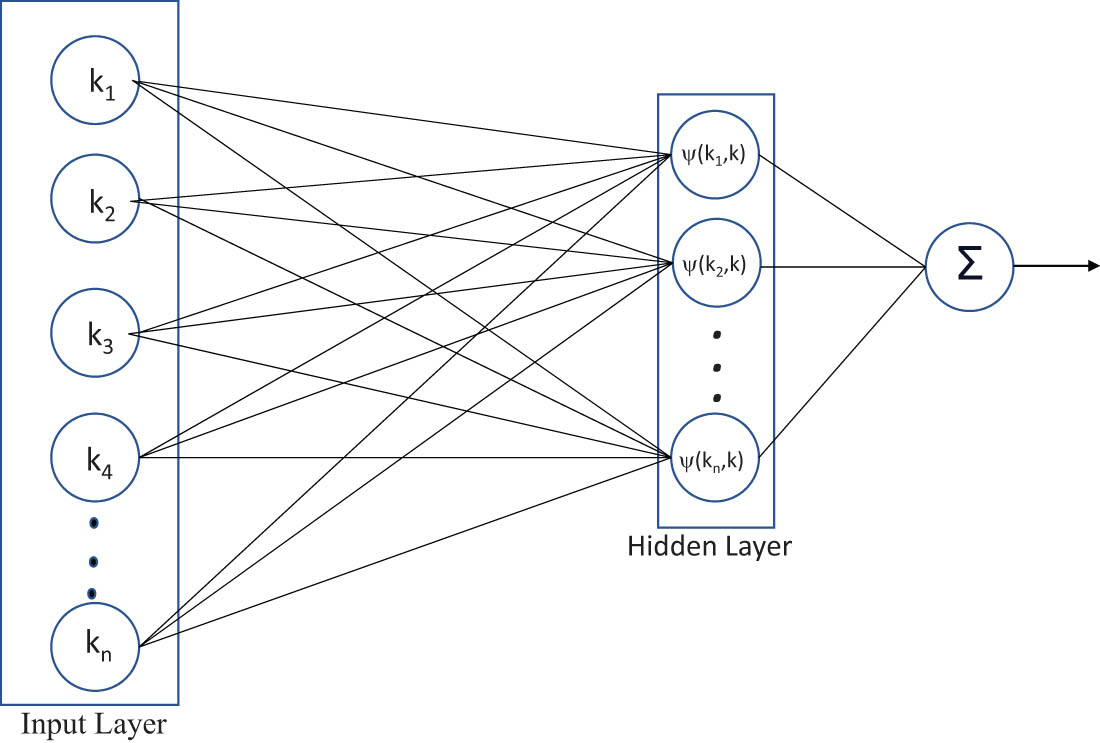
KELM architecture.
2 Literature review
Based on feature fusion of dense convolution network and VGG Network, Kong and Cheng proposed a technique for the detection of Covid19. They added a machine attention block and category attention block for the extraction of deep features. In order to accomplish accurate classification, they have also used residual network to segment effective image information. The average accuracy achieved was 97.3% for three category classification [16]. Using CNN, Saraiva et al. described categorization of pneumonia. They used SoftMax function which is in charge of making the probabilistic distribution of the input image into each of the categories for which the network was trained. Adaptive momentum was used for optimization and k-fold cross validation was used for evaluating the model [17]. Stephen et al. proposed a CNN model trained from scratch for classifying and detecting the presence of pneumonia from ChXR images [18]. Kermany et al. suggested a transfer learning-based framework to diagnose pneumonia using ChXR images. Inception V3 architecture was adopted in their work in which retraining was done by initializing the convolution layers with loaded pretrained weights and the final SoftMax layer was retrained for the purpose of recognizing their classes from scratch. The accuracy achieved using ChXR images was 92.8% [19]. Rajaraman et al. presented a customized VGG16 model to detect pneumonia using ChXR images. They had customized the VGG16 model by truncating the deepest convolution layer and adding up a dense layer and global average pooling. A randomized grid search is used to find and improve the value of several hyperparameters, such as momentum, learning rate, and L2-regularization in the customized VGG16 model. The overall accuracy achieved was 96.2% [20]. Sangulagi and Kumar presented a system which seeks to enhance the model integration and transfer learning by classifying ChXR images into two categories – normal and Covid19. In their work, ResNet101 and ResNet152 were utilized which had been trained using the ImageNet dataset. Their system could accurately reproduce 96.1% of the classes of ChXR images on the training dataset [21]. Lu et al. suggested to use image feature fusion to help with the diagnosis of Covid19 in lung window computed tomography. ResNet18 and ResNet50 deep networks were chosen initially in their approach for the purpose of extracting image feature information. Next they used discriminant correlation analysis to fuse the information extracted by these two networks in order to get the refined image features. Finally, they proposed to train three randomized neural networks to classify the refined fused features, which are Schmidt neural network, ELM, and random vector functional link network. The prediction of the three randomized neural networks were then combined to produce a more efficient classification performance. 97.14% was the highest accuracy achieved in their work [22]. Murugan and Goel proposed a CNN-ResNet50 based extreme learning classifier in which ResNet50 has been used for the purpose of feature extraction followed by ELM with a sigmoid function for classifying ChXR images into normal, pneumonia, and Covid19. The presented model achieved 94.07% accuracy [23]. Ji et al. used ResNet50, ResNet152, DensNet201, Xception, and Inception-ResNetV2 pretrained networks for the purpose of detecting Covid19 patients. The accuracy achieved was 96% [24]. Umair et al. utilized pertained models for feature extraction from ChXR images and created a feature map. Next the Grad-Cam technique was employed in their work which produces a class specific heat map and helps to find out the Covid19 detection transparency. This technique is implemented by using the layers and extracted features of the trained model and actually draws attention to the areas of the input image that the model concentrates on during the classification phase, indicating that the feature maps produced in the final convolution layer have the spatial information necessary to effectively capture the visual pattern. The accuracy achieved using their technique was 96.49% [25].
3 Materials and methods
3.1 Dataset
Dataset1: The originally available dataset, ChXR Images (pneumonia) [26], comprises a total of 5,856 ChXR which are organized in three main folders, namely, training, testing, and validation. Each of these three folders includes two subfolders for each image category, i.e., normal vs pneumonia. We reorganized the entire data into two sets only as normal and pneumonia and the label of folder comprising images of healthy (normal) people is set to 1 which consists of a total of 1,583 images and the label of the other folder is set to 2 which consists of a total of 4,273 pneumonia images. This dataset was randomly split into two independent datasets with 10 and 90% for training, and testing, respectively, by adding splitEachLabel function in our MATLAB code. Similar experiment was repeated eight more times for different split ratios as 20:80, 30:70, 40:60, 50:50, 60:40, 70:30, 80;20, and 90:10 and the test error were recorded for 12 iterations and then the average testing error was computed. Further, the same dataset was split sequentially and the test error was recorded for nine different ratios.
Dataset2: This Covid19 radiography dataset [27] available publicly consists of a total of 3,616 Covid19 positive case images along with 10,192 normal, 6,012 lung opacity (non-Covid lung infection), and 1,345 viral pneumonia images and corresponding lung masks. But as we are performing the binary classification in this study, we reorganized the entire data into two folders, namely, Normal (consisting of 10,192 images) whose label is set to 1 and Covid (consisting of 3,616 images) whose label is set to 2. Subsequently, splitting process for training and testing datasets has been repeated as done for dataset1. Few sample images of dataset1 and dataset2 are shown in Figures 3 and 4, respectively. These datasets were also split both randomly and sequentially into nine different split ratios.

ChXR samples from dataset1.

ChXR samples from dataset2.
3.2 The proposed methodology
3.2.1 Transfer learning
Transfer learning improves learning by applying previously learned information from similar tasks to new ones. This means the previously learned parameters are transferred to a new problem [28]. Deep learning models’ architectures are complicated and data-dependent, demanding a large amount of data to train them and therefore it is challenging to train a deep learning model from scratch. It becomes easier for transfer learning to train small datasets in order to accomplish the research objective as shown in Figure 5. For the purpose of training Covid19 datasets used in this investigation, we utilized ResNet50 which has been pretrained on ImageNet which has 1,000 object categories and approximately 14 million training images.

Transfer learning for feature extraction.
3.2.2 KELM
Since the recognition accuracy we get with ResNet50 is very low and it also takes a lot of training time, next we use KELM for classifying the ChXR images which takes very less training time as it is a one shot classification technique and also improves the recognition rate [29,30,31].
3.2.3 Proposed fusion model
After evaluating the results utilizing ResNet50 and KELM one by one, we propose our novel approach of fusion model. The architecture of the proposed fusion model is presented in Figure 6 and the block diagram of workflow is presented in Figure 7. The images of the original dataset are preprocessed to get better classification results. First, minmax function has been utilized for the normalization of images. Then, in view of the fact that the required input size varies for each CNN, we resize all the input images to 224 × 224 × 3 pixels as needed by residual network used in this investigation. We use a 50-layer pretrained residual network for our first piece of model because training a deep CNN model from scratch takes a lot of time. ResNet50 has been used for the process of feature information extraction of Covid19 ChXR images and the options set for training the network are presented in Table 1. The value of minbatchsize is set to 32. This value has been kept in order to fit the CNN and image data into GPU memory and the training time decreases significantly by setting the appropriate batch size. The activations output is organized into columns which helps in speeding up the process of binary classification that follows. The pretrained network that we employed has three fully connected layers. In our experiment, we are using the pretrained network only for extracting the features maps and not for classification because for classification, fine tuning is required. In fine tuning, weights of the network are updated iteratively using the back propagation algorithm which is a very time-consuming process. Therefore, we utilize the layers of pretrained network till the global average pooling layer only. After that, for classification purpose, the feature vector obtained is passed through KELM classifier which performs one shot classification as is based on non-iterative deterministic learning and therefore it takes less time. We have performed the experiments by splitting the datasets both randomly and sequentially. For random split, the results have been recorded for 12 iterations. For the purpose of training and assessing the model, the label of healthy case images is set to 1 and the label of Covid19 images to 2. The options selected for KELM architecture are presented in Table 2.

Overall architecture of the proposed fusion model.

Block diagram for the workflow of the proposed methodology.
Options set for network training
| Property | Option selected |
|---|---|
| Batch Size | 32 |
| Output type | Columns |
Options set in KELM classifier
| Property | Option selected |
|---|---|
| ELM type | Classification |
| Regularization coefficient | 100 |
| Kernel type | RBF |
| Kernel parameter | 1,000 |
3.2.4 Analysis of computational complexity
The abbreviations that will be used are as follows:
n: number of training samples,
r: dimensionality of input data,
v: number of hidden layer neurons, and
u: number of classes (equal to output nodes) involved in the classification task.
The ResNet model requires O(1) time for computation of feature vectors.
The ELM algorithm exploiting the random weights requires the following processing step:
Computation of hidden layer output matrix B having time complexity equal to O(nvr)
Computation of output weight matrix
The KELM algorithm requires the following processing step:
Computation of kernel matrix of KELM having time complexity equal to O(n 2 r)
Calculation of output weight matrix having time complexity equal to O(2n3 + un2)
From the above, the time complexity of ELM using random weight is as follows:
The time complexity of KELM is equal to O(2n 3 + n 2 r).
Therefore, the time complexity of RES-KELM (proposed approach) is O(1) + O(2n 3 + n 2 r) ≈ O(2n 3 + n 2 r)
4 Experimental results and analysis
The experiments performed in this study were carried out using MATLAB 2022a and the configuration of computing device on which all algorithms have been executed is intel i7, 2.4 GHz, 16GB RAM. The experimental results obtained at different split ratios using ResNet50 is presented in Tables 3 and 4 and the highest accuracy achieved was 87.28 and 82.16% on dataset1 and dataset2, respectively. The results using KELM are shown in Tables 5 and 6, and the highest accuracy achieved was 95.36 and 93.66% on dataset1 and dataset2, respectively. Finally, the results using our novel approach, RES-KELM, by splitting the dataset1 randomly and sequentially are presented in Tables 7 and 8, respectively, and the results on dataset2 by splitting it randomly and sequentially are presented in Tables 9 and 10, respectively. So, when the data were split randomly into a ratio of 90:10, i.e., 90% of total images were used for training and rest for testing, and the results were evaluated for 12 runs, we are able to reduce the average testing error up to 0.91 on dataset2. The minimum error 2.76 on dataset1 has been achieved for random 80:20 split. When the data were split sequentially into a ratio of 70:30, we are able to reduce the testing error up to 0.79 on dataset2. The minimum error 3.64 on dataset1 has been achieved for sequential 70:30 split. It is clearly evident from the results that the proposed novel fusion model, based on non-iterative deterministic learning classification, achieves the best classification accuracy. At the same time, it requires less time for training of the model.
Results using ResNet50 on dataset1
| ResNet_only: Epoch = 1, Batch size = 10 | ||
|---|---|---|
| Split ratio (training:testing) | Accuracy (%) | Test error (%) |
| 10:90 | 72.80 | 27.20 |
| 20:80 | 75.62 | 24.38 |
| 30:70 | 76.34 | 23.66 |
| 40:60 | 82.72 | 17.28 |
| 50:50 | 86.62 | 13.38 |
| 60:40 | 84.59 | 15.41 |
| 70:30 | 87.04 | 12.96 |
| 80:20 | 85.76 | 14.24 |
| 90:10 | 87.28 | 12.72 |
Results using ResNet50 on dataset2
| ResNet_only: Epoch = 1, Batch size = 10 | ||
|---|---|---|
| Split ratio (training:testing) | Accuracy (%) | Test error (%) |
| 10:90 | 73.82 | 26.18 |
| 20:80 | 79.20 | 20.80 |
| 30:70 | 76.23 | 23.77 |
| 40:60 | 79.09 | 20.91 |
| 50:50 | 81.72 | 18.28 |
| 60:40 | 80.09 | 19.91 |
| 70:30 | 82.16 | 17.84 |
| 80:20 | 81.69 | 18.31 |
| 90:10 | 81.51 | 18.49 |
Results using KELM on dataset1
| Split ratio (training:testing) | Test error (%) | Accuracy (%) |
|---|---|---|
| 10:90 | 8.24 | 91.76 |
| 20:80 | 7.59 | 92.41 |
| 30:70 | 5.78 | 94.22 |
| 40:60 | 6.01 | 93.99 |
| 50:50 | 5.82 | 94.18 |
| 60:40 | 6.06 | 93.94 |
| 70:30 | 5.63 | 94.37 |
| 80:20 | 5.14 | 94.86 |
| 90:10 | 4.64 | 95.36 |
Results using KELM on dataset2
| Split ratio (training:testing) | Test error (%) | Accuracy (%) |
|---|---|---|
| 10:90 | 14.19 | 85.81 |
| 20:80 | 14.50 | 85.5 |
| 30:70 | 13.84 | 86.16 |
| 40:60 | 12.84 | 87.16 |
| 50:50 | 8.35 | 91.65 |
| 60:40 | 7.42 | 92.58 |
| 70:30 | 6.34 | 93.66 |
| 80:20 | 6.41 | 93.59 |
| 90:10 | 6.80 | 93.2 |
Results using RES-KELM on dataset1 (random split)
| Split ratio (training:testing) | |||||||||
|---|---|---|---|---|---|---|---|---|---|
| Iteration | 10:90 | 20:80 | 30:70 | 40:60 | 50:50 | 60:40 | 70:30 | 80:20 | 90:10 |
| 1st | 4.81 | 3.84 | 3.68 | 2.81 | 3.24 | 3.50 | 2.27 | 2.55 | 3.93 |
| 2nd | 4.15 | 3.84 | 3.53 | 3.30 | 3.14 | 2.98 | 2.95 | 2.55 | 2.56 |
| 3rd | 4.76 | 3.47 | 3.53 | 3.32 | 3.00 | 2.30 | 3.24 | 2.38 | 1.19 |
| 4th | 4.70 | 3.77 | 3.53 | 3.10 | 3.17 | 3.37 | 2.78 | 2.30 | 3.41 |
| 5th | 4.40 | 4.01 | 3.46 | 3.50 | 3.31 | 3.50 | 3.07 | 2.81 | 2.39 |
| 6th | 4.11 | 4.20 | 3.41 | 3.69 | 3.72 | 3.11 | 3.13 | 3.24 | 2.39 |
| 7th | 4.21 | 3.77 | 3.78 | 3.89 | 2.97 | 3.07 | 2.95 | 2.47 | 3.07 |
| 8th | 4.17 | 3.97 | 3.26 | 3.47 | 2.93 | 2.47 | 3.07 | 2.98 | 3.07 |
| 9th | 4.59 | 4.29 | 3.31 | 3.04 | 3.27 | 2.60 | 2.95 | 3.07 | 3.76 |
| 10th | 4.40 | 3.92 | 3.78 | 3.47 | 3.41 | 2.77 | 3.41 | 2.64 | 3.58 |
| 11th | 4.57 | 3.75 | 3.14 | 3.67 | 3.04 | 3.33 | 2.67 | 3.32 | 3.24 |
| 12th | 5.08 | 3.65 | 3.70 | 3.50 | 3.41 | 3.33 | 3.13 | 2.81 | 2.39 |
| Average test error | 4.58 | 3.87 | 3.51 | 3.40 | 3.22 | 3.03 | 2.97 | 2.76 | 2.92 |
| Accuracy | 95.42 | 96.13 | 96.49 | 96.6 | 96.78 | 96.97 | 97.03 | 97.24 | 97.08 |
| SD of the test error | 0.355 | 0.22 | 0.20 | 0.30 | 0.22 | 0.40 | 0.29 | 0.33 | 0.76 |
Results using RES-KELM on dataset1 (sequential split)
| Split ratio (training:testing) | 10:90 | 20:80 | 30:70 | 40:60 | 50:50 | 60:40 | 70:30 | 80:20 | 90:10 |
|---|---|---|---|---|---|---|---|---|---|
| Test Error | 6.12 | 5.89 | 6.07 | 7.02 | 5.12 | 5.12 | 3.64 | 4.35 | 5.29 |
Results using RES-KELM on dataset2 (random split)
| Split ratio (training:testing) | |||||||||
|---|---|---|---|---|---|---|---|---|---|
| 10:90 | 20:80 | 30:70 | 40:60 | 50:50 | 60:40 | 70:30 | 80:20 | 90:10 | |
| Iteration | Test error (%) | ||||||||
| 1st | 3.50 | 2.75 | 2.06 | 1.54 | 1.40 | 1.10 | 1.30 | 0.76 | 1.30 |
| 2nd | 3.79 | 2.74 | 1.88 | 1.83 | 1.28 | 1.46 | 1.03 | 1.23 | 0.86 |
| 3rd | 3.90 | 2.28 | 2.00 | 1.37 | 1.27 | 1.26 | 1.32 | 1.15 | 1.37 |
| 4th | 3.79 | 2.51 | 1.86 | 1.79 | 1.41 | 1.08 | 1.03 | 0.79 | 0.94 |
| 5th | 3.93 | 2.66 | 1.86 | 1.81 | 1.70 | 1.12 | 1.25 | 1.01 | 1.01 |
| 6th | 3.76 | 2.15 | 1.95 | 1.77 | 1.33 | 1.30 | 1.15 | 0.83 | 1.30 |
| 7th | 3.62 | 2.23 | 1.83 | 1.67 | 1.41 | 1.17 | 1.18 | 1.23 | 0.65 |
| 8th | 3.83 | 2.23 | 1.86 | 1.99 | 1.57 | 1.15 | 1.44 | 0.76 | 0.21 |
| 9th | 3.91 | 2.57 | 1.80 | 1.59 | 1.36 | 1.28 | 1.30 | 1.01 | 0.94 |
| 10th | 3.46 | 2.46 | 1.84 | 1.90 | 1.50 | 1.53 | 1.18 | 1.23 | 0.57 |
| 11th | 3.42 | 2.57 | 2.13 | 1.62 | 1.40 | 1.33 | 1.23 | 1.19 | 0.57 |
| 12th | 3.51 | 2.46 | 1.82 | 1.70 | 1.44 | 1.10 | 1.13 | 1.23 | 1.15 |
| Average test error | 3.70 | 2.47 | 1.91 | 1.71 | 1.42 | 1.24 | 1.21 | 1.03 | 0.91 |
| Accuracy | 96.3 | 97.53 | 98.09 | 98.29 | 98.58 | 98.76 | 98.79 | 98.97 | 99.09 |
| SD of the test error | 0.18 | 0.20 | 0.10 | 0.16 | 0.12 | 0.14 | 0.12 | 0.20 | 0.35 |
Results using RES-KELM on dataset2 (sequential split)
| Split ratio (training:testing) | 10:90 | 20:80 | 30:70 | 40:60 | 50:50 | 60:40 | 70:30 | 80:20 | 90:10 |
|---|---|---|---|---|---|---|---|---|---|
| Test error | 6.41 | 6.58 | 6.32 | 5.80 | 3.11 | 1.95 | 1.42 | 1.23 | 0.79 |
4.1 Comparison of results using ResNet50, KELM, and RES-KELM
We evaluated the recognition rate using ResNet50, KELM, and RES-KELM at nine different split ratios. It can clearly be seen that among all the three approaches used, RES-KELM stands out in terms of training time and accuracy. The accuracy comparison using all the three approaches for dataset1 and dataset2 is presented in Tables 11 and 12, respectively.
Comparison of results using ResNet50, KELM, and RES-KELM on dataset1
| Test error (%) | |||
|---|---|---|---|
| Split ratio (training:testing) | ResNet50 | KELM | RES-KELM |
| 10:90 | 26.18 | 8.24 | 4.58 |
| 20:80 | 20.80 | 7.59 | 3.87 |
| 30:70 | 23.77 | 5.78 | 3.51 |
| 40:60 | 20.91 | 6.01 | 3.40 |
| 50:50 | 18.28 | 5.82 | 3.22 |
| 60:40 | 19.91 | 6.06 | 3.03 |
| 70:30 | 17.84 | 5.63 | 2.97 |
| 80:20 | 18.31 | 5.14 | 2.76 |
| 90:10 | 18.49 | 4.64 | 2.92 |
Comparison of results using ResNet50, KELM, and RES-KELM on dataset2
| Test error (%) | |||
|---|---|---|---|
| Split ratio (training:testing) | ResNet50 | KELM | RES-KELM |
| 10:90 | 26.18 | 14.19 | 3.70 |
| 20:80 | 20.80 | 14.50 | 2.47 |
| 30:70 | 23.77 | 13.84 | 1.91 |
| 40:60 | 20.91 | 12.84 | 1.71 |
| 50:50 | 18.28 | 8.35 | 1.42 |
| 60:40 | 19.91 | 7.42 | 1.24 |
| 70:30 | 17.84 | 6.34 | 1.21 |
| 80:20 | 18.31 | 6.41 | 1.03 |
| 90:10 | 18.49 | 6.80 | 0.91 |
4.2 Comparison with the state-of-the-art methods
We carried out a comparative analysis of our RES-KELM fusion model with other state-of-the art methods. Table 13 presents the comprehensive information. Our novel approach turned out to be the best among the listed state-of-the-art methods as we are able to reduce the classification error up to 0.79.
Comparison with existing state-of-the-art methods
| Reference | Technique | Dataset | Result [accuracy, (%)] |
|---|---|---|---|
| Ji et al. [24] | ResNet152, Xception, and Inception-ResNetV2 | 4,099 ChXR images | 96 |
| Waheed et al. [32] | VGG16 | 1,124 ChXR images | 95 |
| Che Azemin et al. [33] | ResNet101 | 5,828 ChXR images | 71.9 |
| Umair et al. [25] | VGG16, ResNet-50, DenseNet121, and MobileNet, Grad-Cam technique | Dataset1: 7,232 ChXR images | 96.49 |
| Dataset2: 450 ChXR images | |||
| Mangal et al. [34] | CheXNet | 5,856 ChXR images | 90.5 |
| Murugan and Goel [23] | CNN ResNet50-based ELM classifier | 2,700 images | 94.07 |
| Wang et al. [35] | GoogleNet, Inception v3 | 1,065 CT images | 89.5 |
| RES-KELM (proposed) | ResNet50 and KELM fusion | Dataset1: 5,856 ChXR images | 97.24 |
| Dataset2: 13,808 ChXR images | 99.21 |
5 Conclusion and future scope
A novel fusion model called RES-KELM based on non-iterative deterministic learning classifier, KELM, and a pretrained network ResNet50 has been proposed for an automated classification of Covid19 using ChXR images in this work. We have demonstrated the performance of the proposed approach using two datasets, and we are able to minimize the testing error up to 2.76 on dataset1 and up to 0.79 on dataset2. We will explore larger datasets and use data augmentation to get better classification results in further studies. In summary, it can be said that the results reported in this study using the proposed novel fusion approach based on non-iterative deterministic learning classifier is the best performing technique, which achieves the best classification accuracy. At the same time, it requires less time for training of the model. We merely plan to investigate potential, economically viable strategies to combat this disease rather than creating a perfect detection mechanism. This may be helpful for prioritizing patients for further RT-PCR testing, specifically in settings where radiologists are not available, and aid in making the proposed testing technology scalable. The present investigation has been carried out for binary classification (to categorize Covid19 patients and healthy people). In the future studies, multi-class classification (Covid19, bacterial pneumonia, and viral pneumonia) will be investigated. Also, augmented datasets will be used for better performance in further studies.
-
Funding information: The authors state no financial interest to report.
-
Author contributions: Arshi Husain has conceptualised the proposed approach, executed the architecture, performed the experiments, collected and concluded the results. Virendra P. Vishwakarma has validated the concept of approach, analysed the methodology and results. Also, he audited the whole architecture of the approach and experimental results.
-
Conflict of interest: The authors have no conflicts of interest to declare. We certify that the submission is original work.
-
Ethical approval: This research does not involve clinical or animal samples and therefore does not require ethical approval.
-
Data availability statement: The data that support the findings of this study are openly available at: Dataset 1: https://www.kaggle.com/datasets/paultimothymooney/chest-xray-pneumonia. Dataset 2: https://www.kaggle.com/datasets/tawsifurrahman/covid19-radiography-database.
References
[1] Cárdenas P, Ivrissimtzis I, Obara B, Kureshi I, Theodoropoulos G. Big data for human security: The case of COVID-19. J Comput Sci. Apr. 2022;60:101574. 10.1016/j.jocs.2022.101574.Search in Google Scholar PubMed PubMed Central
[2] Akbarimajd A, Hoertel N, Hussain MA, Neshat AA, Marhamati M, Bakhtoor M, et al. Learning-to-augment incorporated noise-robust deep CNN for detection of COVID-19 in noisy X-ray images. J Comput Sci. Sep. 2022;63:101763. 10.1016/j.jocs.2022.101763.Search in Google Scholar PubMed PubMed Central
[3] Azarang A, Kehtarnavaz N. Application of deep learning models in nonlinear detail map prediction in pan sharpening. J Comput Sci. 2021;54(March):101431. 10.1016/j.jocs.2021.101431.Search in Google Scholar
[4] Sharma N, Sharma R, Jindal N. Machine learning and deep learning applications-A vision. Global Transitions Proceedings. 2021;2(1):24–8. 10.1016/j.gltp.2021.01.004Search in Google Scholar
[5] Soni N, Sharma EK, Kapoor A. Hybrid meta-heuristic algorithm based deep neural network for face recognition. J Comput Sci. 2021;51(February):101352. 10.1016/j.jocs.2021.101352.Search in Google Scholar
[6] Mücke NT, Bohté SM, Oosterlee CW. Reduced order modeling for parameterized time-dependent PDEs using spatially and memory aware deep learning. J Comput Sci. May, 2021;53:101408. 10.1016/j.jocs.2021.101408.Search in Google Scholar
[7] Shorten C, Khoshgoftaar TM, Furht B. Deep learning applications for COVID-19. J Big Data. 2021;8(1):1–54.10.1186/s40537-020-00392-9Search in Google Scholar PubMed PubMed Central
[8] He K, Zhang X, Ren S, Sun J. Deep residual learning for image recognition. Proceedings of the IEEE Conference on Computer Vision and Pattern Recognition; 2016. p. 770–8.10.1109/CVPR.2016.90Search in Google Scholar
[9] Huang G-B, Zhu Q-Y, Siew C-K. Extreme learning machine: A new learning scheme of feedforward neural networks. 2004 IEEE International Joint Conference on Neural Networks (IEEE Cat. No. 04CH37541). Vol. 2, 2004; p. 985–90.Search in Google Scholar
[10] Dalal S, Vishwakarma VP, Sisaudia V. ECG classification using kernel extreme learning machine. 2018 2nd IEEE International Conference on Power Electronics, Intelligent Control and Energy Systems (ICPEICES); 2018. p. 988–92.10.1109/ICPEICES.2018.8897416Search in Google Scholar
[11] Huang G-B, Zhu Q-Y, Siew C-K. Extreme learning machine: Theory and applications. Neurocomputing. 2006;70(1–3):489–501.10.1016/j.neucom.2005.12.126Search in Google Scholar
[12] Huang G-B, Zhou H, Ding X, Zhang R. Extreme learning machine for regression and multiclass classification. IEEE Trans Syst Man Cybern Part B (Cybernetics). 2011;42(2):513–29.10.1109/TSMCB.2011.2168604Search in Google Scholar PubMed
[13] Ben-Israel A. Generalized inverses of matrices and their applications. In: Fiacco AV, Kortanek KO, editors. Extremal methods and systems analysis. Lecture Notes in Economics and Mathematical Systems, Vol 174. Berlin: Springer, Heidelberg; 1980.10.1007/978-3-642-46414-0_8Search in Google Scholar
[14] Hoerl AE, Kennard RW. Ridge regression: Biased estimation for nonorthogonal problems. Technometrics. 1970;12(1):55–67. 10.1080/00401706.1970.10488634.Search in Google Scholar
[15] Wong CM, Vong CM, Wong PK, Cao J. Kernel-based multilayer extreme learning machines for representation learning. IEEE Trans Neural Netw Learn Syst. 2016;29(3):757–62.10.1109/TNNLS.2016.2636834Search in Google Scholar PubMed
[16] Kong L, Cheng J. Classification and detection of COVID-19 X-ray images based on DenseNet and VGG16 feature fusion. Biomed Signal Process Control. 2022;77:103772.10.1016/j.bspc.2022.103772Search in Google Scholar PubMed PubMed Central
[17] Saraiva AA, Fonseca Ferreira NM, Lopes de Sousa L, Costa NJC, Moura Sousa JV, Santos DBS, et al. Classification of images of childhood pneumonia using convolutional neural networks. Bioimaging. 2019;112–9.10.5220/0007404301120119Search in Google Scholar
[18] Stephen O, Sain M, Maduh UJ, Jeong D-U. An efficient deep learning approach to pneumonia classification in healthcare. J Healthc Eng. 2019;2019:4180949.10.1155/2019/4180949Search in Google Scholar PubMed PubMed Central
[19] Kermany DS, Goldbaum M, Cai W, Valentim C, Liang H, Baxter SL, et al. Identifying medical diagnoses and treatable diseases by image-based deep learning. Cell. 2018;172(5):1122–31.10.1016/j.cell.2018.02.010Search in Google Scholar PubMed
[20] Rajaraman S, Candemir S, Kim I, Thoma G, Antani S. Visualization and interpretation of convolutional neural network predictions in detecting pneumonia in pediatric chest radiographs. Appl Sci. 2018;8(10):1715.10.3390/app8101715Search in Google Scholar PubMed PubMed Central
[21] Sangulagi P, Kumar A. Detection of Covid-19 from Chest X-ray images. J Sci Res. 2022;66(2):172–8.10.37398/JSR.2022.660223Search in Google Scholar
[22] Lu S, Wu D, Zhang Z, Wang S-H. An explainable framework for diagnosis of COVID-19 pneumonia via transfer learning and discriminant correlation analysis. ACM Trans Multimed Comput Commun Appl (TOMM). 2021;17(3s):1–16.10.1145/3449785Search in Google Scholar
[23] Murugan R, Goel T. E-DiCoNet: Extreme learning machine based classifier for diagnosis of COVID-19 using deep convolutional network. J Ambient Intell Humaniz Comput. 2021;12(9):8887–98.10.1007/s12652-020-02688-3Search in Google Scholar PubMed PubMed Central
[24] Ji D, Zhang Z, Zhao Y, Zhao Q. Research on classification of covid-19 chest X-ray image modal feature fusion based on deep learning. J Healthc Eng. 2021;2021:1–12.10.1155/2021/6799202Search in Google Scholar PubMed PubMed Central
[25] Umair M, Khan MS, Ahmed F, Baothman F, Alqahtani F, Alian M, et al. Detection of COVID-19 using transfer learning and grad-CAM visualization on indigenously collected X-ray dataset. Sensors. 2021;21(17):5813.10.3390/s21175813Search in Google Scholar PubMed PubMed Central
[26] Mooney P. Chest X-Ray Images (Pneumonia). https://www.kaggle.com/datasets/paultimothymooney/chest-xray-pneumonia.Search in Google Scholar
[27] Rahman T. COVID-19 Radiography Database. https://www.kaggle.com/datasets/tawsifurrahman/covid19-radiography-database.Search in Google Scholar
[28] Pan SJ, Yang Q. A survey on transfer learning. IEEE Trans Knowl Data Eng. 2009;22(10):1345–59.10.1109/TKDE.2009.191Search in Google Scholar
[29] Zhang L, Zhang D, Tian F. SVM and ELM: Who wins? Object recognition with deep convolutional features from ImageNet. Proceedings of ELM-2015. Vol. 1. Springer; 2016. p. 249–63.10.1007/978-3-319-28397-5_20Search in Google Scholar
[30] Vishwakarma VP, Dalal S. A novel approach for compensation of light variation effects with KELM classification for efficient face recognition. Advances in VLSI, Communication, and Signal Processing. Berlin: Springer; 2020. p. 1003–12.10.1007/978-981-32-9775-3_89Search in Google Scholar
[31] Dalal S, Vishwakarma VP. A novel approach of face recognition using optimized adaptive illumination–normalization and KELM. Arab J Sci Eng. 2020;45(12):9977–96.10.1007/s13369-020-04566-8Search in Google Scholar
[32] Waheed A, Goyal M, Gupta D, Khanna A, Al-Turjman F, Pinheiro PR. CovidGAN: Data augmentation using auxiliary classifier GAN for improved covid-19 detection. IEEE Access. 2020;8:91916–23.10.1109/ACCESS.2020.2994762Search in Google Scholar PubMed PubMed Central
[33] Che Azemin MZ, Hassan R, Mohd Tamrin MI, Md Ali MA. COVID-19 deep learning prediction model using publicly available radiologist-adjudicated chest X-ray images as training data: preliminary findings. Int J Biomed Imaging. 2020;2020:8828855.10.1155/2020/8828855Search in Google Scholar PubMed PubMed Central
[34] Mangal A, Kalia S, Rajgopal H, Rangarajan K, Namboodiri V, Banerjee S, et al. CovidAID: COVID-19 detection using chest X-ray. arXiv preprint arXiv:2004.09803; 2020.Search in Google Scholar
[35] Wang S, Kang B, Ma J, Zeng X, Xiao M, Guo J, et al. A deep learning algorithm using CT images to screen for Corona Virus Disease (COVID-19). Eur Radiol. 2021;31(8):6096–104.10.1007/s00330-021-07715-1Search in Google Scholar PubMed PubMed Central
© 2023 the author(s), published by De Gruyter
This work is licensed under the Creative Commons Attribution 4.0 International License.
Articles in the same Issue
- Research Articles
- Salp swarm and gray wolf optimizer for improving the efficiency of power supply network in radial distribution systems
- Deep learning in distributed denial-of-service attacks detection method for Internet of Things networks
- On numerical characterizations of the topological reduction of incomplete information systems based on evidence theory
- A novel deep learning-based brain tumor detection using the Bagging ensemble with K-nearest neighbor
- Detecting biased user-product ratings for online products using opinion mining
- Evaluation and analysis of teaching quality of university teachers using machine learning algorithms
- Efficient mutual authentication using Kerberos for resource constraint smart meter in advanced metering infrastructure
- Recognition of English speech – using a deep learning algorithm
- A new method for writer identification based on historical documents
- Intelligent gloves: An IT intervention for deaf-mute people
- Reinforcement learning with Gaussian process regression using variational free energy
- Anti-leakage method of network sensitive information data based on homomorphic encryption
- An intelligent algorithm for fast machine translation of long English sentences
- A lattice-transformer-graph deep learning model for Chinese named entity recognition
- Robot indoor navigation point cloud map generation algorithm based on visual sensing
- Towards a better similarity algorithm for host-based intrusion detection system
- A multiorder feature tracking and explanation strategy for explainable deep learning
- Application study of ant colony algorithm for network data transmission path scheduling optimization
- Data analysis with performance and privacy enhanced classification
- Motion vector steganography algorithm of sports training video integrating with artificial bee colony algorithm and human-centered AI for web applications
- Multi-sensor remote sensing image alignment based on fast algorithms
- Replay attack detection based on deformable convolutional neural network and temporal-frequency attention model
- Validation of machine learning ridge regression models using Monte Carlo, bootstrap, and variations in cross-validation
- Computer technology of multisensor data fusion based on FWA–BP network
- Application of adaptive improved DE algorithm based on multi-angle search rotation crossover strategy in multi-circuit testing optimization
- HWCD: A hybrid approach for image compression using wavelet, encryption using confusion, and decryption using diffusion scheme
- Environmental landscape design and planning system based on computer vision and deep learning
- Wireless sensor node localization algorithm combined with PSO-DFP
- Development of a digital employee rating evaluation system (DERES) based on machine learning algorithms and 360-degree method
- A BiLSTM-attention-based point-of-interest recommendation algorithm
- Development and research of deep neural network fusion computer vision technology
- Face recognition of remote monitoring under the Ipv6 protocol technology of Internet of Things architecture
- Research on the center extraction algorithm of structured light fringe based on an improved gray gravity center method
- Anomaly detection for maritime navigation based on probability density function of error of reconstruction
- A novel hybrid CNN-LSTM approach for assessing StackOverflow post quality
- Integrating k-means clustering algorithm for the symbiotic relationship of aesthetic community spatial science
- Improved kernel density peaks clustering for plant image segmentation applications
- Biomedical event extraction using pre-trained SciBERT
- Sentiment analysis method of consumer comment text based on BERT and hierarchical attention in e-commerce big data environment
- An intelligent decision methodology for triangular Pythagorean fuzzy MADM and applications to college English teaching quality evaluation
- Ensemble of explainable artificial intelligence predictions through discriminate regions: A model to identify COVID-19 from chest X-ray images
- Image feature extraction algorithm based on visual information
- Optimizing genetic prediction: Define-by-run DL approach in DNA sequencing
- Study on recognition and classification of English accents using deep learning algorithms
- Review Articles
- Dimensions of artificial intelligence techniques, blockchain, and cyber security in the Internet of medical things: Opportunities, challenges, and future directions
- A systematic literature review of undiscovered vulnerabilities and tools in smart contract technology
- Special Issue: Trustworthy Artificial Intelligence for Big Data-Driven Research Applications based on Internet of Everythings
- Deep learning for content-based image retrieval in FHE algorithms
- Improving binary crow search algorithm for feature selection
- Enhancement of K-means clustering in big data based on equilibrium optimizer algorithm
- A study on predicting crime rates through machine learning and data mining using text
- Deep learning models for multilabel ECG abnormalities classification: A comparative study using TPE optimization
- Predicting medicine demand using deep learning techniques: A review
- A novel distance vector hop localization method for wireless sensor networks
- Development of an intelligent controller for sports training system based on FPGA
- Analyzing SQL payloads using logistic regression in a big data environment
- Classifying cuneiform symbols using machine learning algorithms with unigram features on a balanced dataset
- Waste material classification using performance evaluation of deep learning models
- A deep neural network model for paternity testing based on 15-loci STR for Iraqi families
- AttentionPose: Attention-driven end-to-end model for precise 6D pose estimation
- The impact of innovation and digitalization on the quality of higher education: A study of selected universities in Uzbekistan
- A transfer learning approach for the classification of liver cancer
- Review of iris segmentation and recognition using deep learning to improve biometric application
- Special Issue: Intelligent Robotics for Smart Cities
- Accurate and real-time object detection in crowded indoor spaces based on the fusion of DBSCAN algorithm and improved YOLOv4-tiny network
- CMOR motion planning and accuracy control for heavy-duty robots
- Smart robots’ virus defense using data mining technology
- Broadcast speech recognition and control system based on Internet of Things sensors for smart cities
- Special Issue on International Conference on Computing Communication & Informatics 2022
- Intelligent control system for industrial robots based on multi-source data fusion
- Construction pit deformation measurement technology based on neural network algorithm
- Intelligent financial decision support system based on big data
- Design model-free adaptive PID controller based on lazy learning algorithm
- Intelligent medical IoT health monitoring system based on VR and wearable devices
- Feature extraction algorithm of anti-jamming cyclic frequency of electronic communication signal
- Intelligent auditing techniques for enterprise finance
- Improvement of predictive control algorithm based on fuzzy fractional order PID
- Multilevel thresholding image segmentation algorithm based on Mumford–Shah model
- Special Issue: Current IoT Trends, Issues, and Future Potential Using AI & Machine Learning Techniques
- Automatic adaptive weighted fusion of features-based approach for plant disease identification
- A multi-crop disease identification approach based on residual attention learning
- Aspect-based sentiment analysis on multi-domain reviews through word embedding
- RES-KELM fusion model based on non-iterative deterministic learning classifier for classification of Covid19 chest X-ray images
- A review of small object and movement detection based loss function and optimized technique